ephraim clark, [email protected] constructing and testing the “world market portfolio”...
TRANSCRIPT

Ephraim CLARK, www.countrymetrics.com [email protected] CLARK, www.countrymetrics.com [email protected]
CONSTRUCTING AND TESTING THE “WORLD
MARKET PORTFOLIO” FOR DOLLAR BASED
INVESTORSEphraim ClarkEphraim Clark
Kostas KassimatisKostas Kassimatis

Ephraim CLARK, www.countrymetrics.com [email protected] CLARK, www.countrymetrics.com [email protected]
SUMMARY 1
The market portfolio is prominent in theoretical The market portfolio is prominent in theoretical and practical asset pricingand practical asset pricing
The true market portfolio cannot be observed The true market portfolio cannot be observed directlydirectly
WE ARGUE: It can be constructed from macro-WE ARGUE: It can be constructed from macro-economic cash flow dataeconomic cash flow data
INTUITION: “market portfolio is the value of the INTUITION: “market portfolio is the value of the economyeconomy

Ephraim CLARK, www.countrymetrics.com [email protected] CLARK, www.countrymetrics.com [email protected]
SUMMARY 2
We construct this proxy that we call the “world We construct this proxy that we call the “world market portfolio” market portfolio”
We test it over the period 1974-2003We test it over the period 1974-2003 IMPORTANT: this portfolio includes all assets IMPORTANT: this portfolio includes all assets
including human capitalincluding human capital IMPORTANT: this portfolio differs from other IMPORTANT: this portfolio differs from other
proxy portfolios in that it is not a simple proxy portfolios in that it is not a simple summation of prices of individual assets and thus summation of prices of individual assets and thus the tests do not suffer from the tautology problem. the tests do not suffer from the tautology problem.

Ephraim CLARK, www.countrymetrics.com [email protected] CLARK, www.countrymetrics.com [email protected]
SUMMARY 4
The portfolio is efficient with respect to a broad The portfolio is efficient with respect to a broad asset universe that includes international money asset universe that includes international money markets, medium and long term government markets, medium and long term government bonds, stock market indices, commodities and real bonds, stock market indices, commodities and real estate. estate.
It has a statistically significant correlation across It has a statistically significant correlation across all the asset classes.all the asset classes.
It is a powerful forecasting tool for constructing It is a powerful forecasting tool for constructing portfolios that outperform other popular portfolio portfolios that outperform other popular portfolio proxies and benchmarks.proxies and benchmarks.

Ephraim CLARK, www.countrymetrics.com [email protected] CLARK, www.countrymetrics.com [email protected]
Ephraim CLARK, www.countrymetrics.com [email protected] CLARK, www.countrymetrics.com [email protected]
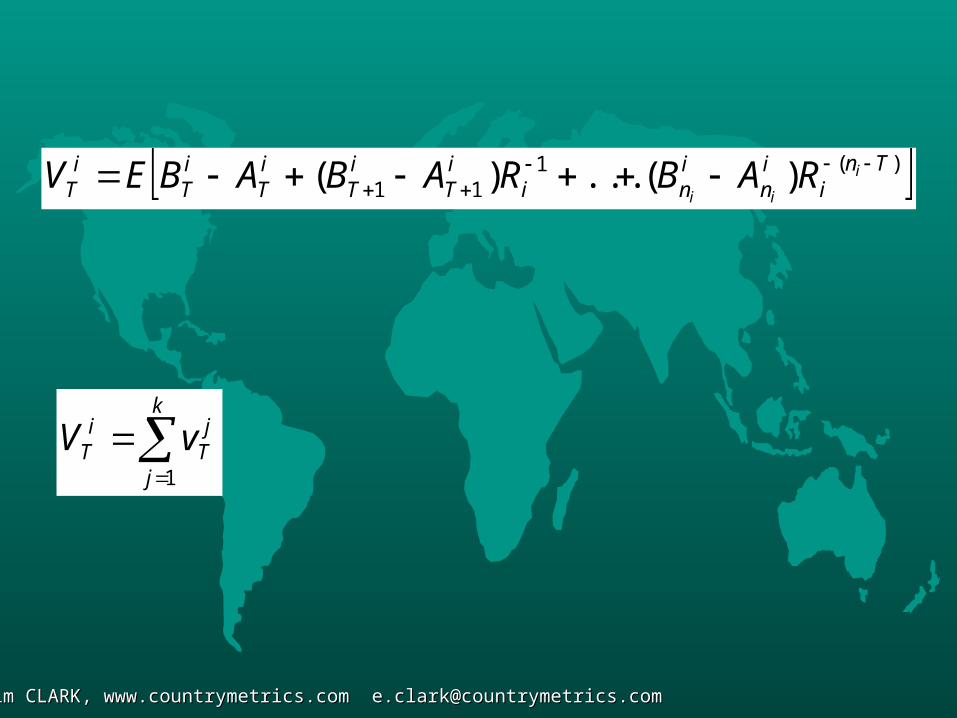
)(111 )(...)( Tn
iin
ini
iT
iT
iT
iT
iT
i
iiRABRABABEV
k
j
jT
iT vV
1

Ephraim CLARK, www.countrymetrics.com [email protected] CLARK, www.countrymetrics.com [email protected]
k
j
jt
it bB
1
k
j
jt
it aA
1
)(111 )(...)( Tn
jjn
jni
jT
jT
jT
jT
jT
j
jjRabRababEv

Ephraim CLARK, www.countrymetrics.com [email protected] CLARK, www.countrymetrics.com [email protected]
Ctttt MCXB
Ctttt MCMA
)(111 )(...)( tn
nnTTTTT RABRABABEV
)(111 **)*(...**)*(*** tn
nnTTTTT RABRABABEV
ttt BSB *
ttt ASA *

Ephraim CLARK, www.countrymetrics.com [email protected] CLARK, www.countrymetrics.com [email protected]
TTT SVV
1*
m
i
iT
MT VV
1

Ephraim CLARK, www.countrymetrics.com [email protected] CLARK, www.countrymetrics.com [email protected]
The Model
ttttttt CrVVVCMX )( 1

Ephraim CLARK, www.countrymetrics.com [email protected] CLARK, www.countrymetrics.com [email protected]
DATA
Relevant quarterly macroeconomic and Relevant quarterly macroeconomic and exchange rate data for 90 countries from exchange rate data for 90 countries from Datastream over the period 1974-2003 and Datastream over the period 1974-2003 and applied the procedures outlined above. applied the procedures outlined above.
Ephraim CLARK, www.countrymetrics.com [email protected] CLARK, www.countrymetrics.com [email protected]
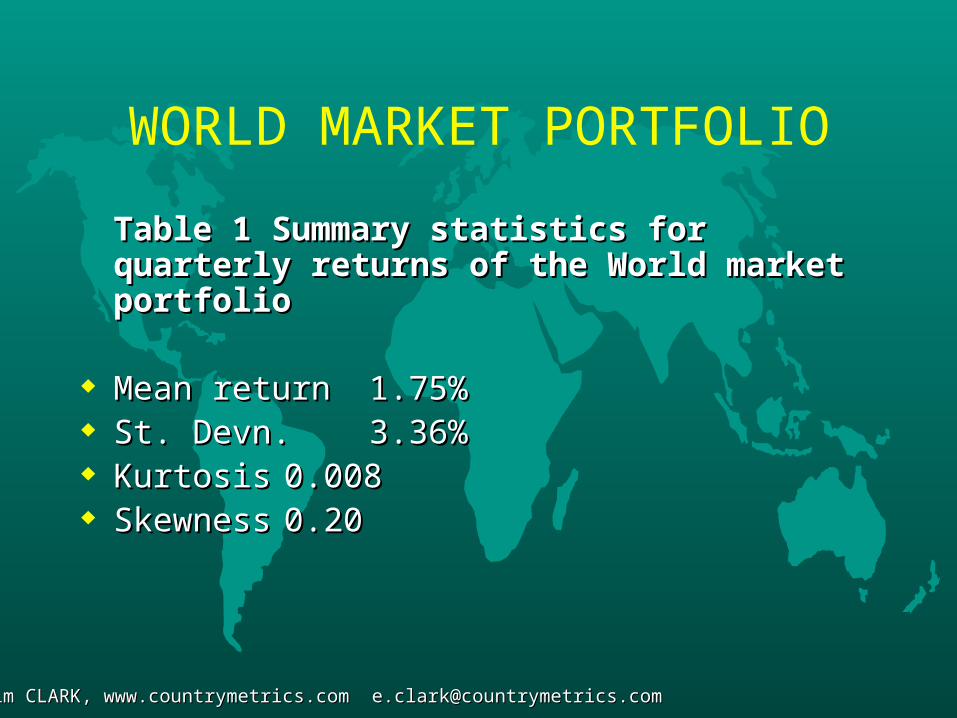
WORLD MARKET PORTFOLIO
Table 1 Summary statistics for quarterly returns of Table 1 Summary statistics for quarterly returns of the World market portfolio the World market portfolio
Mean returnMean return 1.75%1.75% St. Devn.St. Devn. 3.36%3.36% KurtosisKurtosis 0.0080.008 SkewnessSkewness 0.200.20
Ephraim CLARK, www.countrymetrics.com [email protected] CLARK, www.countrymetrics.com [email protected]
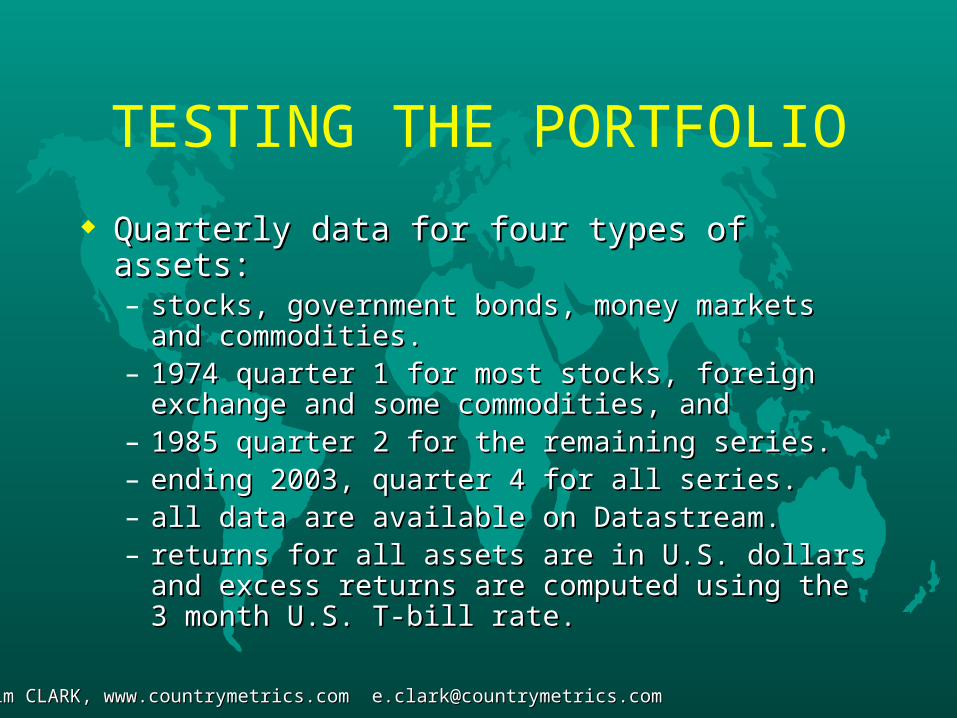
TESTING THE PORTFOLIO
Quarterly data for four types of assets: Quarterly data for four types of assets: – stocks, government bonds, money markets and stocks, government bonds, money markets and
commodities.commodities.– 1974 quarter 1 for most stocks, foreign exchange and 1974 quarter 1 for most stocks, foreign exchange and
some commodities, andsome commodities, and– 1985 quarter 2 for the remaining series. 1985 quarter 2 for the remaining series. – ending 2003, quarter 4 for all series. ending 2003, quarter 4 for all series. – all data are available on Datastream. all data are available on Datastream. – returns for all assets are in U.S. dollars and excess returns for all assets are in U.S. dollars and excess
returns are computed using the 3 month U.S. T-bill returns are computed using the 3 month U.S. T-bill rate. rate.

Ephraim CLARK, www.countrymetrics.com [email protected] CLARK, www.countrymetrics.com [email protected]
STOCKS
19 countries: Australia, Austria, Belgium, 19 countries: Australia, Austria, Belgium, Canada, Denmark, France, Germany, Hong Canada, Denmark, France, Germany, Hong Kong, Ireland, Italy, Japan, Netherlands, Kong, Ireland, Italy, Japan, Netherlands, Norway, Singapore, South Africa, Sweden, Norway, Singapore, South Africa, Sweden, Switzerland, U.K. and U.S. Switzerland, U.K. and U.S.

Ephraim CLARK, www.countrymetrics.com [email protected] CLARK, www.countrymetrics.com [email protected]
BONDS
20 total return series:20 total return series:– 10 year benchmark government bonds for 10 year benchmark government bonds for
Germany, Canada, France, Ireland, Japan, Germany, Canada, France, Ireland, Japan, Austria, Switzerland, U.K. and U.S.Austria, Switzerland, U.K. and U.S.
– 5 year benchmark government bond for 5 year benchmark government bond for Germany, Belgium, Canada, Denmark, France, Germany, Belgium, Canada, Denmark, France, Ireland, Japan, Austria, Sweden, Switzerland Ireland, Japan, Austria, Sweden, Switzerland and U.K., a total of 20 series.and U.K., a total of 20 series.

Ephraim CLARK, www.countrymetrics.com [email protected] CLARK, www.countrymetrics.com [email protected]
MONEY MARKET
11 series: Australia, Belgium, Canada, 11 series: Australia, Belgium, Canada, Denmark, France, Germany, Italy, Japan, Denmark, France, Germany, Italy, Japan, Netherlands, Switzerland and U.K.Netherlands, Switzerland and U.K.

Ephraim CLARK, www.countrymetrics.com [email protected] CLARK, www.countrymetrics.com [email protected]
COMMODITIES
total returns for five indices: Livestock, total returns for five indices: Livestock, Precious Metals, Energy, Industrial Metals Precious Metals, Energy, Industrial Metals and Real Estateand Real Estate– Goldman Sachs total return for first 4Goldman Sachs total return for first 4– The real estate index (NAREIT) is compiled by The real estate index (NAREIT) is compiled by
the National Association of Real Estate the National Association of Real Estate Investment Trusts (only US available)Investment Trusts (only US available)

Ephraim CLARK, www.countrymetrics.com [email protected] CLARK, www.countrymetrics.com [email protected]
EFFICIENCY TESTS
Regress excess return = a +brRegress excess return = a +br Gibbons et al (1989) multivariate test for Gibbons et al (1989) multivariate test for
the joint significance of the intercepts in the the joint significance of the intercepts in the equationequation
1974Q1-2003: 28 series1974Q1-2003: 28 series 1985Q2-2003: all 55 series 1985Q2-2003: all 55 series

Ephraim CLARK, www.countrymetrics.com [email protected] CLARK, www.countrymetrics.com [email protected]
Results on efficiency tests
1974 Q1 – 2003 Q41974 Q1 – 2003 Q4 – Stocks:Stocks: 0.734 (0.77) 0.734 (0.77)– Stocks & Comm: 0.677 (0.85)Stocks & Comm: 0.677 (0.85) – Stocks & MM & Comm:Stocks & MM & Comm: 0.809 (0.73)0.809 (0.73)

Ephraim CLARK, www.countrymetrics.com [email protected] CLARK, www.countrymetrics.com [email protected]
Results on efficiency tests
1985 Q2 – 2003 Q41985 Q2 – 2003 Q4 – StocksStocks 1.155 (0.33)1.155 (0.33)
– BondsBonds 0.750 (0.76)0.750 (0.76)
– MMMM 1.504 (0.15)1.504 (0.15)
– Stocks & MM & Comm.Stocks & MM & Comm. 1.076 (0.41)1.076 (0.41)
– Stocks & Bonds & Comm.Stocks & Bonds & Comm. 0.683 (0.88)0.683 (0.88)
– Bonds & MM & Comm.Bonds & MM & Comm. 1.273 (0.23)1.273 (0.23)
– MM & Comm.MM & Comm. 1.510 (0.12) 1.510 (0.12)
– All assetsAll assets 1.369 (0.21)1.369 (0.21)
Ephraim CLARK, www.countrymetrics.com [email protected] CLARK, www.countrymetrics.com [email protected]
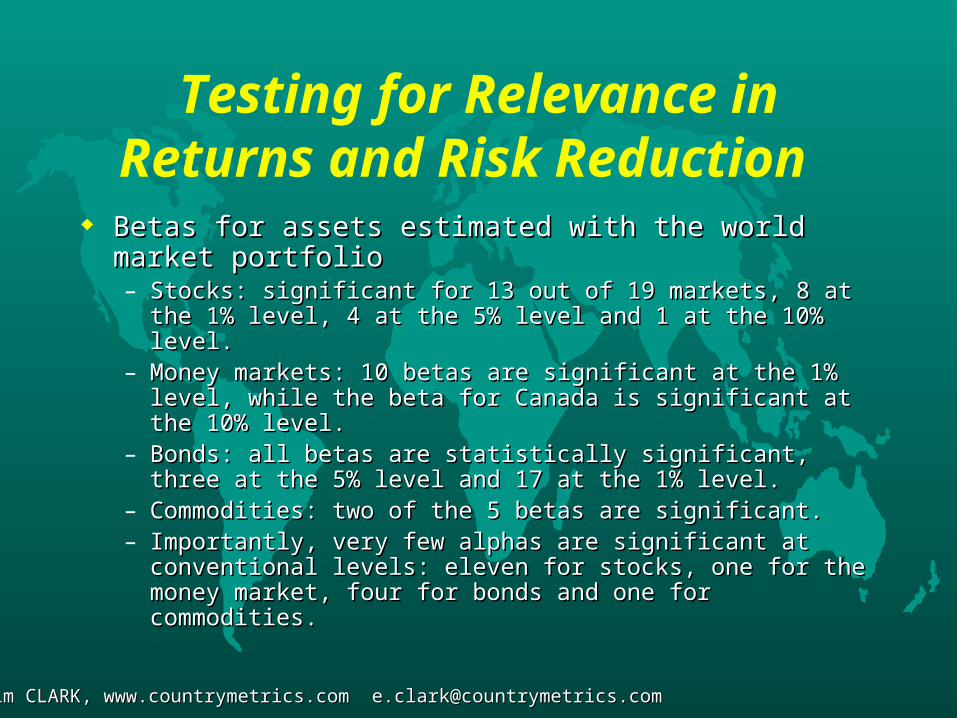
Testing for Relevance in Returns and Risk Reduction
BBetas for assets estimated with the world market portfolioetas for assets estimated with the world market portfolio– Stocks: significant for 13 out of 19 markets, Stocks: significant for 13 out of 19 markets, 88 at the 1% level, at the 1% level, 44 at at
the 5% level and 1 at the 10% level. the 5% level and 1 at the 10% level. – Money markets: 1Money markets: 10 0 betas are significant at the 1% level, while the betas are significant at the 1% level, while the
beta for Canada is significant at the 10% level. beta for Canada is significant at the 10% level. – Bonds: all betas are statistically significant, three at the 5% level Bonds: all betas are statistically significant, three at the 5% level
and 17 at the 1% level.and 17 at the 1% level.– Commodities: two of the 5 betas are significant. Commodities: two of the 5 betas are significant. – Importantly, very few alphas are significant at conventional levels: Importantly, very few alphas are significant at conventional levels:
eleven for stocks, one for the money market, four for bonds and eleven for stocks, one for the money market, four for bonds and one for commodities.one for commodities.

Ephraim CLARK, www.countrymetrics.com [email protected] CLARK, www.countrymetrics.com [email protected]
OUT OF SAMPLE TESTING
Ex ante portfolio constructionEx ante portfolio construction Two portfolios: Two portfolios:
– one for which we have prices from 1974Q1 to one for which we have prices from 1974Q1 to 2003 Q42003 Q4
– one for which we consider all assets in our one for which we consider all assets in our sample from 1985Q2 to 2003Q4. sample from 1985Q2 to 2003Q4.
– the optimization is based on betas which are the optimization is based on betas which are estimated using the previous 10 years of estimated using the previous 10 years of quarterly observations. quarterly observations.

Ephraim CLARK, www.countrymetrics.com [email protected] CLARK, www.countrymetrics.com [email protected]
Table 6. Portfolio performanceWorld Market Portfolio MSCI
Mean St. Devn. Sharpe Mean St. Devn. Sharpe1. 1984Q1 – 2003Q4 2.66 6.44 20.98 2.16 4.97 17.231. 1995Q2 – 2003Q4 2.26 8.11 15.27 1.38 5.44 6.612. 1995Q2 – 2003Q4 2.15 6.60 17.04 1.29 3.77 6.96Global MSCI 1995Q2 – 2003 Q4 2.21 9.05 13.1
Ephraim CLARK, www.countrymetrics.com [email protected] CLARK, www.countrymetrics.com [email protected]
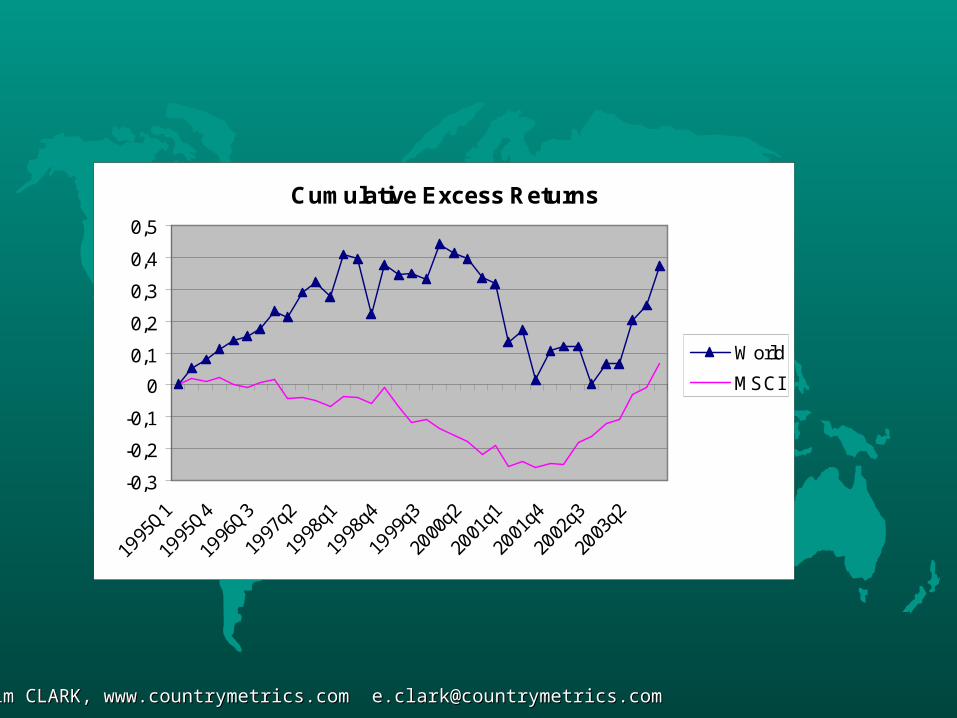
Cumulative Excess Returns
-0,3
-0,2
-0,1
0
0,1
0,2
0,3
0,4
0,5
1995
Q1
1995
Q4
1996
Q3
1997
q2
1998
q1
1998
q4
1999
q3
2000
q2
2001
q1
2001
q4
2002
q3
2003
q2
World
MSCI

Ephraim CLARK, www.countrymetrics.com [email protected] CLARK, www.countrymetrics.com [email protected]
Cumulative Return 1995-2003
Optimizing with the world market portfolio Optimizing with the world market portfolio gives a cumulative excess return of 37% for gives a cumulative excess return of 37% for the whole period, about 3.56% per annum.the whole period, about 3.56% per annum.
Optimizing with the MSCI gives a Optimizing with the MSCI gives a cumulative excess return of 6.7%, about cumulative excess return of 6.7%, about 0.72% per annum. 0.72% per annum.
Ephraim CLARK, www.countrymetrics.com [email protected] CLARK, www.countrymetrics.com [email protected]
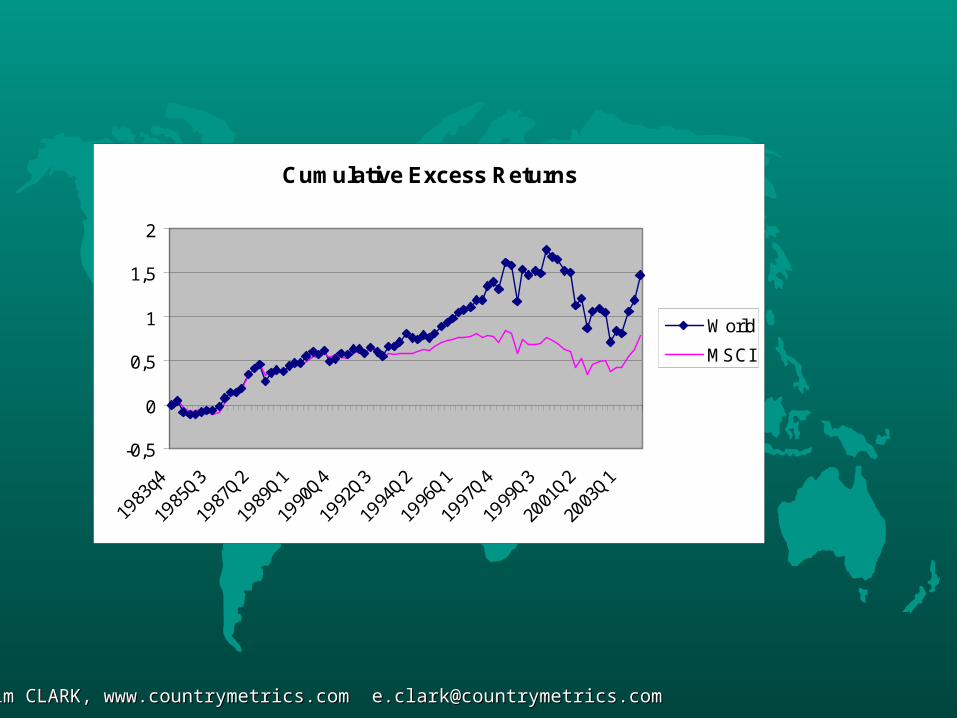
Cumulative Excess Returns
-0,5
0
0,5
1
1,5
2
1983
q4
1985
Q3
1987
Q2
1989
Q1
1990
Q4
1992
Q3
1994
Q2
1996
Q1
1997
Q4
1999
Q3
2001
Q2
2003
Q1
World
MSCI

Ephraim CLARK, www.countrymetrics.com [email protected] CLARK, www.countrymetrics.com [email protected]
Rolling Cumulative Excess 5 year returns
-0,4
-0,2
0
0,2
0,4
0,6
0,8
1988Q4 1991Q1 1993Q2 1995Q3 1997Q4 2000Q1 2002Q2
World
MSCI

Ephraim CLARK, www.countrymetrics.com [email protected] CLARK, www.countrymetrics.com [email protected]
Portfolio Proxy Mean ReturnMean Excess
ReturnStandard Deviation
Sharpe Ratio
Stocks World 3,10% 2,08% 9,88% 0,210
MSCI 3,00% 1,98% 9,53% 0,208
S&P1200 2,92% 1,90% 9,53% 0,199
Equally Weighted 2,59% 1,57% 9,79% 0,160
Naïve 2,92% 1,89% 9,84% 0,192

Ephraim CLARK, www.countrymetrics.com [email protected] CLARK, www.countrymetrics.com [email protected]
Portfolio Proxy Mean ReturnMean Excess
ReturnStandard Deviation
Sharpe Ratio
Bonds World 1,79% 0,76% 3,43% 0,223
MSCI 1,57% 0,55% 4,50% 0,122
S&P1200 1,54% 0,52% 4,50% 0,115
Equally Weighted 1,14% 0,12% 3,82% 0,030
Naïve 1,78% 0,75% 4,81% 0,157
Ephraim CLARK, www.countrymetrics.com [email protected] CLARK, www.countrymetrics.com [email protected]
Portfolio Proxy Mean ReturnMean Excess
ReturnStandard Deviation
Sharpe Ratio
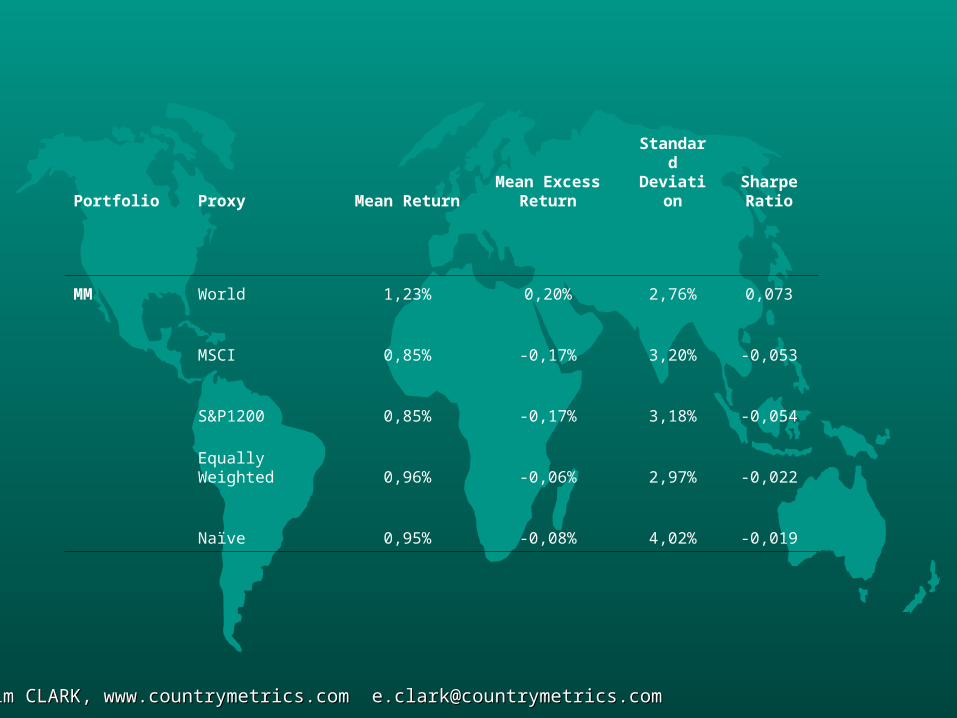
MM World 1,23% 0,20% 2,76% 0,073
MSCI 0,85% -0,17% 3,20% -0,053
S&P1200 0,85% -0,17% 3,18% -0,054
Equally Weighted 0,96% -0,06% 2,97% -0,022
Naïve 0,95% -0,08% 4,02% -0,019

Ephraim CLARK, www.countrymetrics.com [email protected] CLARK, www.countrymetrics.com [email protected]
Portfolio Proxy Mean ReturnMean Excess
ReturnStandard Deviation
Sharpe Ratio
Commodities World 2,08% 1,06% 5,89% 0,179
MSCI 2,01% 0,98% 5,89% 0,167
S&P1200 2,00% 0,98% 5,89% 0,166
Equally Weighted 2,12% 1,10% 5,85% 0,188
Naïve 1,85% 0,83% 5,43% 0,153

Ephraim CLARK, www.countrymetrics.com [email protected] CLARK, www.countrymetrics.com [email protected]
Summary We construct and test a portfolio more compatible with the “market portfolio” of We construct and test a portfolio more compatible with the “market portfolio” of
financial theory financial theory Motivation: a superior portfolio will be more effective for empirical testing of financial Motivation: a superior portfolio will be more effective for empirical testing of financial
data and for international investing. data and for international investing. Intuition: the “market portfolio” of financial theory represents the total value of a Intuition: the “market portfolio” of financial theory represents the total value of a
national economynational economy Rather than adding up values of individual assets to determine a proxy for the national Rather than adding up values of individual assets to determine a proxy for the national
“market portfolio”, we use the Hicks (1987) model of discounted macro-economic cash “market portfolio”, we use the Hicks (1987) model of discounted macro-economic cash flows to calculate the value of the economy directlyflows to calculate the value of the economy directly
Avoid shortcomings of the popular proxy indices currently in use that generally exclude Avoid shortcomings of the popular proxy indices currently in use that generally exclude many asset classes and are vulnerable to the tautology weaknessmany asset classes and are vulnerable to the tautology weakness
All assets are represented in the country “market portfolios” but no individual assets All assets are represented in the country “market portfolios” but no individual assets enter the portfolio directly, we also avoid the tautology weakness. enter the portfolio directly, we also avoid the tautology weakness.
Our international market portfolio proxy, which we call the world market portfolio, is Our international market portfolio proxy, which we call the world market portfolio, is calculated as the sum of the ninety national market portfolios in our sample. calculated as the sum of the ninety national market portfolios in our sample.

Ephraim CLARK, www.countrymetrics.com [email protected] CLARK, www.countrymetrics.com [email protected]
Conclusions
Tests of this portfolio for its potential empirical relevance Tests of this portfolio for its potential empirical relevance for model testing and portfolio buildingfor model testing and portfolio building
TThe portfolio is efficient with respect to a broad asset he portfolio is efficient with respect to a broad asset universe that includes international money markets, universe that includes international money markets, medium and long term government bonds, stock market medium and long term government bonds, stock market indices, commodities and real estateindices, commodities and real estate
It has a statistically significant correlation across all the It has a statistically significant correlation across all the asset classesasset classes
It is a powerful forecasting tool for constructing portfolios It is a powerful forecasting tool for constructing portfolios that outperform other popular portfolio proxies and that outperform other popular portfolio proxies and benchmarks.benchmarks.