epi info-7 manual rev-4
TRANSCRIPT

TTrraaiinniinngg MMaannuuaall
Basic Data Management Epi Info 7
(Revision-4, 2013)
Field Epidemiology Training Program Department of Public Health, MOH, Riyadh,
Kingdom of Saudi Arabia


Table of Contents
Field Epidemiology Training Program, MOH, Riyadh
Table of contents Contents Page No. Introduction to Training Course 1 Introduction of Study Project used for Training 2 What is Epi Info 3 Epi Info Tools 3
What can Epi Info™ 7 do that Epi Info™ 3.5.3 cannot? 4
System requirements for Epi Info™ 7 4
Should I upgrade from Epi Info™ 3.5.3? 4
Which download is right for me 5
How to get Epi Info Software? 6 Activity-1: Creating questionnaire in Epi Info Create-Forms program 7 Questionnaire for Food Poisoning Outbreak in a Restaurant 8 Data Sheet for creating Questionnaire 9 Model Design for Food Poisoning Outbreak Questionnaire 10 Guidelines Activity-1: Creating Epi Info Project & Questionnaire using “Create Forms” 11 Step 1: Create a new project and Data Entry Form 11 Step 2: Making Settings for the form 13 Step 3: Creating fields in the Form/questionnaire 14 A) Adding Label/Title Field 15 B) Adding Number Field 15 C) Adding Date Field 16 D) Adding Text Field 17 E) Adding Legal Values Field 18 F) Adding Yes/No Field 19 G) Adding Check Box Field 19 Step 4: Edit properties of Prompt & field 20 Step 5: Changing Field Type 20 Step 6: Moving Prompt and Field 21 Step 7: Resizing the Field 21 Step 8: Delete, Cut, Copy & Paste a Question (Prompt & Field) 22 Step 9: Undo & Redo action 23 Step 10: Create, Edit and Delete a Group of Questions 23 Step 11: Change Background of the Form 25 Step 12: Change Grid Settings 26 Step 13: Renaming the Page 27 Step 14: Add new page to the questionnaire 27 Step 15: Apply Jumps in the fields 28

Table of Contents
Field Epidemiology Training Program, MOH, Riyadh
Contents Page No. Step 16: Adjusting Tab order 30 Step 17: Preview Questionnaire 31 Activity-2: Entering data in food poisoning Outbreak using Enter Program 33 Guidelines Activity-2: Entering and Managing Data using “Enter Data” Tool 34 Step 1: Opening an existing project for Data Entry 34 Step 2: Adding data to the questionnaire 37 Step 3: Navigating through the questionnaire 38 Step 4: Delete Record 39 Step 5: Un-delete Record 39 Step 6: Finding a record for Editing 40 Activity-3: Basic Data Management of Food Poisoning Outbreak 43 Exercise 3: Basic Data Management using “Classic Analysis” Tool 44 Step 1: Opening Analysis Program of Epi Info 44 Step 2: Reading an existing project 45 Step 3: Display Variable 47 Step 4: Obtaining a line listing (For all data) 48 Step 5: Sorting the line listing 49 Step 6: Selecting a subset of records 50 Step 7: Canceling sort and select criteria 51 Activity-4: Basic Data Analysis of Food Poisoning Outbreak 52 Guidelines Activity-4: Basic Data Analysis using “Classic Analysis” Tool 54 Part I: Producing Outputs 54 Step 1: Routing output to a specific file 54 Step 2: Frequencies 55 Step 3: Means 57 Step 4: Tables 60 Step 5: Defining a new variable 62 Step 6: Assigning values to a variable using “Recode” Command 63 Step 7: Assigning values to a variable using “If” Command 65 Part II: Creating Graphs 68 Step 8: Creating Pie Diagram 68 Step 9: Creating Bar Diagram 69 Part III: Working with Analysis Syntax 71 Step 10: Saving a program file (.PGM) 71 Step 11: Opening an existing program 73 Step 12: Running the program 75 Activity-5: Basic Data Analysis of Food Poisoning Outbreak using Visual Dashboard 76 Guidelines Activity-5: Basic Data Analysis using “Visual Dashboard” Tool 78 Step 1: Opening Visual Dashboard Tool 78 Step 2: Setting data Source 78

Table of Contents
Field Epidemiology Training Program, MOH, Riyadh
Contents Page No. Step 3: Adding Analysis Gadgets 80 A: Adding Line List Gadget 80 B: Adding Frequency Gadget 82 C: Adding Gadget of Frequency with stratification 83 D: Adding Gadget of Combined Frequencies 84 E: Adding Gadget of Mean 84 F: Adding Gadget of Mean with stratification 85 G: Adding Gadget of Mean with Cross Tabulations 85 H: Adding Gadget of Tables Analysis 86 I: Adding Gadget of Tables Analysis with Stratification 87 J: Adding Chart Gadget 88 K: Adding Simple Text Box 90 L: Data Dictionary Gadget 90 Step 4: Defining New Variables 91 A: New Variable with Recoded Value 91 B: New Variable with Conditional Assignment 93 C: Creating Group Variable 95 Step5: Data Filters 96 Step 6: Exporting Analysis Gadget to Microsoft Excel 98 Step 7: Exporting Dashboard output to Microsoft Excel or Microsoft Word 98

Introduction to Training Course
Field Epidemiology Training Program, MOH, Riyadh 1
Introduction to Training Course
Epi Info is statistical software for public health professionals developed by Center for
Disease Control and Prevention (CDC) Atlanta, Gorgia USA. The main feature of Epi info is
the ease of creating questionnaire with customization of data entry process and data
analysis. Epi Info is mainly designed for handling epidemiological research data and is widely
used in outbreak investigations, developing public health surveillance systems and other
allied health projects. Another advantage for this software is its free availability and
technical support from Center for Disease Control, Atlanta USA. WHO strongly recommends
the use of Epi Info software in public health research.
Considering the wide range of usage, a short course of Epi Info is designed to provide
the participants with the basic knowledge and skills of using Epi info software for research
data management and analysis. Keeping in view the time constraint a small study project ie.,
an outbreak investigation is used in the training course. Learning and skill development
begins with designing the questionnaire in Epi Info, proceeding to data entry of the forms
and finally data analysis based on the given analysis plan.
A series of five activities are included in the training manual. Each activity is a base
for the next activity and has to be completed in an orderly manner. In addition, all the
activities are supported by step-wise illustrated guidelines to complete the various tasks.
These activities include;
Activity-1: Creating Food poisoning outbreak questionnaire.
Activity-2: Data entry and management of the Food poisoning outbreak.
Activity-3: Basic data management using Classic Analysis.
Activity-4: Basic data analysis of the outbreak dataset using Classic Analysis.
Activity-5: Basic data analysis of the outbreak dataset using Visual Dashboard.
Five days course is not sufficient to completely master the Epi Info software but I
hope that successful completion of the course will develop basic understanding and
essential skills of using Epi Info for basic data management in various job settings.
Dr. Sahibzada Azhar Mujib Coordinator Data Management Unit,
Field Epidemiology Training Program (FETP),
Riyadh, KSA.
Introduction to Training Course
Field Epidemiology Training Program, MOH, Riyadh 2
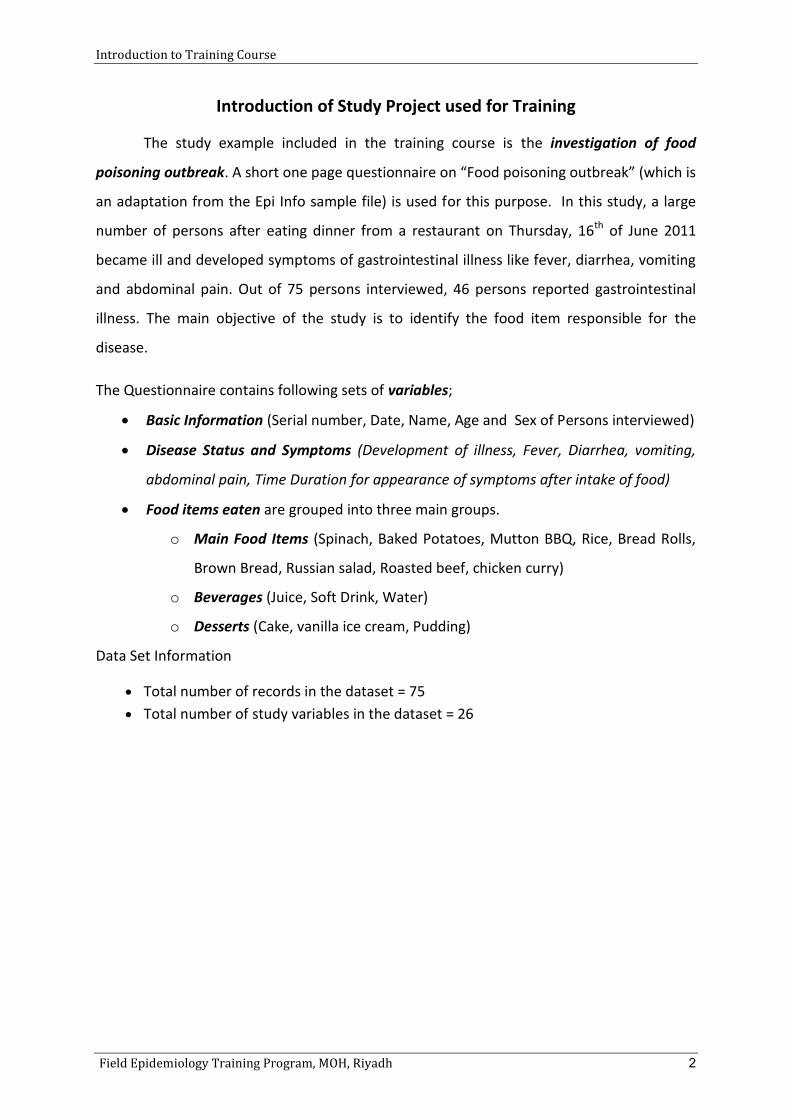
Introduction of Study Project used for Training
The study example included in the training course is the investigation of food
poisoning outbreak. A short one page questionnaire on “Food poisoning outbreak” (which is
an adaptation from the Epi Info sample file) is used for this purpose. In this study, a large
number of persons after eating dinner from a restaurant on Thursday, 16th of June 2011
became ill and developed symptoms of gastrointestinal illness like fever, diarrhea, vomiting
and abdominal pain. Out of 75 persons interviewed, 46 persons reported gastrointestinal
illness. The main objective of the study is to identify the food item responsible for the
disease.
The Questionnaire contains following sets of variables;
Basic Information (Serial number, Date, Name, Age and Sex of Persons interviewed)
Disease Status and Symptoms (Development of illness, Fever, Diarrhea, vomiting,
abdominal pain, Time Duration for appearance of symptoms after intake of food)
Food items eaten are grouped into three main groups.
o Main Food Items (Spinach, Baked Potatoes, Mutton BBQ, Rice, Bread Rolls,
Brown Bread, Russian salad, Roasted beef, chicken curry)
o Beverages (Juice, Soft Drink, Water)
o Desserts (Cake, vanilla ice cream, Pudding)
Data Set Information
Total number of records in the dataset = 75 Total number of study variables in the dataset = 26

What is Epi Info?
Field Epidemiology Training Program, MOH, Riyadh 3
What is Epi Info?
Epi Info is statistical software for handling epidemiological research data. The software is designed and developed by Center for Disease Control and Prevention Atlanta, USA. Epi Info is a key component in public health education at colleges, universities, and other schools of public health around the world. Since its initial release in 1985, Epi Info users have self-registered in more than 181 countries covering all continents including Antarctica. It has been estimated that there are more than one million users of Epi Info worldwide. More-over this software has been translated in more than 13 languages.
Epi Info 7 is the Latest release of Epi Info from CDC. This is one of the major enhancements over its previous version of Epi Info 3.5.3 with a totally new platform and many new features.
Epi Info Tools There are four main Tools available in Epi Info -7. These are briefly described below;
Create Forms: This is a form designing tool. This allows users to quickly create questionnaires and data entry forms. Different types of questions and data entry fields can be placed on one or many pages. In addition it has all facilities to customize the data entry process such as legal values, conditional skip patterns, data validation, and custom calculations and other check codes.
Enter Data: This tool is used to enter data in the form. User can manage data entry process, navigate to any record in the form, make data editing or correction if desired. It also includes options to find a particular record based on some search criteria and modify it accordingly. With Enter Data, the forms are displayed and users perform the data entry while the Check Code validates the data or performs any automatic calculations that were specified during the form designing.
Analyze Data: There are two forms of data analysis available in Epi Info 7. One is Classic Analysis tool which is compatible with the analysis module of older Epi Info version (Epi Info 3.5) and second is the brand new tool called as Visual Dashboard.
o Classic Analysis tool is used to generate and Run statistical analyses. This tool reads and analyzes data entered with the Enter Data tool or data imported from different other data formats. Epidemiologic statistics, tables, graphs, and maps are produced with simple commands such as READ, FREQ, LIST, TABLES, GRAPH etc. As any command is run, it is saved in the program editor where it can be customized, saved, shared, and used in the future analysis when there is any data revision.
o Visual Dashboard tool is a new edition in Epi Info 7 and is the replacement of Epi Report module of older Epi info 3.5. This tool helps in visualizing the data analysis in the form of analysis gadgets. There are different types of analysis gadgets available including listing, frequencies, tabulations, means, graphs and advanced statistical analysis. These gadgets can be moved around the screen and can be used to construct a well formatted report which can also be exported to HTML format or in Microsoft word.

What is Epi Info?
Field Epidemiology Training Program, MOH, Riyadh 4
Create Map tool shows data from multiple data formats by relating data fields to shape files or through point locations containing X and Y coordinates in various symbols, colors, and sizes. Choropleth and Case-Based are supported.
As mentioned earliear Epi Info 7 has many new features as compared to its previous version of Epi Info 3.5.3, some of main points of differences between latest Epi Info 7 and Epi Info 3.5.3 (previous release) are given below.
What can Epi Info™ 7 do that Epi Info™ 3.5.3 cannot?
Epi Info™ 7 provides new capabilities that are designed to make it easier for epidemiologists to rapidly create complex forms, collect large amounts of data, and quickly analyze data to gain situational awareness. Specifically, users will now be able to:
Distribute, deploy, and use Epi Info™ 7 during emergencies without ever requiring elevated privileges on a machine.
Quickly create event-specific forms by dragging and dropping templates. Create complex questionnaire templates in advance that can be distributed and
rapidly customized during emergencies. Use new "Check Code" logic on forms such as Geocode, ZScore, EpiWeek, Enable,
Disable, and Highlight. Create forms that have more than 255 fields. Store data either on a SQL Server when a network infrastructure is available or on
local MS Access-compatible files when disasters disrupt network connectivity. Collect data concurrently in a multi-user environment. Link records together to create exposure relationships. Visualize data on case-based cluster maps, social network analysis graphs, and a
powerful new Visual Dashboard. Create surveillance systems that leverage Early Aberration Reporting System (EARS)
algorithms. Perform nutritional anthropometry using up to date CDC and WHO standards. Receive updates when new features, templates, and fixes become available.
System requirements for Epi Info™ 7
Microsoft Windows XP or above. Microsoft .NET Framework 3.5 or above. Recommended - 1 GHz processor Recommended - 256 MB RAM
Should I upgrade from Epi Info™ 3.5.3?
Users do not need to choose between Epi Info™ 7 and Epi Info™ 3.5.3 because the two versions can coexist on the same machine. Epi Info™ 7 provides new capabilities that are designed to make it easier for epidemiologists to rapidly create complex forms, collect large amounts of data, and quickly analyze data to gain situational awareness. However, it is also a brand new platform that is expected to grow over time. Training videos, sample databases, and form templates are currently being developed to help users make the most of the new capabilities in Epi Info™ 7. On the other hand, Epi Info™ 3.5.3 is currently being

What is Epi Info?
Field Epidemiology Training Program, MOH, Riyadh 5
downloaded worldwide and is already providing value to public health today. If Epi Info™ 3.5.3 is currently meeting your needs then we encourage you to continue using it. Epi Info™ 3.5.3 and Epi Info™ 6.04d will continue to be available for download and CDC is committed to continue providing technical support for these versions.
Which download is right for me?
Epi Info™ 7 - ZIP
Can be downloaded to most user desktops and run without requiring administrative or elevated privileges.
Can be extracted to and run from any folder that the user has read/write/execute privileges on (including thumb drives).
Assumes that the machine already has Microsoft .NET 3.5 and other prerequisites installed.
Recommended for disconnected laptops and other emergency use when IT support or infrastructure is not readily available.
Epi Info™ 7 - Setup
Traditional setup mechanism that deploys Epi Info™ 7 to the location required by IT policy.
Allows network administrators to centrally manage and push Epi Info™ 7, including updates and patches, to users using Microsoft System Center Configuration Manager.
Ensures that the machine's configuration matches the minimum requirements of the software.
Pre-compiles and registers Epi Info™ 7 components on the machine which causes certain components to run faster.
Requires administrative or elevated privileges during installation. Recommended for centrally managed IT environments.
How will Epi Info™ 7 be updated?
Epi Info™ 7 is a brand new platform that will grow over time. However, users do not have to wait for all of the features to be added to the platform. Users can begin taking advantage of the features that are available today. Epi Info™ 7 has an updating feature that is similar to Microsoft’s Windows Update. This allows the application to notify users whenever updates are available and gives users the ability to apply the updates without requiring a full reinstallation.
What are some of the upcoming features?
In Epi Info™ 7, users may notice the absence of Epi Report and the inclusion of a new module called the Visual Dashboard. In fact, the vision for the Visual Dashboard is for it to replace Epi Report as the core report designing and generating tool in Epi Info™. There are currently a few capabilities that Epi Report provides which are not yet available in the Visual Dashboard. Users should expect updates in the near future that address these missing features.

What is Epi Info?
Field Epidemiology Training Program, MOH, Riyadh 6
Users may also notice two new menu options in the Form Designer that refer to the ability to publish Epi Info™ 7 forms on the web and on mobile devices. These features are currently disabled but are expected to become available this year. More information will be provided as development of these new features completes.
How to get Epi Info Software?
This software may not be available at software shops but It can be downloaded from the web site of Epi info (www.cdc.gov/epiinfo/), which is part of the web site of Center for Disease Control and Prevention (CDC), Atlanta USA. In addition to the software download this website also contains many useful Training Resources, Help Desk and Epi Info Community Discussion Forum. The link to the web site of Epi Info is also available on the main menu screen of the Epi Info Software.
Epi Info Web site: http:// www.cdc.gov/epiinfo/

Activity 1: Creating Questionnaire in Epi Info “Create Forms” Tool
Field Epidemiology Training Program, MOH, Riyadh 7
Activity-1
Creating Questionnaire using Epi Info Create-Forms Program
Activity Objective: After completing this activity the participants will be able to design a simple questionnaire in Epi Info Create form tool and apply customizations like assigning legal values, repeat last, grouping and apply jumps in the questionnaire. Task: Create Food poisoning Outbreak Questionnaire in Epi Info Create-Forms Tool.
Resource Material Provided:
1- Questionnaire: Food Poisoning Outbreak.
2- Exercise-1: Creating a questionnaire in Epi Info.
Instructions:
Create Food Poisoning Outbreak questionnaire in Epi Info Create Form Tool based
on the provided questionnaire.
Use illustrated Exercise-1 as reference guidelines to complete the task.
It is advised to save your project file on your computer Desktop so that you can
quickly access the project files when needed.
After completing the task submit softcopy of Epi Info Project file through email on
the address "[email protected]". Before submitting, zip the files and rename
the zipped file as "Activity-1 (Your Name)" or follow the instruction of the resource person.
This activity is the base for the next activity and should be completed in the
allocated time.

Questionnaire for Food Poisoning outbreak
Field Epidemiology Training Program, MOH, Riyadh 8
Questionnaire for Food Poisoning Outbreak
(dd/mm/yy)
Serial Number: Survey Date:
Please encircle all relevant answers
Name of patient
Age of the patient (in complete years)?
Sex of the patient? Male Female
Did you become ill after intake of food from restaurant? Yes No
If yes,
a- What Symptoms did you develop?
Fever Diarrhoea Vomiting Abdominal pain
b- What was the time duration for the appearance of symptoms after intake of food (Hours)?
Which food items did you eat from the restaurant (Encircle all relevant food items)
Main Food Items Beverages
Spinach Yes No Juice Yes No
Baked potatoes Yes No Soft Drink Yes No
Mutton BBQ Yes No Water Yes No
Rice Yes No
Bread Rolls Yes No
Brown Bread Yes No Desserts
Russian Salad Yes No Cake Yes No
Roasted Beef Yes No Vanilla ice cream Yes No
Chicken Curry Yes No Pudding Yes No

Data Sheet for building Food Poisoning Outbreak Questionnaire
Field Epidemiology Training Program, MOH, Riyadh 9
Data Sheet for Creating Prompts and Fields in the Create Forms Tool of Epi Info (Food Poisoning Outbreak Questionnaire)
Question/Prompt
Field / Variable Properties
Type Size/Pattern Field/variable Name
Questionnaire for Food Poisoning Out Break Label/Title
Serial Number Number ## SerialNumber
Survey Date Date DD-MM-YYYY SurveyDate
Name Text 20 Name
Age Number ## Age
Sex* Legal Values Sex
Did you become ill? Yes/No ILL
What Symptoms did you develop? Label/Title
Fever CheckBox Fever
Diarrhea CheckBox Diarrhea
Vomiting CheckBox Vomiting
Abdominal Pain CheckBox AbdominalPain
Time Duration for the symptoms after food intake
Number ## TimeDuration
Which food items did you eat from the restaurant?
Label/Title
Spinach Yes/No Spinach
Baked potatoes Yes/No Bakedpotatoes
Mutton BBQ Yes/No MuttonBBQ
Rice Yes/No Rice
Bread Rolls Yes/No BreadRolls
Brown Bread Yes/No BrownBread
Russian Salad Yes/No RussianSalad
Roasted Beef Yes/No RoastedBeef
Chicken Curry Yes/No ChickenCurry
Juice Yes/No Juice
Soft Drink Yes/No SoftDrink
Water Yes/No Water
Cake Yes/No Cake
Vanilla Ice cream Yes/No Vanilla
Pudding Yes/No Pudding
* Create legal values for sex variable (Male and Female).
Group these items in “Beverages”
Group these items in “Desserts”
Group these items in “Symptoms”
Group these items in “Main Food Items”
Model Questionnaire Design for Food Poisoning Outbreak
Field Epidemiology Training Program, MOH, Riyadh 10
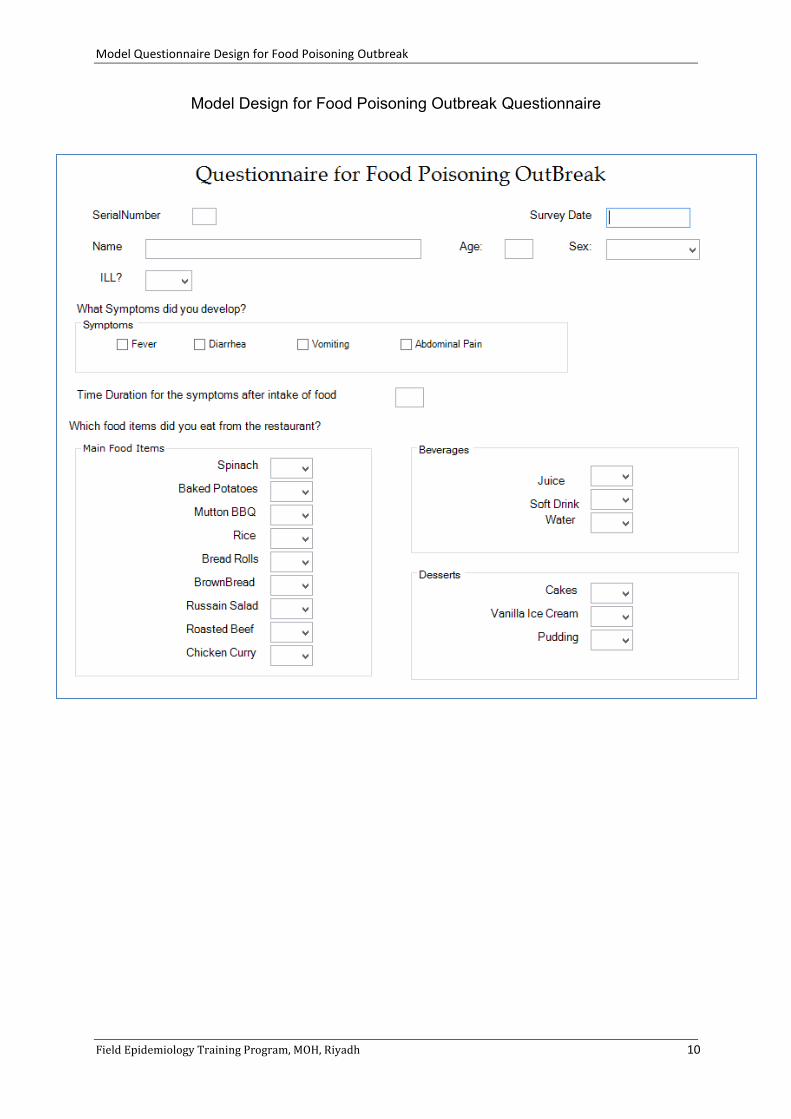
Model Design for Food Poisoning Outbreak Questionnaire
Guidelines Activity 1: Creating Epi Info Project & Questionnaire using “Create Forms” Tool
Field Epidemiology Training Program, MOH, Riyadh 11
Guideline Activity-1: Creating Epi Info Project & Questionnaire Using “Create Forms” Tool
Characteristics of the Activity Objectives: At the end of this activity the Participants will be able to:
- Create a new project - Create Form in the project - Select appropriate page setup - Add fields/variables in the form - Select appropriate field type - Set properties of fields - Save the form
- Add groups of fields - Improve the questionnaire design - Form settings like background, grid,
default font - Undo and Redo changes - Apply jump/skip using check codes - Display Data Dictionary
Level: Beginner/Intermediate Time: Approximately 1 hours Resources: Food poisoning Outbreak Questionnaire
General Considerations
Epi Info organizes data in project file which contains Forms and Data tables. A Form is the electronic data entry questionnaire through which data is saved in the data table. In other words, A Form is a way to look at the data table and Data table holds the actual data. One project can contain one or many Forms. Each Form is associated with one Data table.
It is advised to select location of the Epi Info Project on the Desktop of your computer, this will facilitate quick access of the project file when needed.
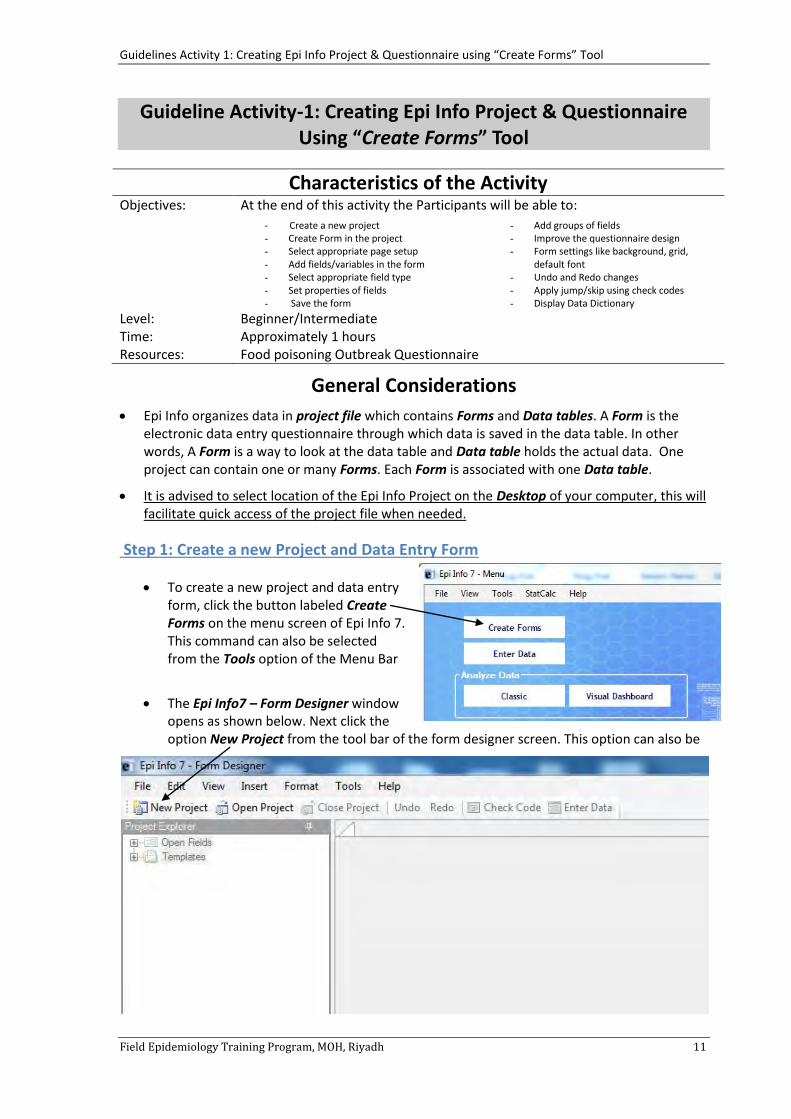
Step 1: Create a new Project and Data Entry Form
To create a new project and data entry form, click the button labeled Create Forms on the menu screen of Epi Info 7. This command can also be selected from the Tools option of the Menu Bar
The Epi Info7 – Form Designer window opens as shown below. Next click the option New Project from the tool bar of the form designer screen. This option can also be

Guidelines Activity 1: Creating Epi Info Project & Questionnaire using “Create Forms” Tool
Field Epidemiology Training Program, MOH, Riyadh 12
selected from the File option of the main menu.
New Project Dialogue box appears on the screen as shown in the illustration.
Type FoodPoisoning in the Project name Text Box. (Donot use space between the words)
Select Desktop as a location of your project file by clicking the Browse button.
Select Microsoft Access2002-2003 from the Data Repository drop down arrow. (This may be default option).
Type OutBreak in the Form Name text box.
When complete click Ok button to continue.
Project FoodPoisoning.prj is created and OutBreak\Page 1 is visible as blank Page (Canvas) of the questionnaire.
Please note that Project Name and Form Name do not accept any space in between the words. If you type (Food Poisoning) in the project name it shows an error message. It should be without the space and looks like (FoodPoisoning). The same is true for the Form Name.
Please note: When project creation is complete, a folder with the name Food Poisoning is created on desktop of the computer. This folder contains two files. 1- FoodPoisoning Microsoft Access database file which holds the data tables. 2- FoodPoisoning.prj Epi Info 7 project file which is used to access Microsoft Access file.

Guidelines Activity 1: Creating Epi Info Project & Questionnaire using “Create Forms” Tool
Field Epidemiology Training Program, MOH, Riyadh 13
Step 2: Making Settings for the form
Before creating the fields in the questionnaire, make following settings from the format option of the main menu.
Setting-1: Set default Prompt and input font for the questionnaire.
Click the format option of the main menu and select Set Default Prompt Font.
Font dialogue box is visible as shown below.
Select Font as Calibri, Font style as Regular and Size as 11 as shown in the figure. If font Calibri is not available in the system you can select “Times New Roman” with font size 11.
Do the same settings for the Set Default Input font as mentioned above. Setting-2: Page Setup.
From the format option of the main menu again select Page Setup Options.
Page setup dialogue box is visible as show in illustration.
Select the size of the page as A4 (210x297mm) from the dropdown arrow of the size text box.
Ensure that Orientation is selected as Portrait. (May be the default setting)
Select default label-field alignment is as Horizontal as shown.
When all settings are done click, Ok to continue.

Guidelines Activity 1: Creating Epi Info Project & Questionnaire using “Create Forms” Tool
Field Epidemiology Training Program, MOH, Riyadh 14
Step 3: Creating fields in the Form/questionnaire
Please note: Follow the given datasheet for creating prompts and fields in the form. There are two main methods of adding Questions (prompts and fields) in the form.
Method One:
Click (+) button before the Open Fields in the project explorer window.
A list of all available field Types in the Epi Info-7 is displayed as shown.
Now click the desired field type which is to be created and drag it to the canvas (blank area of the form) on the right side.
The Dialogue box of the selected field type appears on the screen.
Method Two:
Click the right mouse button any where on the blank area of canvas . A List of different menu options appears.
Select the first option New Field, a list of all available fields type of the Epi Info- 7 is displayed as shown.
Select the appropriate field from the List.
The Dialogue box of the selected field type appears on the screen.

Guidelines Activity 1: Creating Epi Info Project & Questionnaire using “Create Forms” Tool
Field Epidemiology Training Program, MOH, Riyadh 15
A) Adding Label/Title Field
To add Label/Title Field in the form, display list of Epi Info fields by any of the two methods described above and select Label/Title.
Label/Title dialogue box is visible as shown in illustration
Add title of the questionnaire “Questionnaire for Food Poisoning OutBreak” in the box Questions or Prompt, Type Field Name “Title1”. Select font size 18 by clicking the Font button.
The Questionnaire title is visible on the questionnaire form as shown above.
B) Adding Number Field
To add Number Field in the questionnaire. Display list of Epi Info fields as mentioned above and select Number.

Guidelines Activity 1: Creating Epi Info Project & Questionnaire using “Create Forms” Tool
Field Epidemiology Training Program, MOH, Riyadh 16
A Number dialogue box is displayed as shown.
Type Serial Number in the Question or Prompt box
Ensure SerialNumber in the Field Name box which will automatically display when you click in this field.
Select ## in the Pattern box. This can be selected from the drop down arrow or simply by typing from the keyboard.
Each # represents one digit so ## can accommodate the numbers from 0-99.
When completed, click OK to continue.
A Serial number field appears in the form as shown.
C) Adding Date Field
To add Date Field in the questionnaire. Display list of Epi Info fields as mentioned above and select Date Field.
Date Dialogue box is displayed as shown.
Type Survey Date in the Question or Prompt box.
Ensure SurveyDate in the field name box.
Select DD-MM-YYYY pattern from the drop down list
Click OK to continue

Guidelines Activity 1: Creating Epi Info Project & Questionnaire using “Create Forms” Tool
Field Epidemiology Training Program, MOH, Riyadh 17
A Survey Date field appears in the form as shown.
D) Adding Text Field
To add Text Field in the questionnaire. Display list of Epi Info fields as mentioned above.
Select Text Field from the list.
Text Dialogue box is displayed as shown.
Type Name in the Question or Prompt box.
Ensure Name in the field name box.
Type 20 in the box of Maximum number of characters.
Click OK to continue
A Name field appears in the form as shown.

Guidelines Activity 1: Creating Epi Info Project & Questionnaire using “Create Forms” Tool
Field Epidemiology Training Program, MOH, Riyadh 18
E) Adding Legal Values Field
To add Legal Values Field in the questionnaire. Display list of Epi Info fields as mentioned above.
Select Legal Values from list.
A Legal Value dialogue box is displayed as shown.
Type Sex in the Question or Prompt
Ensure Sex in the field name box.
To create Legal values click the Button of the data source box.
Setup Code/ Legal links dialogue box appears as shown.
Click Create New Button.
Add Legal Values for Sex i.e., Male and Female as shown in the illustration.
Click OK when finished
A Legal value Sex field appears in the form as shown below.

Guidelines Activity 1: Creating Epi Info Project & Questionnaire using “Create Forms” Tool
Field Epidemiology Training Program, MOH, Riyadh 19
F) Adding Yes/No Field
To add Yes/No Field in the questionnaire. Display list of Epi Info fields as mentioned above.
Select Yes/No from the list of fields.
A Yes/No dialogue box is displayed as shown.
Type Did you become ILL? in the Question or Prompt
Type ILL in the field name box. (Please note that Epi Info has its own system of generating field names which is based on the text typed as question or prompt. These field names can be changed if needed. A good practice is to make field name as simple/small as possible comprising of one or two key words of the prompt. No space is allowed in field name)
Click OK to continue.
A “Did you become ILL?” Field appears in the form as shown above.
G) Adding Check Box Field
To add CheckBox Field in the questionnaire. Display list of Epi Info fields as mentioned above.
Select CheckBox from the list of fields.
A Checkbox dialogue box is displayed as shown.
Type Fever in the box of Question or Prompt
Ensure Fever in the field name box.
Click OK to continue

Guidelines Activity 1: Creating Epi Info Project & Questionnaire using “Create Forms” Tool
Field Epidemiology Training Program, MOH, Riyadh 20
A Fever Check box field appears in the form as shown in the above illustration.
Step 4: Edit properties of Prompt & field
To edit a field, right click on the prompt of the question to edit.
A list of option is visible as shown in figure. Select the option properties.
A dialogue box corresponding with the Field type is visible. As shown below. Now you can make desired changes to prompt, field name, font etc.
• To delete the field click on the Delete option and the field iss removed from the form.
Step 5: Changing Field Type
• To change the type of an existing field, click the right mouse button on the desired field required to be changed. • A list of options appear as shown in the figure. • Select the option Change To, a list of all available field types are visible. • Next select the new field type, the new field type dialogue box is visible. • Make desired changes and click Ok to continue.

Guidelines Activity 1: Creating Epi Info Project & Questionnaire using “Create Forms” Tool
Field Epidemiology Training Program, MOH, Riyadh 21
Step 6: Moving Prompt and Field
There two ways to move the field and prompt on the form
o Moving the Prompt and field as one unit.
o Moving the field independtly of the prompt.
To move the Prompt and field as one unit do following steps.
move the mouse on to the prompt of the question to be moved.
Both the field and prompt are highlighted by showing a blue border around these and the shape of the mouse pointer also changes to four headed arrow.
Next click the left mouse button and while holding down the left mouse button move the prompt to the new location. Both the field and prompt of the question are shifted to new location on the form.
To move the Field independently of its prompt, do following steps.
Move the mouse pointer on the Field to be moved, only the field is highlighted by showing double box around it while the prompt is not highlighted. The shape of the mouse pointer also changes to four headed arrow.
Now move the field to the new location while holding down the left mouse button.
Field moves to the new location on the form independent of its prompt.
Step 7: Resizing the Field
To resize the field move the mouse pointer on the field to be resized. The field will be highlighted with double border around it with two drag points on either side of the border and mouse pointer changes to four headed arrow.
Move mouse to the drag points, it chnages to double headed arrow.
Click the left mouse button and while holding the left mouse button, move the drag points right and left to resize the field.
The name field is now re-sized as shown in the figure.

Guidelines Activity 1: Creating Epi Info Project & Questionnaire using “Create Forms” Tool
Field Epidemiology Training Program, MOH, Riyadh 22
Step 8: Delete, Cut, Copy & Paste a Question (Prompt & Field)
To delete a question, right click on the prompt or field of the question to be deleted.
A list of options is visible as shown in figure.
Select the option Delete.
The field is removed from the form.
To Copy a question, right click on the prompt or field of the question to copy.
A list of option is visible as shown in figure.
Select the option Copy.
The field is copied in the computer memory.
Next move your mouse pointer at the appropriate location on the form and click right mouse button again.
A List of menu options appears as shown in the figure.
Select Paste option. The question (Prompt & Field) is pasted at the selected place.
To cut a question, right click on the prompt or field of the question to cut.
A list of option is visible as shown in figure.
Select the option Cut.
The field is cut from the form.
Now it can be pasted at any appropriate location on the form by following the same steps as mentioned above.

Guidelines Activity 1: Creating Epi Info Project & Questionnaire using “Create Forms” Tool
Field Epidemiology Training Program, MOH, Riyadh 23
Step 9: Undo & Redo action
The Undo and Redo are the new commands in Epi Info 7. These were not available in Epi Info 3.5.3 and its previous versions.
The Undo and Redo commands can accessed from the tool bar below the main menu of the Create Form program. It is also available in Edit menu option of the menu bar.
The short cut keys for Undo and Redo are Ctrl+Z and Ctrl+Y respectively.
Step 10: Create, Edit and Delete a Group of Questions
There are many ways to create a group of questions in the form.
One simple way is to make a select box around the variables which are to be grouped by clicking the left mouse button and dragging it around the questions.
On releasing the left mouse button, a selection box appears individually around each of the variables selected as shown below.

Guidelines Activity 1: Creating Epi Info Project & Questionnaire using “Create Forms” Tool
Field Epidemiology Training Program, MOH, Riyadh 24
Next select the Group command from the Insert menu option.
Group Properties dialogue box is visible as shown below.
Type the Symptoms in the “Question or Prompt” text box and ensure that Symptoms also appear in the “Field Name” text box.
The Font properties of the Group name can be adjusted by clicking the Font button and selecting desired font properties.
Click Ok to complete the action.
Symptoms group appears as shown above.
Move and Resize the Group
Move your mouse pointer over the group, it is selected and blue colored box along with drag points appear as shown above. The shape of mouse pointer also changes to four headed arrow.
To change the position of the box, click the left mouse button and while holding down the leftmouse button drag to the new location. The group along with the variable now shifted to new location.
To Resize the box move the mouse pointer over the drag points. It changes to double headed arrow. Now drag it left and right to adjust its size. You can also adjust the height

Guidelines Activity 1: Creating Epi Info Project & Questionnaire using “Create Forms” Tool
Field Epidemiology Training Program, MOH, Riyadh 25
of the group by moving the drag points on the upper and lower border of the highlighted box.
Edit or delete the Group
To Edit a Group, move your mouse pointer over the group when it is highlighted with blue border as mentioned ealiear, click right mouse button. A list of menu options are displayed.
Select Option properties.
Group Properties dialogue box is visible again.
Now the properties of the Group like, Question or Prompt, Field Name, Font can be edited.
Selecting Delete option delete the group from the form. Please note that deleting the group will only delete the group, the grouping variable will remain on the form.
Similarly add group for Main Food Items, Beverages and Desserts as mentioned in the datasheet for the questionnaire.
Step 11: Change Background of the Form Two types of changes can be made in the from background. Background Image and
Background color. Adding Background Image
To add image in the form background, click the Format option of the Main menu and select Background.
A Background Dialogue box is visible as shown in the figure. Next select the Choose Image button and select the appropriate Image layout to display image on the form. Click Ok when complete.

Guidelines Activity 1: Creating Epi Info Project & Questionnaire using “Create Forms” Tool
Field Epidemiology Training Program, MOH, Riyadh 26
If the form consists of more than one page, image setting can be applied to all Pages of the form or only to current page. This can be done by selecting option Apply to all Pages in form or Apply to current page only from the bottom of the Background dialogue box.
If you want to clear the image from the form. Click the button Clear Image the image is removed from the form background.
Chnaging Background Color
Background color of the form can also be changed by clicking the Change Color button.
Color Dialogue box is displayed as shown.
Next select the appropriate color and click Ok.
Similar to background Image, background color can also be applied to all Pages of the form or only to current page by selecting the same options as mentioned above
To clear the background Color. Click the button labeled Clear Color and color is removed from the form background.
Step 12: Change Grid Settings To change the Grid settings, click the Format
option of the Main menu and select Grid Settings.
Grid Setting dialogue box is visible as shown.
• To remove the gridlines, unselect Show Grid option. • To remove snapping to grid click the check box of Snap to grid to unselect it.
• To change the size of the grid square, select the appropriate size from the Grid Square Size box.
• Snap prompt to grid and Snap entry field to grid can also be selected and unselected.

Guidelines Activity 1: Creating Epi Info Project & Questionnaire using “Create Forms” Tool
Field Epidemiology Training Program, MOH, Riyadh 27
Step 13: Renaming the Page
Electronic Questionnaire may consist of one or many pages. Each page can resemble a page of the paper questionnaire and can be assigned a specific name.
a. To rename the page, click the Edit
option from the menu bar and select Rename Page.
b. Set Page Name dialog box is displayed. Type the name of the page as Outbreak Investigation in the box. Click OK when done.
The page is renamed as Outbreak Investigation.
Step 14: Add new page to the questionnaire
Depending on the size of the questionnaire, more pages can be added in the Electronic Form.
To add a new page, click the Insert option from the menu bar and select the option Page and Add Page.
Set Page Name dialog box is displayed. Type the name of the second page and click Ok to continue.
A new blank Page is created.
A page can be inserted in between two pages by selecting Insert Page option.
To delete a Page, select the Delete Page option from the Edit Menu. A warning message is displayed. Select Yes button to delete the page. Deleting the Page cannot be undone.

Guidelines Activity 1: Creating Epi Info Project & Questionnaire using “Create Forms” Tool
Field Epidemiology Training Program, MOH, Riyadh 28
Step 15: Apply Jumps in the fields
Jumps are needed when certain condition is true in the questionnaire.
For Example in the given questionnaire, if Person is not ILL then cursor should skip variables for symptoms and time duration and should go to Spinach variable.
By applying jumps, data entry can be made easy, quick and entry errors can be also minimized.
In order to apply jumps in the above mentioned example do the followings steps.
a. Click the button labeled as Check Code from the tool bar.
From the panel of Choose field block for action panel, Click (+) sign before the Outbreak Investigation Page and select ILL: YesNo After
The corresponding block of code for the ILL Field is visible in the check code editor window as shown above.

Guidelines Activity 1: Creating Epi Info Project & Questionnaire using “Create Forms” Tool
Field Epidemiology Training Program, MOH, Riyadh 29
Click the command If from the add command to the Field Block.
If Condition dialogue is visible.
From the Available variable box, select the field ILL by clicking the small arrow on the right side of the box and build the expression ILL= (-) “No” in the If Condition Text Box.
Next click the Command button of Then block to display options and select Goto.
Go To Dialogue box is visible with list of all available fields of questionnaire, next select the field Spinach.
Click OK to continue.
GOTO SPINACH is displayed in
the Then block as shown in the figure.
Next click OK again to complete the jump code command.
Guidelines Activity 1: Creating Epi Info Project & Questionnaire using “Create Forms” Tool
Field Epidemiology Training Program, MOH, Riyadh 30
The jump codes are added in check code editor windows.
Click Save to save the check code and
Click Close to close the check code editor window and you are back in the Form Designer Windows.
Jump Code is successfully created. Jump code cannot be Tested during the form designing. It can be tested during the data entry process.
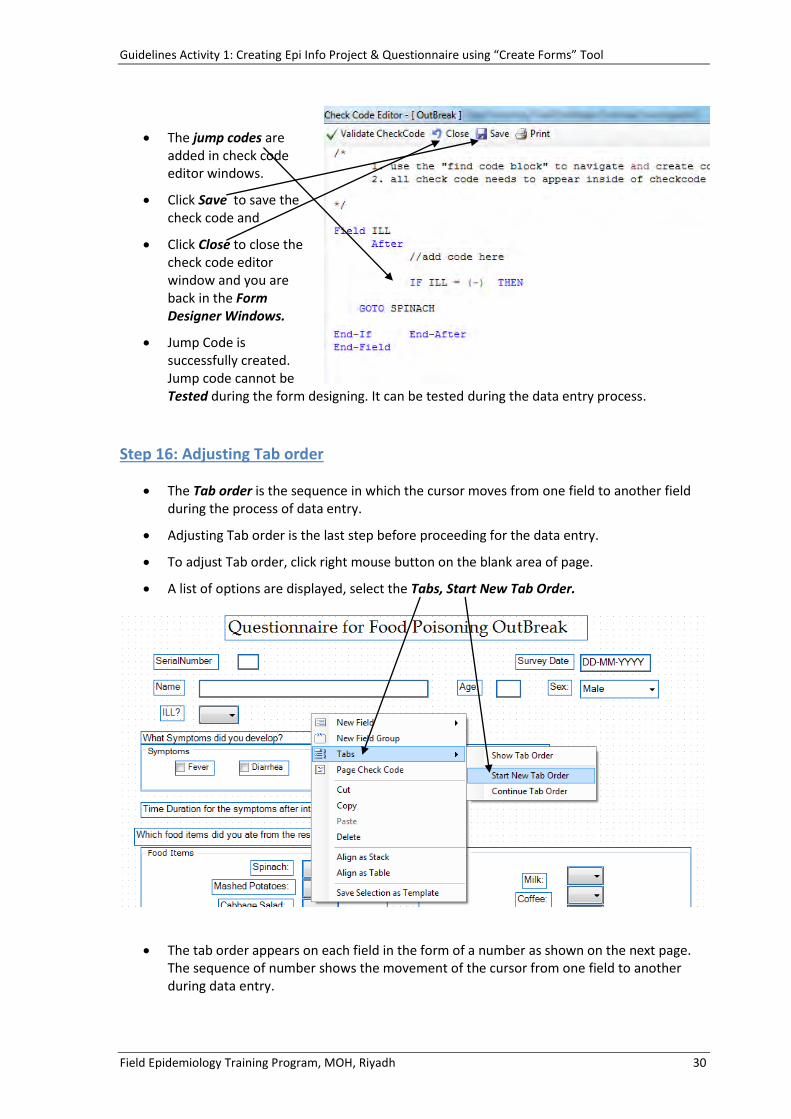
Step 16: Adjusting Tab order
The Tab order is the sequence in which the cursor moves from one field to another field during the process of data entry.
Adjusting Tab order is the last step before proceeding for the data entry.
To adjust Tab order, click right mouse button on the blank area of page.
A list of options are displayed, select the Tabs, Start New Tab Order.
The tab order appears on each field in the form of a number as shown on the next page. The sequence of number shows the movement of the cursor from one field to another during data entry.
Guidelines Activity 1: Creating Epi Info Project & Questionnaire using “Create Forms” Tool
Field Epidemiology Training Program, MOH, Riyadh 31
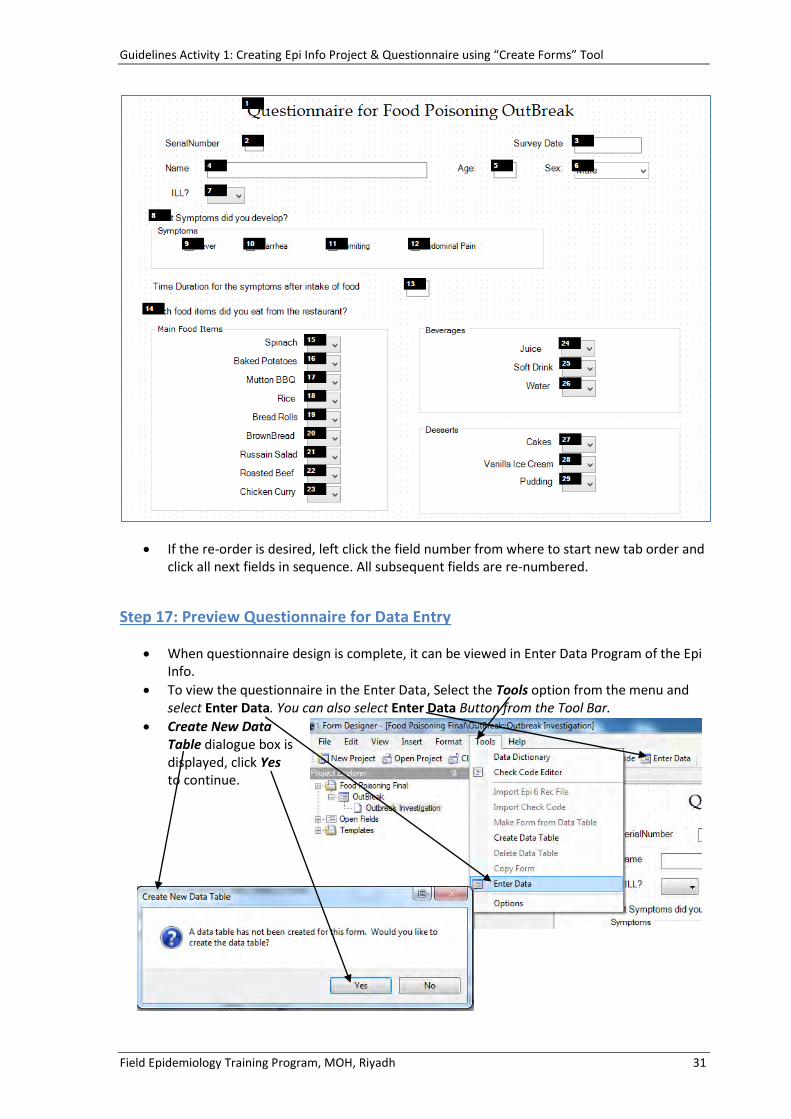
If the re-order is desired, left click the field number from where to start new tab order and click all next fields in sequence. All subsequent fields are re-numbered.
Step 17: Preview Questionnaire for Data Entry
When questionnaire design is complete, it can be viewed in Enter Data Program of the Epi Info.
To view the questionnaire in the Enter Data, Select the Tools option from the menu and select Enter Data. You can also select Enter Data Button from the Tool Bar.
Create New Data Table dialogue box is displayed, click Yes to continue.
Guidelines Activity 1: Creating Epi Info Project & Questionnaire using “Create Forms” Tool
Field Epidemiology Training Program, MOH, Riyadh 32
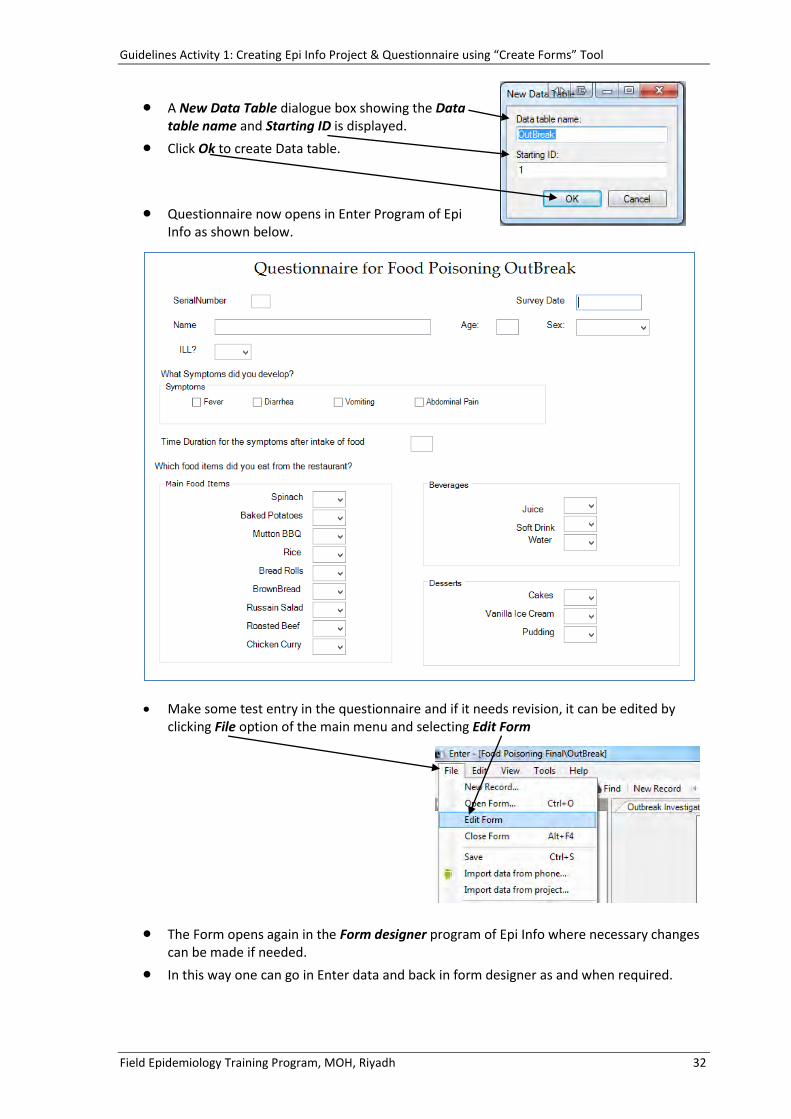
A New Data Table dialogue box showing the Data table name and Starting ID is displayed.
Click Ok to create Data table.
Questionnaire now opens in Enter Program of Epi Info as shown below.
Make some test entry in the questionnaire and if it needs revision, it can be edited by clicking File option of the main menu and selecting Edit Form
The Form opens again in the Form designer program of Epi Info where necessary changes can be made if needed.
In this way one can go in Enter data and back in form designer as and when required.

Activity-2: Enter Data in Food Poisoning Outbreak Questionnaire using “Enter Data” Tool
Field Epidemiology Training Program, MOH, Riyadh 33
Activity - 2
Entering Data in Food Poisoning Outbreak Questionnaire using Epi Info “Enter Data” Tool
Activity Objectives:
After completing this activity the participants will be able to Enter Data in Food Poisoning outbreak questionnaire using Epi Info Enter Data tool and will also be able to navigate through the records, mark record as deleted or undeleted, find records using single or multi level search criteria and also list and export data to Microsoft Excel.
Task:
Enter data in Food Poisoning Outbreak Questionnaire created in Activity-1 using Epi Info Enter Program.
Resource Material:
1- Food Poisoning Outbreak Questionnaire created in Activity-1
2- Data Forms of “Food Poisoning Outbreak”.
Instructions:
You have to enter 75 forms in the Food Poisoning Outbreak Questionnaire created in the Acitivity-1.
Use illustrated Exercise-2 as reference guidelines to complete the task.
After completing the task submit softcopy of Epi Info Project file through email on
the address "[email protected]". Before submitting, zip the files and
rename the zipped file as "Activity-1 [Your Name]" or follow the instructions of
the resource person.
This Activity will provide a base for the next activity and should be completed in the allocated time.

Guidelines Activity-2: Entering and Managing Data
Field Epidemiology Training Program, MOH, Riyadh 34
Guidelines Activity-2: Entering and Managing Data using “Enter Data” Tool
Characteristics of the Exercise Objectives: At the end of this exercise the student will be able to:
- Know the main features of Enter Program of Epi Info - Enter data in Food Poisoning / Outbreak form using Enter Data Tool - Navigate through records
- Use Find command to locate and edit records - Delete or Undelete Records - Line listing of the entered data and export to html and Excel
Level: Beginner/Intermediate Time: Approximately 45 minutes Resources: Questionnaire prepared in Activity-1 and Data Entry Forms
Step 1: Opening an Epi Info project for Data Entry For opening the Food Poisoning project for data entry, click on the Enter Data button
on the main screen of EPI Info.
You can also open the Enter Data
program from the Tools
menu and selecting Enter Data
option as shown in the illustration.

Guidelines Activity-2: Entering and Editing data
Field Epidemiology Training Program, MOH, Riyadh 35
When Enter program open, click File option on the main menu and select the option Open Form. A short cut key Ctrl+O can also be used for this purpose.
Form can also be opened by clicking the Open Form button on the tool bar of the enter program.
Open form dialogue box is displayed as shown in the illustration
Next click the Browse button to open the Select a Project dialogue box.

Guidelines Activity-2: Entering and Editing data
Field Epidemiology Training Program, MOH, Riyadh 36
Locate your folder on the desktop, select the folder FoodPoisoning and select FoodPoisoning.prj
The project name appears in the File Name text box. Click Open button to open the dialogue box labeled as Open Form and Select the OutBreak form.
Click Ok button to complete the opening of the data entry form.

Guidelines Activity-2: Entering and Editing data
Field Epidemiology Training Program, MOH, Riyadh 37
When OutBreak form is opened for the first time for data entry, A Data Table Properties dialogue box appears to create New Data Table as shown in the figure, Click Ok button to continue.
This dialogue box appears only once and does not appear on subsequent opening of the same form.
When all steps are completed successfully, Data entry form displays on the screen as shown below.
Step 2: Adding data to the Form
After opening the OutBreak form, the cursor is placed in the first field of the questionnaire ie., Serial Number field and is ready for data entry.
Pressing the Enter key from keyboard moves the cursor to the next field. You can also goto the next field by pressing the Tab key from the keyboard. Pressing Shift+Tab keys brings the cursor to the previous field of the questionnaire.
By pressing the Enter key in the last field of the questionnaire automatically saves the record in the data Table and goto the next empty record.
For entering data in Check box like fever, diarrhea etc. Pressing the space bar puts a check mark in the check box and pressing space bar again un-check it.

Guidelines Activity-2: Entering and Editing data
Field Epidemiology Training Program, MOH, Riyadh 38
You are required to enter 75 data forms which are provided to you along with this exercise.
When the data entry form opens during the second session. It goes to the first entered record. To add new record click the button New Record from the toolbar of enter program. A new blank form opens for new data entry.
Step 3: Navigating through the Records
On the menu bar of the enter program screen, there are Record Navigation buttons as shown below.
To goto a specific record number, type the desired record number in the box showing the current record number and press enter key. The specific record number is displayed.
Clicking this (|◄) button takes you to the first record of the dataset.
Clicking this (◄) button takes you to previous record. With each click it goes one record backward.
Clicking this (►) button takes you to one record forward till you reach the last record.
Clicking this (►|) button takes you to the last record of the dataset.
Goto Last Record
Goto First Record
One record Backward
One record forward
Total records available
Number of the current record
Guidelines Activity-2: Entering and Editing data
Field Epidemiology Training Program, MOH, Riyadh 39
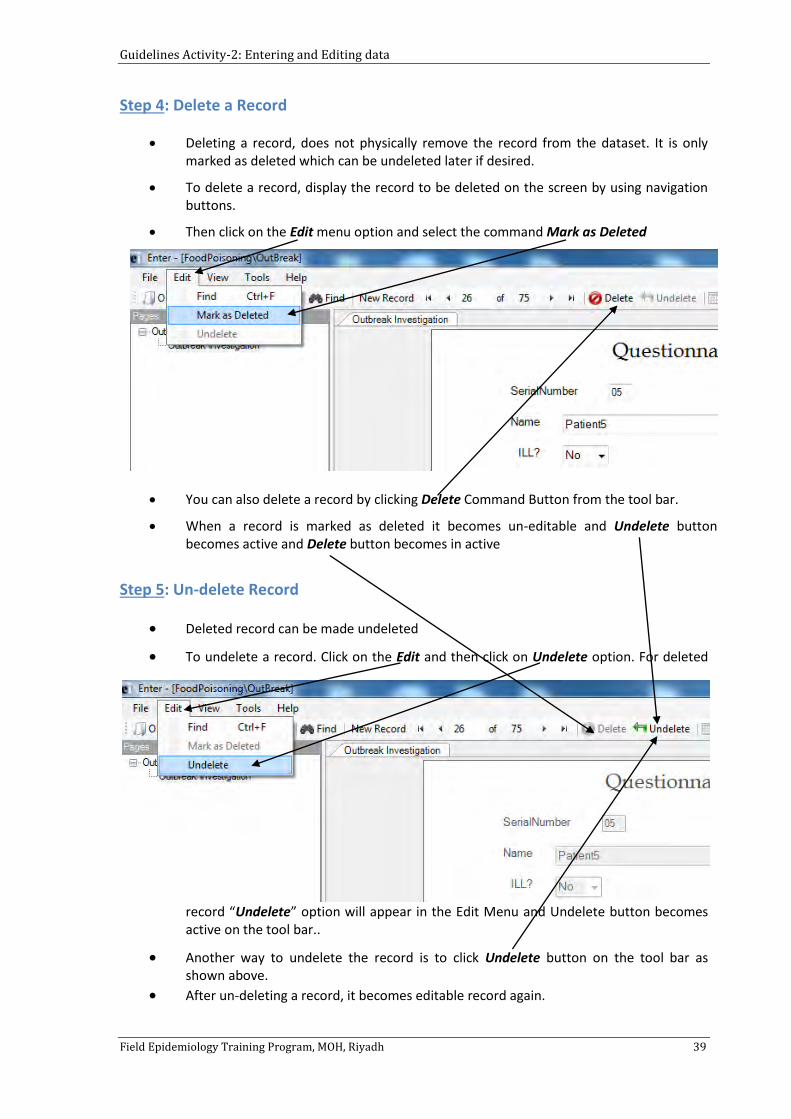
Step 4: Delete a Record
Deleting a record, does not physically remove the record from the dataset. It is only marked as deleted which can be undeleted later if desired.
To delete a record, display the record to be deleted on the screen by using navigation buttons.
Then click on the Edit menu option and select the command Mark as Deleted
You can also delete a record by clicking Delete Command Button from the tool bar.
When a record is marked as deleted it becomes un-editable and Undelete button becomes active and Delete button becomes in active
Step 5: Un-delete Record
Deleted record can be made undeleted
To undelete a record. Click on the Edit and then click on Undelete option. For deleted
record “Undelete” option will appear in the Edit Menu and Undelete button becomes active on the tool bar..
Another way to undelete the record is to click Undelete button on the tool bar as shown above.
After un-deleting a record, it becomes editable record again.
Guidelines Activity-2: Entering and Editing data
Field Epidemiology Training Program, MOH, Riyadh 40
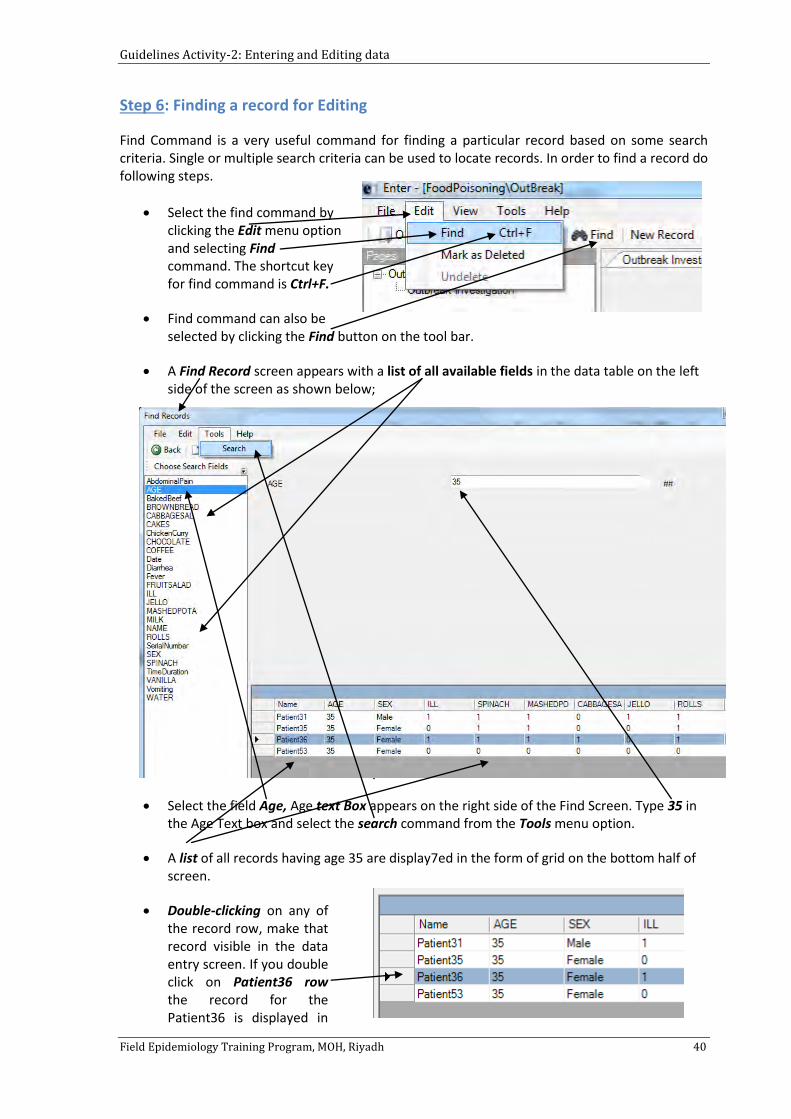
Step 6: Finding a record for Editing
Find Command is a very useful command for finding a particular record based on some search criteria. Single or multiple search criteria can be used to locate records. In order to find a record do following steps.
Select the find command by clicking the Edit menu option and selecting Find command. The shortcut key for find command is Ctrl+F.
Find command can also be selected by clicking the Find button on the tool bar.
A Find Record screen appears with a list of all available fields in the data table on the left side of the screen as shown below;
Select the field Age, Age text Box appears on the right side of the Find Screen. Type 35 in the Age Text box and select the search command from the Tools menu option.
A list of all records having age 35 are display7ed in the form of grid on the bottom half of screen.
Double-clicking on any of the record row, make that record visible in the data entry screen. If you double click on Patient36 row the record for the Patient36 is displayed in

Guidelines Activity-2: Entering and Editing data
Field Epidemiology Training Program, MOH, Riyadh 41
the data entry screen as shown below. Now data can be edited if desired.
To deselect a field, click on the selected field again. It will disappear from the right side of the screen.
To Reset the search click on the Rest button or select Reset command from the Edit menu option.
To go back to the data entry screen, Click Back button from tool bar or select Go Back command from the Edit menu option.

Guidelines Activity-2: Entering and Editing data
Field Epidemiology Training Program, MOH, Riyadh 42
To find a particular record two more fields can be selected at the same time.
Below illustration shows finding a record based on Age = 35 and Sex = Male
The grid shows only one found record.

Activity 3: Basic Data Management Using Classic Analysis Tool
Field Epidemiology Training Program, MOH, Riyadh 43
Activity - 3
Basic Data Management of Food Poisoning Outbreak using Epi Info “Classic Analysis” Tool
Activity Objectives:
After completing this activity the participants will be able to open Epi Info Project File in the Classic Analysis, Display variable of the dataset, generate line list of the data in various data listing modes, sort the data on one or more variables and select sub-set of data based on single and multiple select criteria.
Task: Complete the Tasks as listed below;
Resource Material:
Outbreak dataset developed in Activity-1 and 2
Exercise-3: Basic Data Management of Food Poisoning Outbreak using Epi Info Classic Analysis Program.
Instructions:
All line listing will be in Printable/Exportable mode only.
Following EPI Info commands may be used for this assignment; Read, Display, List, Sort, Cancel Sort, Select, Cancel Select.
Create a Microsoft Word File and copy all your line list tables in the word file. Add Title to each Line List and save this file as"Activity-3 [Your Name]". Send this file to the email address "[email protected]".
No. Tasks
1- Generate Table of variables of the food poisoning dataset.
2- Generate line listing of following variables in Printable/Exportable mode.
1A- Name, Age, Sex and ILL
1B- ILL, Fever, Diarrhea, Vomiting and abdominal Pain
1C- ILL, Spinach, Juice, Water, Cake and Pudding
3- Sort the data set on following criteria and produce line listing of following variables. (Line Listing should be in the Printable/Exportable Mode only)
2A- Sort on Age in Ascending order and generate List of Name, Age, Sex and ILL
2B- Sort on Sex Ascending and Age Descending and generate List of Name, Age, Sex and ILL
2C- Sort on ILL Ascending and Age Descending and generate List of Name, Age, Sex and ILL
4- Select subset of data based on following criteria and produce line listing for following variables. (Line Listing in the Printable/Exportable Mode only)
3A- Select Sex= “Male” and generate List of Name, Age, Sex and ILL
3B- Select ILL= “Yes” and generate List of Name, Age, Sex and ILL
3C- Select Sex= “Female” and ILL =”Yes” and generate List of Name, Age, Sex and ILL

Guidelines Activity-3: Basic Data Management Using “Classic Analysis” Tool
Field Epidemiology Training Program, MOH, Riyadh 44
Guidelines Activity-3: Basic Data Management using “Classic Analysis” Tool
Characteristics of the Exercise
Objectives: At the end of the exercise the participants will be able to: Open project file in analysis, display variable list, produce line listing, sorting data and selecting subset of record and cancel sort and select
Commands : Read, Display Variables, List, Sort, Cancel Sort, Select, Cancel Select
Level: Beginner
Time: 45 minutes
Resources: Exercise 1 & 2
Step 1: Opening Analysis Program of Epi Info
There are two ways to open Classic analysis program of Epi Info.
o From Tools Menu option selecting the Analyse Data and Classic.
o By clicking the Classic in Analyze data button at the startup screen of EPI Info
Screen picture of EPI Info Analysis
Command Explorer Window
Analysis Output Window
Program Editor Window
Commands arranged in groups

Guidelines Activity- 3: Basic Data Management using “Classic Analysis” Tool
Field Epidemiology Training Program, MOH, Riyadh 45
The Screen picture of EPI Info is divided into 3 main sections
Command Explorer: It is a vertical window, present on the left side of screen. It shows a List of all commands present in EPI Info Analysis. Commands are arranged in different groups like data, variables, Select/If, Statistics etc.
Analysis Output Window: Analysis output window is the largest window of Epi Info Analysis Program. It displays the result of the analysis in HTML format.
Program Editor: This window generates the analysis codes when any of the command from the command generator window is executed.
These windows can be resized depending upon the need.
Clicking a command in command generator window brings up a dialog box of command. Selecting various options in the dialog box and clicking OK executes the command. The command syntax codes are automatically added in the program editor window at the bottom of the screen. The analysis results appear in the Analysis Output window above the program editor.
Step 2: Reading an existing project
The first command to be used in Analysis is Read (Import) command.
Click on Read (Import) command. A Read dialogue box is visible on the screen as shown above.
Next click the Browse button in the data source text box to locate FoodPoisoning folder on the desktop and FoodPoisoning project file as shown on the next page.

Guidelines Activity- 3: Basic Data Management using “Classic Analysis” Tool
Field Epidemiology Training Program, MOH, Riyadh 46
Select the Food Poisoning.prj file by locating FoodPoisoning folder on the desktop
and click the Open button to continue.
Food Poisoning project opens and displays OutBreak form in the Data Source Explorer text box. Click OutBreak to select it.
Next click OK to load the dataset in the analysis program of Epi Info..

Guidelines Activity- 3: Basic Data Management using “Classic Analysis” Tool
Field Epidemiology Training Program, MOH, Riyadh 47
When the OutBreak form is loaded in the analysis program, the information of the
associated outbreak dataset is displayed in the analysis output window including the name of the project and name of the form, record count, date and time of opening the dataset.
Step 3: Display Variable
From the variables group, click on the command Display
When Display Dialogue Box is visible make sure that variables radio button is
selected. This is also the default settings for display command.
Click OK to continue.

Guidelines Activity- 3: Basic Data Management using “Classic Analysis” Tool
Field Epidemiology Training Program, MOH, Riyadh 48
List of all the variables present in the dataset is visible in the output window as
shown below in the illustration.
The list is arranged in tabular form including Page Number, Prompt, Field Type, Variable, Value, Format/Value, Special Value and Data Table Name. Please note that all variables are arranged in alphabetic order in ascending manner.
Step 4: Obtaining a line listing
Click the List command in the command explorer window. A List dialogue box is displayed with a asterisk (*) sign in the variables box area.
The asterisk (*) represents all variables available in the data table.
To list selected variables only, click the small arrow on the right side of the variable box. It displays list of all variables of the dataset in an alphabetic order. Select the desired variables.
Note that you can also display all variables except the selected variables by checking the radio button of the option “All Except”.
There are three Display modes to view List ie., Printable/Exportable, Grid and Allow Updates.
Grid display mode is the default selection, click Ok button to view list in Grid Mode

Guidelines Activity- 3: Basic Data Management using “Classic Analysis” Tool
Field Epidemiology Training Program, MOH, Riyadh 49
List of the dataset in Grid display mode
Printable/Exportable mode embeds the list in the Output window. Grid displays the list in a read-only spreadsheet view. Allow Updates displays the list in an editable spreadsheet view.
Step 5: Sorting the line listing To improve readability of data list,
data can be sorted on one or more variables. The Sort command orders the line listing in numeric or alphabetic order in an ascending or descending manner.
Select the Sort command from the command window.
A Sort dialogue box is visible.
In-order to sort dataset by Age do following steps.
From the Available variables list, double click on Age Variable, it will appear in the Sort Variables Box with the default sort order of Ascending. If needed, sort order can be changed by selecting Descending from above radio button.
Click OK to continue. The data is sorted on age in ascending order.
To view sorted data use List command.

Guidelines Activity- 3: Basic Data Management using “Classic Analysis” Tool
Field Epidemiology Training Program, MOH, Riyadh 50
Again sort the Age in descending order and use List command to view the sorted data.
To remove variable(s) from the sort variable box, click the variable you want to remove and click radio button of Remove from Sort as shown in above illustration.
Sorting of data can be done simultaneously for more than one variable. Sort the data for Sex descending and Age ascending and observe the results by List Command.
Step 6: Selecting a subset of records
In Epi Info Analysis, we can also select a part of total dataset. This is called subset of data. For example, if we want to analysis only ILL patients, we can select a subset of ILL patients by the following commands;
Click on the Select command available in the Select/If group.
Select Dialogue box appears
From the Available Variables box select the variable ILL by clicking the down arrow button.
Next build the expression ILL = (+) where (+) stands for “Yes”. Please note that by clicking the “Yes” button, (+) sign is displayed in the select criteria text box. Another way of doing this is to directly type the criteria in the Select Criteria text box.
Guidelines Activity- 3: Basic Data Management using “Classic Analysis” Tool
Field Epidemiology Training Program, MOH, Riyadh 51
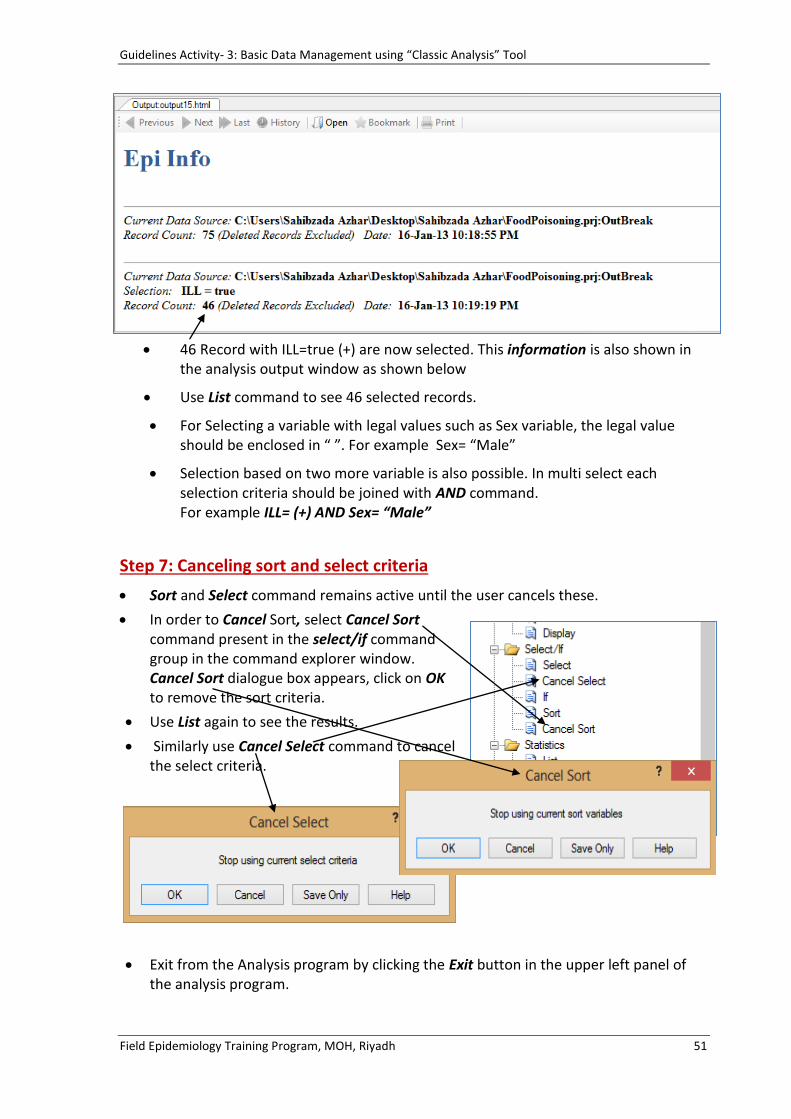
46 Record with ILL=true (+) are now selected. This information is also shown in the analysis output window as shown below
Use List command to see 46 selected records.
For Selecting a variable with legal values such as Sex variable, the legal value should be enclosed in “ ”. For example Sex= “Male”
Selection based on two more variable is also possible. In multi select each selection criteria should be joined with AND command. For example ILL= (+) AND Sex= “Male”
Step 7: Canceling sort and select criteria
Sort and Select command remains active until the user cancels these.
In order to Cancel Sort, select Cancel Sort command present in the select/if command group in the command explorer window. Cancel Sort dialogue box appears, click on OK to remove the sort criteria.
Use List again to see the results.
Similarly use Cancel Select command to cancel the select criteria.
Exit from the Analysis program by clicking the Exit button in the upper left panel of the analysis program.

Activity-4: Basic Data Analysis using Epi Info “Classic Analysis” Tool
Field Epidemiology Training Program, MOH, Riyadh 52
Activity - 4
Basic Data Analysis of Food Poisoning Outbreak using Epi Info Classic Analysis Tool
Activity Objectives:
After completing this activity the participants will be able to generate simple statistics like frequencies, cross tabulation, and means with and without stratifications. Define new variables and assign values to new variables using recode and assign command, generate graphs for the data and export analysis results into Microsoft Word.
Task: Complete the Food poisoning Outbreak Analysis based on the following Analysis Plan;
S.No. Tasks
a- Route the output of the Epi Info analysis in “Outbreak Analysis-[Your Name]”
b- Define new variable “AgeGrp” for “Age” variable and recode it into following four groups.
1- < 20 Years 2- 20-39 Years 3- 40-59 Years 4- 60 and Above
1- Generate the frequency distribution of following variables using Freq command.
a) AgeGrp b) Sex c) ILL d) Symptoms e) Beverages
2- Generate frequency distribution of following variables stratified on “ILL”.
a) AgeGrp b) Sex c) Spinach d) Water e) Pudding
3- Generate Mean value of following variables using Means command.
a) Age
b) TimeDuration
4- Cross tabulate following variables using Means command.
a) Mean of “Age” with “Sex” b) Mean of “Age” with “ILL” c) Mean of “TimeDuration” with “Sex” d) Mean of “TimeDuration” with AgeGrp
Activity-4: Basic Data Analysis using Epi Info “Classic Analysis” Tool
Field Epidemiology Training Program, MOH, Riyadh 53
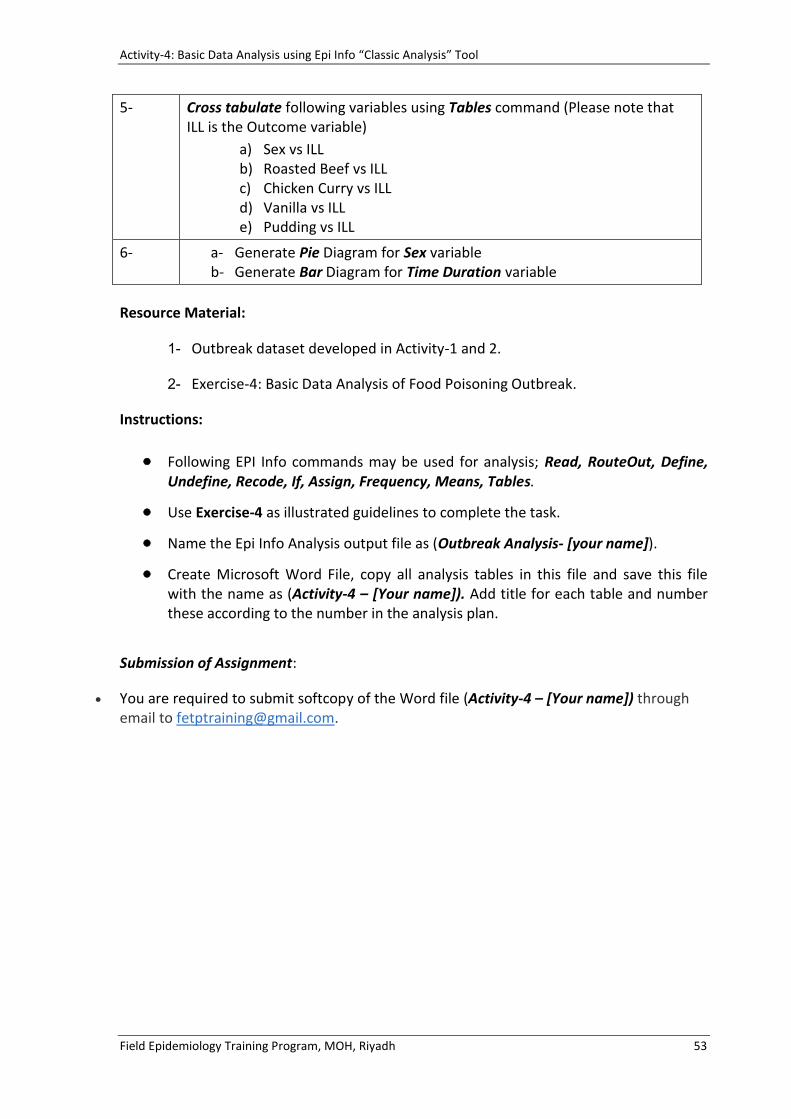
5- Cross tabulate following variables using Tables command (Please note that ILL is the Outcome variable)
a) Sex vs ILL b) Roasted Beef vs ILL c) Chicken Curry vs ILL d) Vanilla vs ILL e) Pudding vs ILL
6- a- Generate Pie Diagram for Sex variable b- Generate Bar Diagram for Time Duration variable
Resource Material:
1- Outbreak dataset developed in Activity-1 and 2.
2- Exercise-4: Basic Data Analysis of Food Poisoning Outbreak.
Instructions:
Following EPI Info commands may be used for analysis; Read, RouteOut, Define, Undefine, Recode, If, Assign, Frequency, Means, Tables.
Use Exercise-4 as illustrated guidelines to complete the task.
Name the Epi Info Analysis output file as (Outbreak Analysis- [your name]).
Create Microsoft Word File, copy all analysis tables in this file and save this file with the name as (Activity-4 – [Your name]). Add title for each table and number these according to the number in the analysis plan.
Submission of Assignment:
You are required to submit softcopy of the Word file (Activity-4 – [Your name]) through email to [email protected].

Guidelines Activity-4: Basic Data Analysis using Classic Analysis: Part-I: Producing Outputs
Field Epidemiology Training Program, MOH, Riyadh 54
Guidelines Activity-4: Basic Data Analysis using Classic Analysis Part I: Producing Outputs
(RouteOut, Frequencies, Tables, Means, Define, Recoding, If, Assign Commands)
Characteristics of the Exercise
Objectives: At the end of the exercise the participants will be able to: - Understand the use of ROUTEOUT, FREQ, TABLES, MEANS, RECODE and IF Commands
Level: Intermediate Time: Approximately 1.5 hour Resources: OutBreak Dataset Generated in Exercise 1 & 2
Part I Producing Outputs
Step 1: Routing output to a specific file
Epi Info analysis output is in HTML (HTM) format which can be open in any Internet browser such as Internet Explorer, Chrome, Firefox etc. When output file is not named explicitly, analysis program automatically assigns names to the output file with a sequential number and create a new file with each Read or Closeout command such as Out1.htm, Out2.htm, Out3.htm ..… etc.
The Routeout command assigns a specific name to the output file.
Read OutBreak from the Food Poisoning Project.
From the Output group of the command generator window, click on the RouteOut command.
Route Output dialogue box is displayed as shown below;
Type OutbreakAnalysis in the Output Filename box.
Tick the check box of “Replace any existing file” and click OK to continue.
Selecting this option replaces any previously existing file with the same name.
Guidelines Activity-4: Basic Data Analysis using Classic Analysis: Part-I: Producing Outputs
Field Epidemiology Training Program, MOH, Riyadh 55
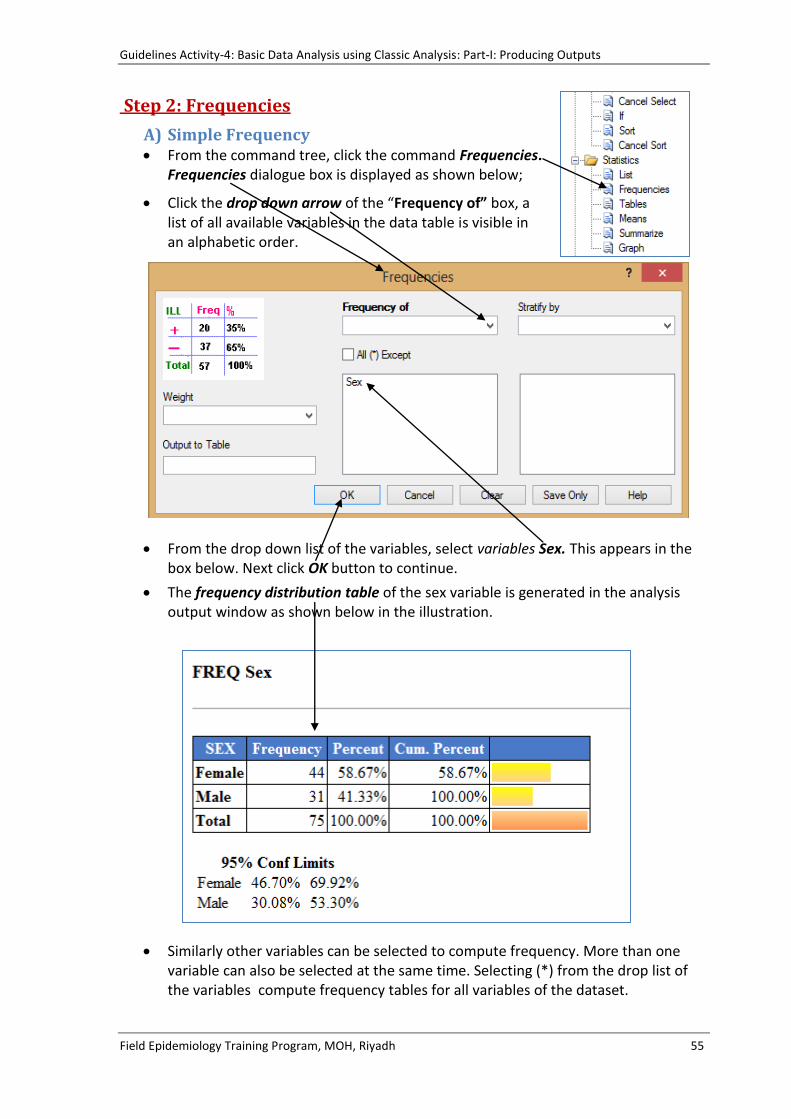
Step 2: Frequencies
A) Simple Frequency From the command tree, click the command Frequencies.
Frequencies dialogue box is displayed as shown below;
Click the drop down arrow of the “Frequency of” box, a list of all available variables in the data table is visible in an alphabetic order.
From the drop down list of the variables, select variables Sex. This appears in the box below. Next click OK button to continue.
The frequency distribution table of the sex variable is generated in the analysis output window as shown below in the illustration.
Similarly other variables can be selected to compute frequency. More than one variable can also be selected at the same time. Selecting (*) from the drop list of the variables compute frequency tables for all variables of the dataset.
Guidelines Activity-4: Basic Data Analysis using Classic Analysis: Part-I: Producing Outputs
Field Epidemiology Training Program, MOH, Riyadh 56
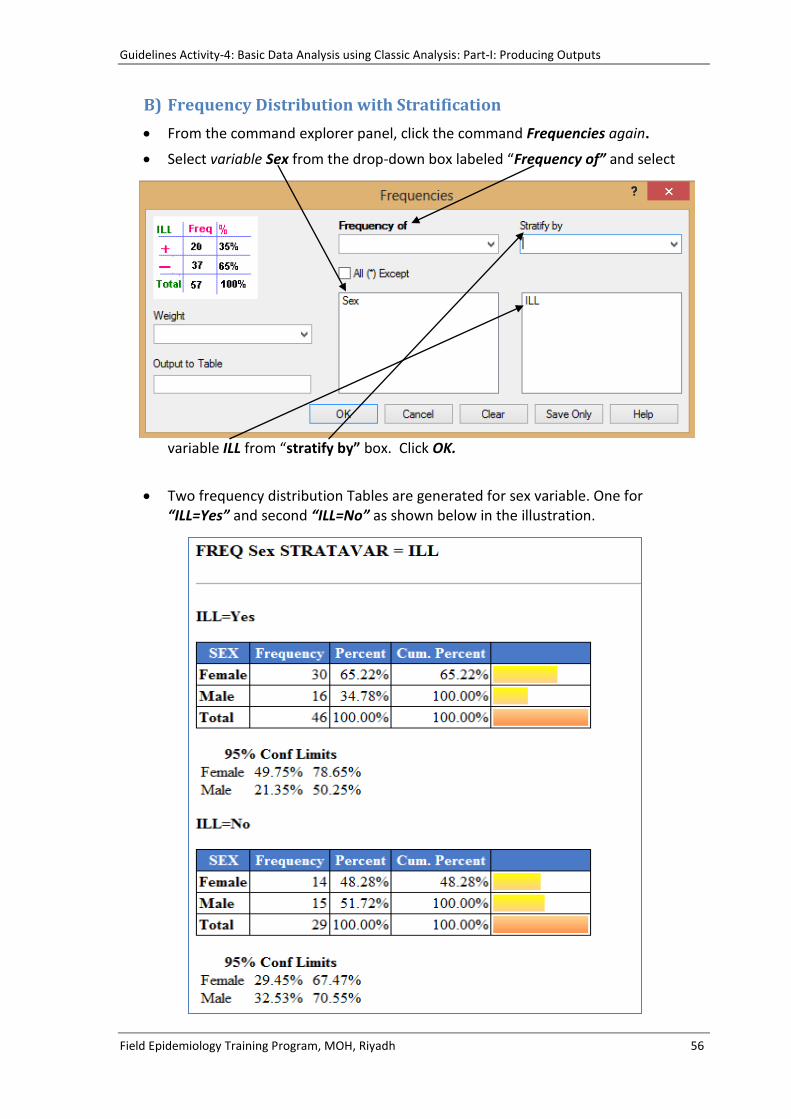
B) Frequency Distribution with Stratification
From the command explorer panel, click the command Frequencies again.
Select variable Sex from the drop-down box labeled “Frequency of” and select
variable ILL from “stratify by” box. Click OK.
Two frequency distribution Tables are generated for sex variable. One for “ILL=Yes” and second “ILL=No” as shown below in the illustration.

Guidelines Activity-4: Basic Data Analysis using Classic Analysis: Part-I: Producing Outputs
Field Epidemiology Training Program, MOH, Riyadh 57
Step 3: Means
A) Simple Means
Means command only works with numeric variables.
Click Means command from the command window. When Means dialogue box is displayed as shown below, Select Age variable from the drop-down box labeled “Means of”.
Click OK button to continue.
Output window shows frequency table for numeric variable along with Number of observations, Mean, Std Deviation, Minimum, Maximum, Mode etc as shown below.
Guidelines Activity-4: Basic Data Analysis using Classic Analysis: Part-I: Producing Outputs
Field Epidemiology Training Program, MOH, Riyadh 58
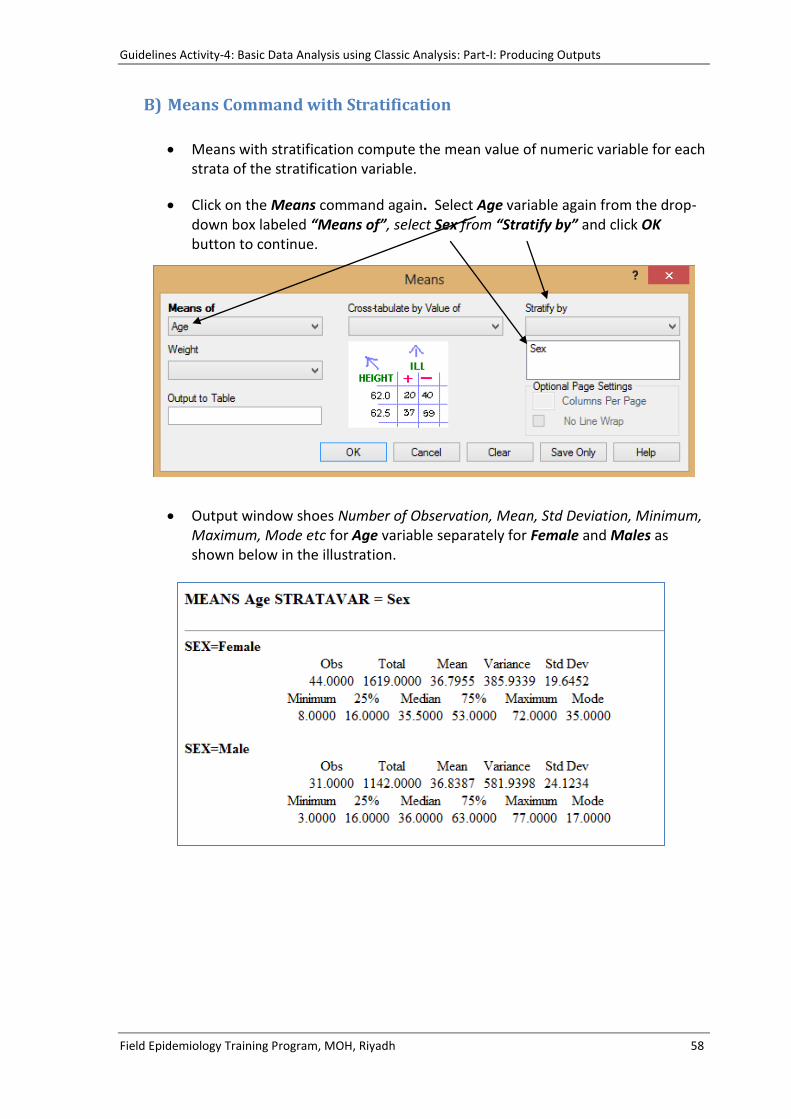
B) Means Command with Stratification
Means with stratification compute the mean value of numeric variable for each strata of the stratification variable.
Click on the Means command again. Select Age variable again from the drop-down box labeled “Means of”, select Sex from “Stratify by” and click OK button to continue.
Output window shoes Number of Observation, Mean, Std Deviation, Minimum, Maximum, Mode etc for Age variable separately for Female and Males as shown below in the illustration.

Guidelines Activity-4: Basic Data Analysis using Classic Analysis: Part-I: Producing Outputs
Field Epidemiology Training Program, MOH, Riyadh 59
C) Means Command with Cross Tabulation
Means with cross tabulation compare the mean value of numeric variable for each strata of stratification variable also apply statistical test.
Click on the Means command again.
Select Age from the drop-down box labeled Means of and select ILL from “Cross tabulate by Value of”.
Click OK button to continue. Observe the output.
Output window shows comparison of mean value of Age with the ILL=Yes and ILL=No. Please note that t-test is also computed for the comparison of mean ages as shown in below illustrations.
Guidelines Activity-4: Basic Data Analysis using Classic Analysis: Part-I: Producing Outputs
Field Epidemiology Training Program, MOH, Riyadh 60
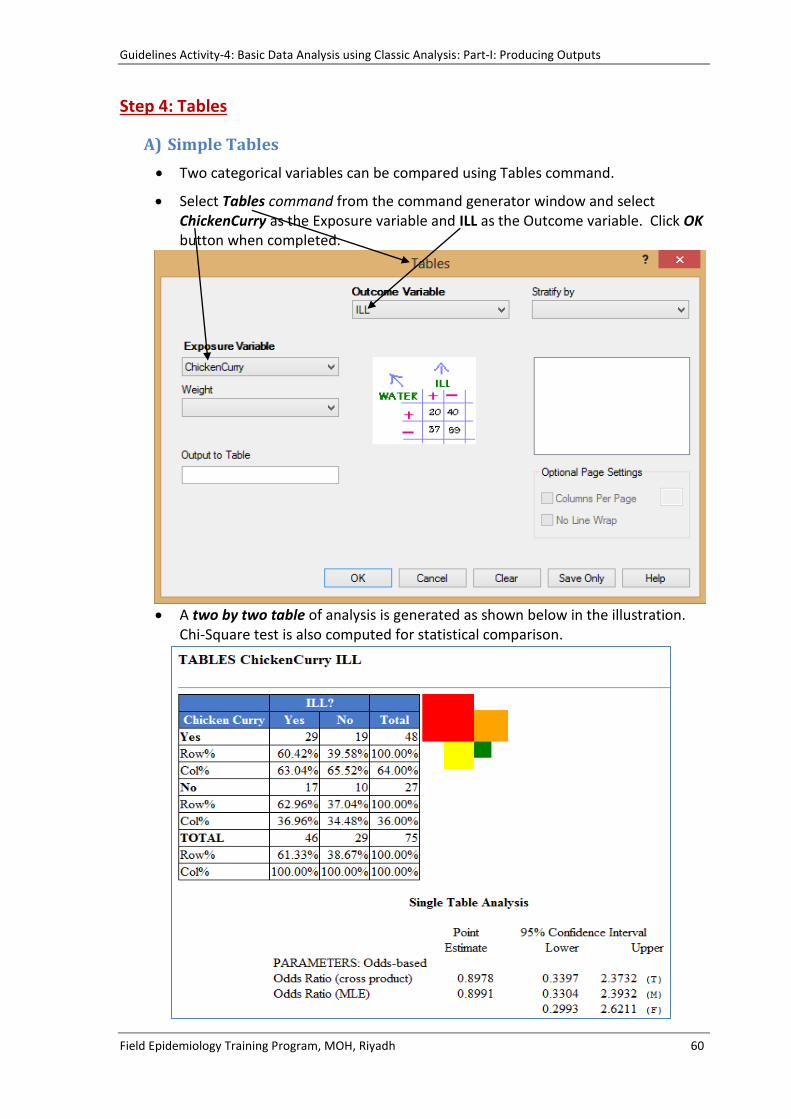
Step 4: Tables
A) Simple Tables
Two categorical variables can be compared using Tables command.
Select Tables command from the command generator window and select ChickenCurry as the Exposure variable and ILL as the Outcome variable. Click OK button when completed.
A two by two table of analysis is generated as shown below in the illustration. Chi-Square test is also computed for statistical comparison.
Guidelines Activity-4: Basic Data Analysis using Classic Analysis: Part-I: Producing Outputs
Field Epidemiology Training Program, MOH, Riyadh 61
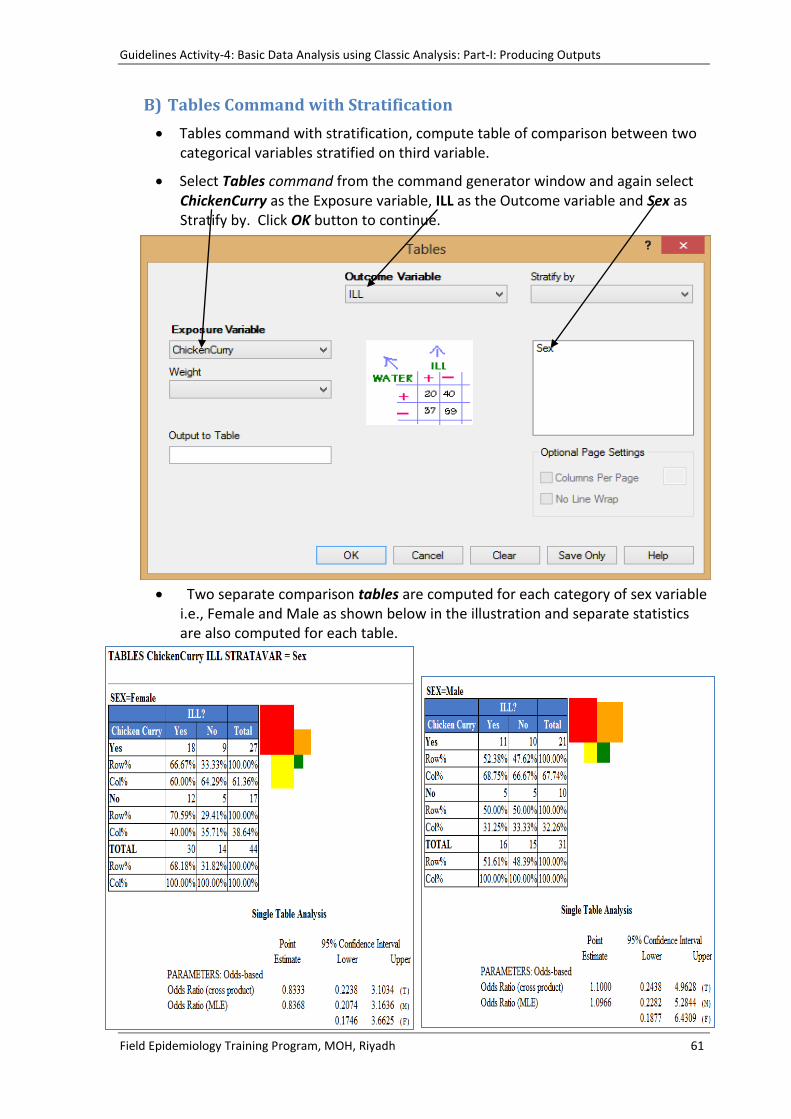
B) Tables Command with Stratification
Tables command with stratification, compute table of comparison between two categorical variables stratified on third variable.
Select Tables command from the command generator window and again select ChickenCurry as the Exposure variable, ILL as the Outcome variable and Sex as Stratify by. Click OK button to continue.
Two separate comparison tables are computed for each category of sex variable i.e., Female and Male as shown below in the illustration and separate statistics are also computed for each table.

Guidelines Activity-4: Basic Data Analysis using Classic Analysis: Part-I: Producing Outputs
Field Epidemiology Training Program, MOH, Riyadh 62
Step 5: Defining a new variable
New variables can be defined in the Analysis Program. These variables hold the results of calculations or conditional statements. Three types of variables can be defined. These are standard, Global and Permanent. Standard variable is temporary variable and is lost at the next Read command. For this exercise we will define the Standard Variable which is the default setting in Define command.
To define a new variable, click on Define command in the command explorer window. DefineVariable dialogue box appears. Type AgeGrp as the name of the new variable in the variable name text box. Click OK button to continue.
A new variable AgeGrp is created.
Use Display variable command to view the newly created variable as shown below in the illustration.
Please note that new Defined variable AgeGrp is listed down in the variable list. New value can be assigned to this variable using Recode or If Command.
Please also note that in naming a variable, no space is allowed between the words.

Guidelines Activity-4: Basic Data Analysis using Classic Analysis: Part-I: Producing Outputs
Field Epidemiology Training Program, MOH, Riyadh 63
Step 6: Assigning values to a variable using “Recode” Command In this step, Recode command of the analysis will be used to assign values to the new variable AgeGrp which was defined in previous step.
Age variable of the dataset will be grouped into new variable AgeGrp based on following age ranges.
a) < 15 years b) 15-29 years c) 30-44 years d) 45 and above
Following are the steps to recode the Age variable into AgeGrp variable.
Select Recode command from the command generator window. Recode Dialogue box is visible.
Select Age variable from the drop down list of the From and AgeGrp from the To Text box
Click in the text box Value and type 1. Press Enter key.
Type 14 In the text box of To Value. Press Enter Key.
In the Box of Recoded Value and type 1) < 15 Years. Press Enter Key
A new blank row will be created. Add the remaining categories in the similar
way to complete the recode statement as illustrated above.
On completion of all categories, Press OK button to continue.

Guidelines Activity-4: Basic Data Analysis using Classic Analysis: Part-I: Producing Outputs
Field Epidemiology Training Program, MOH, Riyadh 64
Use Frequency command to generate the frequency distribution of the newly created variable AgeGrp which appears as shown below in the illustration.
Please note the Analysis Codes or Command Syntax is also displayed in the program
editor window as shown below. These codes can be saved in the program file and
can be used later.

Guidelines Activity-4: Basic Data Analysis using Classic Analysis: Part-I: Producing Outputs
Field Epidemiology Training Program, MOH, Riyadh 65
Step 7: Assigning values to a variable using “If” Command
There are three types of beverages in the dataset ie., Milk, softdrink and Water. We can group these 3 variables into a new variable (Beverage) which means that if a person has taken any of the three items then Beverage variable is Yes(true) and else Beverage is No (False).
If order to do so, first a new variable Beverage is to be defined and then If command is used to assign value to new variable. The steps are as below;
Define a new variable Beverage.
To assign the value to new variable Beverage, click on the If command in command explorer window.
IF dialogue box is displayed on the screen as shown below.
There are three
sections of If dialogue box.
If Condition
Then
Else
From the Available Variables drop-down box, select the variable Juice and build the following expression Juice= (+) OR SoftDrink= (+) OR Water= (+) Please note that (+) means “Yes”. On clicking “Yes”, (+) is displayed in the expression box.

Guidelines Activity-4: Basic Data Analysis using Classic Analysis: Part-I: Producing Outputs
Field Epidemiology Training Program, MOH, Riyadh 66
After completing the above expression click command button of Then box and
select Assign command from the Variables command.
Assign dialogue box is displayed as shown below. From the Assign Variable drop down box select the defined variable Beverage and in the expression box add (+) by clicking Yes button.
When completed click OK to continue. The assign command is added in the Then
box of the if command dialogue box as shown above.
Next Click the Command button of the Else command and select the assign command in the same way as you did for the Then command.
When Assign Dialogue box is displayed, construct the expression ASSIGN Beverage = (-) and click OK to close the assign dialogue box.
This expression is added in the Else box of the if command. As shown on the next page.

Guidelines Activity-4: Basic Data Analysis using Classic Analysis: Part-I: Producing Outputs
Field Epidemiology Training Program, MOH, Riyadh 67
When all steps are completed, the If dialogue box should be look like as shown above. Click OK to complete the If command.
Use Frequency command to generate frequency distribution of the Beverage variable.
Please note the corresponding syntax is also displayed in the Program editor window.

Guidelines Activity-4: Basic Data Analysis using Classic Analysis: Part-II: Creating Graphs
Field Epidemiology Training Program, MOH, Riyadh 68
Guidelines Activity-4: Basic Data Analysis using Classic Analaysis Part II: Creating Graphs
Characteristics of the Exercise
Objectives: At the end of the exercise the participants will be able to: - Understand the use of Graph command to generate various types of Graph such as Pie, Bar, Stacked bar
Level: Intermediate Time: Approximately 1/2 hour Resources: Outbreak Dataset Generated in Activity 1 & 2
Part II Creating Graphs Epi Info Analysis program can also create various types of graphs (Pie, bar, line etc) to make visual representation of the data.
Step 8: Creating Pie Diagram
To create pie diagram of the Sex variable in the Food poisoning outbreak dataset do following steps;
Click on the Graph command in the command generator window
A GRAPH dialog box appears with various options appears as shown on the next page.

Guidelines Activity-4: Basic Data Analysis using Classic Analysis: Part-II: Creating Graphs
Field Epidemiology Training Program, MOH, Riyadh 69
From the drop down arrow of the Graph Type select Pie. From the drop down arrow of the Main variable(s) text box select Sex variable and Type the Title as
mentioned above. From the drop down box of show value of select Count
After completing the above options click OK to generate Pie graph as show.
Step 9: Creating Bar Diagram To create Bar diagram of the Time Duration variable in the Food poisoning outbreak dataset do the following steps;
Click on the Graph command in the command generator window as shown
in the previous step.
GRAPH dialog box appears on the screen as shown below
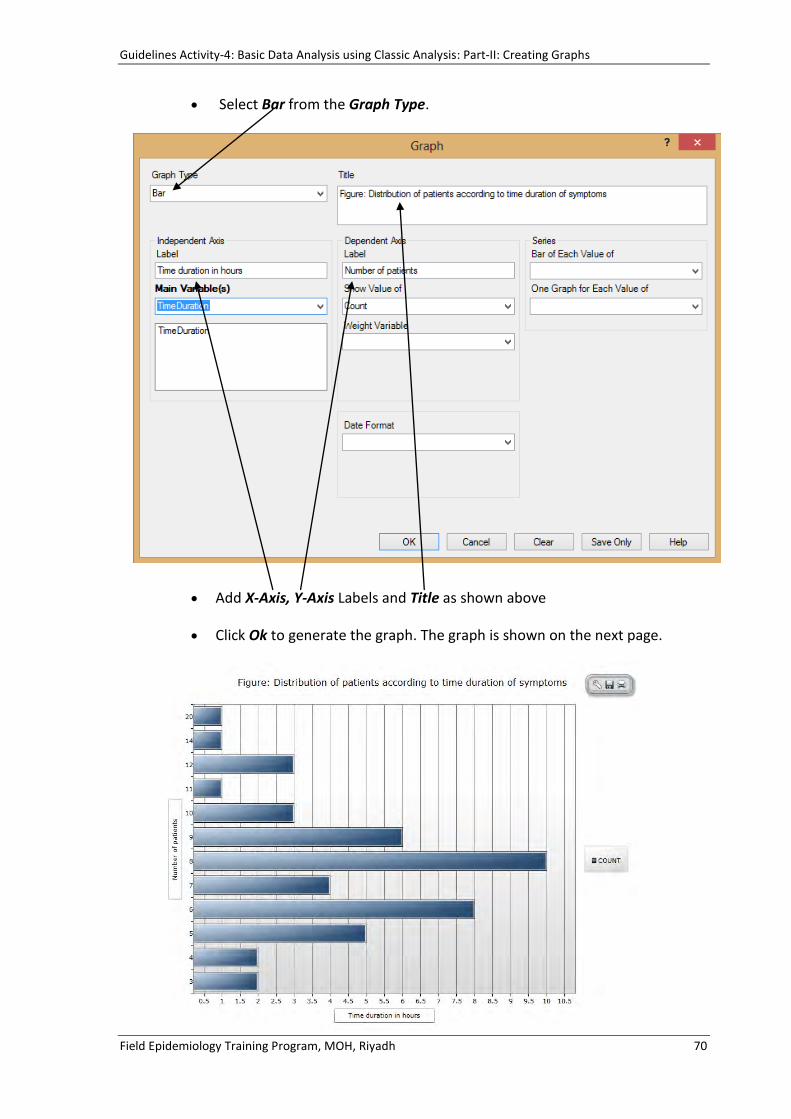
Guidelines Activity-4: Basic Data Analysis using Classic Analysis: Part-II: Creating Graphs
Field Epidemiology Training Program, MOH, Riyadh 70
Select Bar from the Graph Type.
Add X-Axis, Y-Axis Labels and Title as shown above
Click Ok to generate the graph. The graph is shown on the next page.

Guidelines Activity-4: Basic Data Analysis using Classic Analysis: Part-III: Working with Analysis Syntax
Field Epidemiology Training Program, MOH, Riyadh 71
Guidelines Activity-4: Basic Data Analysis using Classic Analysis Part III: Working with Analysis Syntax
Characteristics of the Exercise
Objectives: At the end of the exercise the student will be able to: - Understand the analysis program codes, saving codes in the program file and running and executing the analysis program
Level: Intermediate Time: Approximately 1/2 hour Resources: Outbreak Dataset Generated in Activity 1 & 2
Part III Working with Analysis Syntax
Step 10: Saving a program file (.PGM) Note that with each command execution, one or more lines of program codes are generated in the Program Editor windows at the bottom of the analysis screen.
These program codes can be saved in the program file and can be reloaded and Run from the program editor window.
Program codes can be saved internally within the project file or externally as a text file with .pgm file extension.
a) Saving a Analysis Code Internally
Internally, the codes written in the program editor are saved in a special table in the Epi Info Project file called as metaPrograms.
So the internally saved program becomes part of the project file. It can be opened in the program editor window and can be run by using the Run command of the program Editor.

Guidelines Activity-4: Basic Data Analysis using Classic Analysis: Part-III: Working with Analysis Syntax
Field Epidemiology Training Program, MOH, Riyadh 72
To save the codes, click the Save button of the program editor window. A Save Program dialogue box appears as shown on next page.
In the Save Program dialogue box, type OutBreak Analysis in the program text box, and then type your name in the Author box. Before you save, you may type a brief description of the program in the comments box. When this is completed, click OK button to save program file.
Saving a Analysis Code Externally (.Pgm) To save the codes externally, click the Text File button in the save program dialogue
box. This brings the Save As dialogue box, Type Outbreak Analysis in file name box and click save button. The program codes are now saved as external file with the
extension of pgm. This is similar to program file for Epi Info 6 for DOS.

Guidelines Activity-4: Basic Data Analysis using Classic Analysis: Part-III: Working with Analysis Syntax
Field Epidemiology Training Program, MOH, Riyadh 73
Please note that Closing and opening Analysis program removes the analysis codes from the program editor window.
Step 11: Opening an existing program
In the Program Editor, click the Open Pgm button.
On clicking the open button of program editor window, Read Program dialogue box is displayed. From the drop down arrow of the program Box select the Outbreak Analysis.

Guidelines Activity-4: Basic Data Analysis using Classic Analysis: Part-III: Working with Analysis Syntax
Field Epidemiology Training Program, MOH, Riyadh 74
Check that your name and your comments are displayed along with the Date Created and Date Updated. Click OK button to load the program is in the Program Editor Window. To run the program, click on the Run command of the program editor window.
To open a program that was saved externally, click Open button from the
program editor window to display Read Program dialogue box as before.
Next click the Text File button to display Read Text dialogue box containing list of available .PGM files.
Click on Outbreak Analysis.pgm7 file and click open button.

Guidelines Activity-4: Basic Data Analysis using Classic Analysis: Part-III: Working with Analysis Syntax
Field Epidemiology Training Program, MOH, Riyadh 75
The file is loaded in the content box of the Open Program dialogue box. Clicking Ok button of the open program loads the analysis code in the program editor window.
Step 12: Running the program
After the program is loaded in the program editor, it is ready to be executed. Click the Run Commands button to execute all the analysis codes. The analysis codes can also be edited if desired.
A single command can also be run by placing the cursor on the command line and clicking the Run Commands or highlighting group of commands and Clicking this button again.
If more analysis is performed, the more codes are added in the program editor windows, these changes can be saved to the program by clicking Save button.

Activity-5: Food Poisoning Outbreak Analysis using Epi Info Visual Dashboard
Field Epidemiology Training Program, MOH, Riyadh 76
Activity - 5
Food Poisoning Outbreak Analysis Using Epi Info Visual Dashboard Tool
Activity Objectives:
After completing this activity the participants will be able to generate simple statistical gadgets like frequencies, Tables, and Means using the Visual Dashboard Tool of Epi Info. Participants will also be able to define new variables, assign values to new variables using Define Variable Gadget, apply gadget and canvas filters on the data, generate chart gadgets and export canvas to Microsoft Word or Excel software.
Task: Complete the Food poisoning Outbreak Analysis based on the following Analysis Plan using Epi Info Visual Dashboard;
S.No. Tasks
a- Define new variable “AgeGrp” for “Age” variable and recode it with following four groups.
1) < 20 Years 2) 20-39 Years 3) 40-59 Years 4) 60 and Above
b- Create a Group variable “FoodItems” comprising of all food items available in the dataset.
1- Create Frequency Distribution Gadgets of the following variables.
a) AgeGrp b) Sex c) ILL d) FoodItems e) AgeGrp stratified on ILL f) Sex stratified on ILL
2- Create Means gadget for the following variables;
a) Age Variable b) Timeduration variable c) Age stratified on Sex variables d) Age stratified on ILL variables e) Mean of Age cross tabulate by Sex f) Mean of Age cross tabulate by ILL
3- Create Tables Gadget Where; Exposure factor is "FoodItems" and outcome variable is “ILL”
4- Generate Chart Gadget for the followings;
a) “Pie” gadget for “ILL” variable b) “EpiCurve” gadget for Time Duration variable

Guidelines Activity-5: Basic Data Analysis using Visual Dashboard
Field Epidemiology Training Program, MOH, Riyadh 77
Resource Material:
1- Outbreak dataset developed in Activity-1 and 2.
2- Exercise-5: Basic Data Analysis of Food Poisoning Outbreak using Visual DashBoard.
Instructions:
Following Visual Dashboard gadgets may be used for analysis; Frequency, combined frequency, Table, Means, chart.
Use Exercise-5 as illustrated guidelines to complete the task.
Save the Visual dashboard by name (Outbreak Analysis- [your name]).
Add title to each gadget and number this according to the number in the analysis plan.
Export Visual dashboard analysis in Microsoft Word and save the word file with the name as (Activity-5 – [Your name]).
Submission of Assignment:
You are required to submit following softcopies through email [email protected].
1- Epi Info Visual Dashboard file containing all analysis gadgets.
2- Word file containing tables for all analysis gadgets.

Guidelines Activity-5: Basic Data Analysis using Visual Dashboard
Field Epidemiology Training Program, MOH, Riyadh 78
Guidelines Activity-5: Basic Data Analysis using “Visual Dashboard” Tool
Characteristics of the Exercise
Objectives: At the end of the exercise the participants will be able to: - Understand the use of visual Dashboard to create statistical gadgets such as List, Frequencies, Tables, Mean, graphs, Define Variables and Define filters
Level: Intermediate Time: Approximately 1.5 hours Resources: Outbreak Dataset Generated in Activity 1 & 2
Visual Dashboard Introduction
There are two ways to do analysis in epi Info-7. One is through the Classic Analysis, which is a standard analysis program available in all previous versions of Epi info. Second is the brand new analysis module called as Visual Dashboard. Visual Dashboard is an attempt to replace the Epi Report module of Epi Info 3.x.x. Through the use of visual dashboard, data analysis can be conducted in more simplified way without needing to know the details of the complicated commands of classic analysis. The characteristic feature of the dashboard is the Analysis Gadgets. These gadgets can be created for any type of analysis like, list, frequency, means, tables, graph etc. In addition, these gadgets can be re-arranged by moving them from one place of the dashboard canvas to another giving a more appropriate look of the report. The dash board can be saved and reloaded with all the previously analysis gadgets. In addition, individual gadgets and total dashboard can be exported into Excel, Word and HTML format.
To do analysis using Visual Dashboard do following steps; Step 1: Opening Visual Dashboard Tool
To open visual Dashboard, click the menu option Tools, analyze Data and Visual Dashboard or click button labeled as Visual Dashboard on the main screen of Epi Info.
Step 2: Setting data Source
When program screen of visual Dashboard is visible, load data source by Right-click on the canvas or click the button labeled as Set Data Source.

Guidelines Activity-5: Basic Data Analysis using Visual Dashboard
Field Epidemiology Training Program, MOH, Riyadh 79
The Select Data Source dialogue box appears as shown.
Click the Brows button to locate Epi Info project file.
Click the FoodPoisoning.prj file and click Open button.
FoodPoisoning.prj product is loaded in the select data source dialogue box with OutBreak form visible in data source explorer box.
Click OK button to load the OutBreak data source in visual Dashboard.

Guidelines Activity-5: Basic Data Analysis using Visual Dashboard
Field Epidemiology Training Program, MOH, Riyadh 80
The visual Dashboard shows the selected Data source along with the number of records available as shown in the figure.
Step 3: Adding Analysis Gadgets
A: Adding Line List Gadget
To add any gadget in the visual dashboard, right click the mouse button on the canvas.
A list of menu options appears on the screen as shown.
Select Add Analysis gadgets and Select Line List option.
Line List Properties gadget appears on the screen as shown in the illustration.
Select the variables to display by pressing the ctrl key+left mouse button.
Sort the variable on Age by selecting age variable from the sort variable drop down list.
Click Generate Line List button.

Guidelines Activity-5: Basic Data Analysis using Visual Dashboard
Field Epidemiology Training Program, MOH, Riyadh 81
Line List gadget of the selected variables appears on the screen as shown in the illustration.
The warning message shows that line list is visible upto 50 lines. This number can be changed form the Line List Property gadget.
Please note data is sorted with reference to age variable in ascending order.
Line List can also be generated with reference to group data.
Select group variable Sex from the dropdown list of the Group result by. And click the button Generate Line List.
The same Line list now splits for Sex = male and Sex= female as shown in the illustration.

Guidelines Activity-5: Basic Data Analysis using Visual Dashboard
Field Epidemiology Training Program, MOH, Riyadh 82
B: Adding Frequency Gadget
To add any gadget in the visual dashboard, right click the mouse button on the canvas.
A list of menu options appears on the screen as shown.
Select Add Analysis gadgets and Select Frequency option.
Frequency Properties gadget appears on the screen.
Click the down arrow of frequency of text box which shows list of all available variables, select variable ILL as shown in the figure.
Click the Run button to generate analysis gadget of Frequency.
Please note that there are five buttons on the title bar of Line List Gadget. Same buttons appears on all analysis gadgets. A brief description of these buttons is shown in the next illustration.
Close the Gadget
Minimize the Gadgets
Add description
Change Settings
Apply filter

Guidelines Activity-5: Basic Data Analysis using Visual Dashboard
Field Epidemiology Training Program, MOH, Riyadh 83
C: Adding Gadget of Frequency with stratification
Frequency gadget appears on the screen showing the frequency distribution table for ILL Variable as shown in the illustration
To add gadget of Frequency with stratifications
Right click the mouse button on the canvas and from list of menu options select Add Analysis gadgets and Select Frequency option. When frequency gadget appears, select ILL from the frequency of dropdown box ,click the dropdown arrow of Advanced options
Advanced options of frequency Properties gadget are visible as shown in the illustration.
Select the Sex variable from the stratified by List and
You can also control the output by selecting various parameters from Output Column to display and also select the Decimal point in the percentages.
Click Run button to generate gadget of Frequency of ILL stratified by Sex variable.

Guidelines Activity-5: Basic Data Analysis using Visual Dashboard
Field Epidemiology Training Program, MOH, Riyadh 84
D: Adding Gadget of Combined Frequencies
E: Adding Gadget of Mean
To add gadget of combined Frequencies on the visual Dashboard.
Right click the mouse button on the canvas and from list of menu options select Add Analysis gadgets and Select the option Combined Frequency.
When combined frequency gadget appears on the screen, click the drop down arrow of the Group field and select the option Symptoms.
Combined frequency Gadget appears on the screen showing frequency of symptoms and relative percentages out of total records available.
To add gadget of Mean on the visual Dashboard.
Right click the mouse button on the canvas and from list of menu options select Add Analysis gadgets and Select the option Means.
When Means gadget appears on the screen, click the drop down arrow of the Means of and select the option Age.

Guidelines Activity-5: Basic Data Analysis using Visual Dashboard
Field Epidemiology Training Program, MOH, Riyadh 85
F: Adding Gadget of Mean with stratification
F: Adding Gadget of Mean with Cross Tabulations
When age variable is selected, click the Run button to generate the Means gadget for Age variable as shown below in the illustration.
To add gadget of Mean with stratification.
Right click the mouse button on the canvas and from list of menu options select Add Analysis gadgets and Select the option Means.
When Means gadget appears on the screen, click the arrow of Advanced Options to display details of the options available for Mean Gadget.
From the list of Variables in the stratified by List box, select the variable ILL.
Various output options can be selected from the list of output column to display.
Click Run to generate Gadget of Means of age stratified on ILL variable as shown below in the illustration.
To add gadget of Mean with Cross Tabulations.
Right click the mouse button on the canvas and from list of menu options select Add Analysis gadgets and Select the option Means again as in the previous step.

Guidelines Activity-5: Basic Data Analysis using Visual Dashboard
Field Epidemiology Training Program, MOH, Riyadh 86
H: Adding Gadget of Tables Analysis
Click the arrow of the advance options and from the dropdown list of the Cross tabulate by select ILL variable.
Click Run to generate the gadget for means of Age cross tabulate by ILL as shown below.
Please not that statistical test (T-Test) is also applied with the cross tabulations of mean.
To add gadget of Tables analysis.
Right click the mouse button on the canvas to list menu options select Add Analysis gadgets and Select the option MxN /2x2 table.
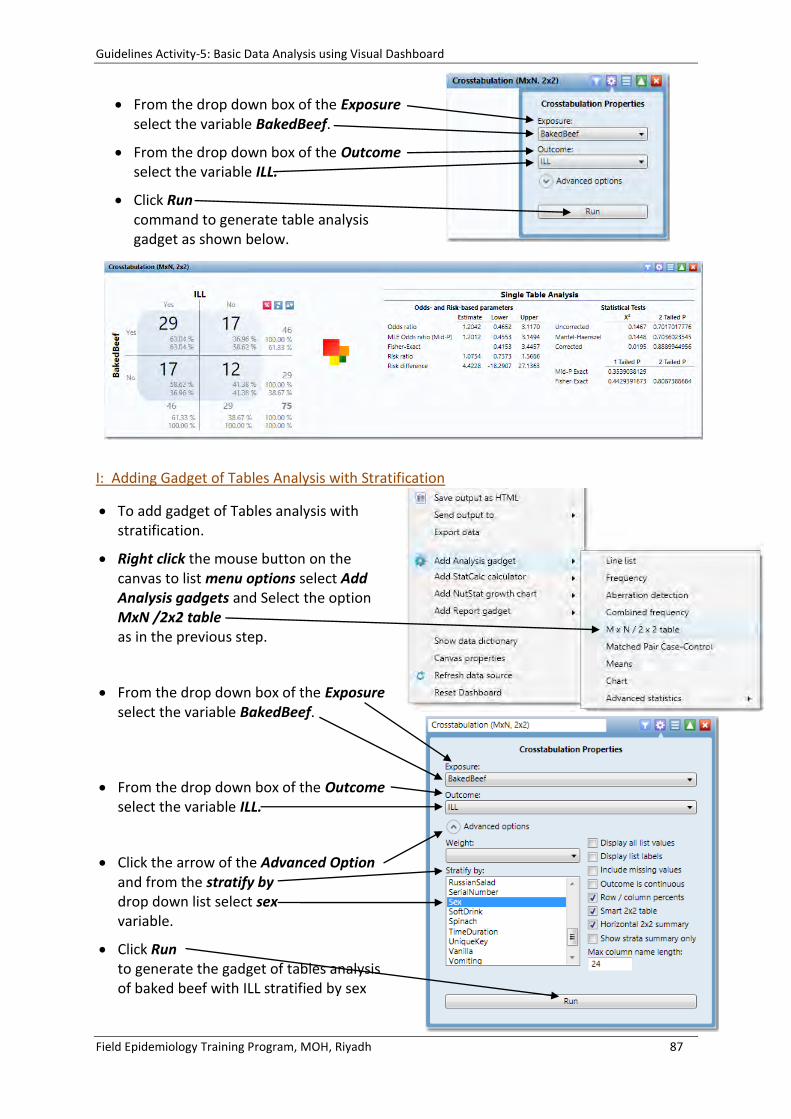
Guidelines Activity-5: Basic Data Analysis using Visual Dashboard
Field Epidemiology Training Program, MOH, Riyadh 87
I: Adding Gadget of Tables Analysis with Stratification
From the drop down box of the Exposure select the variable BakedBeef.
From the drop down box of the Outcome select the variable ILL.
Click Run command to generate table analysis gadget as shown below.
To add gadget of Tables analysis with stratification.
Right click the mouse button on the canvas to list menu options select Add Analysis gadgets and Select the option MxN /2x2 table as in the previous step.
From the drop down box of the Exposure select the variable BakedBeef.
From the drop down box of the Outcome select the variable ILL.
Click the arrow of the Advanced Option and from the stratify by drop down list select sex variable.
Click Run to generate the gadget of tables analysis of baked beef with ILL stratified by sex variable.

Guidelines Activity-5: Basic Data Analysis using Visual Dashboard
Field Epidemiology Training Program, MOH, Riyadh 88
J: Adding Chart Gadget
The analysis view can be reduced by clicking the arrows on the left side of each tables.
To add gadget of Chart.
Right click the mouse button on the canvas to list menu options select Add Analysis gadgets and Select the option Chart.

Guidelines Activity-5: Basic Data Analysis using Visual Dashboard
Field Epidemiology Training Program, MOH, Riyadh 89
From Chart Type, select the Epi Curve which is the default option.
From Onset Date Field dropdown list, select TimeDuration
Click the button Generate Chart to generate chart gadget of TimeDuration as shown in the illustration.
From Chart Type, select the Pie which is the default option.
From Primary Field dropdown list, select ILL
Click the button Generate Chart to generate Pie chart gadget of ILL.

Guidelines Activity-5: Basic Data Analysis using Visual Dashboard
Field Epidemiology Training Program, MOH, Riyadh 90
K: Adding Simple Text Box
L: Data Dictionary Gadget
To add simple text box gadget, Right click the mouse button on the canvas to list menu options select Add Report gadget and Select the option Simple text box.
A text box gadget appear, In which you can add any text as shown below.
To add data dictionary gadget, Right click the mouse button on the canvas to list menu options select Show data dictionary.
Data Dictionary gadget appears on screen as shown below.

Guidelines Activity-5: Basic Data Analysis using Visual Dashboard
Field Epidemiology Training Program, MOH, Riyadh 91
Step 4: Defining New Variables
In visual Dashboard, new variables can also defined as in classical analysis. When visual dashboard is loaded, define variable gadget is partly visible.
When the mouse pointer is moved over the partly visible defined Variables gadget, it fully expands and all options of the gadget become visible as shown in the illustration.
With this gadget new variables can be created, edited or deleted by clicking the New Variable, Edit Variable and Delete Variable button.
A: New Variable with Recoded Value
To create new age variable using recoded values, click the New Variable button and from the option list select the option with Recoded Value

Guidelines Activity-5: Basic Data Analysis using Visual Dashboard
Field Epidemiology Training Program, MOH, Riyadh 92
Add Recoded Variable dialogue box appears as show in the illustrations.
From the Source Field drop down list select Age variable, Destination field name Age_Recoded is automatically added.
Fill the values in the table as shown in the figure.
Generate Frequency distribution gadget of Age_Recoded.
Defined variable gadget shows that one variable is defined
By clicking the Edit variable button, the Add Recoded Variable dialogue box appears again as shown above. Now you can make any changes in the recode command as needed.
By clicking the
Delete Variable button, the defined variable (age_Recoded) can be deleted from the Dashboard

Guidelines Activity-5: Basic Data Analysis using Visual Dashboard
Field Epidemiology Training Program, MOH, Riyadh 93
B: New Variable with Conditional Assignment
To create new age variable using Conditional Assignment, click the New Variable button and from the option list select the option with Conditional Assignment
A dialogue box labeled as Add variable with Conditional Assignment appears on the screen.
Type Beverage in the Assign Field and which is name of the new assigned variable
click the button Create/Edit Condition
A dialogue box labeled as Specify Assign Condition appears on the screen.
Now add the following three conditions Juice is equal to Yes Softdrink is equal to Yes Water is equal to Yes
Add these conditions by using the dropdown arrows of the field Name, Operator and value options, Add these condition with OR when asked for.
When finished click Ok button.

Guidelines Activity-5: Basic Data Analysis using Visual Dashboard
Field Epidemiology Training Program, MOH, Riyadh 94
The dialogue box labeled as Add variable with Conditional Assignment appears again on the screen with Assign conditions is written in the Assign Condition box.
Next add assign value as Yes in assign value box and No in the Else value Box.
When finished click OK button to complete the process.
Next generate the frequency distribution gadget for the newly created variable Beverage
The frequency distribution table is shown in the illustration below
If desired you can edit the variable definitions by clicking the Edit variable button on the Defined variable Gadget
You can also use all newly created variables for cross tabulations and other analysis.
Below illustration shows cross tabulation of Beverage (New assigned variable) with ILL variable.

Guidelines Activity-5: Basic Data Analysis using Visual Dashboard
Field Epidemiology Training Program, MOH, Riyadh 95
C: Creating Group Variable
To create group variable, expand the Defined Variable gadget.
Click the New Variable button and select the option Create variable Group
Add the name of the group field name as ExposureFactors.
Select all the variables which are included in the exposure factors (as mentioned in the activity-5) by holding the Ctrl-key and clicking the left mouse button when complete click OK to generate the group field/variable.
New group variable Exposurefactors is created. To generate analysis gadget of combined frequency of Exposurefactors.
Right click the mouse button and from the Add analysis gadget select Combine Frequency
From combined frequency gadget select the Exposurefactors by clicking the dropdown arrow of the group field.
Combined frequency gadget for Exposurefactors is visible as shown in the illustration.
Group fields and variable can also be used for cross tabulations.
Try generating the Table analysis gadget for exposurefactors with ILL.
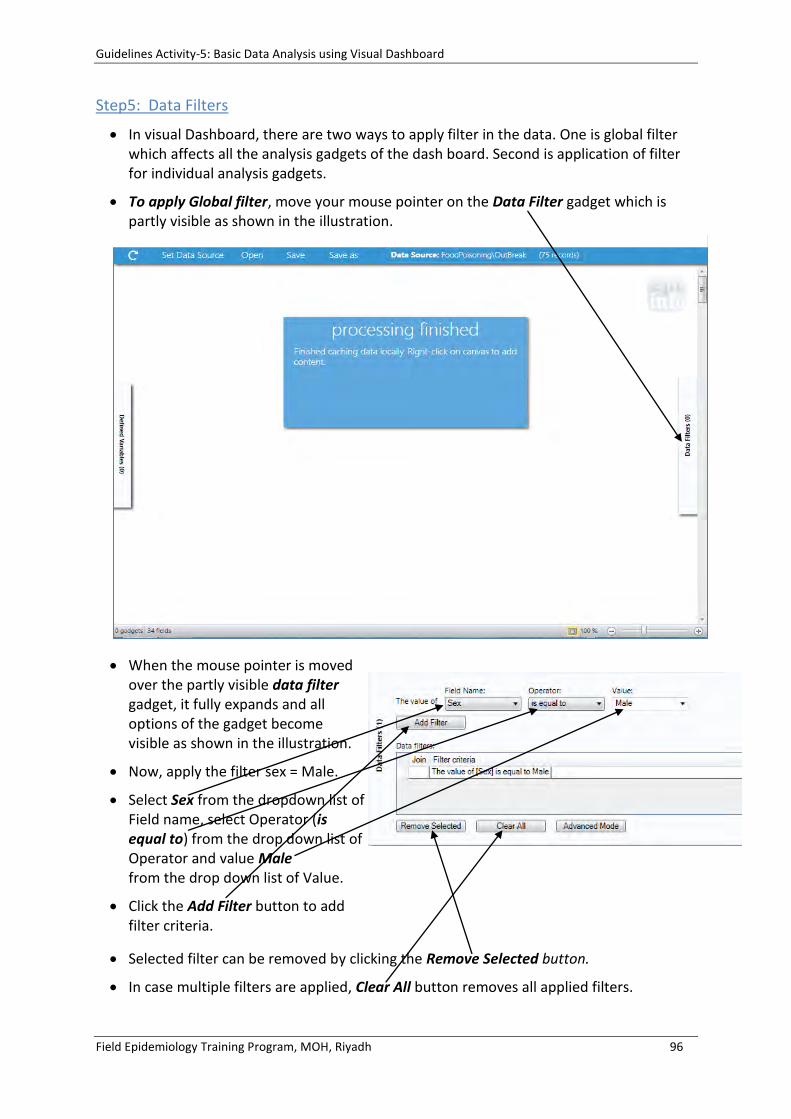
Guidelines Activity-5: Basic Data Analysis using Visual Dashboard
Field Epidemiology Training Program, MOH, Riyadh 96
Step5: Data Filters
Selected filter can be removed by clicking the Remove Selected button.
In case multiple filters are applied, Clear All button removes all applied filters.
In visual Dashboard, there are two ways to apply filter in the data. One is global filter which affects all the analysis gadgets of the dash board. Second is application of filter for individual analysis gadgets.
To apply Global filter, move your mouse pointer on the Data Filter gadget which is partly visible as shown in the illustration.
When the mouse pointer is moved over the partly visible data filter gadget, it fully expands and all options of the gadget become visible as shown in the illustration.
Now, apply the filter sex = Male.
Select Sex from the dropdown list of Field name, select Operator (is equal to) from the drop down list of Operator and value Male from the drop down list of Value.
Click the Add Filter button to add filter criteria.

Guidelines Activity-5: Basic Data Analysis using Visual Dashboard
Field Epidemiology Training Program, MOH, Riyadh 97
To apply Individual filter, move your mouse pointer on the Data Filter gadget which is partly visible as shown in the illustration.
To apply sex filter on the frequency distribution gadget of ILL variable, generate frequency distribution gadget of ILL and click the filter button as shown below.
Specify row filter dialogue box appear on the screen. Add filter as shown in illustrations and click the button labeled as Add filter to apply filter on the frequency distribution.
Frequency distribution gadget of ILL variable is updated as shown below

Guidelines Activity-5: Basic Data Analysis using Visual Dashboard
Field Epidemiology Training Program, MOH, Riyadh 98
Step 6: Exporting Analysis Gadget to Microsoft Excel
Step 7: Exporting Dashboard output to Microsoft Excel or Microsoft Word
To export analysis gadget data to excel, do right mouse button click on the desired gadget and select the option Send data to Excel.
The gadget data is exported to Microsoft Excel.
To export dashboard out to Micosoft Excel or Word, do right mouse button click on the blank surface of dashboard and click the right mouse button.
Out of the listed options, select the option Microsoft Excel or Microsoft Word.