epic research special report of 13 oct 2015
TRANSCRIPT
DAILY REPORT
13th
OCT. 2015
YOUR MINTVISORY Call us at +91-731-6642300
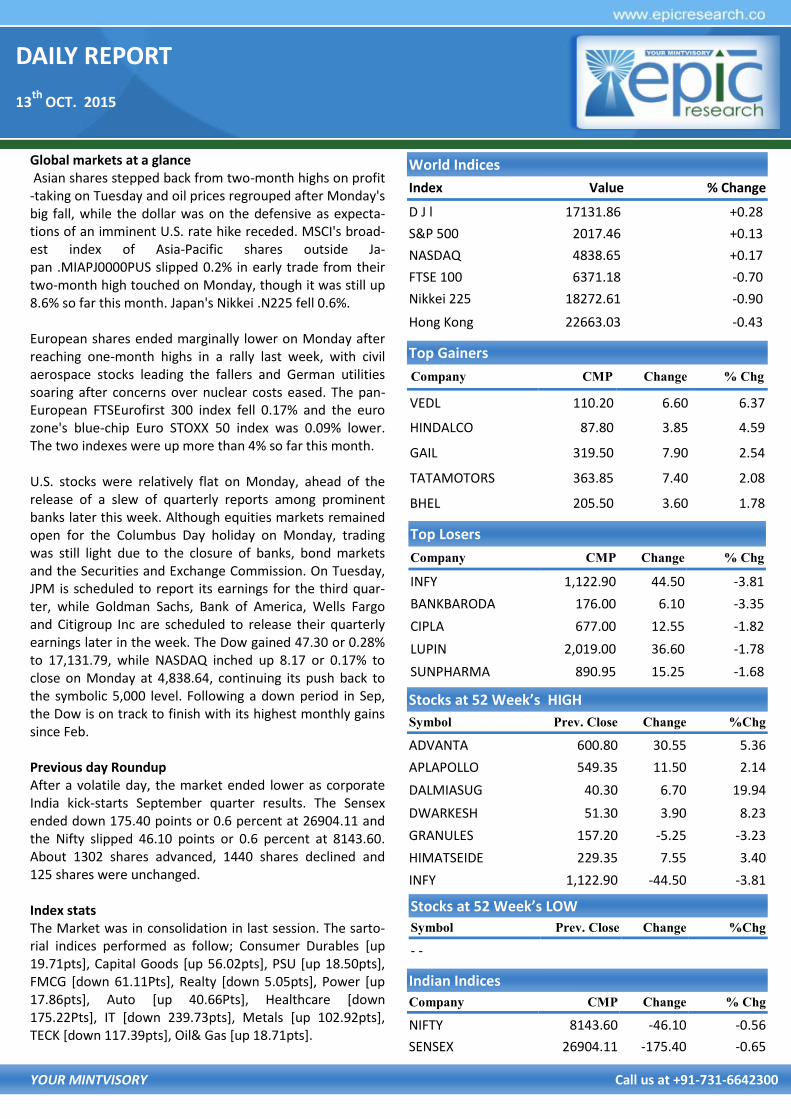
Global markets at a glance Asian shares stepped back from two-month highs on profit-taking on Tuesday and oil prices regrouped after Monday's big fall, while the dollar was on the defensive as expecta-tions of an imminent U.S. rate hike receded. MSCI's broad-est index of Asia-Pacific shares outside Ja-pan .MIAPJ0000PUS slipped 0.2% in early trade from their two-month high touched on Monday, though it was still up 8.6% so far this month. Japan's Nikkei .N225 fell 0.6%. European shares ended marginally lower on Monday after reaching one-month highs in a rally last week, with civil aerospace stocks leading the fallers and German utilities soaring after concerns over nuclear costs eased. The pan-European FTSEurofirst 300 index fell 0.17% and the euro zone's blue-chip Euro STOXX 50 index was 0.09% lower. The two indexes were up more than 4% so far this month. U.S. stocks were relatively flat on Monday, ahead of the release of a slew of quarterly reports among prominent banks later this week. Although equities markets remained open for the Columbus Day holiday on Monday, trading was still light due to the closure of banks, bond markets and the Securities and Exchange Commission. On Tuesday, JPM is scheduled to report its earnings for the third quar-ter, while Goldman Sachs, Bank of America, Wells Fargo and Citigroup Inc are scheduled to release their quarterly earnings later in the week. The Dow gained 47.30 or 0.28% to 17,131.79, while NASDAQ inched up 8.17 or 0.17% to close on Monday at 4,838.64, continuing its push back to the symbolic 5,000 level. Following a down period in Sep, the Dow is on track to finish with its highest monthly gains since Feb. Previous day Roundup After a volatile day, the market ended lower as corporate India kick-starts September quarter results. The Sensex ended down 175.40 points or 0.6 percent at 26904.11 and the Nifty slipped 46.10 points or 0.6 percent at 8143.60. About 1302 shares advanced, 1440 shares declined and 125 shares were unchanged. Index stats The Market was in consolidation in last session. The sarto-rial indices performed as follow; Consumer Durables [up 19.71pts], Capital Goods [up 56.02pts], PSU [up 18.50pts], FMCG [down 61.11Pts], Realty [down 5.05pts], Power [up 17.86pts], Auto [up 40.66Pts], Healthcare [down 175.22Pts], IT [down 239.73pts], Metals [up 102.92pts], TECK [down 117.39pts], Oil& Gas [up 18.71pts].
World Indices
Index Value % Change
D J l 17131.86 +0.28
S&P 500 2017.46 +0.13
NASDAQ 4838.65 +0.17
FTSE 100 6371.18 -0.70
Nikkei 225 18272.61 -0.90
Hong Kong 22663.03 -0.43
Top Gainers
Company CMP Change % Chg
VEDL 110.20 6.60 6.37
HINDALCO 87.80 3.85 4.59
GAIL 319.50 7.90 2.54
TATAMOTORS 363.85 7.40 2.08
BHEL 205.50 3.60 1.78
Top Losers
Company CMP Change % Chg
INFY 1,122.90 44.50 -3.81
BANKBARODA 176.00 6.10 -3.35
CIPLA 677.00 12.55 -1.82
LUPIN 2,019.00 36.60 -1.78
SUNPHARMA 890.95 15.25 -1.68
Stocks at 52 Week’s HIGH
Symbol Prev. Close Change %Chg
ADVANTA 600.80 30.55 5.36
APLAPOLLO 549.35 11.50 2.14
DALMIASUG 40.30 6.70 19.94
DWARKESH 51.30 3.90 8.23
GRANULES 157.20 -5.25 -3.23
HIMATSEIDE 229.35 7.55 3.40
INFY 1,122.90 -44.50 -3.81
Indian Indices
Company CMP Change % Chg
NIFTY 8143.60 -46.10 -0.56
SENSEX 26904.11 -175.40 -0.65
Stocks at 52 Week’s LOW
Symbol Prev. Close Change %Chg
- -

DAILY REPORT
13th
OCT. 2015
YOUR MINTVISORY Call us at +91-731-6642300
STOCK RECOMMENDATION [CASH] 3. MAX [CASH]
MAX INDIA finished near breakout of 528 at last session it made high of 527 but due to mix session it could not cross resistance but it finished at 524.75 with 2% gain so buy it above 528 for target of 535-545 use stop loss of 520 MACRO NEWS SEPT. CPI INFLATION NUMBERS. (MOM)- ACTUAL:
4.41%, FORECAST: 4.49%, PREVIOUS: 3.66% AUG. IIP DATA (MOM)- ACTUAL: 6.4%, FORECAST:
5.00%, PREVIOUS: 4.2% Infosys's Q2 earnings surpassed expectations on every
parameter Monday, underpinned by better operational performance and strong revenue growth. Net profit in-creased 12.1% sequentially to Rs 3,398cr, and rupee revenue by 8.9% to Rs 15,635cr. Dollar revenue climbed 6%—the steepest in the last 16 quarters--to USD 2.392bn, and 6.9% in constant currency.
VEDL up 12%; Goldman retains buy on higher zinc prices Banks need Rs 5 lakh crore capital for Basel III norms Govt opens tap for govt securities worth $2.6 bn for FPIs Fourth phase of coal auction soon, 8-10 blocks on offer Car exports from India decline marginally to 2,67,043
units in April-September period: SIAM Hindustan Copper Limited decides to expand at the
Surda copper mine in Jharkhand GMR Infra, Japan's JGC in pact to co-develop food proc-
essing park at Kakinada SEZ Apollo Hospitals to raise up to Rs 750 crore to fund ex-
pansion Green panel okays Aurobindo Pharma's Telangana unit
expansion
STOCK RECOMMENDATIONS [FUTURE] 1. MOTHERSUMI [FUTURE]
MOTHERSUMI FUTURE cross weekly resistance of 248 and given sharp rise whole day it traded with gains at last it end with 5% gain Know 259 is also strong resistance since on RSI it has positive divergence so we advise to buy it above 259 for target of 263-267-271 use stop loss of 255.
2. SRTRANSFIN [FUTURE]
SRTRANSFIN FUTURE end with 2% gain on EOD chart it fin-ished near breakout level of 977.50 where it made pennant pattern for that we can see 10% move in up coming session since it cross 977.50 and made high of 979.85 so we advise to buy it above 980 for target of 995 1010 1030 use stop loss at 964.

DAILY REPORT
13th
OCT. 2015
YOUR MINTVISORY Call us at +91-731-6642300
FUTURE & OPTION
MOST ACTIVE CALL OPTION
Symbol Op-
tion
Type
Strike
Price
LTP Traded
Volume
(Contracts)
Open
Interest
NIFTY CE 8,300 46.40 6,16,705 54,28,800
NIFTY CE 8,400 21.70 4,76,309 34,71,950
BANKNIFTY CE 18,000 207.85 51,107 5,99,600
INFY CE 1,200 8.95 47,523 40,99,250
INFY CE 1,160 15.45 17,286 10,43,000
INFY CE 1,140 21.30 16,210 14,93,750
INFY CE 1,300 2.40 15,912 14,58,250
TCS CE 2,700 31.80 5,814 3,84,875
MOST ACTIVE PUT OPTION
Symbol Op-
tion
Type
Strike
Price
LTP Traded
Volume
(Contracts)
Open
Interest
NIFTY PE 8,000 69.80 4,53,905 45,88,025
NIFTY PE 8,100 97.50 4,49,105 46,51,250
BANKNIFTY PE 17,000 184.00 46,700 6,70,775
INFY PE 1,100 24.30 24,320 10,83,500
INFY PE 1,060 11.55 10,148 10,18,500
INFY PE 1,140 45.00 9,336 7,20,500
INFY PE 1,120 34.00 9,002 7,05,250
TATAMOTOR PE 350 8.00 3,709 6,93,000
FII DERIVATIVES STATISTICS
BUY OPEN INTEREST AT THE END OF THE DAY SELL
No. of
Contracts Amount in
Crores No. of
Contracts Amount in
Crores No. of
Contracts Amount in
Crores NET AMOUNT
INDEX FUTURES 70535 1765.07 35460 1022.4 1023802 23151.6 742.6664
INDEX OPTIONS 364549 9469.05 414983 10356.6 2212580 69205.8 -887.568
STOCK FUTURES 95862 2433.43 90776 2498.91 1797010 47200.1 -65.4877
STOCK OPTIONS 102139 2704.49 108521 2864.75 119361 3216.42 -160.258
TOTAL -370.64
STOCKS IN NEWS Yes Bank gets RBI nod for mutual fund, AMC & trustee
BHEL starts 2,730-mw power projects in 1st half of 2015-16
Aim to achieve 20-25% growth in FY16: IBULHSGFIN
HCC bags Rs 943 cr contract from BARC
IOC spend Rs 32,500cr on oil exploration, production
BHEL starts 2,730-mw power projects in first half of 2015-16
PTC India ties up with Solar Energy Corp
HUL to partner with startups to regain agility
NIFTY FUTURE
Nifty Future in last trading session remained steady to bearish. It hardly traded 100 points along the day. As Nifty is respecting the resistance 8250 since last four ses-sions it may continue it further. So again we advise you to sell Nifty Future around 8200 for the targets of 8100 and 7050 with strict stop loss of 8350
INDICES R2 R1 PIVOT S1 S2
NIFTY 8,290.00 8,216.00 8,172.00 8,099.00 8,055.00
BANK NIFTY 17,843.00 17,713.00 17,629.00 17,499.00 17,415.00

DAILY REPORT
13th
OCT. 2015
YOUR MINTVISORY Call us at +91-731-6642300
RECOMMENDATIONS
GOLD
TRADING STRATEGY:
BUY GOLD OCT ABOVE 26900 TGTS 26980,27070 SL BE-
LOW 26800
SELL GOLD OCT BELOW 26700 TGTS 26620,26530 SL
ABOVE 25800
SILVER
TRADING STRATEGY:
BUY SILVER DEC ABOVE 37100 TGTS 37100,37400 SL BE-
LOW 36600
SELL SILVER DEC BELOW 36800 TGTS 36400,36100 SL
ABOVE 36900
COMMODITY ROUNDUP Oil prices tumbled on Monday as traders took profits after last week's surge to an 11-week high, and on a report that OPEC continued to boost crude production despite a persis-tent glut. Brent crude futures LCOc1 fell 5.3% on Monday, their biggest loss in about six weeks. In Asian trade on Tues-day, they recouped about a fifth of those losses to trade at $50.45 per barrel. On the whole, investors' risk appetite has returned as they price out a chance of the U.S. Federal Re-serve raising interest rates this year. Gold surged to highest levels in more than two months fol-lowing a break above $1150 per ounce amid excellent spot market demand and rising global commodity prices. The yellow metal is witnessing good buying with the recent up-side convincing traders that a major bottom has been carved out in Gold. Idea that the US Fed is likely to go easy on the proposed rate hike is benefitting gold immensely. Meanwhile, global stocks got off to attired start to the week as global growth worries continued to dominate senti-ments. COMEX Gold is quoting at $1167 per ounce right now, up 0.87% on the day. MCX Gold futures are trading at Rs 26875 per 10 grams, up 0..95% on the day after hitting highs above Rs 26900mark in intraday moves. Gold speculator and large futures traders increased their gold bullish positions higher for a third consecutive week last week, according to the lat-est COT data released by CFTC on Friday. Meanwhile, COT report for period ending 6 October 2015 was released last week. The last week report showed that the activities of Merchants were in favor of decrease in long and increase in short positions. In case of Managed Money holders Copper long positions gained while short positions decreased. The long positions of Merchants were 25042 against 25299 on 29 Sep 2015, down 1.01%, while short po-sitions increased by 6155 to 49777 on 6 October 2015 against 43622 on 29 September 2015. Overall the net posi-tions in case of merchants are favoring shorts by 24735. CoT showed that the long positions of Money Managers decreased by 2711. The total long position of Copper for the one week period ending 6 October 2015 was 34763. Money managers short positions of Copper decreased by 5172 to 35733 on 6 October 2015. The net positions were in favor of short position holders by 970. Indian MCX Copper was trad-ing at Rs 350.90 per kg, up 0.91%. The prices tested a high of Rs 351.75 per kg and a low of Rs 348.85 per kg.

DAILY REPORT
13th
OCT. 2015
YOUR MINTVISORY Call us at +91-731-6642300
NCDEX
NCDEX ROUNDUP Bargain buying was seen in chana futures in the last trading hour of the day due to limited stocks in local mandies along with news of some government buying in pulses market. The futures prices have recovered almost 2% from their in-traday lows. Overall stocks of around 5-6 lakh tonnes of chana have been reported in local mandies against 8-9 lakh tonnes of last year in the same period. The sources also added that the demand of chana will remain buoyant in the coming days due to festive season buying. The NCDEX Nov futures added 0.85% to close at Rs 5200 per quintal. Cardamom prices moved up 0.65 per cent to Rs 851 per kg in futures trade today after speculators created positions on the back of rising demand in the spot market. Further, tight inventories in the physical market due to less arrivals from the major producing belts also supported the uptrend. At the MCX cardamom for delivery in December rose Rs 5.50, or 0.65 per cent, to Rs 851 per kg in a business turnover of 5 lots. In a similar fashion, the spice for delivery in November traded higher by Rs 5, or 0.61 per cent, to Rs 823 per kg in 91 lots. Besides rising demand in the spot market, tight sup-plies on restricted arrivals from producing belts mainly led to the rise in cardamom prices at futures trade. In a recent spurt, sugar moved sharply higher catching most tradersunawares. Sugar stocks too rallied in India after a big lag in the commodity markets. Brazil and India are the two main producers in the global market. However, India is also a major consumer of the commodity, with a surplus of only 15% which enters the global market. However, recent chain of events lined in such a way in both the producing countries leading to a sharp 30% rally in sugar prices after the commodity touched a seven-year low on August 24, 2015.
NCDEX INDICES
Index Value % Change
CAETOR SEED 3968 -1.10
CHANA 5111 +0.26
CORIANDER 12101 +4.00
COTTON SEED 1664 +1.84
GUAR SEED 4209 +1.30
JEERA 15890 +0.54
MUSTARDSEED 4822 +3.14
REF. SOY OIL 627 +0.76
TURMERIC 2745 -0.33
WHEAT 7866 +1.73
RECOMMENDATIONS
DHANIYA
BUY CORIANDER NOV ABOVE 12310 TARGET 12337 12417
SL BELOW 12283
SELL CORIANDER NOV BELOW 12230 TARGET 12203 12123
SL ABOVE 12257
GUARSGUM
BUY GUARGUM NOV ABOVE 9070 TARGET 9120 9190 SL
BELOW 9010
SELL GUARGUM NOV BELOW 8060 TARGET 8010 7940 SL
ABOVE 8120
DAILY REPORT
13th
OCT. 2015
YOUR MINTVISORY Call us at +91-731-6642300
RBI Reference Rate
Currency Rate Currency Rate
Rupee- $ 64.7260 Yen-100 53.8600
Euro 73.5999 GBP 99.2962
CURRENCY
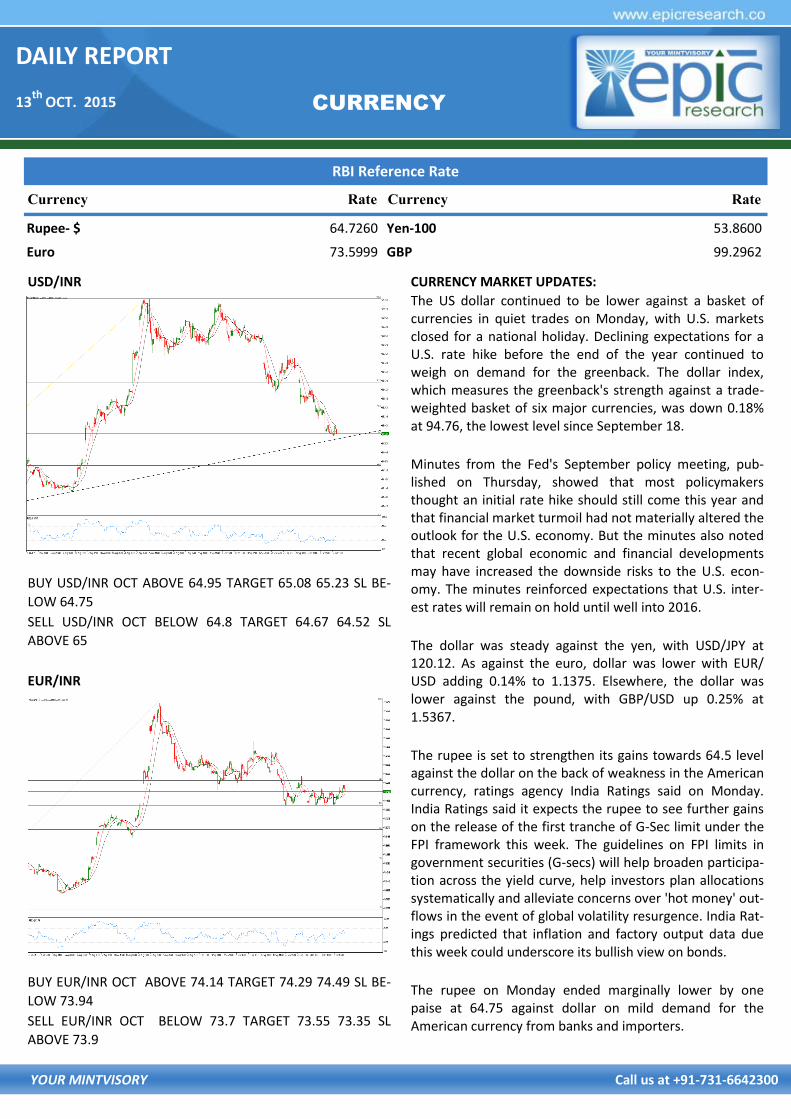
USD/INR
BUY USD/INR OCT ABOVE 64.95 TARGET 65.08 65.23 SL BE-
LOW 64.75
SELL USD/INR OCT BELOW 64.8 TARGET 64.67 64.52 SL
ABOVE 65
EUR/INR
BUY EUR/INR OCT ABOVE 74.14 TARGET 74.29 74.49 SL BE-
LOW 73.94
SELL EUR/INR OCT BELOW 73.7 TARGET 73.55 73.35 SL
ABOVE 73.9
CURRENCY MARKET UPDATES:
The US dollar continued to be lower against a basket of currencies in quiet trades on Monday, with U.S. markets closed for a national holiday. Declining expectations for a U.S. rate hike before the end of the year continued to weigh on demand for the greenback. The dollar index, which measures the greenback's strength against a trade-weighted basket of six major currencies, was down 0.18% at 94.76, the lowest level since September 18.
Minutes from the Fed's September policy meeting, pub-lished on Thursday, showed that most policymakers thought an initial rate hike should still come this year and that financial market turmoil had not materially altered the outlook for the U.S. economy. But the minutes also noted that recent global economic and financial developments may have increased the downside risks to the U.S. econ-omy. The minutes reinforced expectations that U.S. inter-est rates will remain on hold until well into 2016.
The dollar was steady against the yen, with USD/JPY at 120.12. As against the euro, dollar was lower with EUR/USD adding 0.14% to 1.1375. Elsewhere, the dollar was lower against the pound, with GBP/USD up 0.25% at 1.5367.
The rupee is set to strengthen its gains towards 64.5 level against the dollar on the back of weakness in the American currency, ratings agency India Ratings said on Monday. India Ratings said it expects the rupee to see further gains on the release of the first tranche of G-Sec limit under the FPI framework this week. The guidelines on FPI limits in government securities (G-secs) will help broaden participa-tion across the yield curve, help investors plan allocations systematically and alleviate concerns over 'hot money' out-flows in the event of global volatility resurgence. India Rat-ings predicted that inflation and factory output data due this week could underscore its bullish view on bonds.
The rupee on Monday ended marginally lower by one paise at 64.75 against dollar on mild demand for the American currency from banks and importers.
DAILY REPORT
13th
OCT. 2015
YOUR MINTVISORY Call us at +91-731-6642300
CALL REPORT
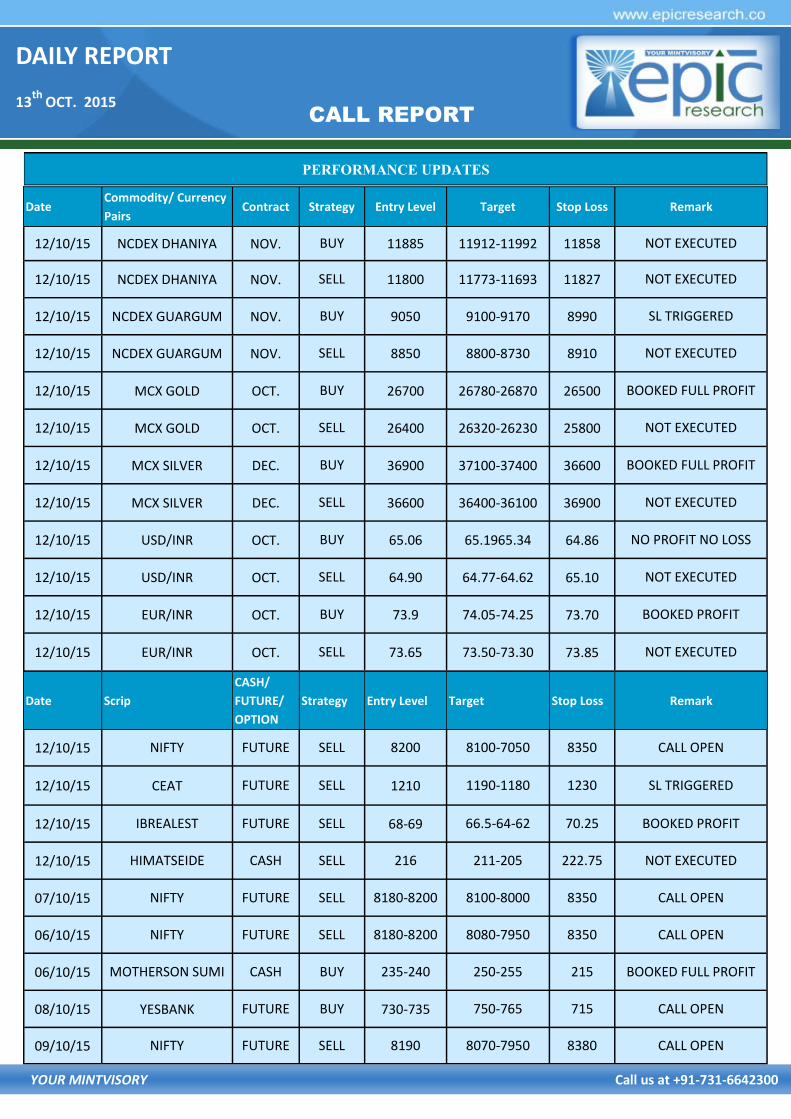
PERFORMANCE UPDATES
Date Commodity/ Currency
Pairs Contract Strategy Entry Level Target Stop Loss Remark
12/10/15 NCDEX DHANIYA NOV. BUY 11885 11912-11992 11858 NOT EXECUTED
12/10/15 NCDEX DHANIYA NOV. SELL 11800 11773-11693 11827 NOT EXECUTED
12/10/15 NCDEX GUARGUM NOV. BUY 9050 9100-9170 8990 SL TRIGGERED
12/10/15 NCDEX GUARGUM NOV. SELL 8850 8800-8730 8910 NOT EXECUTED
12/10/15 MCX GOLD OCT. BUY 26700 26780-26870 26500 BOOKED FULL PROFIT
12/10/15 MCX GOLD OCT. SELL 26400 26320-26230 25800 NOT EXECUTED
12/10/15 MCX SILVER DEC. BUY 36900 37100-37400 36600 BOOKED FULL PROFIT
12/10/15 MCX SILVER DEC. SELL 36600 36400-36100 36900 NOT EXECUTED
12/10/15 USD/INR OCT. BUY 65.06 65.1965.34 64.86 NO PROFIT NO LOSS
12/10/15 USD/INR OCT. SELL 64.90 64.77-64.62 65.10 NOT EXECUTED
12/10/15 EUR/INR OCT. BUY 73.9 74.05-74.25 73.70 BOOKED PROFIT
12/10/15 EUR/INR OCT. SELL 73.65 73.50-73.30 73.85 NOT EXECUTED
Date Scrip
CASH/
FUTURE/
OPTION
Strategy Entry Level Target Stop Loss Remark
12/10/15 NIFTY FUTURE SELL 8200 8100-7050 8350 CALL OPEN
12/10/15 CEAT FUTURE SELL 1210 1190-1180 1230 SL TRIGGERED
12/10/15 IBREALEST FUTURE SELL 68-69 66.5-64-62 70.25 BOOKED PROFIT
12/10/15 HIMATSEIDE CASH SELL 216 211-205 222.75 NOT EXECUTED
07/10/15 NIFTY FUTURE SELL 8180-8200 8100-8000 8350 CALL OPEN
06/10/15 NIFTY FUTURE SELL 8180-8200 8080-7950 8350 CALL OPEN
06/10/15 MOTHERSON SUMI CASH BUY 235-240 250-255 215 BOOKED FULL PROFIT
08/10/15 YESBANK FUTURE BUY 730-735 750-765 715 CALL OPEN
09/10/15 NIFTY FUTURE SELL 8190 8070-7950 8380 CALL OPEN
DAILY REPORT
13th
OCT. 2015
YOUR MINTVISORY Call us at +91-731-6642300
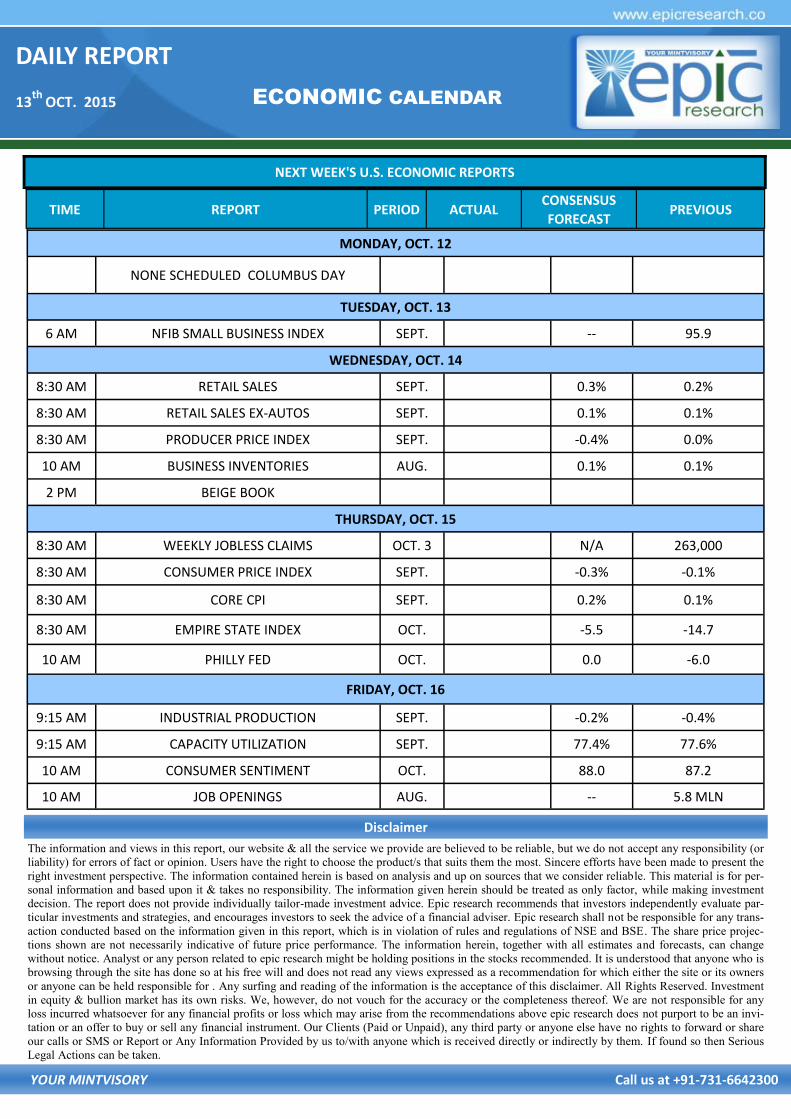
NEXT WEEK'S U.S. ECONOMIC REPORTS
ECONOMIC CALENDAR
The information and views in this report, our website & all the service we provide are believed to be reliable, but we do not accept any responsibility (or
liability) for errors of fact or opinion. Users have the right to choose the product/s that suits them the most. Sincere efforts have been made to present the
right investment perspective. The information contained herein is based on analysis and up on sources that we consider reliable. This material is for per-
sonal information and based upon it & takes no responsibility. The information given herein should be treated as only factor, while making investment
decision. The report does not provide individually tailor-made investment advice. Epic research recommends that investors independently evaluate par-
ticular investments and strategies, and encourages investors to seek the advice of a financial adviser. Epic research shall not be responsible for any trans-
action conducted based on the information given in this report, which is in violation of rules and regulations of NSE and BSE. The share price projec-
tions shown are not necessarily indicative of future price performance. The information herein, together with all estimates and forecasts, can change
without notice. Analyst or any person related to epic research might be holding positions in the stocks recommended. It is understood that anyone who is
browsing through the site has done so at his free will and does not read any views expressed as a recommendation for which either the site or its owners
or anyone can be held responsible for . Any surfing and reading of the information is the acceptance of this disclaimer. All Rights Reserved. Investment
in equity & bullion market has its own risks. We, however, do not vouch for the accuracy or the completeness thereof. We are not responsible for any
loss incurred whatsoever for any financial profits or loss which may arise from the recommendations above epic research does not purport to be an invi-
tation or an offer to buy or sell any financial instrument. Our Clients (Paid or Unpaid), any third party or anyone else have no rights to forward or share
our calls or SMS or Report or Any Information Provided by us to/with anyone which is received directly or indirectly by them. If found so then Serious
Legal Actions can be taken.
Disclaimer
TIME REPORT PERIOD ACTUAL CONSENSUS
FORECAST PREVIOUS
MONDAY, OCT. 12
NONE SCHEDULED COLUMBUS DAY
TUESDAY, OCT. 13
6 AM NFIB SMALL BUSINESS INDEX SEPT. -- 95.9
WEDNESDAY, OCT. 14
8:30 AM RETAIL SALES SEPT. 0.3% 0.2%
8:30 AM RETAIL SALES EX-AUTOS SEPT. 0.1% 0.1%
8:30 AM PRODUCER PRICE INDEX SEPT. -0.4% 0.0%
10 AM BUSINESS INVENTORIES AUG. 0.1% 0.1%
2 PM BEIGE BOOK
THURSDAY, OCT. 15
8:30 AM WEEKLY JOBLESS CLAIMS OCT. 3 N/A 263,000
8:30 AM CONSUMER PRICE INDEX SEPT. -0.3% -0.1%
8:30 AM CORE CPI SEPT. 0.2% 0.1%
8:30 AM EMPIRE STATE INDEX OCT. -5.5 -14.7
10 AM PHILLY FED OCT. 0.0 -6.0
FRIDAY, OCT. 16
9:15 AM INDUSTRIAL PRODUCTION SEPT. -0.2% -0.4%
9:15 AM CAPACITY UTILIZATION SEPT. 77.4% 77.6%
10 AM CONSUMER SENTIMENT OCT. 88.0 87.2
10 AM JOB OPENINGS AUG. -- 5.8 MLN