epidemiological and virological situation update of the ... · current epidemiological overview of...
TRANSCRIPT
Epidemiological and virological situation update of the
2010/2011 influenza season in the
WHO European Region
(Week 40/2010 to Week 03/2011)
10 February 2011

Keywords INFLUENZA, HUMAN
INFLUENZA SEASON
INFLUENZA-LIKE ILLNESS (ILI) ACUTE RESPIRATORY INFECTIONS (ARI)
SEVERE ACUTE RESPIRATORY INFECTIONS (SARI) EPIDEMIOLOGY
VIROLOGY EUROPE
Address requests about publications of the WHO Regional Office for Europe to: Publications WHO Regional Office for Europe Scherfigsvej 8 DK-2100 Copenhagen Ø, Denmark Alternatively, complete an online request form for documentation, health information, or for permission to quote or translate, on the Regional Office web site (http://www.euro.who.int/pubrequest).
© World Health Organization 2010
All rights reserved. The Regional Office for Europe of the World Health Organization welcomes requests for permission to reproduce or translate its publications, in part or in full.
The designations employed and the presentation of the material in this publication do not imply the expression of any opinion whatsoever on the part of the World Health Organization concerning the legal status of any country, territory, city or area or of its authorities, or concerning the delimitation of its frontiers or boundaries. Dotted lines on maps represent approximate border lines for which there may not yet be full agreement.
The mention of specific companies or of certain manufacturers’ products does not imply that they are endorsed or recommended by the World Health Organization in preference to others of a similar nature that are not mentioned. Errors and omissions excepted, the names of proprietary products are distinguished by initial capital letters.
All reasonable precautions have been taken by the World Health Organization to verify the information contained in this publication. However, the published material is being distributed without warranty of any kind, either express or implied. The responsibility for the interpretation and use of the material lies with the reader. In no event shall the World Health Organization be liable for damages arising from its use. The views expressed by authors, editors, or expert groups do not necessarily represent the decisions or the stated policy of the World Health Organization.
Epidemiological and virological situation update of 2010/2011 influenza season (WHO European Region)
page 1
CONTENTS
Page
Authors…….…………………………………………………………………………………………………………...…….2 Introduction…………………………………………………………………………………………………………...…….3 Current epidemiological overview of the 2010/2011 influenza season……………………………...…3 Sentinel ILI/ARI data ……….……………………………………………………..…………………..…………3
Sentinel data on hospitalised Severe Acute Respiratory Infections (SARI)…….……………….7
Risk factors for severe disease 2010/2011……………………………..………………………….….…..8 Current virological overview of the 2010/2011 influenza season…………….…………………………..9
Sentinel ILI/ARI data …..……………………………………………………….………………………………...9
Non-sentinel virological data ....…………………………………………………….………………………...13
Sentinel data on hospitalised SARI ......………………………………………….…………………….…..14 Antigenic and genetic characterizations ……..……….……………………………………………..…….15 Conclusions………………………………………………………………………………………….……………….….....17
Epidemiological and virological situation update of 2010/2011 influenza season (WHO European Region)
page 2
Authors
WHO Regional Office for Europe
Joshua A. Mott, Dmitriy Pereyaslov, Pernille Jorgensen, Caroline Sarah Brown
Temporary Advisers to WHO Liana Martiryosan, Tamara Meerhoff
Abstract This overview of influenza data from the WHO European Region from weeks 40/2010 through week 3/2011 has been submitted for consideration during the WHO Northern Hemisphere Vaccine Strain
Selection Meeting, to be held on 14-17 February, 2011, in Geneva. The 2010/2011 influenza season
arrived 8-10 weeks later than the 2009/2010 ‘pandemic’ season in the WHO European Region, but still quite early compared to historical trends. As has been observed in several previous years, the 2010/2011
influenza season appears to be progressing in a West to East fashion across much of Europe. Increases in influenza activity have been accompanied by increases in hospitalised Severe Acute Respiratory
infections (SARI) and in severe influenza cases admitted to intensive care units. Pandemic influenza A (H1N1) 2009 viruses are the predominant circulating viruses but in contrast to the 2009/2010 season,
there is a higher rate of co-circulation with influenza B viruses and a substantial decrease in the
proportion of influenza A(H3N2) viruses. Currently, 98% of antigenically characterized viruses from the 2010/2011 influenza season correspond with the viruses recommended by WHO for inclusion in the 2010-
2011 northern hemisphere influenza vaccine.
Epidemiological and virological situation update of 2010/2011 influenza season (WHO European Region)
page 3
Introduction
The WHO Regional Office for Europe, in coordination with the European Centre for Disease Prevention
and Control, works with the 53 countries of the WHO European Region to provide a weekly bulletin describing influenza activity in the Region1. Influenza surveillance has traditionally centered on
epidemiological data collection for outpatient influenza-like illness (ILI) and acute respiratory infections (ARI) from sentinel sites backed up by laboratory-based generation of virological data. More recently,
European Member States are establishing sentinel SARI influenza surveillance systems in order to
routinely monitor severe influenza. The laboratory network in Europe consists of WHO-recognized national influenza centres (NICs), many of which participate in the Community Network of Reference
Laboratories for Human Influenza in Europe 2, a WHO collaborating centre for reference and research on influenza (WHO CC) and two WHO H5 reference laboratories3. Many of the data included in this report
are publicly available at www.euroflu.org, where WHO/Europe publishes a weekly surveillance report in English and Russian that is based on data covering the Region’s total population of 883 million.
This overview has been submitted for consideration during the WHO Northern Hemisphere Vaccine Strain Selection Meeting, to be held on 14-17 February, 2011. It complements the data generated by the WHO
collaborating centre for reference and research on influenza, NIMR, London, United Kingdom, from analyses performed on influenza viruses provided by European Member States.
Current epidemiological overview of the 2010/2011 influenza season Sentinel ILI/ARI data
The 2010/2011 influenza season arrived 8-10 weeks later than the 2009/2010 season in the WHO
European Region. During 2010/2011, pandemic influenza A (H1N1) 2009 continues to predominate among circulating influenza A viruses in Europe. A noticeable difference from the 2009/2010 season has
been the high prevalence Influenza B co-circulation. One measure of the intensity of influenza activity is the percentage of sentinel specimens that test positive for influenza, (represented by the black line on
the following graphs, in relation to the right axes).
1 http://www.euroflu.org; http://www.ecdc.europa.eu/en/healthtopics/influenza/epidemiological_data/Pages/Weekly_Influenza_Surveillance_Overview.aspx 2 http://www.ecdc.europa.eu/en/activities/surveillance/EISN/Pages/AbouttheNetwork_Description.aspx 3 http://www.who.int/csr/disease/influenza/mission/en/index.html;
Epidemiological and virological situation update of 2010/2011 influenza season (WHO European Region)
page 4
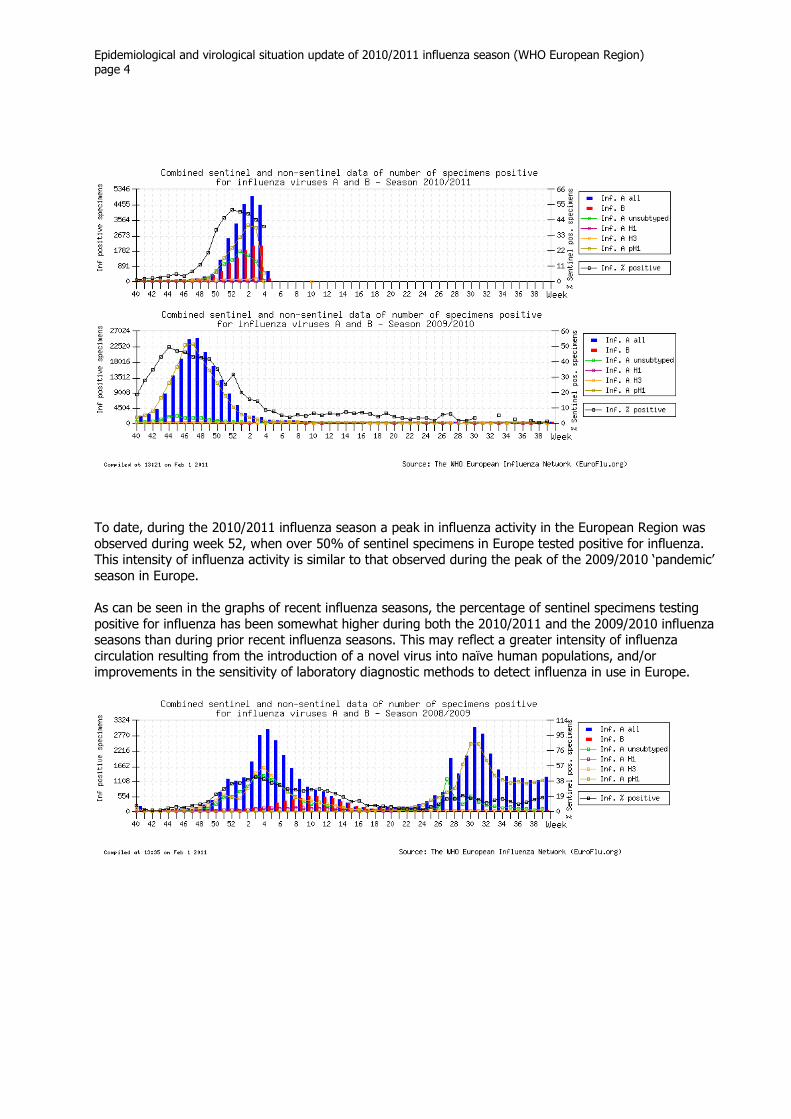
To date, during the 2010/2011 influenza season a peak in influenza activity in the European Region was
observed during week 52, when over 50% of sentinel specimens in Europe tested positive for influenza. This intensity of influenza activity is similar to that observed during the peak of the 2009/2010 ‘pandemic’
season in Europe.
As can be seen in the graphs of recent influenza seasons, the percentage of sentinel specimens testing
positive for influenza has been somewhat higher during both the 2010/2011 and the 2009/2010 influenza seasons than during prior recent influenza seasons. This may reflect a greater intensity of influenza
circulation resulting from the introduction of a novel virus into naïve human populations, and/or improvements in the sensitivity of laboratory diagnostic methods to detect influenza in use in Europe.

Epidemiological and virological situation update of 2010/2011 influenza season (WHO European Region)
page 5
While the currently observed peak intensity of influenza activity during this season did not occur as early
as was experienced during the 2009/2010 season, it has occurred relatively early by European standards. During recent prior influenza seasons, peaks in the intensity of influenza activity have typically been
observed between weeks 2 and 6. The current peak during week 52/2010, however, bears some
similarity to the 2003/2004 influenza season, which was notable for the circulation of the “Fujian” A (H3N2) virus.
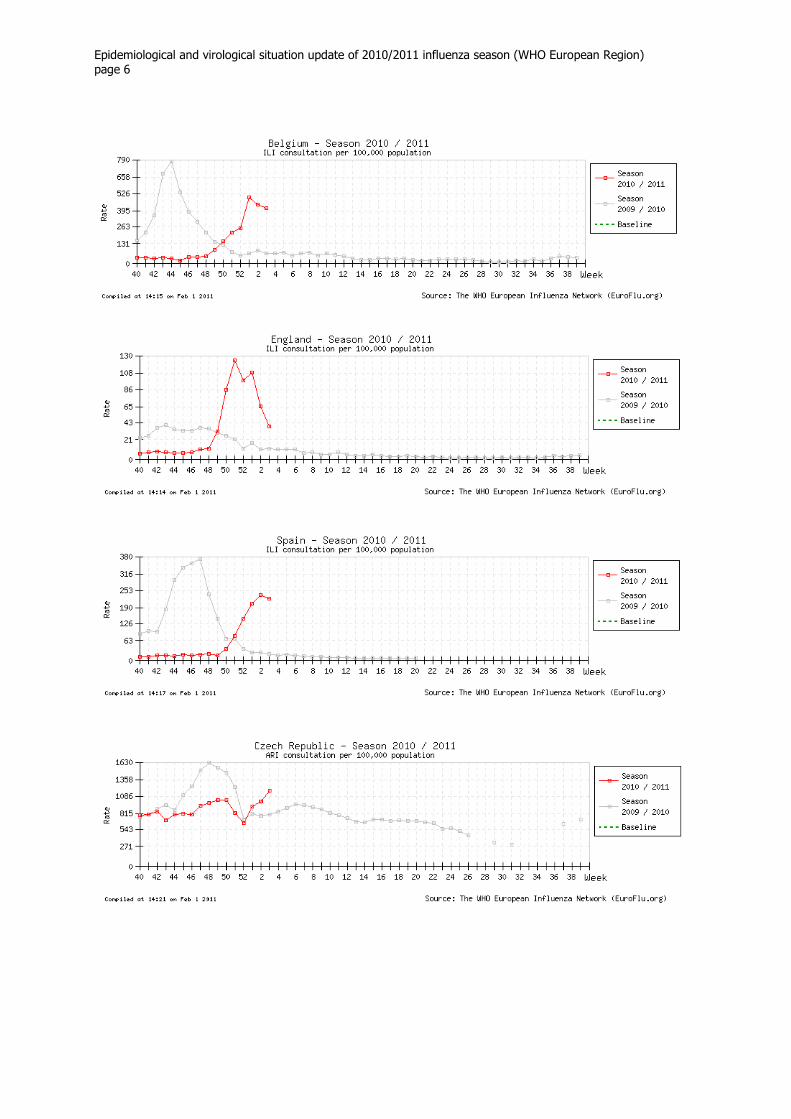
It must be noted that the presentation of data for the combined 53 countries of the WHO European
Region masks considerable variability in the progression of the influenza season across the Region. As observed in 2008/2009, 2009/2010, and several prior years, the 2010/2011 influenza season appears to
be generally progressing in a West to East fashion across much of Europe. This can be seen below in the pattern of observed ILI and ARI consultation rates by country.
Currently clinical consultation rates for ILI or ARI vary considerably between countries, and are related to
the prevalence of influenza in the population, the prevalence of other respiratory pathogens in the
population, and public anxiety regarding influenza.
Epidemiological and virological situation update of 2010/2011 influenza season (WHO European Region)
page 6
a.
b. Hospitalisations for severe acute respiratory illness c. Epidemiology of severe influenza virus infections
2. Virological Overview a. Virological detections from sentinel ILI/ARI patients
Epidemiological and virological situation update of 2010/2011 influenza season (WHO European Region)
page 7
¨
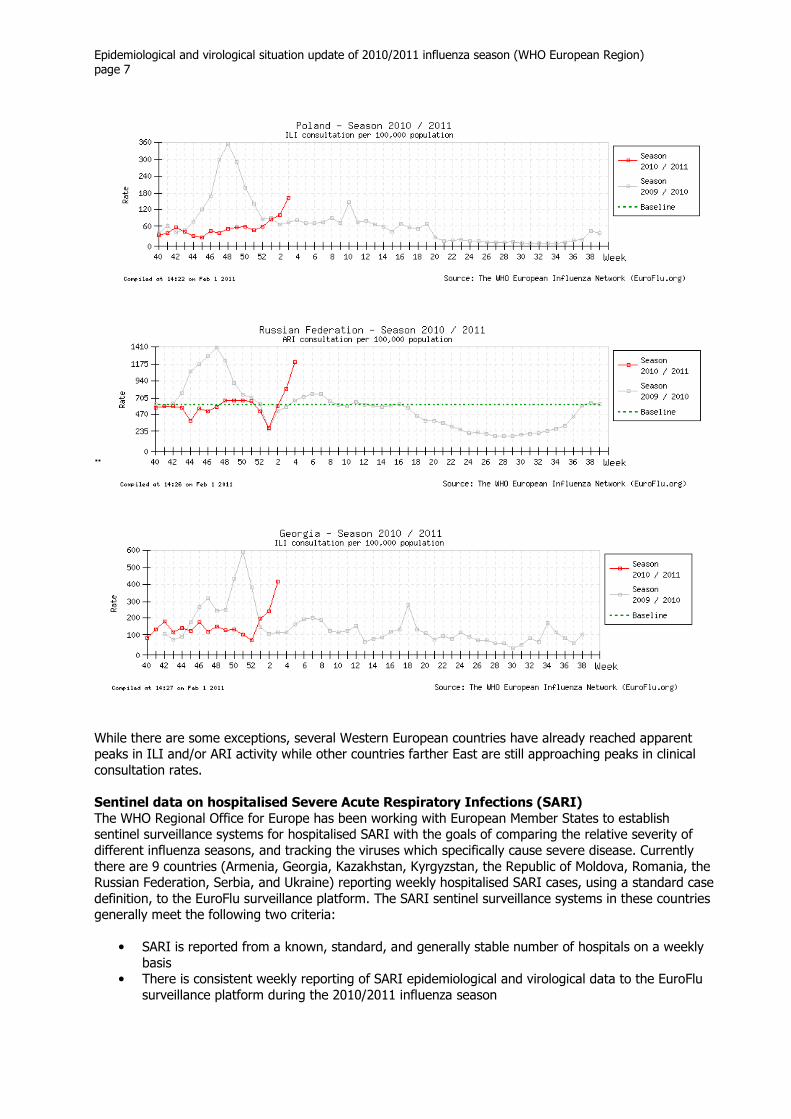
While there are some exceptions, several Western European countries have already reached apparent peaks in ILI and/or ARI activity while other countries farther East are still approaching peaks in clinical
consultation rates.
Sentinel data on hospitalised Severe Acute Respiratory Infections (SARI)
The WHO Regional Office for Europe has been working with European Member States to establish sentinel surveillance systems for hospitalised SARI with the goals of comparing the relative severity of
different influenza seasons, and tracking the viruses which specifically cause severe disease. Currently
there are 9 countries (Armenia, Georgia, Kazakhstan, Kyrgyzstan, the Republic of Moldova, Romania, the Russian Federation, Serbia, and Ukraine) reporting weekly hospitalised SARI cases, using a standard case
definition, to the EuroFlu surveillance platform. The SARI sentinel surveillance systems in these countries generally meet the following two criteria:
• SARI is reported from a known, standard, and generally stable number of hospitals on a weekly
basis • There is consistent weekly reporting of SARI epidemiological and virological data to the EuroFlu
surveillance platform during the 2010/2011 influenza season
Epidemiological and virological situation update of 2010/2011 influenza season (WHO European Region)
page 8
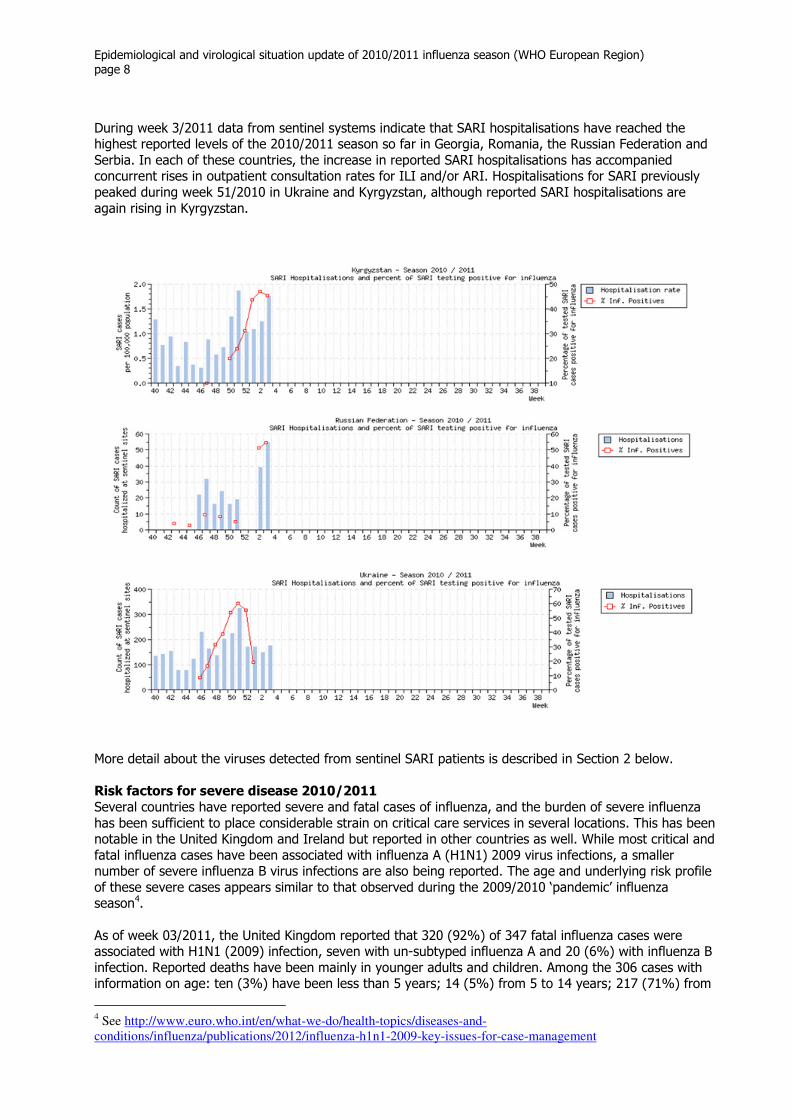
During week 3/2011 data from sentinel systems indicate that SARI hospitalisations have reached the highest reported levels of the 2010/2011 season so far in Georgia, Romania, the Russian Federation and
Serbia. In each of these countries, the increase in reported SARI hospitalisations has accompanied concurrent rises in outpatient consultation rates for ILI and/or ARI. Hospitalisations for SARI previously
peaked during week 51/2010 in Ukraine and Kyrgyzstan, although reported SARI hospitalisations are
again rising in Kyrgyzstan.
More detail about the viruses detected from sentinel SARI patients is described in Section 2 below.
Risk factors for severe disease 2010/2011
Several countries have reported severe and fatal cases of influenza, and the burden of severe influenza
has been sufficient to place considerable strain on critical care services in several locations. This has been notable in the United Kingdom and Ireland but reported in other countries as well. While most critical and
fatal influenza cases have been associated with influenza A (H1N1) 2009 virus infections, a smaller number of severe influenza B virus infections are also being reported. The age and underlying risk profile
of these severe cases appears similar to that observed during the 2009/2010 ‘pandemic’ influenza season4.
As of week 03/2011, the United Kingdom reported that 320 (92%) of 347 fatal influenza cases were associated with H1N1 (2009) infection, seven with un-subtyped influenza A and 20 (6%) with influenza B
infection. Reported deaths have been mainly in younger adults and children. Among the 306 cases with information on age: ten (3%) have been less than 5 years; 14 (5%) from 5 to 14 years; 217 (71%) from
4 See http://www.euro.who.int/en/what-we-do/health-topics/diseases-and-conditions/influenza/publications/2012/influenza-h1n1-2009-key-issues-for-case-management

Epidemiological and virological situation update of 2010/2011 influenza season (WHO European Region)
page 9
15 to 64 years and 65 (21%) older than 64 years of age. One hundred and eighty-four of 252 fatal cases with available information (73%) were in defined clinical risk groups for vaccination. The leading reported
clinical risk factors for those with information were underlying respiratory disease including asthma (n=49) and immunosuppression (n=43). Of cases with available information on immunisation history, 82
of 108 (76%) cases had not received the 2010/11 trivalent influenza vaccine this season. Thirty-nine of
41 (95%) of cases with available information had not received the monovalent pandemic influenza vaccine last season.i
In Ireland sixty‐nine of 98 (70.4%) hospitalised influenza cases in critical care have underlying medical
conditions, 62 adults and seven paediatric cases. The underlying medical conditions include: chronic
respiratory disease, chronic heart disease, immunosuppression, pregnancy, metabolic disorders and morbid obesity. Age-specific rates of ICU admissions in Ireland appear highest in the youngest ages, and
then increase again in adulthood with a peak in the 55-64 year age group.ii
Current virological overview of the 2010/2011 influenza season The tables that follow describe the influenza viruses that have been circulating in the WHO European Region during the 2010/2011 influenza season. Virological data from sentinel ILI/ARI surveillance
systems, non-sentinel virological surveillance systems, and sentinel surveillance systems for hospitalised
SARI are presented in turn.
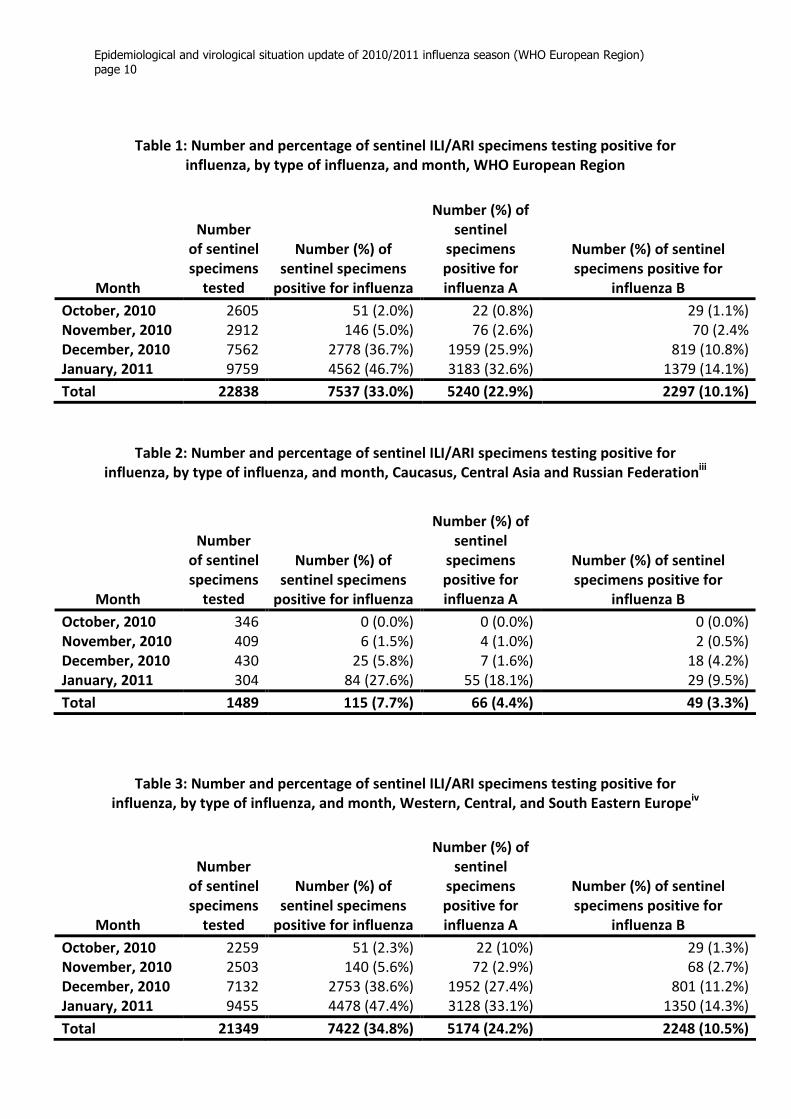
Sentinel ILI/ARI data Tables 1-3 present the number and percentage of sentinel ILI/ARI specimens testing positive for
influenza, by type of influenza, and month of the current influenza season. Table 1 presents the data for the entire WHO European Region and Tables 2 and 3 present stratified data for i) countries of Eastern
Europe, namely the Caucasus, Central Asia and the Russian Federation, and ii) countries of Western,
Central, and South Eastern Europe, respectively. The specific countries included in each of these groupings may be found in the endnote to this document.
Epidemiological and virological situation update of 2010/2011 influenza season (WHO European Region)
page 10
Table 1: Number and percentage of sentinel ILI/ARI specimens testing positive for
influenza, by type of influenza, and month, WHO European Region
Table 2: Number and percentage of sentinel ILI/ARI specimens testing positive for
influenza, by type of influenza, and month, Caucasus, Central Asia and Russian Federationiii
Table 3: Number and percentage of sentinel ILI/ARI specimens testing positive for
influenza, by type of influenza, and month, Western, Central, and South Eastern Europeiv
Month
Number
of sentinel
specimens
tested
Number (%) of
sentinel specimens
positive for influenza
Number (%) of
sentinel
specimens
positive for
influenza A
Number (%) of sentinel
specimens positive for
influenza B
October, 2010 2605 51 (2.0%) 22 (0.8%) 29 (1.1%)
November, 2010 2912 146 (5.0%) 76 (2.6%) 70 (2.4%
December, 2010 7562 2778 (36.7%) 1959 (25.9%) 819 (10.8%)
January, 2011 9759 4562 (46.7%) 3183 (32.6%) 1379 (14.1%)
Total 22838 7537 (33.0%) 5240 (22.9%) 2297 (10.1%)
Month
Number
of sentinel
specimens
tested
Number (%) of
sentinel specimens
positive for influenza
Number (%) of
sentinel
specimens
positive for
influenza A
Number (%) of sentinel
specimens positive for
influenza B
October, 2010 346 0 (0.0%) 0 (0.0%) 0 (0.0%)
November, 2010 409 6 (1.5%) 4 (1.0%) 2 (0.5%)
December, 2010 430 25 (5.8%) 7 (1.6%) 18 (4.2%)
January, 2011 304 84 (27.6%) 55 (18.1%) 29 (9.5%)
Total 1489 115 (7.7%) 66 (4.4%) 49 (3.3%)
Month
Number
of sentinel
specimens
tested
Number (%) of
sentinel specimens
positive for influenza
Number (%) of
sentinel
specimens
positive for
influenza A
Number (%) of sentinel
specimens positive for
influenza B
October, 2010 2259 51 (2.3%) 22 (10%) 29 (1.3%)
November, 2010 2503 140 (5.6%) 72 (2.9%) 68 (2.7%)
December, 2010 7132 2753 (38.6%) 1952 (27.4%) 801 (11.2%)
January, 2011 9455 4478 (47.4%) 3128 (33.1%) 1350 (14.3%)
Total 21349 7422 (34.8%) 5174 (24.2%) 2248 (10.5%)
Epidemiological and virological situation update of 2010/2011 influenza season (WHO European Region)
page 11
Notable increases in the intensity of both influenza A and B circulation occurred during December 2010, and then further increased in January 2011. Consistent with the epidemiological data on ILI/ARI
consultation rates, a pronounced start of the influenza season was observed in December 2010 in the countries of Western, Central, and South Eastern Europe and in January 2011 in the Caucasus, Central
Asia, and the Russian Federation. Although more sentinel specimens have been collected and tested in
the countries of Western, Central, and South Eastern Europe, a relative predominance of influenza A over influenza B is being observed across the WHO European Region.
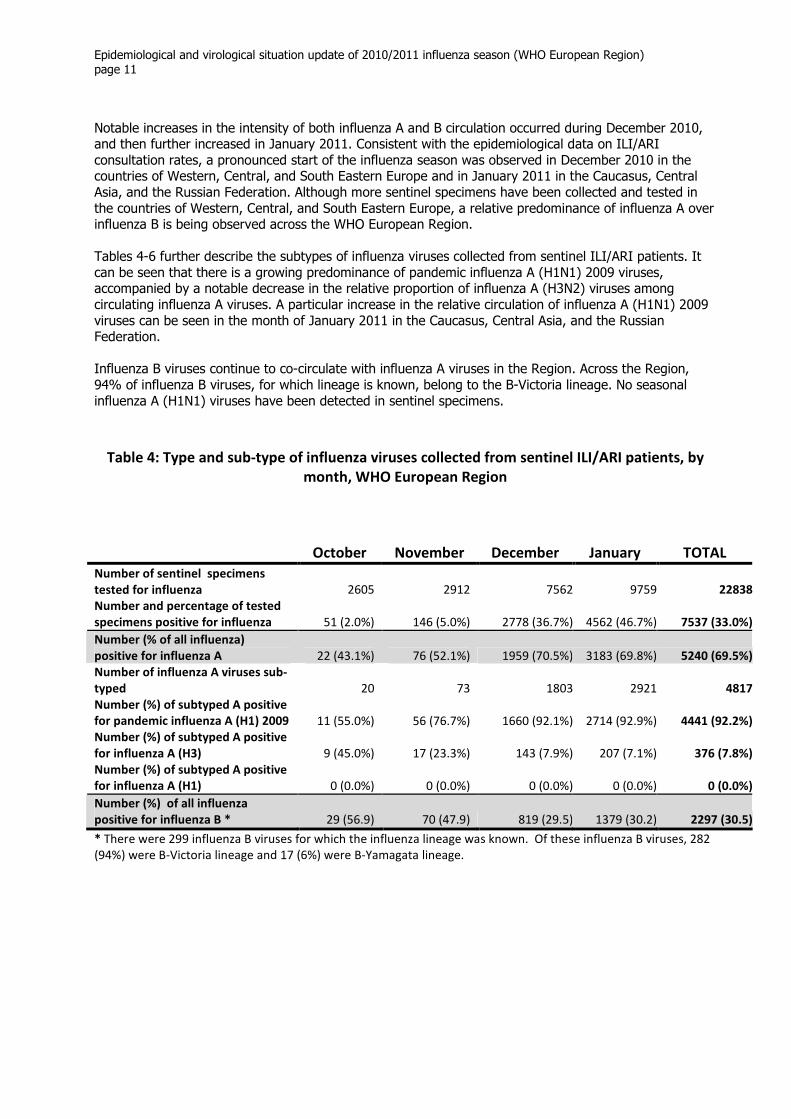
Tables 4-6 further describe the subtypes of influenza viruses collected from sentinel ILI/ARI patients. It
can be seen that there is a growing predominance of pandemic influenza A (H1N1) 2009 viruses, accompanied by a notable decrease in the relative proportion of influenza A (H3N2) viruses among
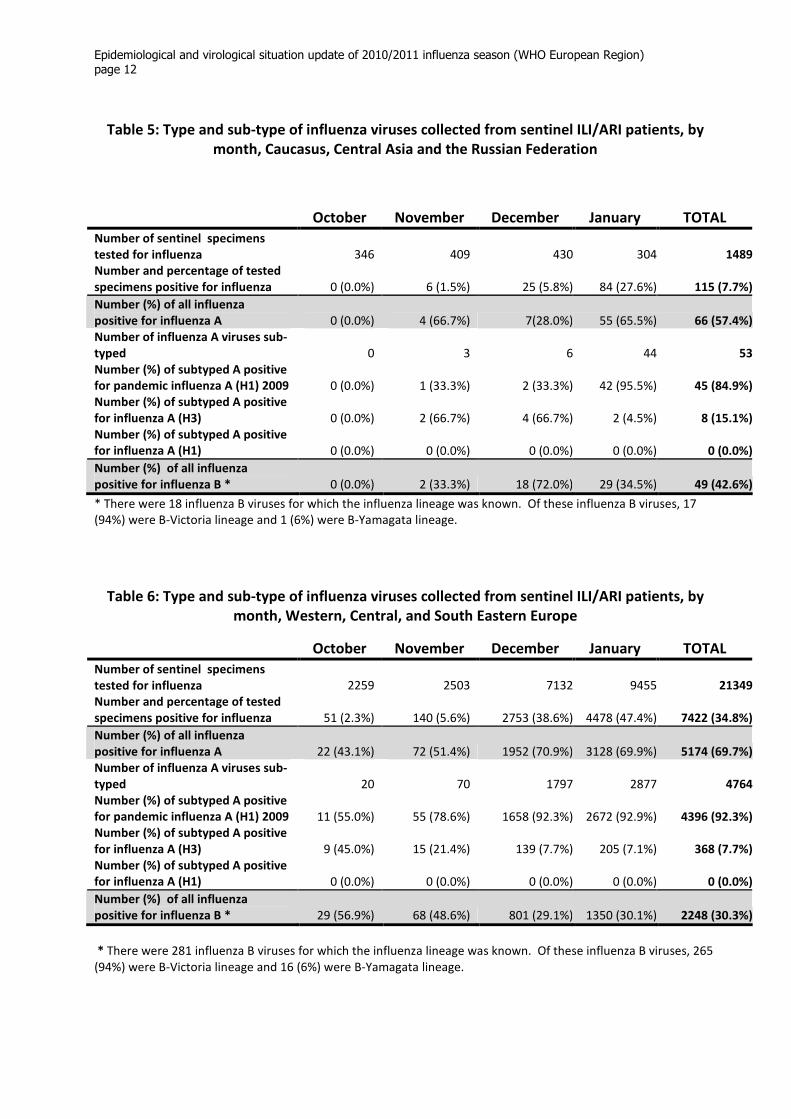
circulating influenza A viruses. A particular increase in the relative circulation of influenza A (H1N1) 2009
viruses can be seen in the month of January 2011 in the Caucasus, Central Asia, and the Russian Federation.
Influenza B viruses continue to co-circulate with influenza A viruses in the Region. Across the Region,
94% of influenza B viruses, for which lineage is known, belong to the B-Victoria lineage. No seasonal
influenza A (H1N1) viruses have been detected in sentinel specimens.
Table 4: Type and sub-type of influenza viruses collected from sentinel ILI/ARI patients, by
month, WHO European Region
* There were 299 influenza B viruses for which the influenza lineage was known. Of these influenza B viruses, 282
(94%) were B‐Victoria lineage and 17 (6%) were B‐Yamagata lineage.
October November December January TOTAL
Number of sentinel specimens
tested for influenza 2605 2912 7562 9759 22838
Number and percentage of tested
specimens positive for influenza 51 (2.0%) 146 (5.0%) 2778 (36.7%) 4562 (46.7%) 7537 (33.0%)
Number (% of all influenza)
positive for influenza A 22 (43.1%) 76 (52.1%) 1959 (70.5%) 3183 (69.8%) 5240 (69.5%)
Number of influenza A viruses sub-
typed 20 73 1803 2921 4817
Number (%) of subtyped A positive
for pandemic influenza A (H1) 2009 11 (55.0%) 56 (76.7%) 1660 (92.1%) 2714 (92.9%) 4441 (92.2%)
Number (%) of subtyped A positive
for influenza A (H3) 9 (45.0%) 17 (23.3%) 143 (7.9%) 207 (7.1%) 376 (7.8%)
Number (%) of subtyped A positive
for influenza A (H1) 0 (0.0%) 0 (0.0%) 0 (0.0%) 0 (0.0%) 0 (0.0%)
Number (%) of all influenza
positive for influenza B * 29 (56.9) 70 (47.9) 819 (29.5) 1379 (30.2) 2297 (30.5)
Epidemiological and virological situation update of 2010/2011 influenza season (WHO European Region)
page 12
Table 5: Type and sub-type of influenza viruses collected from sentinel ILI/ARI patients, by
month, Caucasus, Central Asia and the Russian Federation
* There were 18 influenza B viruses for which the influenza lineage was known. Of these influenza B viruses, 17
(94%) were B‐Victoria lineage and 1 (6%) were B‐Yamagata lineage.
Table 6: Type and sub-type of influenza viruses collected from sentinel ILI/ARI patients, by
month, Western, Central, and South Eastern Europe
* There were 281 influenza B viruses for which the influenza lineage was known. Of these influenza B viruses, 265
(94%) were B‐Victoria lineage and 16 (6%) were B‐Yamagata lineage.
October November December January TOTAL
Number of sentinel specimens
tested for influenza 346 409 430 304 1489
Number and percentage of tested
specimens positive for influenza 0 (0.0%) 6 (1.5%) 25 (5.8%) 84 (27.6%) 115 (7.7%)
Number (%) of all influenza
positive for influenza A 0 (0.0%) 4 (66.7%) 7(28.0%) 55 (65.5%) 66 (57.4%)
Number of influenza A viruses sub-
typed 0 3 6 44 53
Number (%) of subtyped A positive
for pandemic influenza A (H1) 2009 0 (0.0%) 1 (33.3%) 2 (33.3%) 42 (95.5%) 45 (84.9%)
Number (%) of subtyped A positive
for influenza A (H3) 0 (0.0%) 2 (66.7%) 4 (66.7%) 2 (4.5%) 8 (15.1%)
Number (%) of subtyped A positive
for influenza A (H1) 0 (0.0%) 0 (0.0%) 0 (0.0%) 0 (0.0%) 0 (0.0%)
Number (%) of all influenza
positive for influenza B * 0 (0.0%) 2 (33.3%) 18 (72.0%) 29 (34.5%) 49 (42.6%)
October November December January TOTAL
Number of sentinel specimens
tested for influenza 2259 2503 7132 9455 21349
Number and percentage of tested
specimens positive for influenza 51 (2.3%) 140 (5.6%) 2753 (38.6%) 4478 (47.4%) 7422 (34.8%)
Number (%) of all influenza
positive for influenza A 22 (43.1%) 72 (51.4%) 1952 (70.9%) 3128 (69.9%) 5174 (69.7%)
Number of influenza A viruses sub-
typed 20 70 1797 2877 4764
Number (%) of subtyped A positive
for pandemic influenza A (H1) 2009 11 (55.0%) 55 (78.6%) 1658 (92.3%) 2672 (92.9%) 4396 (92.3%)
Number (%) of subtyped A positive
for influenza A (H3) 9 (45.0%) 15 (21.4%) 139 (7.7%) 205 (7.1%) 368 (7.7%)
Number (%) of subtyped A positive
for influenza A (H1) 0 (0.0%) 0 (0.0%) 0 (0.0%) 0 (0.0%) 0 (0.0%)
Number (%) of all influenza
positive for influenza B * 29 (56.9%) 68 (48.6%) 801 (29.1%) 1350 (30.1%) 2248 (30.3%)
Epidemiological and virological situation update of 2010/2011 influenza season (WHO European Region)
page 13
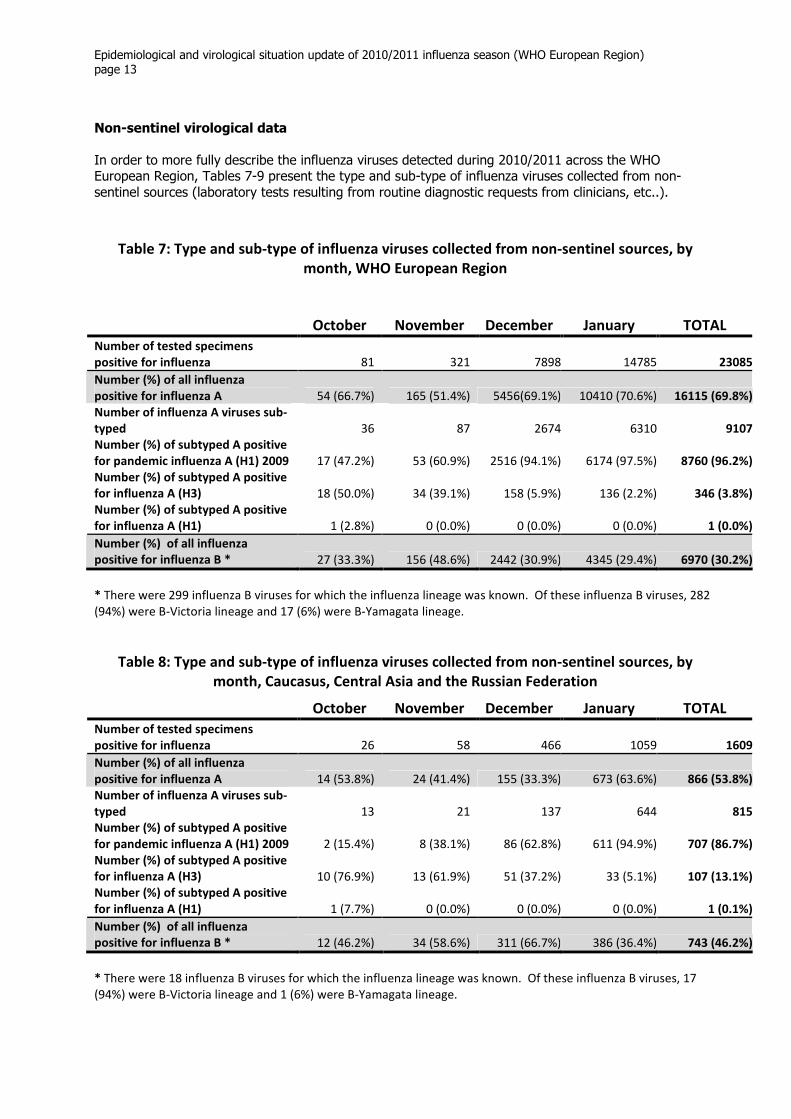
Non-sentinel virological data
In order to more fully describe the influenza viruses detected during 2010/2011 across the WHO European Region, Tables 7-9 present the type and sub-type of influenza viruses collected from non-
sentinel sources (laboratory tests resulting from routine diagnostic requests from clinicians, etc..).
Table 7: Type and sub-type of influenza viruses collected from non-sentinel sources, by
month, WHO European Region
* There were 299 influenza B viruses for which the influenza lineage was known. Of these influenza B viruses, 282
(94%) were B‐Victoria lineage and 17 (6%) were B‐Yamagata lineage.
Table 8: Type and sub-type of influenza viruses collected from non-sentinel sources, by
month, Caucasus, Central Asia and the Russian Federation
* There were 18 influenza B viruses for which the influenza lineage was known. Of these influenza B viruses, 17
(94%) were B‐Victoria lineage and 1 (6%) were B‐Yamagata lineage.
October November December January TOTAL
Number of tested specimens
positive for influenza 81 321 7898 14785 23085
Number (%) of all influenza
positive for influenza A 54 (66.7%) 165 (51.4%) 5456(69.1%) 10410 (70.6%) 16115 (69.8%)
Number of influenza A viruses sub-
typed 36 87 2674 6310 9107
Number (%) of subtyped A positive
for pandemic influenza A (H1) 2009 17 (47.2%) 53 (60.9%) 2516 (94.1%) 6174 (97.5%) 8760 (96.2%)
Number (%) of subtyped A positive
for influenza A (H3) 18 (50.0%) 34 (39.1%) 158 (5.9%) 136 (2.2%) 346 (3.8%)
Number (%) of subtyped A positive
for influenza A (H1) 1 (2.8%) 0 (0.0%) 0 (0.0%) 0 (0.0%) 1 (0.0%)
Number (%) of all influenza
positive for influenza B * 27 (33.3%) 156 (48.6%) 2442 (30.9%) 4345 (29.4%) 6970 (30.2%)
October November December January TOTAL
Number of tested specimens
positive for influenza 26 58 466 1059 1609
Number (%) of all influenza
positive for influenza A 14 (53.8%) 24 (41.4%) 155 (33.3%) 673 (63.6%) 866 (53.8%)
Number of influenza A viruses sub-
typed 13 21 137 644 815
Number (%) of subtyped A positive
for pandemic influenza A (H1) 2009 2 (15.4%) 8 (38.1%) 86 (62.8%) 611 (94.9%) 707 (86.7%)
Number (%) of subtyped A positive
for influenza A (H3) 10 (76.9%) 13 (61.9%) 51 (37.2%) 33 (5.1%) 107 (13.1%)
Number (%) of subtyped A positive
for influenza A (H1) 1 (7.7%) 0 (0.0%) 0 (0.0%) 0 (0.0%) 1 (0.1%)
Number (%) of all influenza
positive for influenza B * 12 (46.2%) 34 (58.6%) 311 (66.7%) 386 (36.4%) 743 (46.2%)
Epidemiological and virological situation update of 2010/2011 influenza season (WHO European Region)
page 14
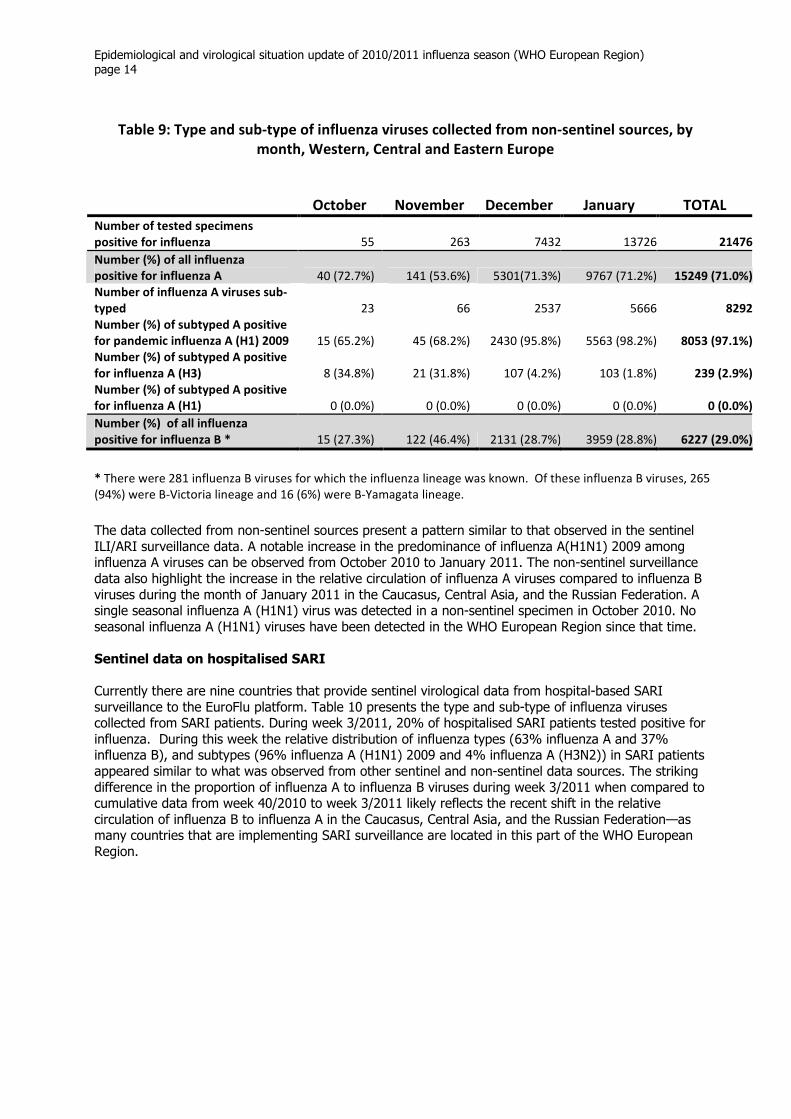
Table 9: Type and sub-type of influenza viruses collected from non-sentinel sources, by
month, Western, Central and Eastern Europe
* There were 281 influenza B viruses for which the influenza lineage was known. Of these influenza B viruses, 265
(94%) were B‐Victoria lineage and 16 (6%) were B‐Yamagata lineage.
The data collected from non-sentinel sources present a pattern similar to that observed in the sentinel
ILI/ARI surveillance data. A notable increase in the predominance of influenza A(H1N1) 2009 among influenza A viruses can be observed from October 2010 to January 2011. The non-sentinel surveillance
data also highlight the increase in the relative circulation of influenza A viruses compared to influenza B
viruses during the month of January 2011 in the Caucasus, Central Asia, and the Russian Federation. A single seasonal influenza A (H1N1) virus was detected in a non-sentinel specimen in October 2010. No
seasonal influenza A (H1N1) viruses have been detected in the WHO European Region since that time.
Sentinel data on hospitalised SARI
Currently there are nine countries that provide sentinel virological data from hospital-based SARI
surveillance to the EuroFlu platform. Table 10 presents the type and sub-type of influenza viruses collected from SARI patients. During week 3/2011, 20% of hospitalised SARI patients tested positive for
influenza. During this week the relative distribution of influenza types (63% influenza A and 37% influenza B), and subtypes (96% influenza A (H1N1) 2009 and 4% influenza A (H3N2)) in SARI patients
appeared similar to what was observed from other sentinel and non-sentinel data sources. The striking
difference in the proportion of influenza A to influenza B viruses during week 3/2011 when compared to cumulative data from week 40/2010 to week 3/2011 likely reflects the recent shift in the relative
circulation of influenza B to influenza A in the Caucasus, Central Asia, and the Russian Federation—as many countries that are implementing SARI surveillance are located in this part of the WHO European
Region.
October November December January TOTAL
Number of tested specimens
positive for influenza 55 263 7432 13726 21476
Number (%) of all influenza
positive for influenza A 40 (72.7%) 141 (53.6%) 5301(71.3%) 9767 (71.2%) 15249 (71.0%)
Number of influenza A viruses sub-
typed 23 66 2537 5666 8292
Number (%) of subtyped A positive
for pandemic influenza A (H1) 2009 15 (65.2%) 45 (68.2%) 2430 (95.8%) 5563 (98.2%) 8053 (97.1%)
Number (%) of subtyped A positive
for influenza A (H3) 8 (34.8%) 21 (31.8%) 107 (4.2%) 103 (1.8%) 239 (2.9%)
Number (%) of subtyped A positive
for influenza A (H1) 0 (0.0%) 0 (0.0%) 0 (0.0%) 0 (0.0%) 0 (0.0%)
Number (%) of all influenza
positive for influenza B * 15 (27.3%) 122 (46.4%) 2131 (28.7%) 3959 (28.8%) 6227 (29.0%)

Epidemiological and virological situation update of 2010/2011 influenza season (WHO European Region)
page 15
Table 10: Type and sub-type of influenza viruses collected from hospitalised SARI patients,
week 40/2010 to week 3/2011, WHO European Regionv
* There were 19 influenza B viruses for which the influenza lineage was known. All 19 were of the B‐Victoria
lineage.
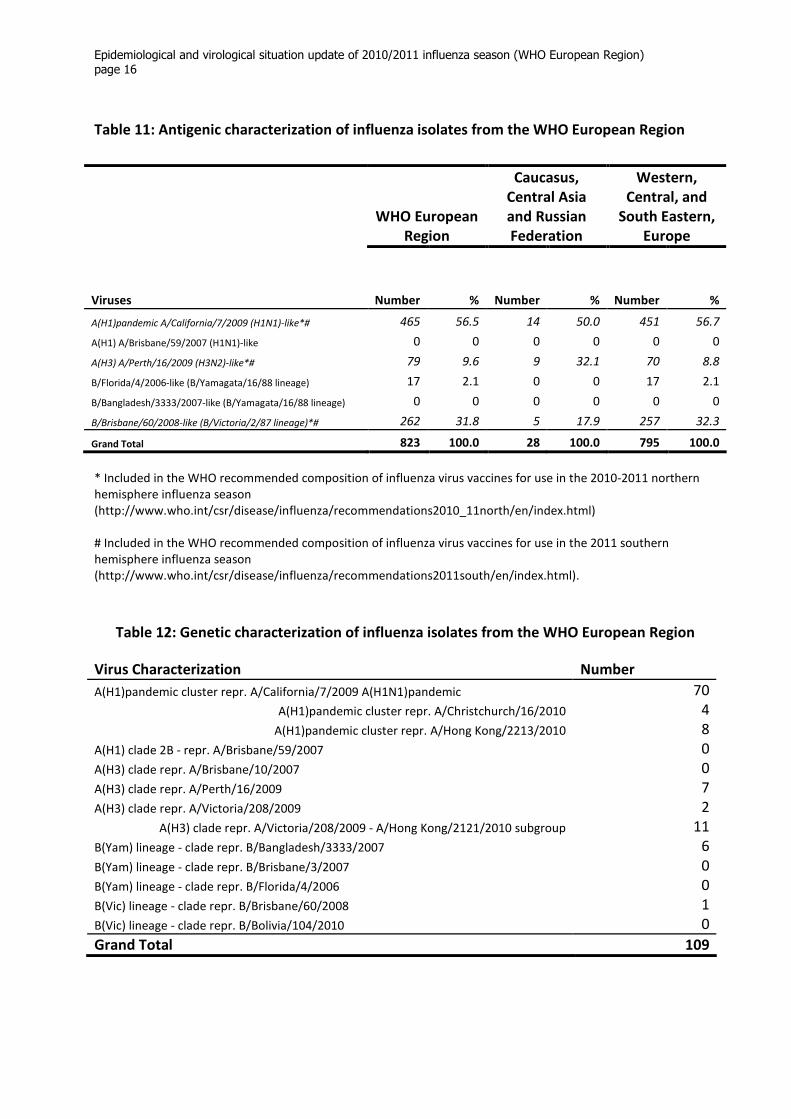
Antigenic and Genetic Characterizations The antigenic and genetic characterizations performed on influenza isolates by NICs in the WHO
European Region are presented in Tables 11 and 12, respectively. Of the 465 pandemic influenza A (H1) viruses that have been antigenically characterized during the 2010/2011 influenza season, 100% are
antigenically similar to pandemic A/California/7/2009 (H1N1)-like viruses. Of the 79 influenza A (H3N2)
viruses that have been characterized, 100% are antigenically similar to) A/Perth/16/2009 (H3N2)-like viruses. Of the 279 influenza B viruses that have been antigenically characterized, 262 (94%) are
B/Brisbane/60/2008-like (B/Victoria/2/87 lineage) and 17 (6%) are B/Florida/4/2006-like (B/Yamagata/16/88 lineage). All 17 viruses from the influenza B-Yamagata lineage were reported by
Western, Central, and South Eastern European countries. Taken together, 98% of antigenically
characterized viruses were similar to 2010-2011 northern hemisphere influenza vaccine strains.
Genetic characterization of 109 circulating influenza viruses suggest that all influenza A (H1) viruses are in the pandemic cluster represented by the current vaccine strain A/California/7/2009 A (H1N1). The
influenza A (H3) that have been genetically characterized are in the clades represented by A/Perth/16/2009, A/Victoria/208/2009, and the A/Victoria/208/2009 - A/Hong Kong/2121/2010 subgroup.
Influenza B viruses are in the clades represented by B/Bangladesh/3333/2007 and B/Brisbane/60/2008.
Week 3/2011
Cumulative,
week 40/2010 to
week 3/2011
Number of sentinel SARI specimens tested for influenza 233 1766
Number and percentage of tested SARI specimens positive for influenza 46 (19.7%) 272 (15.4%)
Number (%) of all influenza positive for influenza A 29 (63%) 79 (29%)
Number of influenza A viruses sub-typed 24 65
Number (%) of subtyped A positive for pandemic influenza A (H1) 2009 23 (96%) 57 (86%)
Number (%) of subtyped A positive for influenza A (H3) 1 (4%) 8 (14%)
Number (%) of subtyped A positive for influenza A (H1) 0 (0%) 0 (0%)
Number (%) of all influenza positive for influenza B * 17 (37%) 193 (71%)
Epidemiological and virological situation update of 2010/2011 influenza season (WHO European Region)
page 16
Table 11: Antigenic characterization of influenza isolates from the WHO European Region
* Included in the WHO recommended composition of influenza virus vaccines for use in the 2010‐2011 northern
hemisphere influenza season
(http://www.who.int/csr/disease/influenza/recommendations2010_11north/en/index.html)
# Included in the WHO recommended composition of influenza virus vaccines for use in the 2011 southern
hemisphere influenza season
(http://www.who.int/csr/disease/influenza/recommendations2011south/en/index.html).
Table 12: Genetic characterization of influenza isolates from the WHO European Region
WHO European
Region
Caucasus,
Central Asia
and Russian
Federation
Western,
Central, and
South Eastern,
Europe
Viruses Number % Number % Number %
A(H1)pandemic A/California/7/2009 (H1N1)-like*# 465 56.5 14 50.0 451 56.7
A(H1) A/Brisbane/59/2007 (H1N1)‐like 0 0 0 0 0 0
A(H3) A/Perth/16/2009 (H3N2)-like*# 79 9.6 9 32.1 70 8.8
B/Florida/4/2006‐like (B/Yamagata/16/88 lineage) 17 2.1 0 0 17 2.1
B/Bangladesh/3333/2007‐like (B/Yamagata/16/88 lineage) 0 0 0 0 0 0
B/Brisbane/60/2008-like (B/Victoria/2/87 lineage)*# 262 31.8 5 17.9 257 32.3
Grand Total 823 100.0 28 100.0 795 100.0
Virus Characterization Number
A(H1)pandemic cluster repr. A/California/7/2009 A(H1N1)pandemic 70
A(H1)pandemic cluster repr. A/Christchurch/16/2010 4
A(H1)pandemic cluster repr. A/Hong Kong/2213/2010 8
A(H1) clade 2B ‐ repr. A/Brisbane/59/2007 0
A(H3) clade repr. A/Brisbane/10/2007 0
A(H3) clade repr. A/Perth/16/2009 7
A(H3) clade repr. A/Victoria/208/2009 2
A(H3) clade repr. A/Victoria/208/2009 ‐ A/Hong Kong/2121/2010 subgroup 11
B(Yam) lineage ‐ clade repr. B/Bangladesh/3333/2007 6
B(Yam) lineage ‐ clade repr. B/Brisbane/3/2007 0
B(Yam) lineage ‐ clade repr. B/Florida/4/2006 0
B(Vic) lineage ‐ clade repr. B/Brisbane/60/2008 1
B(Vic) lineage ‐ clade repr. B/Bolivia/104/2010 0
Grand Total 109

Epidemiological and virological situation update of 2010/2011 influenza season (WHO European Region)
page 17
Conclusions
The 2010/2011 influenza season arrived 8-10 weeks later than the 2009/2010 ‘pandemic’ season in the
WHO European Region, but still quite early compared to historical trends. The percentage of sentinel specimens currently testing positive for influenza in the Region is similar to that observed during the peak
of the 2009/2010 season. As has been observed in several previous years, the 2010/2011 influenza season appears to be progressing in a West to East fashion across much of Europe. Several Western
European countries have reached peaks in ILI or ARI activity, and in the percentage of sentinel specimens testing positive for influenza. However other countries are still approaching peaks in influenza
activity.
Increases in influenza activity have been accompanied by increases in hospitalised SARI and severe
influenza cases; particularly those associated with pandemic A (H1N1) 2009 virus infections. While this has placed a strain on critical care resources in several locations, the age and underlying risk profile of
the severe cases appears similar to what was observed during the 2009/2010 ‘pandemic’ season. During
recent weeks the relative distribution of influenza viruses in SARI cases from sentinel hospitals appears similar to what has been observed in other sentinel and non-sentinel surveillance systems.
Relative to the increased circulation of pandemic influenza A (H1N1) 2009 viruses, the proportion of
influenza A(H3N2) viruses has substantially decreased during the course of the 2010/2011 influenza season. While influenza B viruses continue to co-circulate with influenza A viruses, their relative presence
has declined somewhat in countries where there are currently increasing numbers of influenza (H1N1)
2009 viruses in circulation. This has been particularly notable during January 2011 in the Caucasus, Central Asia and the Russian Federation. Currently, 98% of antigenically characterized viruses from the
2010/2011 influenza season are similar to the 2010-2011 northern hemisphere influenza vaccine strains.
i http://www.hpa.org.uk/web/HPAwebFile/HPAweb_C/1294740643915 (last accessed 1 February, 2011) ii http://www.hpsc.ie/hpsc/A-Z/Respiratory/Influenza/SeasonalInfluenza/Surveillance/InfluenzaSurveillanceReports/20102011Season/File,11977,en.pdf (last accessed 1 February, 2011) iii Armenia, Azerbaijan, Georgia, Kazakhstan, Kyrgyzstan, Russian Federation, Tajikistan, Uzbekistan, Turkmenistan iv Albania, Austria, Belarus, Belgium, Bosnia and Herzegovina, Bulgaria, Croatia, Czech Republic, Denmark, Estonia, Finland, France, Germany, Greece, Hungary, Iceland, Ireland, Israel, Italy, Latvia, Lithuania, Luxembourg, Malta, Montenegro, Netherlands, United Kingdom, Norway, Poland, Portugal, Republic of Moldova, Romania, Serbia, Slovakia, Slovenia, Spain, Sweden, Switzerland, The former Yugoslav Republic of Macedonia, Turkey, Ukraine v Countries currently meeting the minimum reporting criteria and who are submitting sentinel SARI virological data to EuroFlu include Armenia, Georgia, Kazakhstan, Kyrgyzstan, Republic of Moldova, Romania, Russian Federation, and Ukraine