epidemiology of recreational exposure …9111/epi_study_-_epri.pdf · cyanobacteria in lakes and...
TRANSCRIPT
Epidemiology of recreational exposure to freshwater cyanobacteria – an
international prospective cohort study
Ian Stewart1,2,3§, Penelope M Webb4, Philip J Schluter5, Lora E Fleming6, John W Burns
Jr7, Miroslav Gantar8, Lorraine C Backer9, Glen R Shaw1,3,10
1: National Research Centre for Environmental Toxicology, University of Queensland, 39
Kessels Road, COOPERS PLAINS, QLD 4108, Australia
2: School of Population Health, University of Queensland, Herston Road, HERSTON,
QLD 4006, Australia
3: Cooperative Research Centre for Water Quality and Treatment, PMB 3, SALISBURY,
SA 5108, Australia
4: Queensland Institute of Medical Research, 300 Herston Road, HERSTON, QLD 4006,
Australia
5: Faculty of Health and Environmental Sciences, Auckland University of Technology,
Private Bag 92006, AUCKLAND 1020, New Zealand
6: NIEHS Marine & Freshwater Biomedical Sciences Center, University of Miami, FL
33149, USA
7: PBS&J, 701 San Marco Blvd., Suite 1201, Jacksonville, FL 32207-8175, USA
8: Department of Biology, Florida International University, Miami, FL 33199, USA
9: National Center for Environmental Health, Centers for Disease Control and Prevention,
Atlanta, GA 30333, USA
10: School of Public Health, Griffith University, University Drive,
MEADOWBROOK, QLD 4131, Australia
1

§: Corresponding author:
Email addresses:
PMW: [email protected]
PJS: [email protected]
LEF: [email protected]
JWB: [email protected]
LCB: [email protected]
GRS: [email protected]
2

ABSTRACT
Background
Case studies and anecdotal reports have documented a range of acute illnesses associated
with exposure to cyanobacteria and their toxins in recreational waters. The
epidemiological data to date is limited; we sought to improve on the design of some
previously conducted studies in order to facilitate revision and refinement of guidelines
for exposure to cyanobacteria in recreational waters.
Methods
A prospective cohort study was conducted to investigate the incidence of acute symptoms
in individuals exposed, through recreational activities, to low (cell surface area
<2.4mm2/mL), medium (2.4–12.0mm2/mL) and high (>12.0mm2/mL) levels of
cyanobacteria in lakes and rivers in southeast Queensland, the central coast area of New
South Wales, and northeast and central Florida. Multivariable logistic regression analyses
were employed; models adjusted for region, age, smoking, prior history of asthma, hay
fever or skin disease (eczema or dermatitis) and clustering by household.
Results
Of individuals approached, 3,595 met the eligibility criteria, 3,193 (89%) agreed to
participate and 1,331 (37%) completed both the questionnaire and follow-up interview.
Respiratory symptoms were 2.1 (95% CI: 1.1, 4.0) times more likely to be reported by
subjects exposed to high levels of cyanobacteria than by those exposed to low levels.
Similarly, when grouping all reported symptoms, individuals exposed to high levels of
cyanobacteria were 1.7 (95% CI: 1.0, 2.8) times more likely to report symptoms than
3
their low-level cyanobacteria-exposed counterparts. While the effect sizes for the
reporting of ear symptoms, skin symptoms and fever between high and low exposure
groups were similar to those for respiratory and pooled symptoms, the observed
frequencies were small and thus the differences between exposure groups were not
statistically significant.
Conclusions
A significant increase in reporting of minor self-limiting symptoms, particularly
respiratory symptoms, was associated with exposure to higher levels of cyanobacteria of
mixed genera. We suggest that exposure to cyanobacteria based on total surface area
above 12 mm2/mL could result in increased incidence of symptoms. The potential for
severe, life-threatening cyanobacteria-related illness is likely to be greater in recreational
waters that have significant levels of cyanobacterial toxins, so future epidemiological
investigations should be directed towards recreational exposure to cyanotoxins.
4
BACKGROUND
Planktonic cyanobacteria are common inhabitants of freshwater lakes and reservoirs
throughout the world. Under favourable conditions, certain cyanobacteria can dominate
the phytoplankton within a waterbody and form nuisance blooms. The principal public
health concern regarding exposure to freshwater cyanobacteria relates to the
understanding that some blooms produce toxins that specifically affect the liver or the
central nervous system. Exposure routes for systemic poisoning by these toxins are oral,
from accidental or deliberate ingestion of recreational water, and possibly by inhalation.
A small collection of case reports and anecdotal references dating from 1949 have
described a range of illnesses associated with recreational exposure to cyanobacteria: hay
fever-like symptoms, pruritic skin rashes and gastro-intestinal symptoms are most
frequently reported. Some papers give convincing descriptions of allergic responses to
cyanobacteria; others describe more serious acute illnesses, with symptoms such as
severe headache, pneumonia, fever, myalgia, vertigo and blistering in the mouth.
Anecdotal and case reports and the epidemiology of recreational exposure to freshwater
cyanobacteria were recently reviewed by Stewart et al [1]. Under-reporting of minor, self-
limiting illnesses may explain the small number of anecdotal and case reports in the
literature. Moreover, a knowledge gap about cyanobacteria probably exists for many
primary health care providers. Epidemiological studies into recreational exposure to
cyanobacteria are also few in number. Five have been published to date: three cross-
sectional studies from the United Kingdom using identical survey instruments [2-4], a
5
small case-control analysis from Australia [5], and a larger prospective cohort study, also
from Australia [6]. The UK studies and the smaller Australian study did not find any
significant hazard from exposure to cyanobacterial blooms in recreational waters, but the
study by Pilotto et al [6] reported an increase in illness amongst those exposed to
relatively low levels of cyanobacteria (>5,000 cells per mL) compared to unexposed
individuals.
Despite this limited and inconclusive evidence, the World Health Organization (WHO)
Australia and several European countries have recommended guideline levels for
recreational exposure to cyanobacteria [7 (pp.149-54), 8]. WHO guidelines present a
three-tier approach, suggesting: 1) low probability of adverse health effects from waters
with 20,000 cyanobacterial cells/mL or 10µg chlorophyll-a/L (if cyanobacteria are
dominant); 2) moderate probability of adverse effects from waters with 100,000 cells/mL
or 50µg chlorophyll-a/L; and 3) high probability of adverse effects from contact with
and/or ingestion/aspiration of cyanobacteria at scum-forming densities [7 (p.150)]. There
is concern, however, that the current management practice in some countries (such as
Australia or Germany) of warning all users or closing access to waterbodies is overly
proscriptive. Such practices can result in unease amongst regular users of recreational
waters that are affected by cyanobacteria, and can impact communities surrounding these
waters, which are important social and economic resources.
Due to the small number of published epidemiology studies and the need for revision and
refinement of recreational water exposure guidelines relating to planktonic cyanobacteria,
6
we conducted a prospective cohort study to investigate morbidity following recreational
exposure to cyanobacteria. Specifically, we sought to: 1) quantify cyanotoxins in
designated water recreation sites, and 2) assess the relationship between exposure to
cyanobacteria and cyanotoxins in recreational waters and the incidence of reported
symptoms.
METHODS
The study population of interest comprised adults and children engaging in recreational
activities in enclosed waters (i.e. not marine waters) inhabited to varying degrees by
planktonic cyanobacteria. Subjects were recruited over a three-year period from 1999 to
2002 at water recreation sites in southern Queensland and the Myall Lakes area of New
South Wales (Australia), and northeast and central Florida (USA). Recruitment was
conducted on 54 separate days, mostly on weekends and holiday periods during the
warmer months in order to maximise recruitment efficiency by concentrating on peak-use
periods of recreational activity.
Entry criteria into the study were twofold:
• Engaging or planning to partake in water-contact activities in the study water body on
the day of recruitment – ascertained by asking “Is anybody in the vehicle planning to
go in the water and get wet here today?”
• Able to be contacted by phone for follow-up.
7

Study subjects were enrolled at the water sites and asked to complete a self-administered
questionnaire before leaving for the day. They were also asked to submit to a telephone
follow-up interview to be conducted as soon as practicable after three days from the day
of enrolment. The interviewers asked to speak to study subjects within each household
individually, i.e. proxy interviewees were discouraged. Exceptions were made in the case
of children, where a parent or guardian was asked to decide whether or not their child
would participate in the follow-up directly.
The questionnaire, follow-up interview form and information letter are available in
Stewart [9 (Appendix 1)]. The questionnaire gathered basic demographic data,
information about relevant chronic conditions (chiefly allergies) and recent acute
illnesses, as well as details of water-related activities. The follow-up interview elicited
information about various acute illnesses, their onset and severity as well as smoking
status, water exposure in the follow-up period and within-household grouping of study
subjects. Interviewers and study subjects were more or less blinded to the exposure
category of subjects at the time of the follow-up interview, as results of phytoplankton
analyses were not available for several weeks after interviews were conducted. However,
this incidental blinding did not apply to interviewers questioning subjects recruited from
sites where cyanobacteria levels were obviously very high (from visual appearance of
affected sites) or known to be low or absent.
8
Written permission (gatekeeper approval) from management authorities to recruit
members of the public into this study was sought and secured for all sites listed in Table
1. The study was approved by the University of Queensland’s Behavioural and Social
Sciences Ethical Review Committee (clearance number B/168/SocPrevMed/99/PhD) and
the University of Miami Human Subjects Committee (protocol number 02/031A).
Table 1 lists the study sites, their location by region, a brief description of the site, and
features peculiar to the site that distinguish them from other sites. Sites are also flagged
according to their status as cyanobacteria-affected or cyanobacteria-free (i.e. reference)
sites. Some sites that were initially identified as potential study sites on the basis of
cyanobacteria monitoring programs were subsequently found to have low cyanobacteria
measures at the time of subject recruitment, and were thus classified as reference sites.
Two sites served as both study and reference sites due to variability in cyanobacterial
densities over several recruitment visits.
Water samples for phytoplankton and cyanotoxin analysis were collected by a modified
grab sample method. Unused 1L (Queensland) or 150mL (NSW and Florida)
polypropylene sample bottles were used to collect water at a depth of approximately
70cm. The modification to the grab sample technique involved moving the sample bottle
up and down in a vertical plane to sample water through the entire column in order to
avoid spurious cyanobacteria estimates through sampling only surface water.
Cyanobacteria surface scums can be widely distributed in the horizontal plane at the
water surface, but are negligibly distributed vertically. Sampling only from the surface
9
during such bloom events would tend to overestimate recreational exposures, as the
surface area of skin exposed to sub-surface water far exceeds the area exposed to the
water surface when swimming or wading. In an attempt to address temporal and spatial
heterogeneity of cyanobacteria profiles within each waterbody, samples were collected
from between one and four locations on each recruitment day, depending on the size of
the site. Samples were collected at two times: on arrival in the morning, and prior to
departure in the afternoon. All samples were kept on ice, in darkness, and equal volumes
were then pooled prior to leaving the site to form a composite sample. Composite samples
were immediately fixed with Lugol’s iodine, and then stored at 40C until examined.
Separate water samples were collected for cyanotoxin analysis; these samples were also
stored at 40C but were not fixed.
Sub-surface samples for faecal coliform analysis were collected in 250mL sterile
containers shortly before departing each site; containers were immediately placed on ice,
and then stored at 40C until analysed. Due to logistical issues, faecal coliforms were
sampled only on days when a recruitment visit at a study site was followed by a routine
working day.
Total phytoplankton analyses were conducted at three separate laboratories due to
contractual obligations of the various agencies that funded this work: Queensland Health
Scientific Services, Brisbane (National Association of Testing Authorities [NATA]
accredited) for all Queensland samples; Australian Water Technologies, Newcastle for all
Myall Lakes area samples; CyanoLab, Palatka, Florida for all Florida samples.
10
Cell identification and enumeration at these three centres were conducted by broadly
similar methods, using a calibrated counting chamber with phase-contrast microscopy.
Cell surface areas were determined by defining cyanobacteria cells as spherical or
cylindrical, then measuring cell diameter (all cells) and length (idealised cylindrical
cells). An appropriate number of cells were measured, and then averaged to give
dimensions for each cyanobacterial taxon in each water sample. Surface areas were
calculated using the formulas S.A. = 4πr2 (idealised spherical cells), or S.A. = 2(π r2) +
(2π r)l (idealised cylindrical cells) where v = cell volume; r = cell radius; l = cell length;
S.A. = cell surface area. Data for each cyanobacterial taxon were summed, and total
cyanobacterial cell surface area was used as the measure of exposure for each recruitment
day in subsequent statistical analyses.
Samples that contained potentially toxic cyanobacteria were then analysed for specific
cyanotoxins. Analysed toxins and their associated taxa were:
• Microcystins : Microcystis spp, Anabaena spp, Planktothrix spp,
• Saxitoxins (Australia only): Anabaena circinalis
• Cylindrospermopsin: Cylindrospermopsis raciborskii, Aphanizomenon
ovalisporum
• Anatoxin-a: (Florida only): Anabaena spp, C. raciborskii
11
Australian samples were analysed at Queensland Health Scientific Services laboratories.
Saxitoxins were analysed by high performance liquid chromatography (HPLC) with
fluorescence detection using a Shimadzu LC-10AVP system (Shimadzu Corp, Kyoto,
Japan) based on the methods of Lawrence et al [10]; microcystins were measured by a
Shimadzu LC-10A HPLC with photodiode array detection using the methods of Lawton
et al [11]. Cylindrospermopsin was quantified by HPLC-MS/MS with a Perkin Elmer
series 200 HPLC (Perkin Elmer Corp, Norwalk, CT, USA) coupled to a PE SCIEX API
300 mass spectrometer (PE SCIEX, Concord, ON, Canada) [12]. In Florida, toxins were
analysed at CyanoLab. Cylindrospermopsin and anatoxin-a were determined by a HPLC-
MS/MS method on a ThermoFinnigan LCQ Advantage system (ThermoFinnigan, San
Jose, CA, USA). Microcystins were determined by an enzyme-linked immunosorbent
assay method with a commercially available kit from Abraxis LLC (product # 520011,
Abraxis LLC, Warminster, PA, USA).
All faecal coliform samples were analysed within 24 hours following collection. Samples
were analysed at the following laboratories: Queensland Health Scientific Services,
Brisbane, QLD (NATA accredited): method # AS 4276.7 (Australian Standard method
for thermotolerant coliforms and Escherichia coli – membrane filtration method); Centre
for Integrated Environmental Protection, Griffith University, Brisbane, QLD: method #
APHA 9222D (APHA membrane filtration method); Forster Environmental Laboratory,
Forster, NSW (NATA accredited): method # APHA 9222D; Columbia Analytical
Services, Jacksonville, Florida (NELAC accredited): method # SM 9222D (USEPA
Standard Method – membrane filtration method).
12
Water conductivity was measured at Australian study sites with an integrated
conductivity/pH/temperature meter (Model WP-81, TPS P/L, Springwood, QLD,
Australia). In Florida, conductivity was recorded with a DataSonde MP 6600 (YSI Inc,
Yellow Springs, OH, USA).
Data analysis
Cyanobacterial cell surface area was chosen as the principal exposure variable of interest
[9 (Chapter 3)] and classified as low (total cyanobacterial cell surface area <2.4mm2/mL),
intermediate (2.4–12.0mm2/mL) and high (>12.0mm2/mL) based on guidelines from the
Queensland Department of Natural Resources and Mines [9 (Chapter 3), 13]. Faecal
coliform exposures were categorised as positive or negative according to the Australian
and New Zealand regulatory guidelines for fresh and marine water quality [14]. Age was
categorised into five age groups (see Table 2). Smoking status was categorised into three
groups: active, passive and non-smokers. Passive smokers were defined as non-smokers
or children aged less than 12 years who lived in a dwelling where at least one other
household member smoked inside the house. Faecal coliform counts can fluctuate on a
daily or weekly basis. Therefore analyses of symptom reporting using coliform data as
exposure variables were conducted only on the sub-sets of the cohort for which these
readings were available for the day of recruitment.
13
The dependent variable for all analyses was symptom reporting; symptoms were pooled
into an “any symptom” category, and because of the disparate nature of symptoms
associated with cyanobacteria exposure [1], reported symptoms were categorised as ear
(sore ear/s; discharge from ear/s), eye (sore eye/s; eye redness; discharge from eye/s;
itchy eye/s), gastro-intestinal (G-I) (vomiting; diarrhoea; abdominal pain; nausea),
respiratory (difficulty breathing; dry cough; productive cough; runny nose; unusual
sneezing; sore throat; wheezy breathing), cutaneous (skin rash; redness of the skin not
related to sunburn; unusual itchiness), fever (single sign/symptom of fever) and the
combined “any symptom” (any of the above). Respondents were asked to rate symptoms
that occurred in the follow-up period as mild, moderate or severe. The number of
symptoms reported as “severe” was, however, very low so this category was combined
with “moderate”, to form a single “moderate or severe” category. Subjects were excluded
from specific analyses if they reported one or more associated acute symptoms had
started before recruitment into the study.
Pearson’s chi-squared test and Fisher’s exact test were used to compare group
proportions, where appropriate, while logistic regression was used to investigate
associations between symptom variables and cyanobacterial exposure after accounting for
potential confounding variables and geographic region, which was a design variable in all
logistic regression models. A multivariable logistic regression main-effects model was
then developed, using sequential backward elimination of non-significant variables
(based on the model deviance statistic). Once the most parsimonious main-effects model
was identified, all two-factor interactions were introduced into the model and stepwise
14
elimination of non-significant terms was undertaken (again based on the model deviance
statistic) until the final model was obtained. The final model adjusted for age, sex,
smoking and reported prior history of asthma, hay fever or eczema. A second
multivariable model was developed for the “any symptoms” outcome by excluding
subjects who reported exposure at the study waterbody in the five-day period prior to
recruitment, as per the work of Pilotto et al [6]. SPSS v11.5 [15], Epi Info v6.O4d [16]
and Stata/SE v8.0 [17] were used for statistical analyses and a significance level of
α=0.05 was used to define statistical significance.
RESULTS AND DISCUSSION
The study entry criteria were met by 3,595 individuals; of these, 402 (11%) refused to
participate in the study. Of the 3,193 people who accepted a questionnaire, 1,371 (43%)
returned it. Of these, 40 individuals did not complete the follow-up interview for various
reasons (uncontactable, refused to be interviewed, denied knowledge of the study). The
1,331 subjects with follow-up data thus represented 42% of those who agreed to
participate in the study by accepting a questionnaire. Demographic features of the cohort
are shown in Table 2; the majority of participants were from Queensland, and most were
less than 55 years of age and non-smokers.
Table 3 presents the frequency (percentage) of subjects reporting symptoms at each level
of cyanobacteria exposure. There were no significant differences between the frequency
15
or reported severity of symptoms over the three cyanobacteria exposure groups. For
further analyses, we collapsed the symptom variables into two groups of “not reported”
and “reported at any severity”. This dichotomisation also increased the robustness of the
statistical modelling.
Table 4 presents the results of crude and multivariable logistic modelling. Two
statistically significant findings were identified: increased reporting of respiratory
symptoms in the high cyanobacteria exposure group compared to the low group, odds
ratio (OR) 2.1 (95% CI: 1.1, 4.0), and the pooled “any symptom” reporting was increased
in the high cyanobacteria exposure group compared to the low exposure group, OR 1.7
(95% CI: 1.0, 2.9). However, the significance of the latter result was not maintained with
the exclusion of subjects with recent prior recreational water exposure, OR 1.6 (95% CI:
0.8, 3.2).
Analysis of cyanotoxin levels in study waters showed that these were infrequently seen
and, when seen, at low levels. Microcystins were only detected on two occasions, at
1μg/L (Doctors Lake) and 12μg/L (Lake Coolmunda); cylindrospermopsin was found on
seven occasions (Lakes Wivenhoe, Somerset, Atkinson and Seminole), but the levels
were low at 1μg/L and 2μg/L. Saxitoxins were not seen in this study, and anatoxin-a was
only detected at one Florida site (Lake Seminole) on a single recruitment day, at 1μg/L. A
statistically significant increase in symptom reporting amongst Florida subjects exposed
to anatoxin-a was found by the Fisher-Freeman-Halton test (p=0.04), but the number of
subjects exposed (n=18) was very low.
16
No relationship between symptom reporting and faecal coliform counts in study waters
was seen. Chi-squared tests comparing coliform levels and G-I symptoms (p=0.50),
respiratory symptoms (p=0.92) and the pooled “any symptom” category (p=0.96) did not
reveal any significant associations.
The main findings of this work were that individuals exposed to recreational waters from
which total cyanobacterial cell surface areas exceeded 12mm2/mL were more likely to
report symptoms after exposure than those exposed to waters where cyanobacterial
surface areas were less than 2.4mm2/mL. Reporting of respiratory symptoms was
similarly associated with exposure to high levels of cyanobacteria. The measured effect
size was similar but non-significant for reporting of ear and cutaneous symptoms, fever
and all symptoms after exclusion of subjects with prior site exposure, which suggests that
the sample sizes were too small to show significant differences between symptom rates at
different levels of exposure within these categories. No relationship was detected between
exposure to intermediate levels of cyanobacteria (total surface area 2.4–12.0 mm2/mL)
and symptom reporting.
The symptom category that appeared to be weighting the pooled “any symptom” category
the most was that of respiratory symptoms, which itself showed a statistically significant
increase in symptom reporting at high cyanobacterial exposures. However, from Table 3
we see that respiratory symptom reporting was skewed towards the “mild” symptom
17
rating. Therefore, the conclusion that symptom reporting was higher in individuals
exposed to high cyanobacteria levels compared to those exposed to low cyanobacteria
levels must be tempered by the observation that mild respiratory symptoms appeared to
be the dominant influence on overall symptom reporting.
This study attempted to improve on some study design weaknesses of previously
published work in this field. The control group was recruited at waters that were known
or suspected to be substantially free of cyanobacteria. We were concerned that the control
subjects (i.e. non-bathers) in the studies of Pilotto et al [6] and Philipp [2], Philipp &
Bates [3] and Philipp et al [4] might differ in some way from those who chose to go in the
water. They might also tend to under-report relevant illnesses, given the propensity of
some people to give the kind of answers that they think health researchers are seeking
[18]. There is a risk that some individuals who are non-bathers, when presented with
questions that are obviously concerned with water-related activities, might tend to
downplay symptoms that they correctly assume are unrelated to water contact and then
incorrectly assume to be of no interest to researchers.
We also measured cyanotoxins in study waters directly by HPLC-based methods. In
previous studies cyanotoxins were either not considered or indirect and unquantified
measures of cyanotoxin presence were used. However, the cyanotoxins were infrequently
seen at study waters and, where seen, were at universally low levels. While we observed a
significant increase in symptom reporting amongst Florida subjects exposed to anatoxin-
a, the number of subjects exposed was very low, so we were reluctant to draw any
18
conclusions from this finding. The infrequent presence and low concentrations of
cyanotoxins in study waters highlights one of the disadvantages in conducting a
prospective cohort study, that cyanobacteria and especially cyanotoxin levels are often
dynamic and therefore unpredictable.
We chose a biomass estimate – cell surface area – to determine exposure to
cyanobacteria, rather than the traditional reporting method of cell counts per unit volume
of water [9 (Chapter 3)]. Cyanobacteria cells can vary considerably in size, so measuring
only cell counts will overestimate cyanobacterial biomass if picoplankton are dominant.
Some workers recommend cyanobacterial biovolume or chlorophyll-a (if cyanobacteria
dominate the phytoplankton profile) as estimates of cyanobacterial standing crop or for
exposure guidelines [13, 19].
The cohort was large enough to detect increased odds of symptom reporting in the “any
symptom” and respiratory symptom categories amongst subjects exposed to high
compared to low levels of cyanobacteria. Effects of similar magnitude were also seen for
ear and skin symptoms and fever, as well as for symptom reporting after exclusion of
subjects with recent prior exposure to study waters but these were not statistically
significant. A larger sample size may have allowed us to confidently detect increased
acute illness reporting from these symptom sub-groups. However, as this study essentially
found only minor morbidity, the cost and effort required to conduct larger studies than
this one would appear to outweigh the benefits.
19
We did not see any dose-response relationships. With the exception of a non-significant
O.R. for febrile illness there was no increased reporting of symptoms at intermediate
exposure but an increase at high exposure. One explanation for this may be a threshold
effect, i.e. a minimum level of exposure is needed in order to see an effect.
This work was a study of exposures to non-toxic and potentially toxic cyanobacteria in
recreational waters, but with essentially little or no exposure to known cyanotoxins.
Recommendations arising from this work cannot, therefore, be applied to situations where
cyanobacterial exotoxins are found to be in possibly hazardous concentrations. Using
levels of toxin-producing cyanobacteria as indirect measures of cyanotoxin presence may
overestimate the public health risks; exposure guidelines and management strategies that
address the potential, not actual, presence of hazardous levels of cyanotoxins run the risk
of propagating “warning fatigue”, where frequent or permanent advisories (see Figure 1)
are ignored by a significant proportion of the public [9 (Appendix 2), 20].
A more rigorous assessment of the risks will come with regularly updated knowledge of
the actual cyanotoxin content in recreational waters. At present, this knowledge is only
obtained from testing of water samples in specialist cyanotoxin laboratories, which is
expensive and with a lag period measured in days. Research strategies directed at an
inexpensive, in-situ test for cyanotoxins would be appropriate. We suggest that future
work in this field should investigate the epidemiology of recreational exposure to known
20
cyanotoxins, rather than the epidemiology of recreational exposure to cyanobacteria per
se. This would probably take the form of case-control studies in areas where cases could
be identified (i.e. suitably distant from major cities). A retrospective cohort study may be
appropriate if analytical turn-around times are sufficiently rapid to allow for the interview
of visitors at cyanotoxin-affected campsites. School-based surveillance would also be
appropriate in regions or towns – not cities – affected by future toxic blooms. There may
also be helpful information to be gained from a more thorough questioning of suspect
cases, especially with respect to reporting any history of allergy or atopy.
When considering these results it is important to consider potential sources of error,
particularly the possibilities of selection bias and confounding. Despite offering
inducements (entry into a raffle for electronic goods, camping and boating permits) to
increase participation in this study, the target population was inherently difficult to
capture as most were healthy, young and busily engaged in leisure activities. The
relatively low response rate (42%) means that the sample may become less representative
of the wider population. The overall response rate also varied across the exposure groups
with only 30% of eligible subjects returning questionnaires at high exposure sites
compared to 43% and 44% of those at intermediate and low cyanobacteria sites
respectively (p<0.001). This difference was due to a particularly poor response from high
exposure sites in Florida (27%). Some peculiar features of these sites in Florida probably
contributed to the response rate, e.g. lack of swimming beaches (resulting in over-
reliance on subjects using powered watercraft) and increased demand for limited parking
spaces (manifested by boat-user etiquette for rapid site entry and egress, with
21
subsequently reduced priority for completing questionnaires)[9 (Appendix 2)]. However,
assuming that those who failed to return questionnaires were no more or less likely to go
on to develop symptoms than those who participated then, after adjusting for study
region, the effect estimates should not be affected.
Because nuisance and potentially harmful cyanobacteria are cosmopolitan in distribution,
and exposure guidelines should therefore be universal, not region specific, we combined
the data from all three regions (Queensland, NSW and Florida). Overall, 80% of highly
exposed subjects but only 10% of the low exposure group came from Florida. In addition,
symptom reporting was considerably lower among Florida respondents than in Australia
(OR for all symptoms = 0.6, 95%CI: 0.4, 1.1 for Florida and 0.9, 95%CI: 0.6, 1.3 for
NSW compared to Queensland). Although we adjusted for region in our analyses, any
residual confounding by this variable is likely to have weakened the true association. Of
note, when we adjusted for important factors in our multivariable models, the symptom
effect sizes associated with cyanobacteria exposure were strengthened slightly,
suggesting that the associations seen are unlikely to be due to confounding. Although it is
impossible to rule out other unknown confounders these would have to be strongly
associated with both exposure and symptoms in order to completely explain the effects.
We believe it unlikely that such strong confounders exist, nonetheless the possibility
remains that unmeasured confounding variables may explain our findings.
CONCLUSIONS
22
This study has shown that subjects exposed to high levels of cyanobacteria in recreational
waters, as measured by total cell surface area, were more likely to report symptoms
following such exposure than subjects exposed to low levels of cyanobacteria.
Respiratory symptoms were most evident, and the reported severity of symptoms across
all groups was low. In the present study levels of cyanotoxins in recreational waterbodies
affected by cyanobacteria blooms were universally low. Further work quantifying the
relationship between cyanotoxin levels and health outcomes should be considered. The
potential remains for significant morbidity and mortality associated with recreational
exposure to cyanotoxins, these being highly potent water-soluble toxins.
Abbreviations
APHA American Public Health Association
G-I Gastro-intestinal
HPLC High performance liquid chromatography
HPLC-MS/MS HPLC + tandem mass spectrometry
NATA National Association of Testing Authorities, Australia
NELAC National Environmental Laboratory Accreditation Conference
(USA)
OR Odds ratio
USEPA U.S. Environmental Protection Agency
WHO World Health Organization
23
Competing Interests
JWB was the director of CyanoLab and a former employee of St Johns River Water
Management District at the time of field recruitment in Florida. No other authors have
any competing interests.
Author Contributions
IS, PMW and GRS initiated the study’s conception and design. IS secured gatekeeper
approvals, conducted field recruitment, water sample collection, data entry and
manipulation and drafted the manuscript. IS and LEF conducted follow-up interviews. IS
and PJS conducted statistical analyses. JWB, LEF, MG and LCB were involved in
planning, logistics and site selection for recruitment of Florida subjects. GRS, PMW, PJS
and LEF supervised the project. All authors participated in redrafting the manuscript. All
authors read and approved the final manuscript.
Acknowledgements
Many thanks to the following for assistance: Mark Aubel, Lee Bowling, Mike Burch,
Vanessa Burgess, Andy Chapman, Ingrid Chorus, Brad Davis, Brian Dugan, Geoff
Eaglesham, Corinne Garnett, Lindsay Hunt, Glenn McGregor, Michael Moore, Gerard
Neville, Mark O’Donohue, Natasha Ryan, Maree Smith, Gayl Van de Bogart. Special
thanks to Ben Wilson for assistance with database design.
24

Funding for this project was provided by grants from the South East Queensland Water
Corporation, the Cooperative Research Centre for Water Quality and Treatment, the
University of Miami NIEHS MFBS Center and the NIEHS ARCH Program (#S11
ES11181). Additional funding was received from the NSW Department of Land and
Water Conservation, CyanoLab, St Johns River Water Management District and Lake
County Water Authority. A travelling scholarship was awarded by the University of
Queensland’s Office of Research and Postgraduate Studies. Prizes donated by SEQ Water
and Panasonic Australia P/L.
The National Research Centre for Environmental Toxicology is co-funded by Queensland
Health, The University of Queensland, Griffith University and Queensland University of
Technology.
25
REFERENCES
1. Stewart I, Webb PM, Schluter PJ, Shaw GR: Recreational and occupational
field exposure to freshwater cyanobacteria - a review of anecdotal and case
reports, epidemiological studies and the challenges for epidemiologic
assessment. Submitted for publication 2005.
2. Philipp R: Health risks associated with recreational exposure to blue-green
algae (cyanobacteria) when dinghy sailing. Health Hyg 1992, 13:110-114.
3. Philipp R, Bates AJ: Health-risks assessment of dinghy sailing in Avon and
exposure to cyanobacteria (blue-green algae). J Inst Water Environ Manage
1992, 6(5):613-620.
4. Philipp R, Brown M, Bell R, Francis F: Health risks associated with
recreational exposure to blue-green algae (cyanobacteria) when windsurfing
and fishing. Health Hyg 1992, 13:115-119.
5. El Saadi OE, Esterman AJ, Cameron S, Roder DM: Murray River water, raised
cyanobacterial cell counts, and gastrointestinal and dermatological
symptoms. Med J Aust 1995, 162(3):122-125.
6. Pilotto LS, Douglas RM, Burch MD, Cameron S, Beers M, Rouch GJ, Robinson
P, Kirk M, Cowie CT, Hardiman S, Moore C, Attewell RG: Health effects of
exposure to cyanobacteria (blue-green algae) during recreational water-
related activities. Aust N Z J Public Health 1997, 21(6):562-566.
7. WHO: Guidelines for safe recreational water environments - Volume 1:
coastal and fresh waters. Geneva: World Health Organization; 2003.
26

8. Chorus I (Ed): Current approaches to cyanotoxin risk assessment, risk
management and regulation in different countries. Berlin: Federal
Environmental Agency (Umweltbundesamt); 2005.
[http://www.umweltbundesamt.org/fpdf-l/2910.pdf]
9. Stewart I: Recreational exposure to freshwater cyanobacteria: epidemiology,
dermal toxicity and biological activity of cyanobacterial lipopolysaccharides.
PhD thesis. Brisbane: University of Queensland; 2004.
[http://eprint.uq.edu.au/archive/00001883/]
10. Lawrence JF, Menard C, Cleroux C: Evaluation of prechromatographic
oxidation for liquid chromatographic determination of paralytic shellfish
poisons in shellfish. J AOAC Int 1995, 78(2):514-520.
11. Lawton LA, Edwards C, Codd GA: Extraction and high-performance liquid
chromatographic method for the determination of microcystins in raw and
treated waters. Analyst 1994, 119(7):1525-1530.
12. Eaglesham GK, Norris RL, Shaw GR, Smith MJ, Chiswell RK, Davis BC, Neville
GR, Seawright AA, Moore MR: Use of HPLC-MS/MS to monitor
cylindrospermopsin, a blue-green algal toxin, for public health purposes.
Environ Toxicol 1999, 14(1):151-154.
13. Queensland Department of Natural Resources and Mines: Recreational activities
in blue-green algae contaminated waters.
[http://www.nrm.qld.gov.au/water/blue_green/recreation.html]
14. ANZECC & ARMCANZ: Australian and New Zealand guidelines for fresh
and marine water quality. Volume 1 - The guidelines. Canberra: Australian
27
and New Zealand Environment and Conservation Council; Agriculture and
Resource Management Council of Australia and New Zealand; 2000.
15. SPSS Inc: SPSS for Windows, release 11.5.0. Chicago; 2002.
16. CDC (Centers for Disease Control and Prevention): Epi Info 6.04d for DOS.
Atlanta: 2003.
17. StataCorp: Stata/SE 8.0 for Windows, v8.0. College Station: 2003.
18. Goldsmith JR: Communities: their study and their environmental problems.
In: Environmental epidemiology: epidemiological investigation of community
environmental health problems. Edited by Goldsmith JR. Boca Raton, Florida:
CRC Press; 1986: 3-33.
19. Lawton L, Marsalek B, Padisak J, Chorus I: Determination of cyanobacteria in
the laboratory. In: Toxic cyanobacteria in water - A guide to their public health
consequences, monitoring and management. Edited by Chorus I, Bartram J.
London: E & FN Spon; 1999: 347-367.
20. Yoo RS, Carmichael WW, Hoehn RC, Hrudey SE: Cyanobacterial (blue-green
algal) toxins: A resource guide. Denver: AWWA Research Foundation and
American Water Works Association; 1995.
28
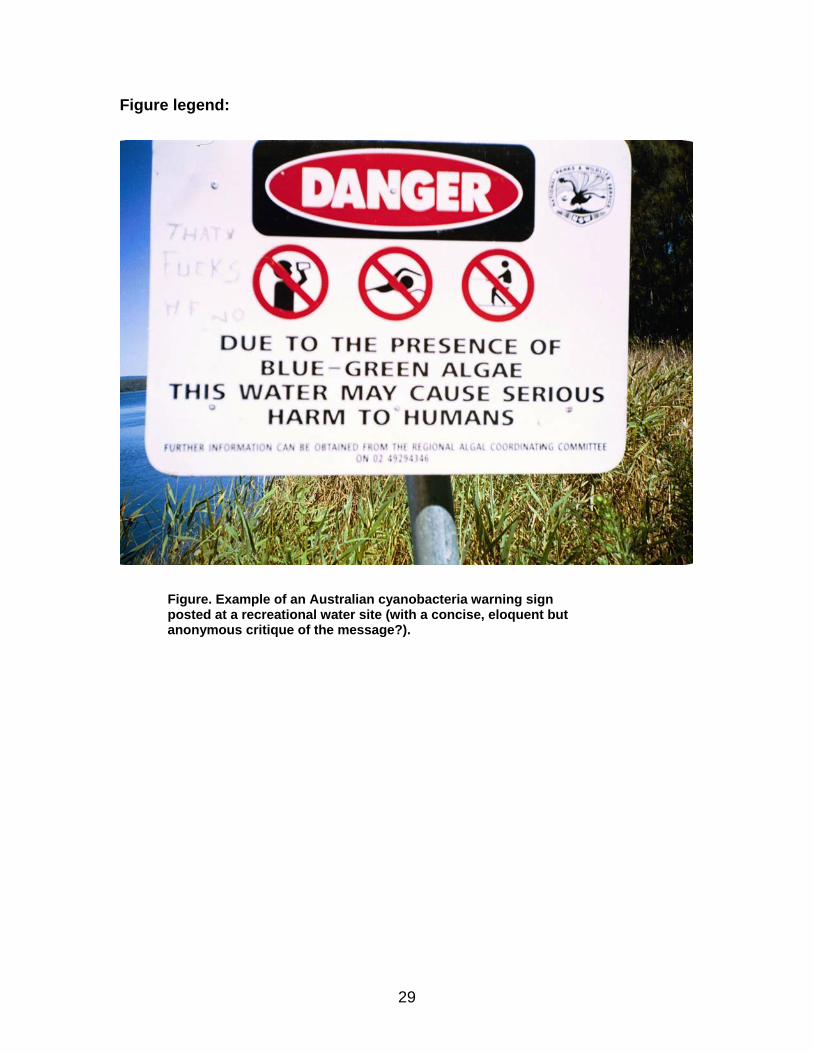
Figure legend:
Figure. Example of an Australian cyanobacteria warning sign posted at a recreational water site (with a concise, eloquent but anonymous critique of the message?).
29
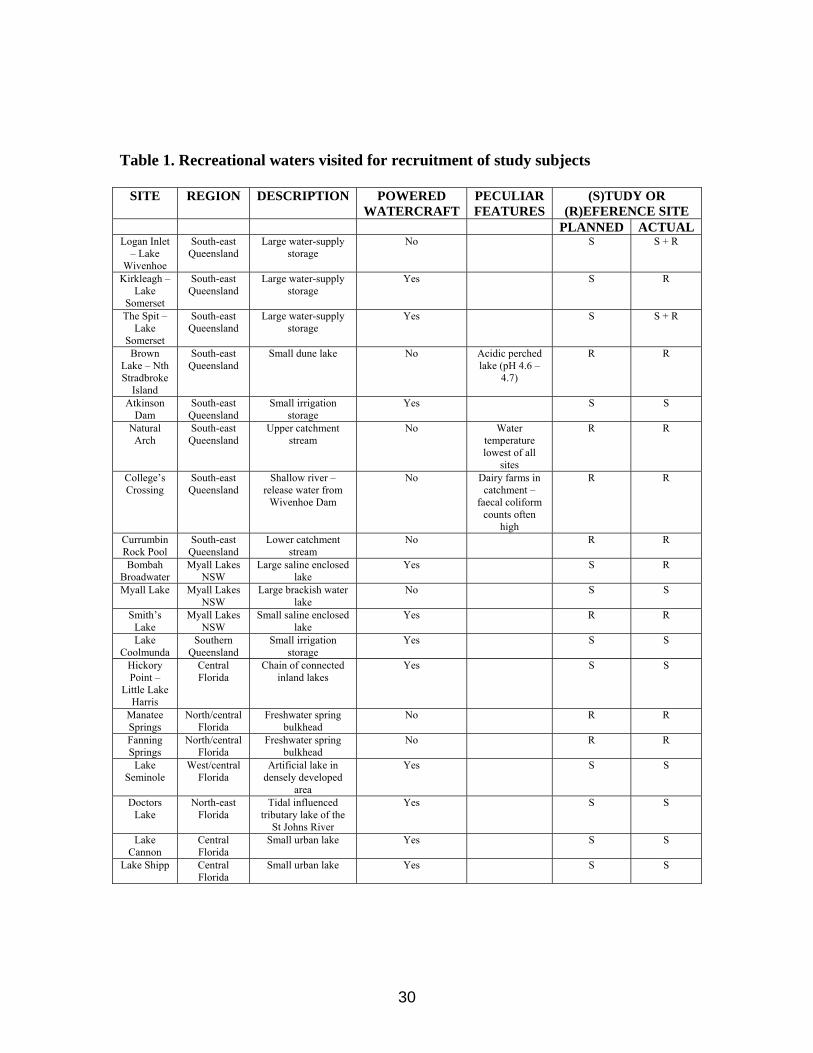
Table 1. Recreational waters visited for recruitment of study subjects
SITE REGION DESCRIPTION POWERED WATERCRAFT
PECULIAR FEATURES
(S)TUDY OR (R)EFERENCE SITE
PLANNED ACTUAL Logan Inlet
– Lake Wivenhoe
South-east Queensland
Large water-supply storage
No S S + R
Kirkleagh – Lake
Somerset
South-east Queensland
Large water-supply storage
Yes S R
The Spit – Lake
Somerset
South-east Queensland
Large water-supply storage
Yes S S + R
Brown Lake – Nth Stradbroke
Island
South-east Queensland
Small dune lake No Acidic perched lake (pH 4.6 –
4.7)
R R
Atkinson Dam
South-east Queensland
Small irrigation storage
Yes S S
Natural Arch
South-east Queensland
Upper catchment stream
No Water temperature lowest of all
sites
R R
College’s Crossing
South-east Queensland
Shallow river – release water from
Wivenhoe Dam
No Dairy farms in catchment –
faecal coliform counts often
high
R R
Currumbin Rock Pool
South-east Queensland
Lower catchment stream
No R R
Bombah Broadwater
Myall Lakes NSW
Large saline enclosed lake
Yes S R
Myall Lake Myall Lakes NSW
Large brackish water lake
No S S
Smith’s Lake
Myall Lakes NSW
Small saline enclosed lake
Yes R R
Lake Coolmunda
Southern Queensland
Small irrigation storage
Yes S S
Hickory Point –
Little Lake Harris
Central Florida
Chain of connected inland lakes
Yes S S
Manatee Springs
North/central Florida
Freshwater spring bulkhead
No R R
Fanning Springs
North/central Florida
Freshwater spring bulkhead
No R R
Lake Seminole
West/central Florida
Artificial lake in densely developed
area
Yes S S
Doctors Lake
North-east Florida
Tidal influenced tributary lake of the
St Johns River
Yes S S
Lake Cannon
Central Florida
Small urban lake Yes S S
Lake Shipp Central Florida
Small urban lake Yes S S
30

Table 2. Demographic characteristics of the entire study cohort. n (%)
<12 312 (23) 13-24 346 (26) 25-39 375 (28) 40-54 256 (19)
Age (years)
>55 42 (3)
Female 635 (48) SexMale 696 (52)
Florida 216 (16) New South Wales 300 (23)
Region
Queensland 815 (61)
Non smoker 953 (72) Passive smoker 131 (10)
Smoking status
Smoker 247 (19)
31
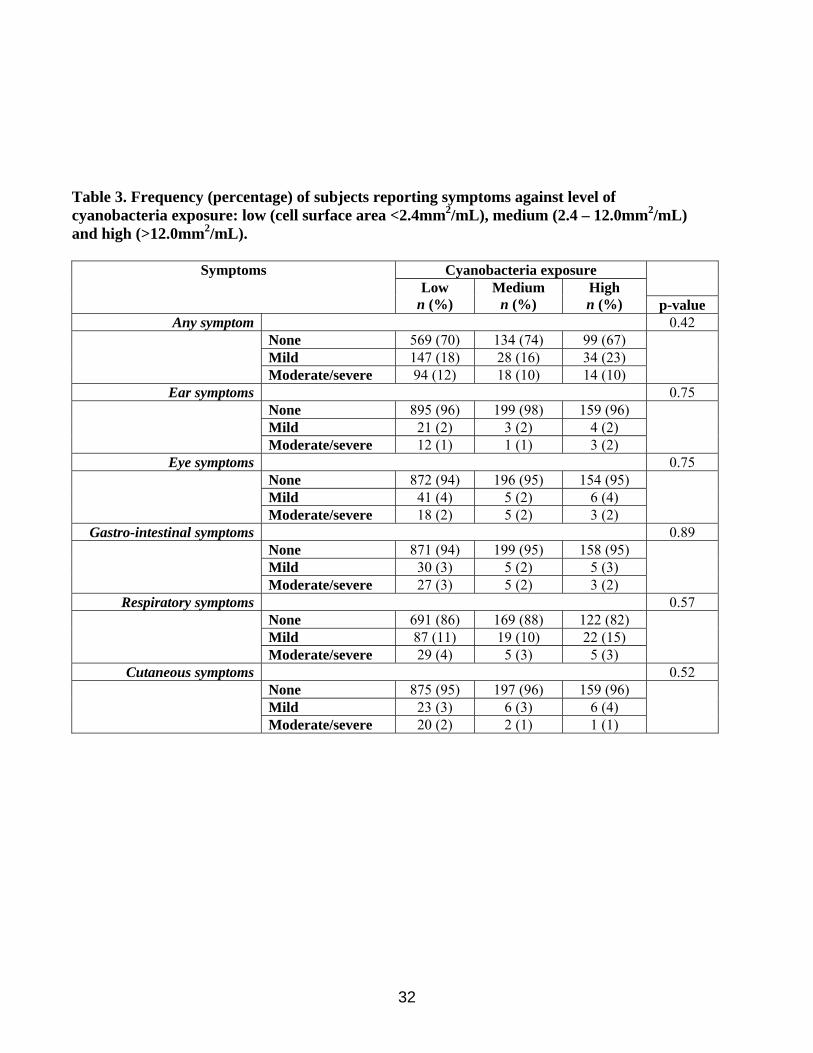
Table 3. Frequency (percentage) of subjects reporting symptoms against level of cyanobacteria exposure: low (cell surface area <2.4mm2/mL), medium (2.4 – 12.0mm2/mL) and high (>12.0mm2/mL).
Cyanobacteria exposure Symptoms
Low n (%)
Medium n (%)
High n (%) p-value
Any symptom 0.42 None 569 (70) 134 (74) 99 (67) Mild 147 (18) 28 (16) 34 (23)
Moderate/severe 94 (12) 18 (10) 14 (10)
Ear symptoms 0.75 None 895 (96) 199 (98) 159 (96) Mild 21 (2) 3 (2) 4 (2)
Moderate/severe 12 (1) 1 (1) 3 (2)
Eye symptoms 0.75 None 872 (94) 196 (95) 154 (95) Mild 41 (4) 5 (2) 6 (4)
Moderate/severe 18 (2) 5 (2) 3 (2)
Gastro-intestinal symptoms 0.89 None 871 (94) 199 (95) 158 (95) Mild 30 (3) 5 (2) 5 (3)
Moderate/severe 27 (3) 5 (2) 3 (2)
Respiratory symptoms 0.57 None 691 (86) 169 (88) 122 (82) Mild 87 (11) 19 (10) 22 (15)
Moderate/severe 29 (4) 5 (3) 5 (3)
Cutaneous symptoms 0.52 None 875 (95) 197 (96) 159 (96) Mild 23 (3) 6 (3) 6 (4)
Moderate/severe 20 (2) 2 (1) 1 (1)
32
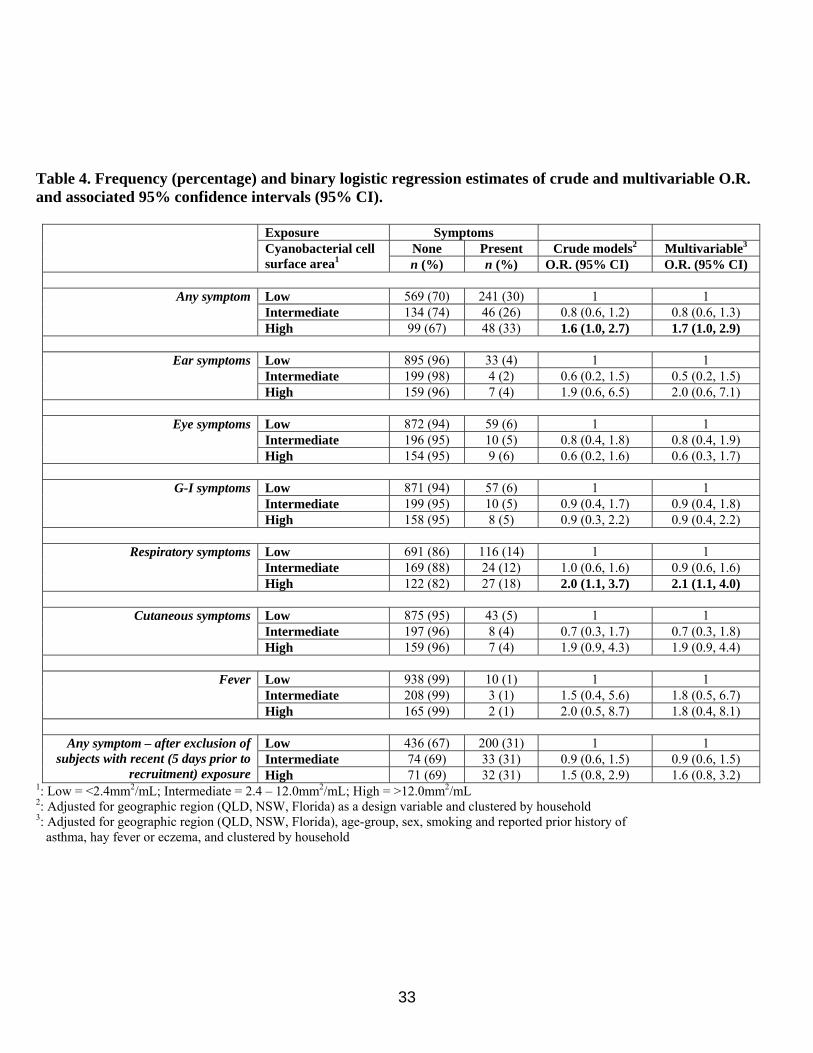
Table 4. Frequency (percentage) and binary logistic regression estimates of crude and multivariable O.R. and associated 95% confidence intervals (95% CI).
Exposure Symptoms
None Present Crude models2 Multivariable3
Cyanobacterial cell surface area1 n (%) n (%) O.R. (95% CI) O.R. (95% CI)
Low 569 (70) 241 (30) 1 1 Intermediate 134 (74) 46 (26) 0.8 (0.6, 1.2) 0.8 (0.6, 1.3)
Any symptom
High 99 (67) 48 (33) 1.6 (1.0, 2.7) 1.7 (1.0, 2.9)
Low 895 (96) 33 (4) 1 1 Intermediate 199 (98) 4 (2) 0.6 (0.2, 1.5) 0.5 (0.2, 1.5)
Ear symptoms
High 159 (96) 7 (4) 1.9 (0.6, 6.5) 2.0 (0.6, 7.1)
Low 872 (94) 59 (6) 1 1 Intermediate 196 (95) 10 (5) 0.8 (0.4, 1.8) 0.8 (0.4, 1.9)
Eye symptoms
High 154 (95) 9 (6) 0.6 (0.2, 1.6) 0.6 (0.3, 1.7)
Low 871 (94) 57 (6) 1 1 Intermediate 199 (95) 10 (5) 0.9 (0.4, 1.7) 0.9 (0.4, 1.8)
G-I symptoms
High 158 (95) 8 (5) 0.9 (0.3, 2.2) 0.9 (0.4, 2.2)
Low 691 (86) 116 (14) 1 1 Intermediate 169 (88) 24 (12) 1.0 (0.6, 1.6) 0.9 (0.6, 1.6)
Respiratory symptoms
High 122 (82) 27 (18) 2.0 (1.1, 3.7) 2.1 (1.1, 4.0)
Low 875 (95) 43 (5) 1 1 Intermediate 197 (96) 8 (4) 0.7 (0.3, 1.7) 0.7 (0.3, 1.8)
Cutaneous symptoms
High 159 (96) 7 (4) 1.9 (0.9, 4.3) 1.9 (0.9, 4.4)
Low 938 (99) 10 (1) 1 1 Intermediate 208 (99) 3 (1) 1.5 (0.4, 5.6) 1.8 (0.5, 6.7)
Fever
High 165 (99) 2 (1) 2.0 (0.5, 8.7) 1.8 (0.4, 8.1)
Low 436 (67) 200 (31) 1 1 Intermediate 74 (69) 33 (31) 0.9 (0.6, 1.5) 0.9 (0.6, 1.5)
Any symptom – after exclusion of subjects with recent (5 days prior to
recruitment) exposure High 71 (69) 32 (31) 1.5 (0.8, 2.9) 1.6 (0.8, 3.2) 1: Low = <2.4mm2/mL; Intermediate = 2.4 – 12.0mm2/mL; High = >12.0mm2/mL 2: Adjusted for geographic region (QLD, NSW, Florida) as a design variable and clustered by household 3: Adjusted for geographic region (QLD, NSW, Florida), age-group, sex, smoking and reported prior history of asthma, hay fever or eczema, and clustered by household
33