epigenetic mechanisms, t-cell activation, and ccr5 ... · epigenetic mechanisms, t-cell activation,...
TRANSCRIPT
Epigenetic mechanisms, T-cell activation, and CCR5genetics interact to regulate T-cell expression of CCR5,the major HIV-1 coreceptorGerman G. Gornalussea,b,c,d,1, Srinivas Mummidia,b,c,2, Alvaro A. Gaitana,b,c,2, Fabio Jimeneza,b,c,2, Veron Ramsurane,f,2,Anabela Pictong,h,2, Kristen Rogersa,b,c,d, Muthu Saravanan Manoharana,b,c, Nymisha Avadhanama,b,c,Krishna K. Murthyi,3, Hernan Martineza,b,c, Angela Molano Murilloa,b,c, Zoya A. Chykarenkoj, Richard Huttk,Demetre Daskalakisk, Ludmila Shostakovich-Koretskayaj, Salim Abdool Karimf, Jeffrey N. Martinl,m,n,Steven G. Deeksl,m,n, Frederick Hechtl,m,n, Elizabeth Sinclairl,m,n, Robert A. Clarka,b,c, Jason Okuliczo, Fred T. Valentinek,Neil Martinsonh,p,q,r, Caroline Tanya Tiemesseng,h,q, Thumbi Ndung’ue,f, Peter W. Huntl,m,n, Weijing Hea,b,c,and Sunil K. Ahujaa,b,c,d,4
aVeterans Administration Research Center for AIDS and HIV-1 Infection, South Texas Veterans Health Care System, San Antonio, TX 78229; bCenter forPersonalized Medicine, South Texas Veterans Health Care System, San Antonio, TX 78229; cDepartment of Medicine, University of Texas Health ScienceCenter, San Antonio, TX 78229; dDepartment of Microbiology, University of Texas Health Science Center, San Antonio, TX 78229; eHIV PathogenesisProgramme, Doris Duke Medical Research Institute, Nelson R Mandela School of Medicine, University of KwaZulu-Natal, Durban 4013, South Africa; fCentrefor the AIDS Program of Research in South Africa (CAPRISA), Doris Duke Medical Research Institute, Nelson R Mandela School of Medicine, University ofKwaZulu-Natal, Durban 4013, South Africa; gCentre for HIV and Sexually Transmitted Infections, National Institute for Communicable Diseases,Sandringham, Johannesburg 2131, South Africa; hFaculty of Health Sciences, University of the Witwatersrand, Johannesburg 2193, South Africa;iDepartment of Virology and Immunology, Texas Biomedical Research Institute, San Antonio, TX 78245; jDepartment of General Pediatrics and PediatricInfectious Diseases, Dnepropetrovsk State Medical Academy, 49044 Dnepropetrovsk, Ukraine; kDepartment of Medicine, New York University School ofMedicine, New York, NY 10016; lDepartment of Medicine, University of California, San Francisco, CA 94110; mDepartment of Epidemiology and Biostatistics,University of California, San Francisco, CA 94110; nSan Francisco General Hospital, San Francisco, CA 94110; oSan Antonio Military Medical Center, Fort SamHouston, San Antonio, TX 78234; pPerinatal HIV Research Unit, University of the Witwatersrand, Johannesburg 2193, South Africa; qMedical ResearchCouncil Soweto Matlosana Centre for HIV/AIDS and Tuberculosis, Johannesburg 2193, South Africa; and rCenter for Tuberculosis Research, Johns HopkinsUniversity School of Medicine, Baltimore, MD 21205
Edited by Rafi Ahmed, Emory University, Atlanta, GA, and approved July 15, 2015 (received for review December 5, 2014)
T-cell expression levels of CC chemokine receptor 5 (CCR5) are acritical determinant of HIV/AIDS susceptibility, and manifest widevariations (i) between T-cell subsets and among individuals and(ii) in T-cell activation-induced increases in expression levels. Wedemonstrate that a unifying mechanism for this variation is differ-ences in constitutive and T-cell activation-induced DNA methylationstatus of CCR5 cis-regulatory regions (cis-regions). Commencing atan evolutionarily conserved CpG (CpG −41), CCR5 cis-regions man-ifest lower vs. higher methylation in T cells with higher vs. lowerCCR5 levels (memory vs. naïve T cells) and in memory T cells withhigher vs. lower CCR5 levels. HIV-related and in vitro induced T-cellactivation is associatedwith demethylation of these cis-regions. CCR5haplotypes associated with increased vs. decreased gene/surface ex-pression levels and HIV/AIDS susceptibility magnify vs. dampenT-cell activation-associated demethylation. Methylation status ofCCR5 intron 2 explains a larger proportion of the variation in CCR5levels than genotype or T-cell activation. The ancestral, protectiveCCR5-HHA haplotype bears a polymorphism at CpG −41 that is(i) specific to southern Africa, (ii) abrogates binding of the tran-scription factor CREB1 to this cis-region, and (iii) exhibits a trendfor overrepresentation in persons with reduced susceptibility toHIV and disease progression. Genotypes lacking the CCR5-Δ32mutation but with hypermethylated cis-regions have CCR5 levelssimilar to genotypes heterozygous for CCR5-Δ32. In HIV-infectedindividuals, CCR5 cis-regions remain demethylated, despite res-toration of CD4+ counts (≥800 cells per mm3) with antiretroviraltherapy. Thus, methylation content of CCR5 cis-regions is a cen-tral epigenetic determinant of T-cell CCR5 levels, and possiblyHIV-related outcomes.
HIV | CCR5 | methylation | T-cell activation | polymorphism
CC chemokine receptor 5 (CCR5) is the major coreceptor forT-cell entry of HIV-1 (1). CCR5 levels on T cells influence
HIV acquisition, disease progression rates, viral load, and im-mune recovery during antiretroviral therapy (ART), amongother traits (1–4) (discussed in ref. 5). In these instances, lowerCCR5 levels correlate with beneficial outcomes. Polymorphisms
in the ORF and cis-regulatory regions (cis-regions) of CCR5 thatcorrelate with higher vs. lower surface and/or gene expressionlevels are associated with increased vs. decreased HIV/AIDS riskand immune recovery (4–12). Classic examples are homozygosity
Significance
Levels of CC chemokine receptor 5 (CCR5) on T cells are a criticalfactor influencing HIV/AIDS susceptibility. DNA methylation isan epigenetic feature associated with lower gene expression.Here we show that the DNA methylation status of CCR5 cis-regulatory regions (cis-regions) correlates inversely with CCR5levels on T cells. T-cell activation induces demethylation ofCCR5 cis-regions, upregulating CCR5 expression. Higher vs. lowersensitivity of CCR5 cis-regions to undergoing T-cell activation-induced demethylation is associated with increased vs. decreasedCCR5 levels. Polymorphisms in CCR5 cis-regions that are associatedwith increased vs. decreased HIV/AIDS susceptibility are also asso-ciated with increased vs. decreased sensitivity to activation-induceddemethylation. Thus, interactions among T-cell activation, CCR5epigenetics, and genetics influence CCR5 levels on T cells and, byextension, HIV/AIDS susceptibility.
Author contributions: G.G.G., S.M., A.A.G., F.J., V.R., A.P., C.T.T., T.N., W.H., and S.K.A. designedresearch; G.G.G., S.M., A.A.G., F.J., V.R., A.P., K.R., M.S.M., N.A., H.M., A.M.M., and W.H. per-formed research; K.K.M., Z.A.C., R.H., D.D., L.S.-K., S.A.K., J.N.M., S.G.D., F.H., E.S., J.O., F.T.V.,N.M., C.T.T., T.N., and P.W.H. contributed new reagents/analytic tools; G.G.G., S.M., A.A.G., F.J.,V.R., A.P., K.R., M.S.M., N.A., H.M., R.A.C., C.T.T., T.N., P.W.H., W.H., and S.K.A. analyzed data;and G.G.G., S.M., W.H., and S.K.A. wrote the paper.
The authors declare no conflict of interest.
This article is a PNAS Direct Submission.
Freely available online through the PNAS open access option.1Present address: Department of Medicine, University of Washington, Seattle, WA 98195.2S.M., A.A.G., F.J., V.R., and A.P. contributed equally to this work.3Present address: ID Consulting, San Antonio, TX 78249.4To whom correspondence should be addressed. Email: [email protected].
This article contains supporting information online at www.pnas.org/lookup/suppl/doi:10.1073/pnas.1423228112/-/DCSupplemental.
www.pnas.org/cgi/doi/10.1073/pnas.1423228112 PNAS Early Edition | 1 of 10
IMMUNOLO
GYAND
INFLAMMATION
PNASPL
US
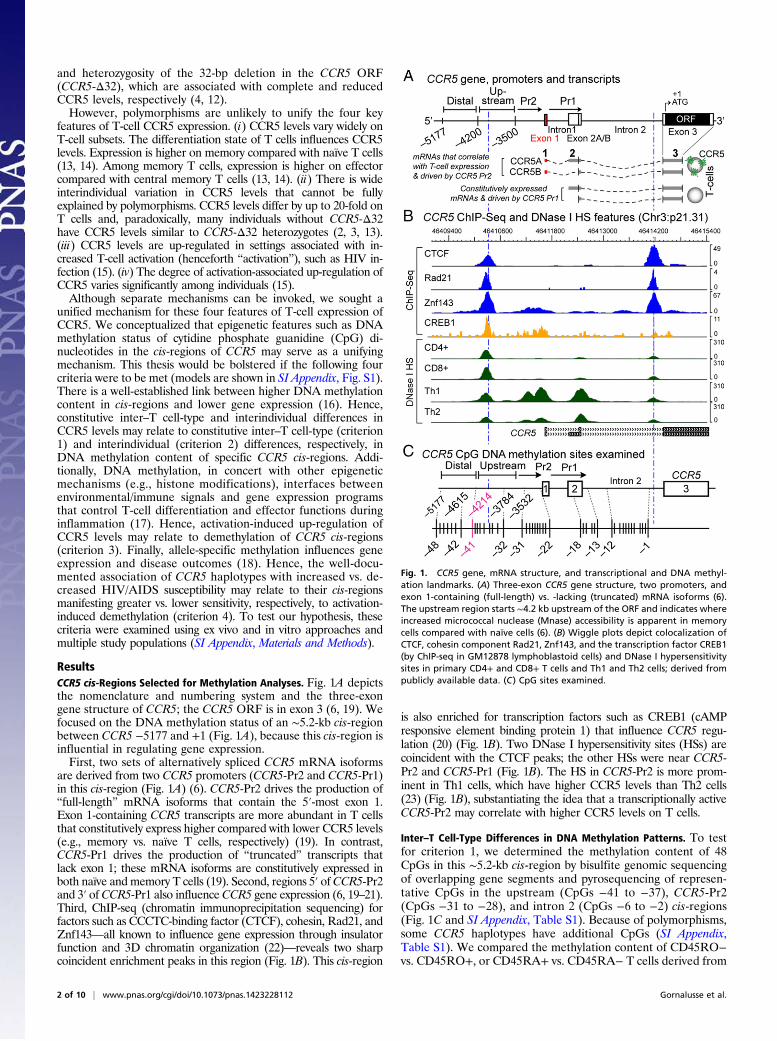
and heterozygosity of the 32-bp deletion in the CCR5 ORF(CCR5-Δ32), which are associated with complete and reducedCCR5 levels, respectively (4, 12).However, polymorphisms are unlikely to unify the four key
features of T-cell CCR5 expression. (i) CCR5 levels vary widely onT-cell subsets. The differentiation state of T cells influences CCR5levels. Expression is higher on memory compared with naïve T cells(13, 14). Among memory T cells, expression is higher on effectorcompared with central memory T cells (13, 14). (ii) There is wideinterindividual variation in CCR5 levels that cannot be fullyexplained by polymorphisms. CCR5 levels differ by up to 20-fold onT cells and, paradoxically, many individuals without CCR5-Δ32have CCR5 levels similar to CCR5-Δ32 heterozygotes (2, 3, 13).(iii) CCR5 levels are up-regulated in settings associated with in-creased T-cell activation (henceforth “activation”), such as HIV in-fection (15). (iv) The degree of activation-associated up-regulation ofCCR5 varies significantly among individuals (15).Although separate mechanisms can be invoked, we sought a
unified mechanism for these four features of T-cell expression ofCCR5. We conceptualized that epigenetic features such as DNAmethylation status of cytidine phosphate guanidine (CpG) di-nucleotides in the cis-regions of CCR5 may serve as a unifyingmechanism. This thesis would be bolstered if the following fourcriteria were to be met (models are shown in SI Appendix, Fig. S1).There is a well-established link between higher DNA methylationcontent in cis-regions and lower gene expression (16). Hence,constitutive inter–T cell-type and interindividual differences inCCR5 levels may relate to constitutive inter–T cell-type (criterion1) and interindividual (criterion 2) differences, respectively, inDNA methylation content of specific CCR5 cis-regions. Addi-tionally, DNA methylation, in concert with other epigeneticmechanisms (e.g., histone modifications), interfaces betweenenvironmental/immune signals and gene expression programsthat control T-cell differentiation and effector functions duringinflammation (17). Hence, activation-induced up-regulation ofCCR5 levels may relate to demethylation of CCR5 cis-regions(criterion 3). Finally, allele-specific methylation influences geneexpression and disease outcomes (18). Hence, the well-docu-mented association of CCR5 haplotypes with increased vs. de-creased HIV/AIDS susceptibility may relate to their cis-regionsmanifesting greater vs. lower sensitivity, respectively, to activation-induced demethylation (criterion 4). To test our hypothesis, thesecriteria were examined using ex vivo and in vitro approaches andmultiple study populations (SI Appendix, Materials and Methods).
ResultsCCR5 cis-Regions Selected for Methylation Analyses. Fig. 1A depictsthe nomenclature and numbering system and the three-exongene structure of CCR5; the CCR5 ORF is in exon 3 (6, 19). Wefocused on the DNA methylation status of an ∼5.2-kb cis-regionbetween CCR5 −5177 and +1 (Fig. 1A), because this cis-region isinfluential in regulating gene expression.First, two sets of alternatively spliced CCR5 mRNA isoforms
are derived from two CCR5 promoters (CCR5-Pr2 and CCR5-Pr1)in this cis-region (Fig. 1A) (6). CCR5-Pr2 drives the production of“full-length” mRNA isoforms that contain the 5′-most exon 1.Exon 1-containing CCR5 transcripts are more abundant in T cellsthat constitutively express higher compared with lower CCR5 levels(e.g., memory vs. naïve T cells, respectively) (19). In contrast,CCR5-Pr1 drives the production of “truncated” transcripts thatlack exon 1; these mRNA isoforms are constitutively expressed inboth naïve and memory T cells (19). Second, regions 5′ ofCCR5-Pr2and 3′ of CCR5-Pr1 also influenceCCR5 gene expression (6, 19–21).Third, ChIP-seq (chromatin immunoprecipitation sequencing) forfactors such as CCCTC-binding factor (CTCF), cohesin, Rad21, andZnf143—all known to influence gene expression through insulatorfunction and 3D chromatin organization (22)—reveals two sharpcoincident enrichment peaks in this region (Fig. 1B). This cis-region
is also enriched for transcription factors such as CREB1 (cAMPresponsive element binding protein 1) that influence CCR5 regu-lation (20) (Fig. 1B). Two DNase I hypersensitivity sites (HSs) arecoincident with the CTCF peaks; the other HSs were near CCR5-Pr2 and CCR5-Pr1 (Fig. 1B). The HS in CCR5-Pr2 is more prom-inent in Th1 cells, which have higher CCR5 levels than Th2 cells(23) (Fig. 1B), substantiating the idea that a transcriptionally activeCCR5-Pr2 may correlate with higher CCR5 levels on T cells.
Inter–T Cell-Type Differences in DNA Methylation Patterns. To testfor criterion 1, we determined the methylation content of 48CpGs in this ∼5.2-kb cis-region by bisulfite genomic sequencingof overlapping gene segments and pyrosequencing of represen-tative CpGs in the upstream (CpGs −41 to −37), CCR5-Pr2(CpGs −31 to −28), and intron 2 (CpGs −6 to −2) cis-regions(Fig. 1C and SI Appendix, Table S1). Because of polymorphisms,some CCR5 haplotypes have additional CpGs (SI Appendix,Table S1). We compared the methylation content of CD45RO−vs. CD45RO+, or CD45RA+ vs. CD45RA− T cells derived from
Fig. 1. CCR5 gene, mRNA structure, and transcriptional and DNA methyl-ation landmarks. (A) Three-exon CCR5 gene structure, two promoters, andexon 1-containing (full-length) vs. -lacking (truncated) mRNA isoforms (6).The upstream region starts ∼4.2 kb upstream of the ORF and indicates whereincreased micrococcal nuclease (Mnase) accessibility is apparent in memorycells compared with naïve cells (6). (B) Wiggle plots depict colocalization ofCTCF, cohesin component Rad21, Znf143, and the transcription factor CREB1(by ChIP-seq in GM12878 lymphoblastoid cells) and DNase I hypersensitivitysites in primary CD4+ and CD8+ T cells and Th1 and Th2 cells; derived frompublicly available data. (C) CpG sites examined.
2 of 10 | www.pnas.org/cgi/doi/10.1073/pnas.1423228112 Gornalusse et al.
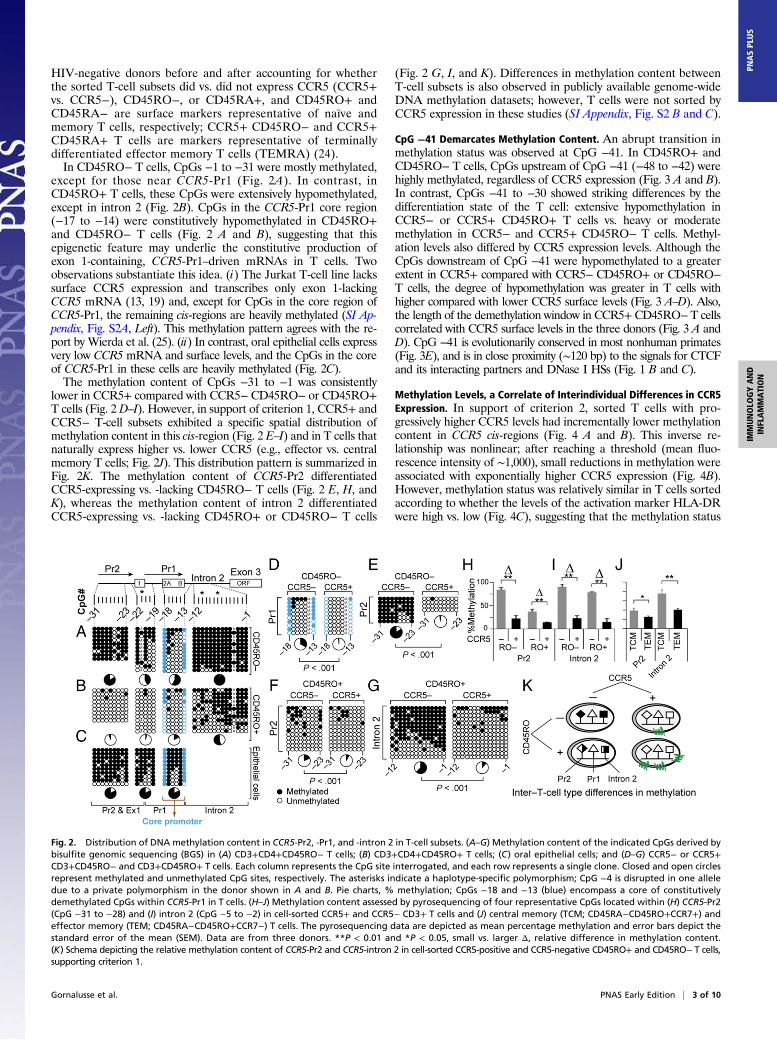
HIV-negative donors before and after accounting for whetherthe sorted T-cell subsets did vs. did not express CCR5 (CCR5+vs. CCR5−), CD45RO−, or CD45RA+, and CD45RO+ andCD45RA− are surface markers representative of naïve andmemory T cells, respectively; CCR5+ CD45RO− and CCR5+CD45RA+ T cells are markers representative of terminallydifferentiated effector memory T cells (TEMRA) (24).In CD45RO− T cells, CpGs −1 to −31 were mostly methylated,
except for those near CCR5-Pr1 (Fig. 2A). In contrast, inCD45RO+ T cells, these CpGs were extensively hypomethylated,except in intron 2 (Fig. 2B). CpGs in the CCR5-Pr1 core region(−17 to −14) were constitutively hypomethylated in CD45RO+and CD45RO− T cells (Fig. 2 A and B), suggesting that thisepigenetic feature may underlie the constitutive production ofexon 1-containing, CCR5-Pr1–driven mRNAs in T cells. Twoobservations substantiate this idea. (i) The Jurkat T-cell line lackssurface CCR5 expression and transcribes only exon 1-lackingCCR5 mRNA (13, 19) and, except for CpGs in the core region ofCCR5-Pr1, the remaining cis-regions are heavily methylated (SI Ap-pendix, Fig. S2A, Left). This methylation pattern agrees with the re-port by Wierda et al. (25). (ii) In contrast, oral epithelial cells expressvery low CCR5 mRNA and surface levels, and the CpGs in the coreof CCR5-Pr1 in these cells are heavily methylated (Fig. 2C).The methylation content of CpGs −31 to −1 was consistently
lower in CCR5+ compared with CCR5− CD45RO− or CD45RO+T cells (Fig. 2 D–I). However, in support of criterion 1, CCR5+ andCCR5− T-cell subsets exhibited a specific spatial distribution ofmethylation content in this cis-region (Fig. 2 E–I) and in T cells thatnaturally express higher vs. lower CCR5 (e.g., effector vs. centralmemory T cells; Fig. 2J). This distribution pattern is summarized inFig. 2K. The methylation content of CCR5-Pr2 differentiatedCCR5-expressing vs. -lacking CD45RO− T cells (Fig. 2 E, H, andK), whereas the methylation content of intron 2 differentiatedCCR5-expressing vs. -lacking CD45RO+ or CD45RO− T cells
(Fig. 2 G, I, and K). Differences in methylation content betweenT-cell subsets is also observed in publicly available genome-wideDNA methylation datasets; however, T cells were not sorted byCCR5 expression in these studies (SI Appendix, Fig. S2 B and C).
CpG −41 Demarcates Methylation Content. An abrupt transition inmethylation status was observed at CpG −41. In CD45RO+ andCD45RO− T cells, CpGs upstream of CpG −41 (−48 to −42) werehighly methylated, regardless of CCR5 expression (Fig. 3 A and B).In contrast, CpGs −41 to −30 showed striking differences by thedifferentiation state of the T cell: extensive hypomethylation inCCR5− or CCR5+ CD45RO+ T cells vs. heavy or moderatemethylation in CCR5− and CCR5+ CD45RO− T cells. Methyl-ation levels also differed by CCR5 expression levels. Although theCpGs downstream of CpG −41 were hypomethylated to a greaterextent in CCR5+ compared with CCR5− CD45RO+ or CD45RO−T cells, the degree of hypomethylation was greater in T cells withhigher compared with lower CCR5 surface levels (Fig. 3 A–D). Also,the length of the demethylation window in CCR5+CD45RO−T cellscorrelated with CCR5 surface levels in the three donors (Fig. 3 A andD). CpG −41 is evolutionarily conserved in most nonhuman primates(Fig. 3E), and is in close proximity (∼120 bp) to the signals for CTCFand its interacting partners and DNase I HSs (Fig. 1 B and C).
Methylation Levels, a Correlate of Interindividual Differences in CCR5Expression. In support of criterion 2, sorted T cells with pro-gressively higher CCR5 levels had incrementally lower methylationcontent in CCR5 cis-regions (Fig. 4 A and B). This inverse re-lationship was nonlinear; after reaching a threshold (mean fluo-rescence intensity of ∼1,000), small reductions in methylation wereassociated with exponentially higher CCR5 expression (Fig. 4B).However, methylation status was relatively similar in T cells sortedaccording to whether the levels of the activation marker HLA-DRwere high vs. low (Fig. 4C), suggesting that the methylation status
Fig. 2. Distribution of DNA methylation content in CCR5-Pr2, -Pr1, and -intron 2 in T-cell subsets. (A–G) Methylation content of the indicated CpGs derived bybisulfite genomic sequencing (BGS) in (A) CD3+CD4+CD45RO− T cells; (B) CD3+CD4+CD45RO+ T cells; (C) oral epithelial cells; and (D–G) CCR5− or CCR5+CD3+CD45RO− and CD3+CD45RO+ T cells. Each column represents the CpG site interrogated, and each row represents a single clone. Closed and open circlesrepresent methylated and unmethylated CpG sites, respectively. The asterisks indicate a haplotype-specific polymorphism; CpG −4 is disrupted in one alleledue to a private polymorphism in the donor shown in A and B. Pie charts, % methylation; CpGs −18 and −13 (blue) encompass a core of constitutivelydemethylated CpGs within CCR5-Pr1 in T cells. (H–J) Methylation content assessed by pyrosequencing of four representative CpGs located within (H) CCR5-Pr2(CpG −31 to −28) and (I) intron 2 (CpG −5 to −2) in cell-sorted CCR5+ and CCR5− CD3+ T cells and (J) central memory (TCM; CD45RA−CD45RO+CCR7+) andeffector memory (TEM; CD45RA−CD45RO+CCR7−) T cells. The pyrosequencing data are depicted as mean percentage methylation and error bars depict thestandard error of the mean (SEM). Data are from three donors. **P < 0.01 and *P < 0.05, small vs. larger Δ, relative difference in methylation content.(K) Schema depicting the relative methylation content of CCR5-Pr2 and CCR5-intron 2 in cell-sorted CCR5-positive and CCR5-negative CD45RO+ and CD45RO− T cells,supporting criterion 1.
Gornalusse et al. PNAS Early Edition | 3 of 10
IMMUNOLO
GYAND
INFLAMMATION
PNASPL
US
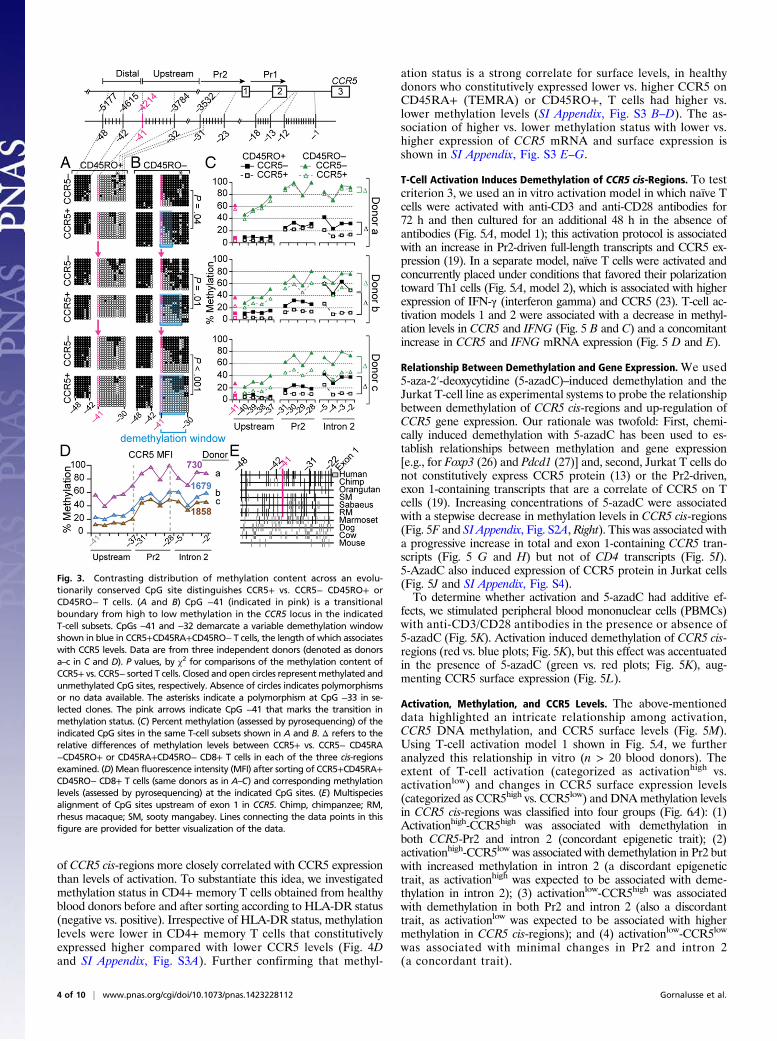
of CCR5 cis-regions more closely correlated with CCR5 expressionthan levels of activation. To substantiate this idea, we investigatedmethylation status in CD4+ memory T cells obtained from healthyblood donors before and after sorting according to HLA-DR status(negative vs. positive). Irrespective of HLA-DR status, methylationlevels were lower in CD4+ memory T cells that constitutivelyexpressed higher compared with lower CCR5 levels (Fig. 4Dand SI Appendix, Fig. S3A). Further confirming that methyl-
ation status is a strong correlate for surface levels, in healthydonors who constitutively expressed lower vs. higher CCR5 onCD45RA+ (TEMRA) or CD45RO+, T cells had higher vs.lower methylation levels (SI Appendix, Fig. S3 B–D). The as-sociation of higher vs. lower methylation status with lower vs.higher expression of CCR5 mRNA and surface expression isshown in SI Appendix, Fig. S3 E–G.
T-Cell Activation Induces Demethylation of CCR5 cis-Regions. To testcriterion 3, we used an in vitro activation model in which naïve Tcells were activated with anti-CD3 and anti-CD28 antibodies for72 h and then cultured for an additional 48 h in the absence ofantibodies (Fig. 5A, model 1); this activation protocol is associatedwith an increase in Pr2-driven full-length transcripts and CCR5 ex-pression (19). In a separate model, naïve T cells were activated andconcurrently placed under conditions that favored their polarizationtoward Th1 cells (Fig. 5A, model 2), which is associated with higherexpression of IFN-γ (interferon gamma) and CCR5 (23). T-cell ac-tivation models 1 and 2 were associated with a decrease in methyl-ation levels in CCR5 and IFNG (Fig. 5 B and C) and a concomitantincrease in CCR5 and IFNG mRNA expression (Fig. 5 D and E).
Relationship Between Demethylation and Gene Expression.We used5-aza-2′-deoxycytidine (5-azadC)–induced demethylation and theJurkat T-cell line as experimental systems to probe the relationshipbetween demethylation of CCR5 cis-regions and up-regulation ofCCR5 gene expression. Our rationale was twofold: First, chemi-cally induced demethylation with 5-azadC has been used to es-tablish relationships between methylation and gene expression[e.g., for Foxp3 (26) and Pdcd1 (27)] and, second, Jurkat T cells donot constitutively express CCR5 protein (13) or the Pr2-driven,exon 1-containing transcripts that are a correlate of CCR5 on Tcells (19). Increasing concentrations of 5-azadC were associatedwith a stepwise decrease in methylation levels in CCR5 cis-regions(Fig. 5F and SI Appendix, Fig. S2A, Right). This was associated witha progressive increase in total and exon 1-containing CCR5 tran-scripts (Fig. 5 G and H) but not of CD4 transcripts (Fig. 5I).5-AzadC also induced expression of CCR5 protein in Jurkat cells(Fig. 5J and SI Appendix, Fig. S4).To determine whether activation and 5-azadC had additive ef-
fects, we stimulated peripheral blood mononuclear cells (PBMCs)with anti-CD3/CD28 antibodies in the presence or absence of5-azadC (Fig. 5K). Activation induced demethylation of CCR5 cis-regions (red vs. blue plots; Fig. 5K), but this effect was accentuatedin the presence of 5-azadC (green vs. red plots; Fig. 5K), aug-menting CCR5 surface expression (Fig. 5L).
Activation, Methylation, and CCR5 Levels. The above-mentioneddata highlighted an intricate relationship among activation,CCR5 DNA methylation, and CCR5 surface levels (Fig. 5M).Using T-cell activation model 1 shown in Fig. 5A, we furtheranalyzed this relationship in vitro (n > 20 blood donors). Theextent of T-cell activation (categorized as activationhigh vs.activationlow) and changes in CCR5 surface expression levels(categorized as CCR5high vs. CCR5low) and DNAmethylation levelsin CCR5 cis-regions was classified into four groups (Fig. 6A): (1)Activationhigh-CCR5high was associated with demethylation inboth CCR5-Pr2 and intron 2 (concordant epigenetic trait); (2)activationhigh-CCR5low was associated with demethylation in Pr2 butwith increased methylation in intron 2 (a discordant epigenetictrait, as activationhigh was expected to be associated with deme-thylation in intron 2); (3) activationlow-CCR5high was associatedwith demethylation in both Pr2 and intron 2 (also a discordanttrait, as activationlow was expected to be associated with highermethylation in CCR5 cis-regions); and (4) activationlow-CCR5low
was associated with minimal changes in Pr2 and intron 2(a concordant trait).
Fig. 3. Contrasting distribution of methylation content across an evolu-tionarily conserved CpG site distinguishes CCR5+ vs. CCR5− CD45RO+ orCD45RO− T cells. (A and B) CpG −41 (indicated in pink) is a transitionalboundary from high to low methylation in the CCR5 locus in the indicatedT-cell subsets. CpGs −41 and −32 demarcate a variable demethylation windowshown in blue in CCR5+CD45RA+CD45RO− T cells, the length of which associateswith CCR5 levels. Data are from three independent donors (denoted as donorsa–c in C and D). P values, by χ2 for comparisons of the methylation content ofCCR5+ vs. CCR5− sorted T cells. Closed and open circles representmethylated andunmethylated CpG sites, respectively. Absence of circles indicates polymorphismsor no data available. The asterisks indicate a polymorphism at CpG −33 in se-lected clones. The pink arrows indicate CpG −41 that marks the transition inmethylation status. (C) Percent methylation (assessed by pyrosequencing) of theindicated CpG sites in the same T-cell subsets shown in A and B. Δ refers to therelative differences of methylation levels between CCR5+ vs. CCR5− CD45RA−CD45RO+ or CD45RA+CD45RO− CD8+ T cells in each of the three cis-regionsexamined. (D) Mean fluorescence intensity (MFI) after sorting of CCR5+CD45RA+CD45RO− CD8+ T cells (same donors as in A–C) and corresponding methylationlevels (assessed by pyrosequencing) at the indicated CpG sites. (E) Multispeciesalignment of CpG sites upstream of exon 1 in CCR5. Chimp, chimpanzee; RM,rhesus macaque; SM, sooty mangabey. Lines connecting the data points in thisfigure are provided for better visualization of the data.
4 of 10 | www.pnas.org/cgi/doi/10.1073/pnas.1423228112 Gornalusse et al.
To determine whether these epigenetic traits existed ex vivo, weinvestigated methylation levels in PBMCs of 85 HIV-positive in-dividuals (mostly European-Americans) receiving ART. These in-dividuals maintain higher activation despite viral load suppression
(i.e., residual activation) (28). This choice allowed evaluation of therelationships among activation, CCR5 methylation, and CCR5 ex-pression without the confounding effects of active viral replication.Levels of activation and CCR5 were each significantly higher on
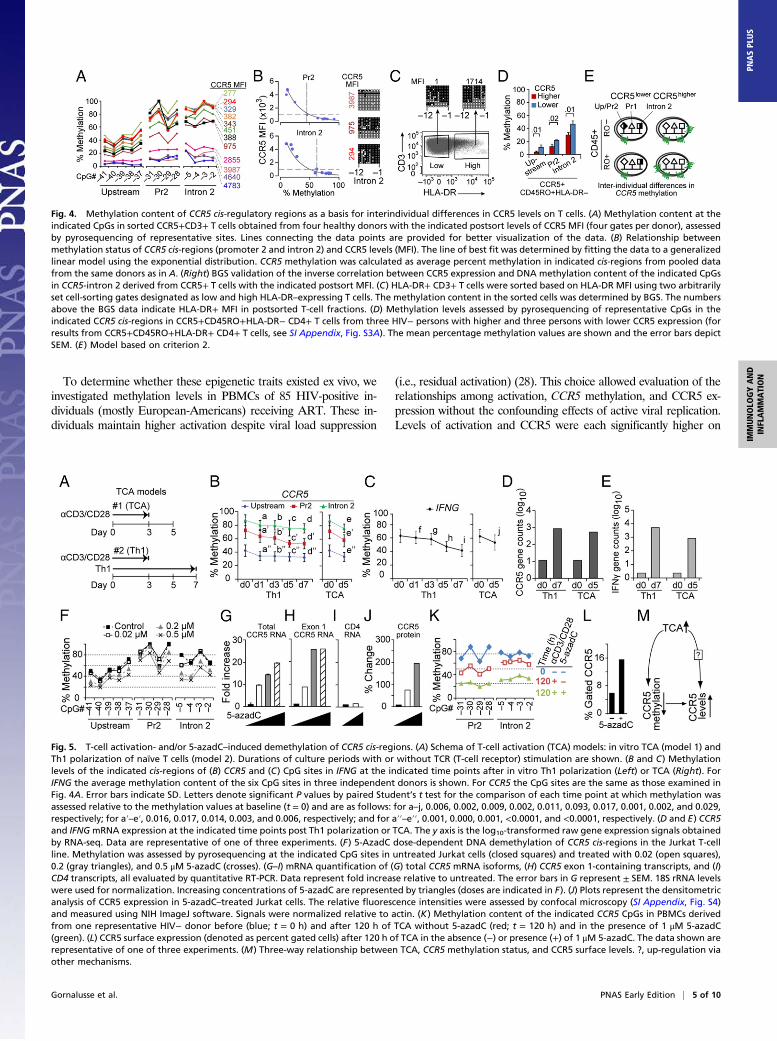
Fig. 4. Methylation content of CCR5 cis-regulatory regions as a basis for interindividual differences in CCR5 levels on T cells. (A) Methylation content at theindicated CpGs in sorted CCR5+CD3+ T cells obtained from four healthy donors with the indicated postsort levels of CCR5 MFI (four gates per donor), assessedby pyrosequencing of representative sites. Lines connecting the data points are provided for better visualization of the data. (B) Relationship betweenmethylation status of CCR5 cis-regions (promoter 2 and intron 2) and CCR5 levels (MFI). The line of best fit was determined by fitting the data to a generalizedlinear model using the exponential distribution. CCR5 methylation was calculated as average percent methylation in indicated cis-regions from pooled datafrom the same donors as in A. (Right) BGS validation of the inverse correlation between CCR5 expression and DNA methylation content of the indicated CpGsin CCR5-intron 2 derived from CCR5+ T cells with the indicated postsort MFI. (C) HLA-DR+ CD3+ T cells were sorted based on HLA-DR MFI using two arbitrarilyset cell-sorting gates designated as low and high HLA-DR–expressing T cells. The methylation content in the sorted cells was determined by BGS. The numbersabove the BGS data indicate HLA-DR+ MFI in postsorted T-cell fractions. (D) Methylation levels assessed by pyrosequencing of representative CpGs in theindicated CCR5 cis-regions in CCR5+CD45RO+HLA-DR− CD4+ T cells from three HIV− persons with higher and three persons with lower CCR5 expression (forresults from CCR5+CD45RO+HLA-DR+ CD4+ T cells, see SI Appendix, Fig. S3A). The mean percentage methylation values are shown and the error bars depictSEM. (E) Model based on criterion 2.
Fig. 5. T-cell activation- and/or 5-azadC–induced demethylation of CCR5 cis-regions. (A) Schema of T-cell activation (TCA) models: in vitro TCA (model 1) andTh1 polarization of naïve T cells (model 2). Durations of culture periods with or without TCR (T-cell receptor) stimulation are shown. (B and C) Methylationlevels of the indicated cis-regions of (B) CCR5 and (C) CpG sites in IFNG at the indicated time points after in vitro Th1 polarization (Left) or TCA (Right). ForIFNG the average methylation content of the six CpG sites in three independent donors is shown. For CCR5 the CpG sites are the same as those examined inFig. 4A. Error bars indicate SD. Letters denote significant P values by paired Student’s t test for the comparison of each time point at which methylation wasassessed relative to the methylation values at baseline (t = 0) and are as follows: for a–j, 0.006, 0.002, 0.009, 0.002, 0.011, 0.093, 0.017, 0.001, 0.002, and 0.029,respectively; for a′–e′, 0.016, 0.017, 0.014, 0.003, and 0.006, respectively; and for a′′–e′′, 0.001, 0.000, 0.001, <0.0001, and <0.0001, respectively. (D and E) CCR5and IFNGmRNA expression at the indicated time points post Th1 polarization or TCA. The y axis is the log10-transformed raw gene expression signals obtainedby RNA-seq. Data are representative of one of three experiments. (F) 5-AzadC dose-dependent DNA demethylation of CCR5 cis-regions in the Jurkat T-cellline. Methylation was assessed by pyrosequencing at the indicated CpG sites in untreated Jurkat cells (closed squares) and treated with 0.02 (open squares),0.2 (gray triangles), and 0.5 μM 5-azadC (crosses). (G–I) mRNA quantification of (G) total CCR5 mRNA isoforms, (H) CCR5 exon 1-containing transcripts, and (I)CD4 transcripts, all evaluated by quantitative RT-PCR. Data represent fold increase relative to untreated. The error bars in G represent ± SEM. 18S rRNA levelswere used for normalization. Increasing concentrations of 5-azadC are represented by triangles (doses are indicated in F). (J) Plots represent the densitometricanalysis of CCR5 expression in 5-azadC–treated Jurkat cells. The relative fluorescence intensities were assessed by confocal microscopy (SI Appendix, Fig. S4)and measured using NIH ImageJ software. Signals were normalized relative to actin. (K) Methylation content of the indicated CCR5 CpGs in PBMCs derivedfrom one representative HIV− donor before (blue; t = 0 h) and after 120 h of TCA without 5-azadC (red; t = 120 h) and in the presence of 1 μM 5-azadC(green). (L) CCR5 surface expression (denoted as percent gated cells) after 120 h of TCA in the absence (−) or presence (+) of 1 μM 5-azadC. The data shown arerepresentative of one of three experiments. (M) Three-way relationship between TCA, CCR5 methylation status, and CCR5 surface levels. ?, up-regulation viaother mechanisms.
Gornalusse et al. PNAS Early Edition | 5 of 10
IMMUNOLO
GYAND
INFLAMMATION
PNASPL
US
CD8+ compared with CD4+ T cells (P < 0.001; SI Appendix, Fig. S5A and B). Activation and CCR5 expression on CD4+ and CD8+ Tcells were positively correlated (r = 0.66 and 0.49; SI Appendix, Fig.S5 C and D). Although higher activation and CCR5 levels wereeach associated with lower methylation in CCR5-Pr2 and CCR5-intron 2, these inverse correlations were stronger for CCR5 levelsthan activation (Fig. 6B). This finding suggested that the degree ofdemethylation in CCR5 was more closely related to CCR5 levelsthan activation. The inverse correlations were also stronger for themethylation content in CCR5-intron 2 than CCR5-Pr2 (Fig. 6B andSI Appendix, Table S2, models 1 and 2). Reflecting the higher ex-pression of CCR5 on CD8+, the latter associations were stronger inCD8+ vs. CD4+ T cells.However, CCR5 methylation status was a closer indicator of
CCR5 surface levels rather than activation status (Fig. 4 C and D).Furthermore, discordant epigenetic traits (2 and 3) were present(Fig. 6A). Together, these data indicated that the associationof methylation status with CCR5 levels partly depended onwhether the accompanying activation levels were high or low. Tosubstantiate this possibility ex vivo, we conducted multivariateanalyses using the methylation data from the 85 virally sup-pressed HIV+ patients. When placed in a single model, lowermethylation in intron 2 but not in CCR5-Pr2 was associated withhigher CCR5 surface levels (P < 0.001 and P = 0.31, respectively;SI Appendix, Table S2, models 1–3). The associations betweenmethylation status of intron 2 and CCR5 levels persisted aftercontrolling for the accompanying levels of T-cell activation andproportion of naïve T cells (P = 0.001), CCR5 haplotypes in-cluding the Δ32-bearing allele (P = 0.003), and variables such asCD4+ counts before ART (P = 0.006; SI Appendix, Table S2,models 4–6). The associations between CCR5-Pr2 with CCR5levels were less robust (P = 0.05, P = 0.05, and P = 0.08; SIAppendix, Table S2, models 4–6). Naïve T cells were included inthe models to mitigate potential confounding of interindividualdifferences in the proportions of naïve T cells, because the CCR5cis-regions of CD45RO− T cells are more methylated comparedwith CD45RO+ T cells (Fig. 2 A and B). Similar associationswere detected in CD4+ T cells. However, because of lowerCCR5 levels on CD4+ compared with CD8+ T cells (SI Ap-pendix, Fig. S5), the associations were statistically weaker.Mirroring the results of the multivariate models among individuals
with comparable levels of T-cell activation (activationhigh oractivationlow), a higher vs. lower methylation (methylationhigh
vs. methylationlow) content of intron 2 was associated with lowervs. higher CCR5 levels (Fig. 6C). These findings revealed twoconcordant and two discordant activation-epigenetic traits (Fig. 6 Cand D). The concordant traits were activationhigh-methylationlow,which associated with CCR5high, and activationlow-methylationhigh,which associated with CCR5low. Discordant traits were acti-vationhigh-methylationhigh, as it was associated with CCR5low,and activationlow-methylationlow, as it was associated withCCR5high. Methylation status of CCR5-intron 2 explained 32%of the variability in CCR5 levels on CD8+ T cells, more than theexplained variability related to activation (∼26%), the proportionof naïve T cells (∼23%), or possession of CCR5-Δ32 (2%). Thediscovery that CCR5-intron 2 and to a lesser extent CCR5-Pr2predicted such a large proportion of the variability in CCR5 T-celllevels is consistent with the observation that methylation status ofCCR5-intron 2 discriminates CCR5 expression on memory T cellsto a greater degree than CCR5-Pr2 (Fig. 2 F–I).
Allele-Specific Activation-Induced Demethylation of CCR5. A possiblereason for the above-mentioned discordant epigenetic traits waspolymorphisms in CCR5 cis-regions that amplify vs. dampen thesensitivity of CCR5 cis-regions for activation-associated demethyl-ation (criterion 4). To test this idea, we focused mainly onthe ancestral −2459G/−2135T-containing CCR5-HHA haplotype(most comparable to chimpanzee CCR5) and the −2459A/−2135C-containing CCR5-HHE haplotype (Fig. 7A) for two reasons.Foremost, CCR5-HHA and -HHE haplotypes are antipodal withrespect to transcriptional (promoter) strengths (least vs. highest,respectively), and thus represent evolutionarily nodal geneticbackgrounds upon which additional promoter haplotypes that havelow (e.g., HHC) vs. high (HHG) transcriptional activity arose (Fig.7A) (6). Also, genotypes containing HHA and HHE haplotypes areassociated with reduced vs. enhanced HIV/AIDS susceptibility,respectively (4, 5, 7, 10–12).For ex vivo analyses, we evaluated the 85 HIV+ individuals
maintaining treatment-induced viral suppression (28) to enablestudy of activation stimuli (i.e., residual activation) that inducedemethylation of CCR5 cis-regions in the absence of active viralreplication. A substantial proportion of individuals without theCCR5-Δ32–containing HHG*2 haplotype (Wt/Wt) had CCR5levels as low as those of CCR5-Δ32 heterozygotes (Fig. 7B,columns 1 and 2, respectively). A progressive increase in methylationcontent [quartile (Q) 1→Q4; i.e., hypermethylation] of intron 2 in
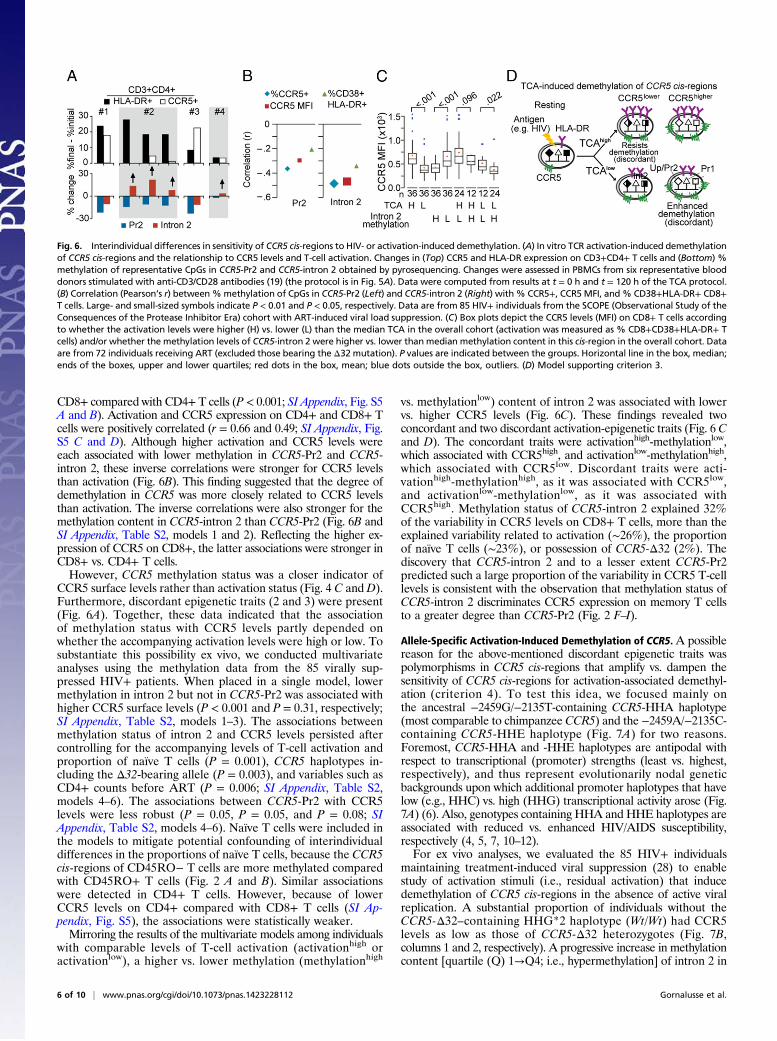
Fig. 6. Interindividual differences in sensitivity of CCR5 cis-regions to HIV- or activation-induced demethylation. (A) In vitro TCR activation-induced demethylationof CCR5 cis-regions and the relationship to CCR5 levels and T-cell activation. Changes in (Top) CCR5 and HLA-DR expression on CD3+CD4+ T cells and (Bottom) %methylation of representative CpGs in CCR5-Pr2 and CCR5-intron 2 obtained by pyrosequencing. Changes were assessed in PBMCs from six representative blooddonors stimulated with anti-CD3/CD28 antibodies (19) (the protocol is in Fig. 5A). Data were computed from results at t = 0 h and t = 120 h of the TCA protocol.(B) Correlation (Pearson’s r) between%methylation of CpGs in CCR5-Pr2 (Left) and CCR5-intron 2 (Right) with% CCR5+, CCR5 MFI, and% CD38+HLA-DR+ CD8+T cells. Large- and small-sized symbols indicate P < 0.01 and P < 0.05, respectively. Data are from 85 HIV+ individuals from the SCOPE (Observational Study of theConsequences of the Protease Inhibitor Era) cohort with ART-induced viral load suppression. (C) Box plots depict the CCR5 levels (MFI) on CD8+ T cells accordingto whether the activation levels were higher (H) vs. lower (L) than the median TCA in the overall cohort (activation was measured as % CD8+CD38+HLA-DR+ Tcells) and/or whether the methylation levels of CCR5-intron 2 were higher vs. lower thanmedian methylation content in this cis-region in the overall cohort. Dataare from 72 individuals receiving ART (excluded those bearing the Δ32 mutation). P values are indicated between the groups. Horizontal line in the box, median;ends of the boxes, upper and lower quartiles; red dots in the box, mean; blue dots outside the box, outliers. (D) Model supporting criterion 3.
6 of 10 | www.pnas.org/cgi/doi/10.1073/pnas.1423228112 Gornalusse et al.
Wt/Wt genotypes was associated with progressively lower CCR5levels (Fig. 7B, columns 3–6). Modest differences in methylationcontent (∼8–10% between quartiles) were associated with prom-inent differences in CCR5 levels (Fig. 7B, columns 3–6). Methyl-ation quartiles 3 and 4 were associated with CCR5 levels similar tothose of CCR5-Δ32 heterozygotes (Fig. 7B, compare columns 5and 6 vs. 2). Similarly, among CCR5-Δ32 heterozygotes, highermethylation status of intron 2 was associated with even lowerCCR5 levels (Fig. 7B, compare column 7 vs. 8).A progressive increase in methylation in CCR5-intron 2 was
associated with a stepwise decrease in the proportion of Wt/Wtchromosomes with the HIV disease-accelerating HHE haplotype(P = 0.002 by Cochran–Amitrage test for trend) and, conversely,an increase in the proportion of Wt/Wt chromosomes with HIVdisease-retarding haplotypes (e.g., HHA, HHC, and HHF*2)(4, 5, 7, 10–12) (Fig. 7B, pie slices). The detrimental HHE wasassociated with an ∼70% lower likelihood, whereas the pro-tective CCR5-HHC/HHC genotype (5, 7) was associated with a
3.7-fold higher likelihood of having higher compared with lowermethylation in intron 2 [HHE: odds ratio (OR) = 0.28, 95%confidence interval (CI) = 0.11–0.74, P = 0.01; CCR5-HHC/HHC genotype: OR = 3.67, 95% CI = 0.90–14.90, P = 0.06].These data indicated that T-cell CCR5 levels linked to a CCR5
haplotype pair (genotype) are, in part, related to whether one orboth haplotypes manifest increased (e.g., HHE) vs. reduced (e.g.,HHA or HHC) sensitivity to activation-associated demethyla-tion. Congruent with this idea, genotypes containing at least oneHHE compared with those lacking HHE were associated withhigher CCR5 levels (Fig. 7C) and lower intron 2 methylationcontent (Fig. 7D). In contrast, HHC/HHC compared with HHC/HHE haplotype pairs were associated with lower CCR5 levels(Fig. 7C) and higher intron 2 methylation content (Fig. 7D).To mitigate confounding effects of the CCR5-Δ32 mutation onCCR5 levels, in these analyses we excluded individuals (n = 13)bearing one Δ32-containing HHG*2 haplotype. In our cohort, thoselacking HHE mainly had the CCR5-HHA/HHC or -HHC/HHC
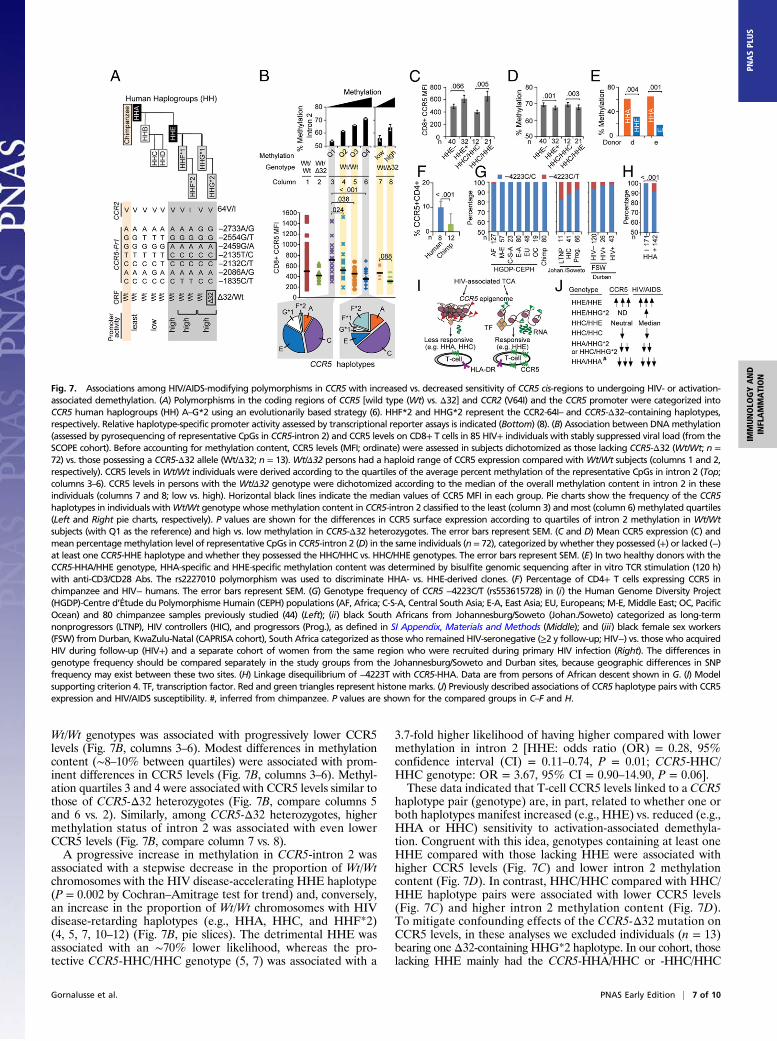
Fig. 7. Associations among HIV/AIDS-modifying polymorphisms in CCR5 with increased vs. decreased sensitivity of CCR5 cis-regions to undergoing HIV- or activation-associated demethylation. (A) Polymorphisms in the coding regions of CCR5 [wild type (Wt) vs. Δ32] and CCR2 (V64I) and the CCR5 promoter were categorized intoCCR5 human haplogroups (HH) A–G*2 using an evolutionarily based strategy (6). HHF*2 and HHG*2 represent the CCR2-64I– and CCR5-Δ32–containing haplotypes,respectively. Relative haplotype-specific promoter activity assessed by transcriptional reporter assays is indicated (Bottom) (8). (B) Association between DNAmethylation(assessed by pyrosequencing of representative CpGs in CCR5-intron 2) and CCR5 levels on CD8+ T cells in 85 HIV+ individuals with stably suppressed viral load (from theSCOPE cohort). Before accounting for methylation content, CCR5 levels (MFI; ordinate) were assessed in subjects dichotomized as those lacking CCR5-Δ32 (Wt/Wt; n =72) vs. those possessing a CCR5-Δ32 allele (Wt/Δ32; n = 13). Wt/Δ32 persons had a haploid range of CCR5 expression compared with Wt/Wt subjects (columns 1 and 2,respectively). CCR5 levels inWt/Wt individuals were derived according to the quartiles of the average percent methylation of the representative CpGs in intron 2 (Top;columns 3–6). CCR5 levels in persons with the Wt/Δ32 genotype were dichotomized according to the median of the overall methylation content in intron 2 in theseindividuals (columns 7 and 8; low vs. high). Horizontal black lines indicate the median values of CCR5 MFI in each group. Pie charts show the frequency of the CCR5haplotypes in individuals withWt/Wt genotype whose methylation content in CCR5-intron 2 classified to the least (column 3) and most (column 6) methylated quartiles(Left and Right pie charts, respectively). P values are shown for the differences in CCR5 surface expression according to quartiles of intron 2 methylation in Wt/Wtsubjects (with Q1 as the reference) and high vs. low methylation in CCR5-Δ32 heterozygotes. The error bars represent SEM. (C and D) Mean CCR5 expression (C) andmean percentagemethylation level of representative CpGs in CCR5-intron 2 (D) in the same individuals (n = 72), categorized by whether they possessed (+) or lacked (−)at least one CCR5-HHE haplotype and whether they possessed the HHC/HHC vs. HHC/HHE genotypes. The error bars represent SEM. (E) In two healthy donors with theCCR5-HHA/HHE genotype, HHA-specific and HHE-specific methylation content was determined by bisulfite genomic sequencing after in vitro TCR stimulation (120 h)with anti-CD3/CD28 Abs. The rs2227010 polymorphism was used to discriminate HHA- vs. HHE-derived clones. (F) Percentage of CD4+ T cells expressing CCR5 inchimpanzee and HIV− humans. The error bars represent SEM. (G) Genotype frequency of CCR5 −4223C/T (rs553615728) in (i) the Human Genome Diversity Project(HGDP)-Centre d’Étude du Polymorphisme Humain (CEPH) populations (AF, Africa; C-S-A, Central South Asia; E-A, East Asia; EU, Europeans; M-E, Middle East; OC, PacificOcean) and 80 chimpanzee samples previously studied (44) (Left); (ii) black South Africans from Johannesburg/Soweto (Johan./Soweto) categorized as long-termnonprogressors (LTNP), HIV controllers (HIC), and progressors (Prog.), as defined in SI Appendix, Materials and Methods (Middle); and (iii) black female sex workers(FSW) from Durban, KwaZulu-Natal (CAPRISA cohort), South Africa categorized as those who remained HIV-seronegative (≥2 y follow-up; HIV−) vs. those who acquiredHIV during follow-up (HIV+) and a separate cohort of women from the same region who were recruited during primary HIV infection (Right). The differences ingenotype frequency should be compared separately in the study groups from the Johannesburg/Soweto and Durban sites, because geographic differences in SNPfrequency may exist between these two sites. (H) Linkage disequilibrium of −4223T with CCR5-HHA. Data are from persons of African descent shown in G. (I) Modelsupporting criterion 4. TF, transcription factor. Red and green triangles represent histone marks. (J) Previously described associations of CCR5 haplotype pairs with CCR5expression and HIV/AIDS susceptibility. #, inferred from chimpanzee. P values are shown for the compared groups in C–F and H.
Gornalusse et al. PNAS Early Edition | 7 of 10
IMMUNOLO
GYAND
INFLAMMATION
PNASPL
US
haplotype pairs; these genotypes are associated with lower CCR5expression, HIV disease retardation, and higher cell-mediated im-munity (5). These methylation patterns linked to CCR5 genotypewere confirmed in a cohort of 81 therapy-naïve HIV+ women fromUkraine (SI Appendix, Fig. S6A).To further confirm that CCR5 haplotypes are associated with dif-
ferential susceptibilities to undergoing activation-induced demethyl-ation, we evaluated T cells derived from HIV-negative persons withthe CCR5-HHA/HHE haplotype pair after in vitro TCR (T-cell re-ceptor) stimulation with anti-CD3/CD28 antibodies. This approachhad three advantages. First, it allowed us to evaluate the extent ofactivation-induced demethylation of the CCR5-HHA and -HHEhaplotypes concurrently using identical in vitro T-cell activationconditions. We focused on CCR5-HHA and -HHE because, asnoted above, they are associated with antipodal transcriptionaland clinical outcomes, and HHA is the ancestral haplotype. Second,this approach mitigated the confounding that occurs when com-paring persons with the CCR5-HHA/HHA vs. -HHE/HHE haplo-type pairs, as differences in their immune health could influencemethylation status. Third, this approach controls for racial differ-ences, as HHA/HHA and HHE/HHE are prevalent mainly inpersons of African vs. European descent (29).We observed thatCCR5-HHA andCCR5-HHE exhibited reduced
vs. increased permissiveness, respectively, to undergo activation-induced demethylation in vitro (Fig. 7E). This was also associatedwith differential production of HHA (less) and HHE (more) specificmRNA in heterozygous HHA/HHE donors (SI Appendix, Fig. S6 Band C). The idea that the ancestral HHA is a correlate of reducedCCR5 transcription/expression was also highlighted by cross-speciescomparisons of CCR5 levels. Chimpanzees are homozygous forHHA (6), and % CD4+CCR5+ T cells expressing CD4+ cells waslower in chimpanzees vs. humans (Fig. 7F).Genotype-dependent differences in responsiveness to activation-
associated demethylation in humans may relate to the finding thatsingle-nucleotide polymorphisms (SNPs) in CCR5 cis-regions createor disrupt CpG dinucleotides in a haplotype-specific manner (SIAppendix, Fig. S7). These haplotype-specific polymorphisms couldpotentially alter the binding of several transcription factors, includingthose that were previously implicated in CCR5 regulation [e.g.,C/EBPβ, CREB1, and POU2F2/Oct-2 (19–21)], and thus mightimpact CCR5 transcription and its expression (SI Appendix, Fig. S8).Of note, an SNP designated −4223C/T (rs553615728) (30) dis-
rupts the CpG −41 site (SI Appendix, Fig. S7) and alters the coreconsensus motif of a CREB1 binding site (SI Appendix, Fig. S8 Aand B). This SNP is uniquely present in persons from southernAfrica (Fig. 7G, Left), and it occurs on the background of HHA(Fig. 7H and SI Appendix, Fig. S7). To determine its associations, weexamined blacks from two separate regions of South Africa. Inblacks from Johannesburg/Soweto, the frequency of this SNP wasgreater in long-term nonprogressors and HIV controllers comparedwith progressors (Fig. 7G, Middle). In black female sex workersfrom Durban (31), this SNP was overrepresented in those resistingHIV infection compared with those who subsequently acquiredHIV infection as well as a separate cohort of women recruitedduring primary HIV infection (Fig. 7G, Right). Although suggestiveof a protective effect, these associations did not reach statisticalsignificance because of the low prevalence of the SNP in the generalpopulation and small sample sizes. Electrophoretic mobility shiftassays (EMSAs) showed reduced binding of CREB1 to the poly-morphic −4223T compared with wild-type −4223C (SI Appendix,Fig. S8C). Notably, publicly available ChIP-seq data confirmed celltype-specific ex vivo CREB1 enrichment in this region (Fig. 1B andSI Appendix, Fig. S8D).Collectively, these data support criterion 4 (Fig. 7I). They also
provide an epigenetic mechanism for the reported associations ofCCR5 genotype with HIV acquisition/disease shown in Fig. 7J.These associations reflect whether the CCR5 genotype containsone or two haplotypes with CCR5 cis-regions that correlate with
(i) increased (e.g., HHE) vs. reduced (e.g., HHA, HHC) sensi-tivity to activation-induced demethylation and epigenetic remod-eling, and (ii) whether the genotype did vs. did not contain theCCR5-Δ32–containing HHG*2 haplotype (Fig. 7J).
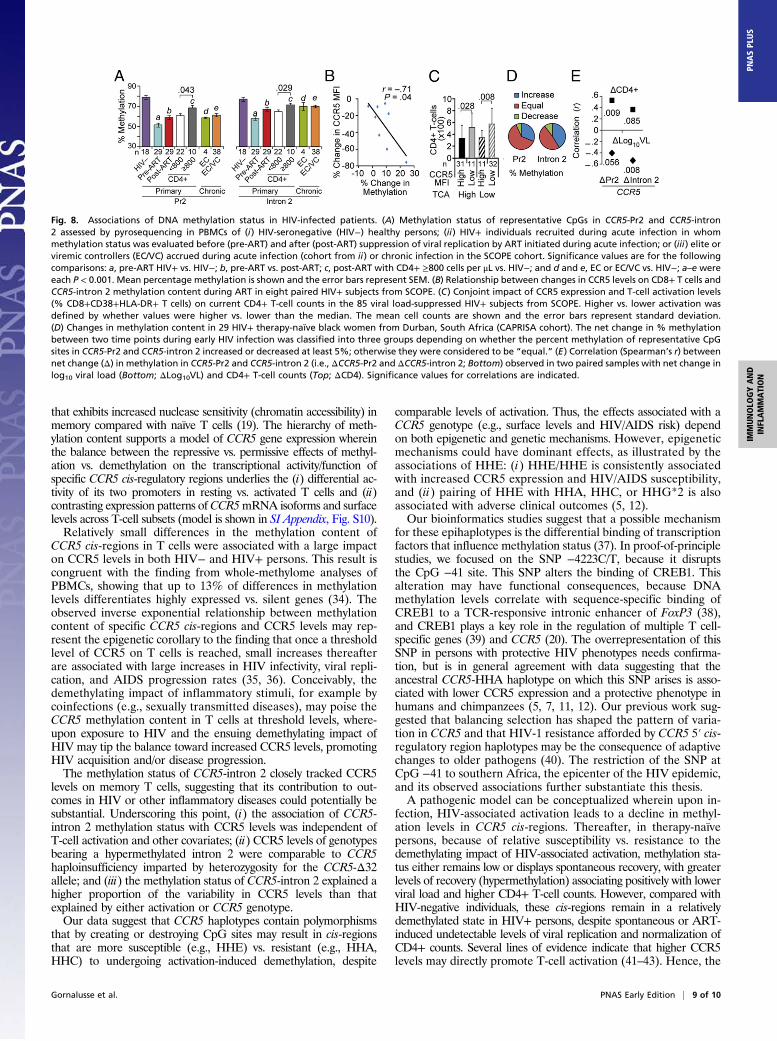
Association of CCR5 DNA Methylation and HIV Disease. HIV-associ-ated demethylation of CCR5 cis-regions was confirmed in a cohortwith primary HIV infection (Fig. 8A) and two groups of patientswith chronic untreated infection (SI Appendix, Fig. S9A). Suppres-sion of viral replication by ART during primary infection was as-sociated with increased methylation (Fig. 8A). Methylation in CCR5cis-regions was similar in individuals with viral load suppressed byART and in spontaneous virologic controllers [i.e., HIV+ in-dividuals who maintain a low viral load without ART (32)], but themethylation content in both groups was significantly lower than thatin HIV− persons (Fig. 8A).When comparing individuals with chronic HIV infection for
whom pre- and posttreatment CD4+ data were available (n = 8),initiation of ART was associated with decreased CCR5 levels (P =0.04) and increased methylation content of CCR5-intron 2 (P =0.02). In paired analyses, changes in methylation status of intron 2and CCR5 levels were negatively correlated (rho = −0.71, P = 0.04;Fig. 8B). Previously, we showed that in patients receiving ART,normalization of CD4+ counts (>800 cells per μL) was associatedwith beneficial clinical and immune outcomes (33). In the presentstudy, among HIV+ patients who received ART during primaryinfection, CD4+ ≥800 vs. <800 cells per μL was associated withhigher intron 2 methylation status (Fig. 8A). However, despitereaching CD4+ normalization, methylation content in intron 2remained lower than in HIV− persons (Fig. 8A). In the 85 HIV+patients receiving ART, methylation status of intron 2 was an in-dependent determinant of CCR5 levels (Fig. 6C and SI Appendix,Table S2). In these individuals, CCR5 levels and activation hadadditive effects on current CD4+ counts (Fig. 8C).We also examined 29 therapy-naïve HIV+ South African women
with known estimated dates of infection, from whom samples at twotime points post HIV infection were available. Spontaneous (albeitincomplete) recovery of the methylation status of CCR5 cis-regionswas associated with a lower viral load and higher CD4+ during theearly stages of untreated HIV (Fig. 8 D and E). Representativeexamples are shown in SI Appendix, Fig. S9B.
DiscussionUsing both in vitro and ex vivo approaches, we demonstrate thatthe methylation status of CCR5 cis-regions satisfies the criteria toserve as a unifying mechanism for the four characteristic features ofCCR5 expression on T cells (SI Appendix, Fig. S1): manifestingdifferences among distinct T-cell subsets and individuals as amechanism for inter–T cell-type and interindividual differences inCCR5 expression (criteria 1 and 2); responsiveness to activation as amechanism for the positive correlation between activation andCCR5 levels (criterion 3); and CCR5 genotype-dependent differ-ences in sensitivity to activation as a mechanism for interindividualdifferences in susceptibility to activation- or HIV-associated up-regulation of CCR5 expression (criterion 4). We therefore proposethat the constitutive and activation-induced DNA methylation sta-tus of CCR5 cis-regions may contribute substantially to HIV riskand immune outcomes (SI Appendix, Fig. S1).Our results indicate that CpG −41 represents an evolutionarily
conserved epigenetic and transcriptional landmark. Downstreamof this CpG site, CCR5 cis-regions manifest a specific hierarchy ofmethylation content (highest to least) that depends on both thedifferentiation and CCR5 expression status of T cells [i.e., RA+RO− CCR5− > RA+RO− CCR5+ (TEMRA) ≥ RA−RO+CCR5− >RA−RO+ CCR5+ T cells]. This hierarchy suggests thatupon activation and differentiation of T cells, DNA demethylation inthe CCR5 cis-region commences close to this site. Further sub-stantiating this possibility, this CpG site colocalizes within a region
8 of 10 | www.pnas.org/cgi/doi/10.1073/pnas.1423228112 Gornalusse et al.
that exhibits increased nuclease sensitivity (chromatin accessibility) inmemory compared with naïve T cells (19). The hierarchy of meth-ylation content supports a model of CCR5 gene expression whereinthe balance between the repressive vs. permissive effects of methyl-ation vs. demethylation on the transcriptional activity/function ofspecific CCR5 cis-regulatory regions underlies the (i) differential ac-tivity of its two promoters in resting vs. activated T cells and (ii)contrasting expression patterns ofCCR5mRNA isoforms and surfacelevels across T-cell subsets (model is shown in SI Appendix, Fig. S10).Relatively small differences in the methylation content of
CCR5 cis-regions in T cells were associated with a large impacton CCR5 levels in both HIV− and HIV+ persons. This result iscongruent with the finding from whole-methylome analyses ofPBMCs, showing that up to 13% of differences in methylationlevels differentiates highly expressed vs. silent genes (34). Theobserved inverse exponential relationship between methylationcontent of specific CCR5 cis-regions and CCR5 levels may rep-resent the epigenetic corollary to the finding that once a thresholdlevel of CCR5 on T cells is reached, small increases thereafterare associated with large increases in HIV infectivity, viral repli-cation, and AIDS progression rates (35, 36). Conceivably, thedemethylating impact of inflammatory stimuli, for example bycoinfections (e.g., sexually transmitted diseases), may poise theCCR5 methylation content in T cells at threshold levels, where-upon exposure to HIV and the ensuing demethylating impact ofHIV may tip the balance toward increased CCR5 levels, promotingHIV acquisition and/or disease progression.The methylation status of CCR5-intron 2 closely tracked CCR5
levels on memory T cells, suggesting that its contribution to out-comes in HIV or other inflammatory diseases could potentially besubstantial. Underscoring this point, (i) the association of CCR5-intron 2 methylation status with CCR5 levels was independent ofT-cell activation and other covariates; (ii) CCR5 levels of genotypesbearing a hypermethylated intron 2 were comparable to CCR5haploinsufficiency imparted by heterozygosity for the CCR5-Δ32allele; and (iii) the methylation status of CCR5-intron 2 explained ahigher proportion of the variability in CCR5 levels than thatexplained by either activation or CCR5 genotype.Our data suggest that CCR5 haplotypes contain polymorphisms
that by creating or destroying CpG sites may result in cis-regionsthat are more susceptible (e.g., HHE) vs. resistant (e.g., HHA,HHC) to undergoing activation-induced demethylation, despite
comparable levels of activation. Thus, the effects associated with aCCR5 genotype (e.g., surface levels and HIV/AIDS risk) dependon both epigenetic and genetic mechanisms. However, epigeneticmechanisms could have dominant effects, as illustrated by theassociations of HHE: (i) HHE/HHE is consistently associatedwith increased CCR5 expression and HIV/AIDS susceptibility,and (ii) pairing of HHE with HHA, HHC, or HHG*2 is alsoassociated with adverse clinical outcomes (5, 12).Our bioinformatics studies suggest that a possible mechanism
for these epihaplotypes is the differential binding of transcriptionfactors that influence methylation status (37). In proof-of-principlestudies, we focused on the SNP −4223C/T, because it disruptsthe CpG −41 site. This SNP alters the binding of CREB1. Thisalteration may have functional consequences, because DNAmethylation levels correlate with sequence-specific binding ofCREB1 to a TCR-responsive intronic enhancer of FoxP3 (38),and CREB1 plays a key role in the regulation of multiple T cell-specific genes (39) and CCR5 (20). The overrepresentation of thisSNP in persons with protective HIV phenotypes needs confirma-tion, but is in general agreement with data suggesting that theancestral CCR5-HHA haplotype on which this SNP arises is asso-ciated with lower CCR5 expression and a protective phenotype inhumans and chimpanzees (5, 7, 11, 12). Our previous work sug-gested that balancing selection has shaped the pattern of varia-tion in CCR5 and that HIV-1 resistance afforded by CCR5 5′ cis-regulatory region haplotypes may be the consequence of adaptivechanges to older pathogens (40). The restriction of the SNP atCpG −41 to southern Africa, the epicenter of the HIV epidemic,and its observed associations further substantiate this thesis.A pathogenic model can be conceptualized wherein upon in-
fection, HIV-associated activation leads to a decline in methyl-ation levels in CCR5 cis-regions. Thereafter, in therapy-naïvepersons, because of relative susceptibility vs. resistance to thedemethylating impact of HIV-associated activation, methylation sta-tus either remains low or displays spontaneous recovery, with greaterlevels of recovery (hypermethylation) associating positively with lowerviral load and higher CD4+ T-cell counts. However, compared withHIV-negative individuals, these cis-regions remain in a relativelydemethylated state in HIV+ persons, despite spontaneous or ART-induced undetectable levels of viral replication and normalization ofCD4+ counts. Several lines of evidence indicate that higher CCR5levels may directly promote T-cell activation (41–43). Hence, the
Fig. 8. Associations of DNA methylation status in HIV-infected patients. (A) Methylation status of representative CpGs in CCR5-Pr2 and CCR5-intron2 assessed by pyrosequencing in PBMCs of (i) HIV-seronegative (HIV−) healthy persons; (ii) HIV+ individuals recruited during acute infection in whommethylation status was evaluated before (pre-ART) and after (post-ART) suppression of viral replication by ART initiated during acute infection; or (iii) elite orviremic controllers (EC/VC) accrued during acute infection (cohort from ii) or chronic infection in the SCOPE cohort. Significance values are for the followingcomparisons: a, pre-ART HIV+ vs. HIV−; b, pre-ART vs. post-ART; c, post-ART with CD4+ ≥800 cells per μL vs. HIV−; and d and e, EC or EC/VC vs. HIV−; a–e wereeach P < 0.001. Mean percentage methylation is shown and the error bars represent SEM. (B) Relationship between changes in CCR5 levels on CD8+ T cells andCCR5-intron 2 methylation content during ART in eight paired HIV+ subjects from SCOPE. (C) Conjoint impact of CCR5 expression and T-cell activation levels(% CD8+CD38+HLA-DR+ T cells) on current CD4+ T-cell counts in the 85 viral load-suppressed HIV+ subjects from SCOPE. Higher vs. lower activation wasdefined by whether values were higher vs. lower than the median. The mean cell counts are shown and the error bars represent standard deviation.(D) Changes in methylation content in 29 HIV+ therapy-naïve black women from Durban, South Africa (CAPRISA cohort). The net change in % methylationbetween two time points during early HIV infection was classified into three groups depending on whether the percent methylation of representative CpGsites in CCR5-Pr2 and CCR5-intron 2 increased or decreased at least 5%; otherwise they were considered to be “equal.” (E) Correlation (Spearman’s r) betweennet change (Δ) in methylation in CCR5-Pr2 and CCR5-intron 2 (i.e., ΔCCR5-Pr2 and ΔCCR5-intron 2; Bottom) observed in two paired samples with net change inlog10 viral load (Bottom; ΔLog10VL) and CD4+ T-cell counts (Top; ΔCD4). Significance values for correlations are indicated.
Gornalusse et al. PNAS Early Edition | 9 of 10
IMMUNOLO
GYAND
INFLAMMATION
PNASPL
US
higher CCR5 associated with a demethylated CCR5 cis-region inHIV+ persons, despite suppression of viral load and CD4+ nor-malization, may serve as a persistent stimulus for low-grade residualT-cell activation. This may explain why CCR5 blockers are associatedwith immunologic benefits unrelated to an antiviral effect (1).In summary, our findings provide a paradigmatic example by
which epigenetic mechanisms that regulate gene expression (e.g.,DNA methylation of cis-regulatory regions) may interact withgenetics (e.g., promoter polymorphisms) and environment-inducedhost responses (e.g., activation in response to HIV infection) toaffect a trait (i.e., CCR5 surface levels) that influences diseaseoutcomes (i.e., HIV/AIDS susceptibility). The coupling of activa-tion with genetically determined differences in activation-induceddemethylation provides a heretofore unrecognized link amongactivation and CCR5 epigenetic/genetic traits with HIV/AIDSsusceptibility. Therapeutic exploitation of this link may have clinicalutility. The proclivity of CCR5 cis-regions to undergo demethylationupon activation may promote the life cycle of HIV and sustain theHIV epidemic, especially because the CCR5 haplotype (HHE) withgreatest susceptibility for demethylation upon activation, a centralfeature of HIV infection, is among the most prevalent CCR5 hap-lotypes in human populations (29).
Materials and MethodsAll studies were approved by the Institutional Review Boards at the
University of Texas Health Science Center at San Antonio and institutionsparticipating in this study. Detailed methods for cell culture, PBMC isolation,flow cytometry and cell sorting, Th1 polarization, 5-azadC treatment, andstatistical analyses are provided in SI Appendix,Materials and Methods. CCR5numbering system is as described previously (6) and the CpG sites examinedare shown in SI Appendix, Table S1. CCR5 polymorphisms were genotyped aspreviously described (7). DNA methylation status was assessed by bisulfitegenomic sequencing and also by pyrosequencing assays. Primers and PCRconditions are listed in SI Appendix, Tables S3 and S4, respectively, andquality controls are shown in SI Appendix, Fig. S11 and Table S5. Methylationlevels were measured in PBMCs for cohort studies except for subjects fromUkraine, in whom whole blood was used. We used previously publishedmethods for conducting antibody mobility shift assays and RT-PCR (6, 19).Experimental details for RNA-seq are provided in SI Appendix, Materials andMethods. The sequences of the oligonucleotides used for performing allelicexpression imbalance analysis and EMSA are shown in SI Appendix, Table S3.Details of motif analysis for transcription factor binding sites are in SI Ap-pendix, Materials and Methods.
ACKNOWLEDGMENTS. Acknowledgments and funding agencies that sup-ported this work are indicated in SI Appendix.
1. Corbeau P, Reynes J (2009) CCR5 antagonism in HIV infection: Ways, effects, and sideeffects. AIDS 23(15):1931–1943.
2. Paxton WA, et al. (1998) Reduced HIV-1 infectability of CD4+ lymphocytes from ex-posed-uninfected individuals: Association with low expression of CCR5 and highproduction of beta-chemokines. Virology 244(1):66–73.
3. Reynes J, Baillat V, Portales P, Clot J, Corbeau P (2003) Low CD4+ T-cell surface CCR5 densityas a cause of resistance to in vivo HIV-1 infection. J Acquir Immune Defic Syndr 34(1):114–116.
4. Hladik F, et al. (2005) Combined effect of CCR5-delta32 heterozygosity and the CCR5promoter polymorphism −2459 A/G on CCR5 expression and resistance to humanimmunodeficiency virus type 1 transmission. J Virol 79(18):11677–11684.
5. Catano G, et al. (2011) Concordance of CCR5 genotypes that influence cell-mediatedimmunity and HIV-1 disease progression rates. J Infect Dis 203(2):263–272.
6. Mummidi S, et al. (2000) Evolution of human and non-human primate CC chemokinereceptor 5 gene and mRNA. Potential roles for haplotype and mRNA diversity, dif-ferential haplotype-specific transcriptional activity, and altered transcription factorbinding to polymorphic nucleotides in the pathogenesis of HIV-1 and simian immu-nodeficiency virus. J Biol Chem 275(25):18946–18961.
7. Gonzalez E, et al. (1999) Race-specific HIV-1 disease-modifying effects associated withCCR5 haplotypes. Proc Natl Acad Sci USA 96(21):12004–12009.
8. Kawamura T, et al. (2003) R5 HIV productively infects Langerhans cells, and infectionlevels are regulated by compound CCR5 polymorphisms. Proc Natl Acad Sci USA100(14):8401–8406.
9. Salkowitz JR, et al. (2003) CCR5 promoter polymorphism determines macrophage CCR5density and magnitude of HIV-1 propagation in vitro. Clin Immunol 108(3):234–240.
10. Martin MP, et al. (1998) Genetic acceleration of AIDS progression by a promotervariant of CCR5. Science 282(5395):1907–1911.
11. Tang J, et al. (2002) Distribution of chemokine receptor CCR2 and CCR5 genotypesand their relative contribution to human immunodeficiency virus type 1 (HIV-1) se-roconversion, early HIV-1 RNA concentration in plasma, and later disease progression.J Virol 76(2):662–672.
12. Kaslow RA, Dorak T, Tang JJ (2005) Influence of host genetic variation on suscepti-bility to HIV type 1 infection. J Infect Dis 191(Suppl 1):S68–S77.
13. Wu L, et al. (1997) CCR5 levels and expression pattern correlate with infectability bymacrophage-tropic HIV-1, in vitro. J Exp Med 185(9):1681–1691.
14. Bleul CC, Wu L, Hoxie JA, Springer TA, Mackay CR (1997) The HIV coreceptors CXCR4and CCR5 are differentially expressed and regulated on human T lymphocytes. ProcNatl Acad Sci USA 94(5):1925–1930.
15. Ostrowski MA, et al. (1998) Expression of chemokine receptors CXCR4 and CCR5 inHIV-1-infected and uninfected individuals. J Immunol 161(6):3195–3201.
16. Cedar H, Bergman Y (2012) Programming of DNA methylation patterns. Annu RevBiochem 81:97–117.
17. Lim PS, Shannon MF, Hardy K (2010) Epigenetic control of inducible gene expressionin the immune system. Epigenomics 2(6):775–795.
18. Schalkwyk LC, et al. (2010) Allelic skewing of DNA methylation is widespread acrossthe genome. Am J Hum Genet 86(2):196–212.
19. Mummidi S, et al. (2007) Production of specific mRNA transcripts, usage of analternate promoter, and octamer-binding transcription factors influence thesurface expression levels of the HIV coreceptor CCR5 on primary T cells. J Immunol178(9):5668–5681.
20. Kuipers HF, et al. (2008) CC chemokine receptor 5 gene promoter activation by thecyclic AMP response element binding transcription factor. Blood 112(5):1610–1619.
21. Rosati M, Valentin A, Patenaude DJ, Pavlakis GN (2001) CCAAT-enhancer-bindingprotein beta (C/EBP beta) activates CCR5 promoter: Increased C/EBP beta and CCR5 inT lymphocytes from HIV-1-infected individuals. J Immunol 167(3):1654–1662.
22. Heidari N, et al. (2014) Genome-wide map of regulatory interactions in the humangenome. Genome Res 24(12):1905–1917.
23. Loetscher P, et al. (1998) CCR5 is characteristic of Th1 lymphocytes. Nature 391(6665):344–345.
24. Oswald-Richter K, et al. (2007) Identification of a CCR5-expressing T cell subset that isresistant to R5-tropic HIV infection. PLoS Pathog 3(4):e58.
25. Wierda RJ, et al. (2012) Epigenetic control of CCR5 transcript levels in immune cellsand modulation by small molecules inhibitors. J Cell Mol Med 16(8):1866–1877.
26. Moon C, et al. (2009) Use of epigenetic modification to induce FOXP3 expression innaïve T cells. Transplant Proc 41(5):1848–1854.
27. Youngblood B, et al. (2011) Chronic virus infection enforces demethylation of thelocus that encodes PD-1 in antigen-specific CD8(+) T cells. Immunity 35(3):400–412.
28. Hunt PW, et al. (2008) Relationship between T cell activation and CD4+ T cell count inHIV-seropositive individuals with undetectable plasma HIV RNA levels in the absenceof therapy. J Infect Dis 197(1):126–133.
29. Gonzalez E, et al. (2001) Global survey of genetic variation in CCR5, RANTES, and MIP-1alpha: Impact on the epidemiology of the HIV-1 pandemic. Proc Natl Acad Sci USA98(9):5199–5204.
30. Picton AC, Paximadis M, Tiemessen CT (2010) Genetic variation within the gene en-coding the HIV-1 CCR5 coreceptor in two South African populations. Infect Genet Evol10(4):487–494.
31. Ramsuran V, et al. (2011) Duffy-null-associated low neutrophil counts influence HIV-1susceptibility in high-risk South African black women. Clin Infect Dis 52(10):1248–1256.
32. Deeks SG, Walker BD (2007) Human immunodeficiency virus controllers: Mechanismsof durable virus control in the absence of antiretroviral therapy. Immunity 27(3):406–416.
33. Okulicz JF, et al. (2015) Influence of the timing of antiretroviral therapy on the potentialfor normalization of immune status in human immunodeficiency virus 1–infected in-dividuals. JAMA Intern Med 175(1):88–99.
34. Li Y, et al. (2010) The DNA methylome of human peripheral blood mononuclear cells.PLoS Biol 8(11):e1000533.
35. Platt EJ, Wehrly K, Kuhmann SE, Chesebro B, Kabat D (1998) Effects of CCR5 and CD4cell surface concentrations on infections by macrophagetropic isolates of humanimmunodeficiency virus type 1. J Virol 72(4):2855–2864.
36. Lin YL, et al. (2002) Cell surface CCR5 density determines the postentry efficiency ofR5 HIV-1 infection. Proc Natl Acad Sci USA 99(24):15590–15595.
37. Leung A, Schones DE, Natarajan R (2012) Using epigenetic mechanisms to un-derstand the impact of common disease causing alleles. Curr Opin Immunol 24(5):558–563.
38. Kim HP, Leonard WJ (2007) CREB/ATF-dependent T cell receptor-induced FoxP3 geneexpression: A role for DNA methylation. J Exp Med 204(7):1543–1551.
39. Wen AY, Sakamoto KM, Miller LS (2010) The role of the transcription factor CREB inimmune function. J Immunol 185(11):6413–6419.
40. Bamshad MJ, et al. (2002) A strong signature of balancing selection in the 5′ cis-regulatory region of CCR5. Proc Natl Acad Sci USA 99(16):10539–10544.
41. Camargo JF, et al. (2009) CCR5 expression levels influence NFAT translocation, IL-2production, and subsequent signaling events during T lymphocyte activation. J Immunol182(1):171–182.
42. Portales P, et al. (2012) The intensity of immune activation is linked to the levelof CCR5 expression in human immunodeficiency virus type 1-infected persons.Immunology 137(1):89–97.
43. Schröder C, et al. (2007) CCR5 blockade modulates inflammation and alloimmunity inprimates. J Immunol 179(4):2289–2299.
44. Gonzalez E, et al. (2005) The influence of CCL3L1 gene-containing segmental dupli-cations on HIV-1/AIDS susceptibility. Science 307(5714):1434–1440.
10 of 10 | www.pnas.org/cgi/doi/10.1073/pnas.1423228112 Gornalusse et al.