epigenetic stress responses induce muscle stem-cell...
TRANSCRIPT
4 2 8 | N A T U R E | V O L 5 4 0 | 1 5 d E c E m b E R 2 0 1 6
LETTERdoi:10.1038/nature20603
Epigenetic stress responses induce muscle stem-cell ageing by Hoxa9 developmental signalsSimon Schwörer1, Friedrich becker1, christian Feller2, Ali H. baig1, Ute Köber1, Henriette Henze1, Johann m. Kraus3, beibei Xin4, André Lechel5, daniel b. Lipka6, christy S. Varghese1, manuel Schmidt1, Remo Rohs4, Ruedi Aebersold2,7, Kay L. medina8, Hans A. Kestler1,3, Francesco Neri1, Julia von maltzahn1§, Stefan Tümpel1§ & K. Lenhard Rudolph1,9§
The functionality of stem cells declines during ageing, and this decline contributes to ageing-associated impairments in tissue regeneration and function1. Alterations in developmental pathways have been associated with declines in stem-cell function during ageing2–6, but the nature of this process remains poorly understood. Hox genes are key regulators of stem cells and tissue patterning during embryogenesis with an unknown role in ageing7,8. Here we show that the epigenetic stress response in muscle stem cells (also known as satellite cells) differs between aged and young mice. The alteration includes aberrant global and site-specific induction of active chromatin marks in activated satellite cells from aged mice, resulting in the specific induction of Hoxa9 but not other Hox genes. Hoxa9 in turn activates several developmental pathways and represents a decisive factor that separates satellite cell gene expression in aged mice from that in young mice. The activated pathways include most of the currently known inhibitors of satellite cell function in ageing muscle, including Wnt, TGFβ, JAK/STAT and senescence signalling2–4,6. Inhibition of aberrant chromatin activation or deletion of Hoxa9 improves satellite cell function and muscle regeneration in aged mice, whereas overexpression of Hoxa9 mimics ageing-associated defects in satellite cells from young mice, which can be rescued by the inhibition of Hoxa9-targeted developmental pathways. Together, these data delineate an altered epigenetic stress response in activated satellite cells from aged mice, which limits satellite cell function and muscle regeneration by Hoxa9-dependent activation of developmental pathways.
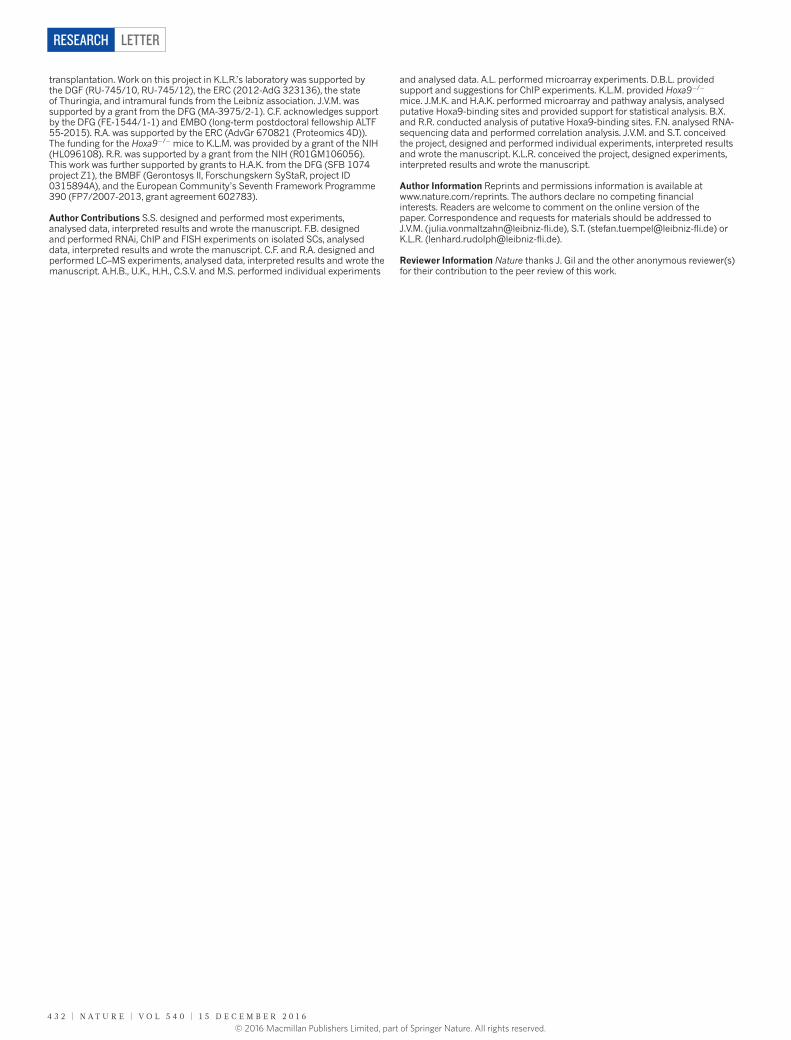
Age-dependent declines in the number and function of Pax7+ satel-lite cells (SCs) impair the regenerative capacity of skeletal muscle2,4,9. Genes and pathways that contribute to this process2–6 often also have a role in regulating embryonic development10–13. Despite these paral-lels, the function of the master regulators of development, Hox genes, has not been determined in SC ageing. An analysis of freshly isolated, in vivo activated SCs from young adult and aged mice (Extended Data Fig. 1a–e) revealed a specific upregulation of Hoxa9 in SCs from aged mice, both at the mRNA (Fig. 1a, Extended Data Fig. 2a, b) and pro-tein level (Fig. 1b, c). Similar results were obtained by immunofluores-cence staining of SCs (Extended Data Fig. 2c) and myofibre-associated SCs (Fig. 1d, e, Extended Data Fig. 2d) that were activated in culture (Extended Data Fig. 1f, g).
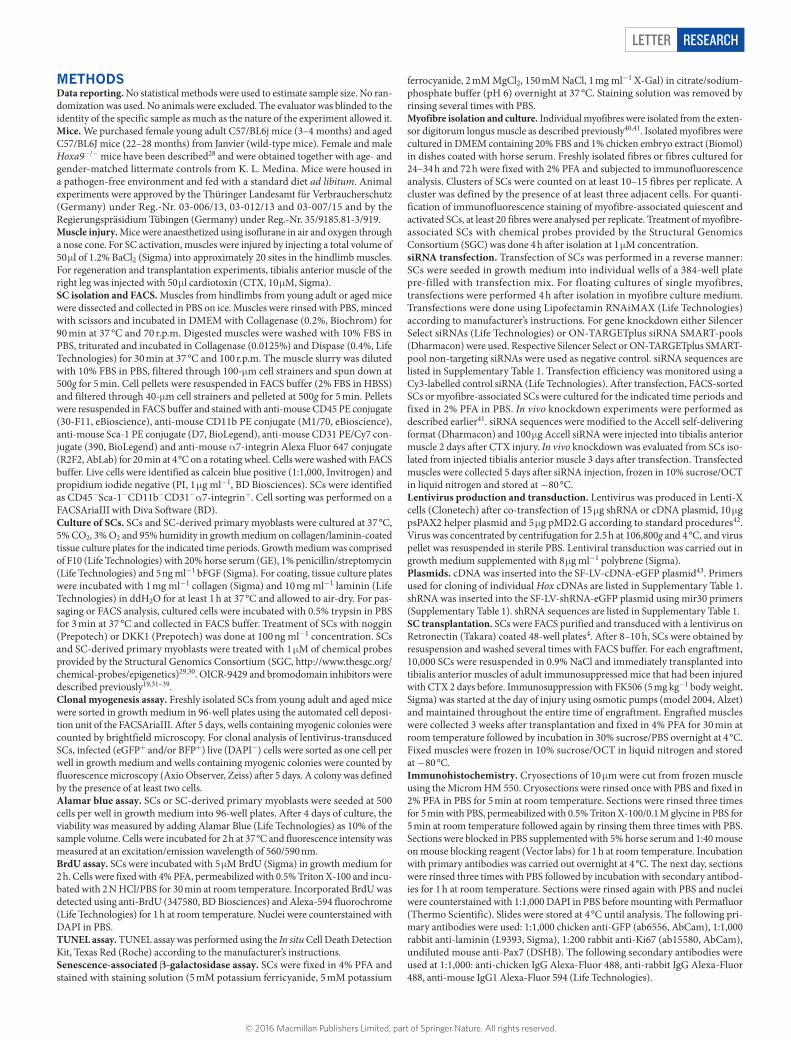
Ageing reduces the proliferative and self-renewal capacity of SCs in wild-type mice2,9,14,15 (Hoxa9+/+; Extended Data Fig. 3). Homozygous deletion of Hoxa9 (Hoxa9−/−) did not affect the colony-forming capac-ity of SCs from young adult mice but ameliorated ageing-associated impairment in colony formation of single-cell-sorted SCs in culture (Fig. 2a). Hoxa9 deletion also increased the self-renewal of myofibre- associated SCs from aged mice in culture but had no effect on SCs
from young adult mice under these conditions (Extended Data Fig. 4a–c). Similar results were obtained by short interfering RNA (siRNA)-mediated knockdown of Hoxa9 in myofibre-associated SC cultures derived from aged mice (Extended Data Fig. 4d–h). The number of SCs decreases in resting tibialis anterior muscle of ageing wild-type mice2,4,9; this phenotype was not affected by Hoxa9 gene status (Extended Data Fig. 5a). However, homozygous deletion or siRNA- mediated knockdown of Hoxa9 increased the total number of Pax7+ SCs (Fig. 2b, Extended Data Fig. 5b–e) and improved myofibre regeneration
1Leibniz-Institute on Aging – Fritz Lipmann Institute (FLI), Beutenbergstrasse 11, 07745 Jena, Germany. 2Department of Biology, Institute of Molecular Systems Biology, ETH Zürich, Auguste-Piccard-Hof 1, 8093 Zürich, Switzerland. 3Institute of Medical Systems Biology, Ulm University, James-Franck-Ring, 89081 Ulm, Germany. 4Molecular and Computational Biology Program, University of Southern California, 1050 Childs Way, Los Angeles, California 90089, USA. 5Department of Internal Medicine I, Ulm University, Albert-Einstein-Allee 23, 89081 Ulm, Germany. 6Division of Epigenomics and Cancer Risk Factors, DKFZ, Im Neuenheimer Feld 280, 69120 Heidelberg, Germany. 7Faculty of Science, University of Zürich, Zürich, Switzerland. 8Department of Immunology, Mayo Clinic, 200 First Street SW, Rochester, Minnesotta 55905, USA. 9Faculty of Medicine, Friedrich-Schiller-University, Jena, Germany. §These authors jointly supervised this work.
a
b c eH
oxa9
DA
PI
Pax
7
Young adult Young adultAged AgedFreshly isolated Activated
Myo�breisolation
24 h
IF
Hoxa7 Hoxa9 Hoxb9
0
0.1
0.2
0.3 P = 0.0001
CTC
F p
er S
C (A
U)
FI act FI act FI act
NSNS
NSNS
NS
AgedYoung adult
0 100 200
Expression (counts)
Hoxa9 Pax7 DAPI
You
ng a
dul
tA
gedAct
ivat
ed
d
131211109843113121110986541398765432113111097654321
Young Aged
*
Hoxa
Hoxb
Hoxc
Hoxd
AgedYoung adult
SCisolationBaCl2
d3
0369
12 P = 0.0001
CTC
F p
er S
C (A
U)
Hoxa9
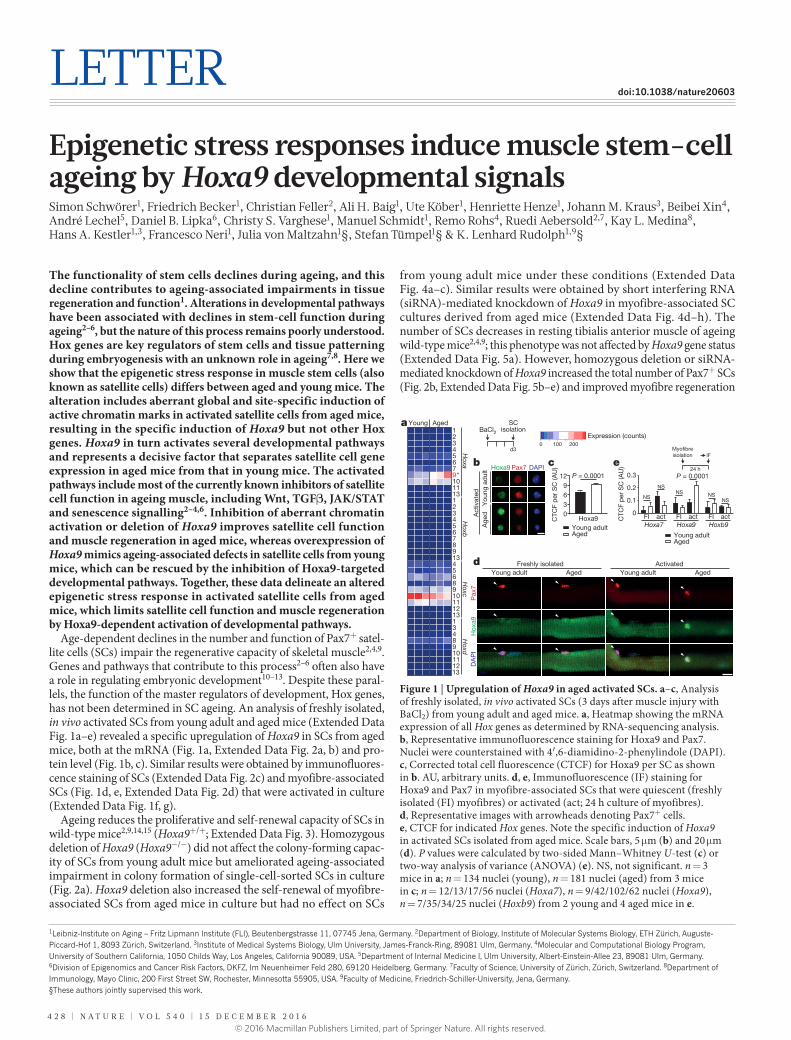
Figure 1 | Upregulation of Hoxa9 in aged activated SCs. a–c, Analysis of freshly isolated, in vivo activated SCs (3 days after muscle injury with BaCl2) from young adult and aged mice. a, Heatmap showing the mRNA expression of all Hox genes as determined by RNA-sequencing analysis. b, Representative immunofluorescence staining for Hoxa9 and Pax7. Nuclei were counterstained with 4′,6-diamidino-2-phenylindole (DAPI). c, Corrected total cell fluorescence (CTCF) for Hoxa9 per SC as shown in b. AU, arbitrary units. d, e, Immunofluorescence (IF) staining for Hoxa9 and Pax7 in myofibre-associated SCs that were quiescent (freshly isolated (FI) myofibres) or activated (act; 24 h culture of myofibres). d, Representative images with arrowheads denoting Pax7+ cells. e, CTCF for indicated Hox genes. Note the specific induction of Hoxa9 in activated SCs isolated from aged mice. Scale bars, 5 μm (b) and 20 μm (d). P values were calculated by two-sided Mann–Whitney U-test (c) or two-way analysis of variance (ANOVA) (e). NS, not significant. n = 3 mice in a; n = 134 nuclei (young), n = 181 nuclei (aged) from 3 mice in c; n = 12/13/17/56 nuclei (Hoxa7), n = 9/42/102/62 nuclei (Hoxa9), n = 7/35/34/25 nuclei (Hoxb9) from 2 young and 4 aged mice in e.
© 2016 Macmillan Publishers Limited, part of Springer Nature. All rights reserved.
Letter reSeArCH
1 5 d E c E m b E R 2 0 1 6 | V O L 5 4 0 | N A T U R E | 4 2 9
in injured muscle of aged mice almost to the levels in young adult mice (Fig. 2c, Extended Data Fig. 5f), albeit without affecting overall SC proliferation rates seven days after muscle injury (Extended Data Fig. 5g, h). Hoxa9 gene deletion also improved the cell-autonomous, in vivo regenerative capacity of transplanted SCs derived from aged donor mice but did not affect the capacity of SCs derived from young adult donors (Fig. 2d, e, Extended Data Fig. 6a). Similarly, Hoxa9 downregulation by short hairpin RNA (shRNA) infection rescued the regenerative capacity and the engraftment of transplanted SCs derived from aged mice almost to the level of SCs from young adult mice (Extended Data Fig. 6b–h). When transduced at similar infection efficiency (Extended Data Fig. 6i), Hoxa9 shRNA compared to scram-bled shRNA improved the self-renewal of serially transplanted SCs from aged mice in primary recipients (Fig. 2f, Extended Data Fig. 6j) as well as the regenerative capacity of 500 re-isolated SCs from primary donors that were transplanted for a second round into the injured tib-ialis anterior muscle of secondary recipients (Fig. 2g, Extended Data Fig. 6k). Together, these results demonstrate that the induction of Hoxa9 limits SC self-renewal and muscle regeneration in aged mice, and that the deletion of Hoxa9 is sufficient to revert these ageing- associated deficiencies.
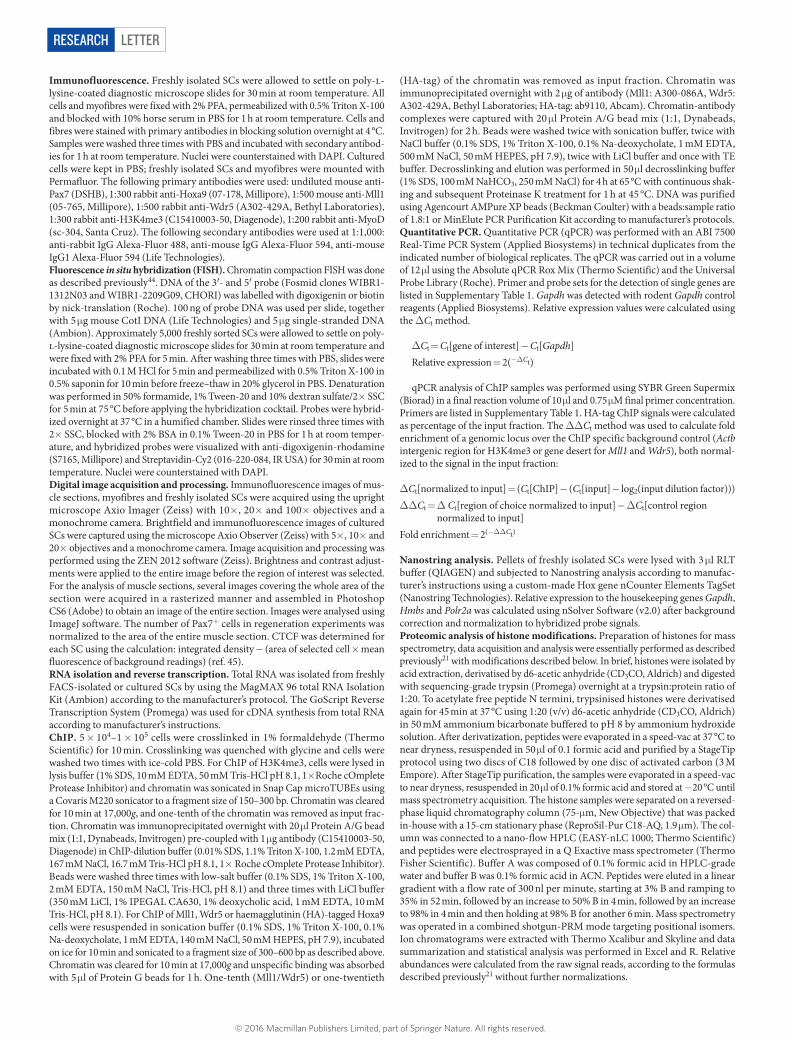
The expression of Hoxa9 in development and leukaemia is actively maintained by Mll1-dependent tri-methylation at lysine 4 of his-tone 3 (H3K4me3)16–18. Chromatin immunoprecipitation (ChIP) revealed that H3K4me3 is strongly enriched at the promoter and first exon of Hoxa9 in activated SCs from aged compared to young adult mice, which was not detected to the same extent for other Hoxa genes (Fig. 3a, Extended Data Fig. 7a). ChIP analyses for Mll1 and Wdr5 (a scaffold protein of the Mll1 complex) revealed increased recruit-ment of these factors to the Hoxa cluster with Wdr5 enrichment being confined to the Hoxa9 locus (Fig. 3b, c). Although no changes were
observed for Mll1, both H3K4me3 and Wdr5 showed significantly increased levels in nuclei of myofibre-associated SCs from aged versus young adult mice upon activation (Extended Data Fig. 7b–e). Of note, knockdown of either Mll1 (also known as Kmt2a) or Wdr5 reduced H3K4me3 levels as well as Mll1 recruitment to the Hoxa9 locus and ameliorated Hoxa9 induction in activated myofibre- associated SCs from aged mice (Fig. 3d, e, Extended Data Fig. 7f–i). Similar results were obtained by treatment of aged myofibre- associated SCs with OICR-9429, an inhibitor of the Mll1–Wdr5 interaction19 (Extended Data Fig. 7j, k). Moreover, both Mll1 knock-down and OICR-9429 treatment increased the self-renewal and low-ered the myogenic commitment of myofibre-associated SCs from aged mice (Extended Data Fig. 7l–q), resulting in increased SC numbers in cultures of purified SCs or myofibre-associated SCs derived from aged mice (Extended Data Fig. 7r, s). Notably, Mll1 inhibition by either stable shRNA knockdown (Extended Data Fig. 7t) or OICR-9429 treat-ment improved the regenerative capacity of SCs from aged mice when transplanted into injured muscle of recipient mice (Fig. 3f–h). Taken together, these experiments demonstrate that the Mll1 complex con-tributes to Hoxa9 induction in activated SCs from aged mice, resulting in impairment in SC function and muscle regeneration. Pax7 expres-sion was downregulated in activated SCs of aged mice (Extended Data Fig. 7u–w) and did not correlate with Hoxa9 expression (Extended Data Fig. 7x, y), indicating that Mll1-dependent regulation of Pax7 target genes20 was not involved in the Mll1-dependent induction of Hoxa9 in activated SCs from aged mice.
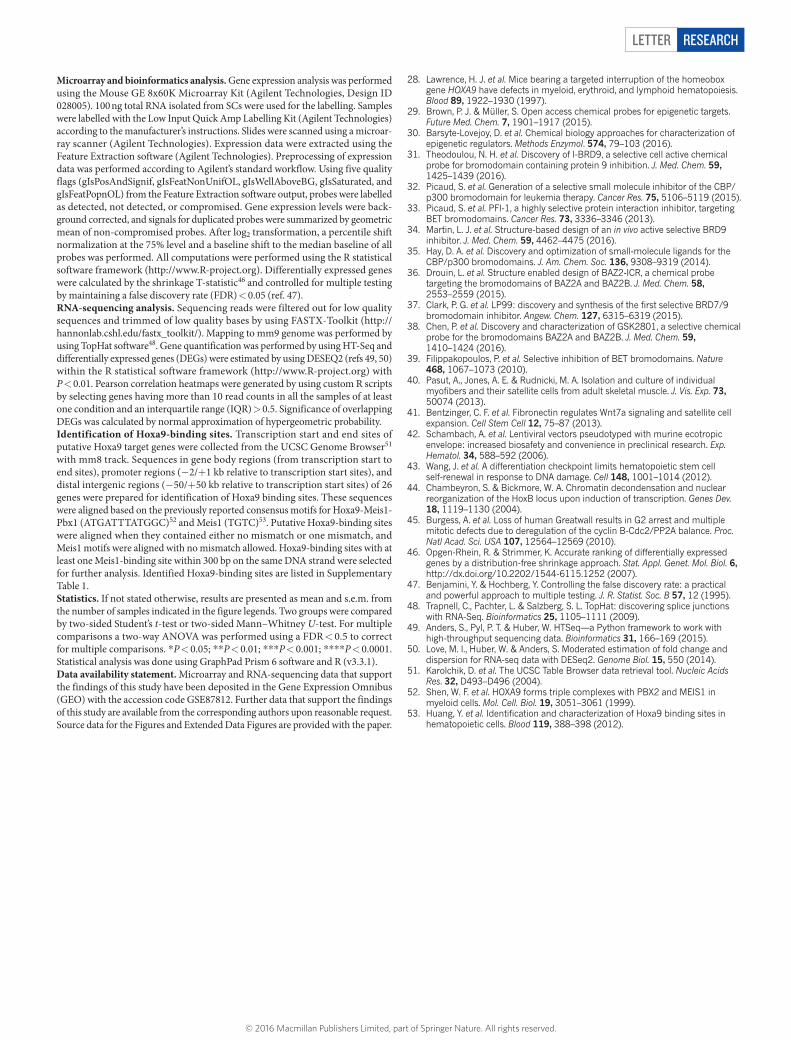
Next, a global analysis of histone post-translational modifications was carried out on freshly isolated SCs obtained before muscle injury (quiescent state) or two, three and five days after in vivo SC activation mediated by muscle injury (Fig. 4a, b, Extended Data Fig. 8a). Using a recently developed mass-spectrometry-based proteomic strategy21, 46 histone H3 and H4 lysine acetylation and methylation motifs were quantified. Quiescent SCs from aged mice compared to young adult mice showed increased levels of repressive marks (H3K9me2 and
a
d
e
b c
f
P = 0.001 P = 0.03
<10
10–1
5
15–2
0
20–2
5
25–3
0
30–3
5
>35
01020304050
Freq
uenc
y (%
)
Minimal �bre Feret (μm)
Aged Hoxa9–/–Aged Hoxa9+/+
g
CTX
SC isolation
Tx
d1 d2 3w
AnalysisTransduction (eGFP)
CTX Analysis
d7
SCisolation Analysis
d5
01020304050
P = 0.0007
P = 0.0001
Young AgedCol
ony
freq
uenc
y(%
of s
eed
ed w
ells
)
Hoxa9–/–Hoxa9+/+
Age
d H
oxa9
+/+
Age
d H
oxa9
–/–
eGFP
Laminin
DA
PI
Hoxa9–/–Hoxa9+/+
Donor
Hoxa9–/–Hoxa9+/+
0
50
100
150
Pax
7+ c
ells
per
mm
2
(% o
f Hox
a9+
/+)
Aged
P = 0.004
Re-
isol
ated
eG
FP+ c
ells
(1
st t
rans
pla
nts)
0100200300400
Scr Hoxa9
P = 0.0001
shRNA
P = 0.024
eGFP
+ m
yo�b
res
(2nd
tra
nsp
lant
s)
Scr Hoxa9shRNA
0
10
20
30
eGFP
+ m
yo�b
res
(% o
f Hox
a9+
/+)
Aged
P = 0.002
0
50
100
150
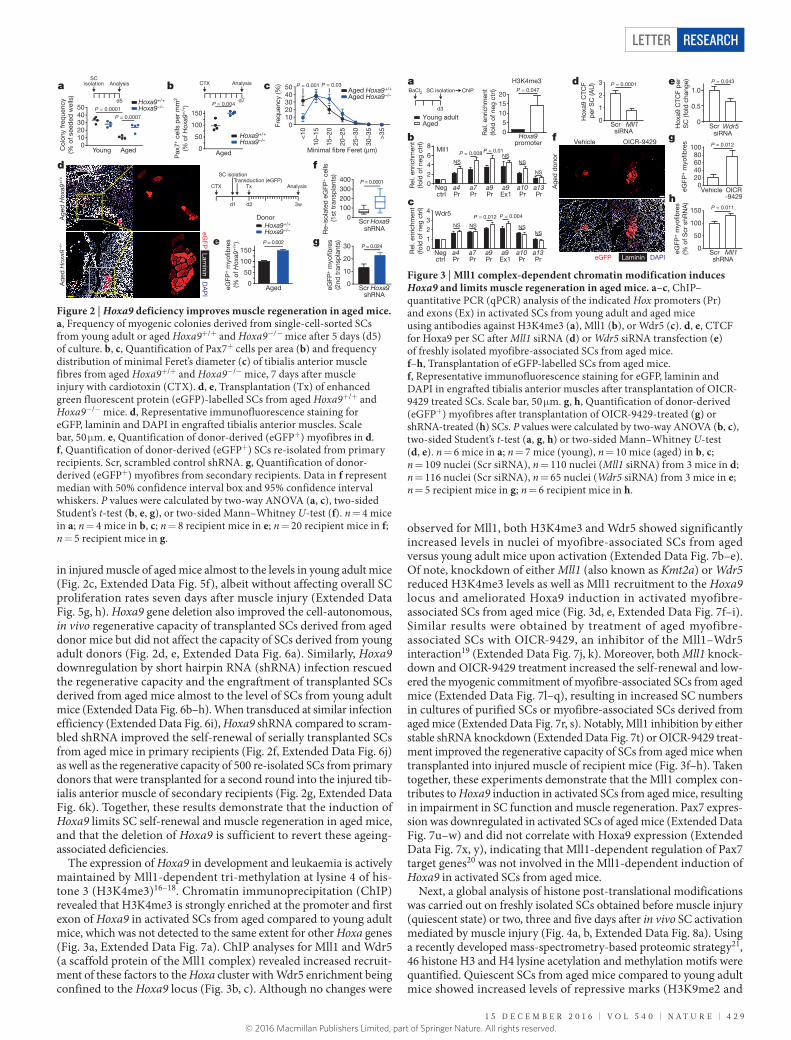
Figure 2 | Hoxa9 deficiency improves muscle regeneration in aged mice. a, Frequency of myogenic colonies derived from single-cell-sorted SCs from young adult or aged Hoxa9+/+ and Hoxa9−/− mice after 5 days (d5) of culture. b, c, Quantification of Pax7+ cells per area (b) and frequency distribution of minimal Feret’s diameter (c) of tibialis anterior muscle fibres from aged Hoxa9+/+ and Hoxa9−/− mice, 7 days after muscle injury with cardiotoxin (CTX). d, e, Transplantation (Tx) of enhanced green fluorescent protein (eGFP)-labelled SCs from aged Hoxa9+/+ and Hoxa9−/− mice. d, Representative immunofluorescence staining for eGFP, laminin and DAPI in engrafted tibialis anterior muscles. Scale bar, 50 μm. e, Quantification of donor-derived (eGFP+) myofibres in d. f, Quantification of donor-derived (eGFP+) SCs re-isolated from primary recipients. Scr, scrambled control shRNA. g, Quantification of donor-derived (eGFP+) myofibres from secondary recipients. Data in f represent median with 50% confidence interval box and 95% confidence interval whiskers. P values were calculated by two-way ANOVA (a, c), two-sided Student’s t-test (b, e, g), or two-sided Mann–Whitney U-test (f). n = 4 mice in a; n = 4 mice in b, c; n = 8 recipient mice in e; n = 20 recipient mice in f; n = 5 recipient mice in g.
a
b
c
SC isolationBaCl2
d3
ChIP
AgedYoung adult
02468 Mll1
Negctrl
a4Pr
a7Pr
a9Pr
a9Ex1
a10Pr
a13Pr
Negctrl
a4Pr
a7Pr
a9Pr
a9Ex1
a10Pr
a13Pr
Rel
. enr
ichm
ent
(fold
of n
eg c
trl)
P = 0.008 P = 0.01
NSNS
NS
NS
01234 Wdr5
Rel
. enr
ichm
ent
(fold
of n
eg c
trl)
P = 0.004P = 0.012
NSNS NSNS
OICR-9429Vehicle
Age
d d
onor
eGFP Laminin DAPI
f g
h
ed
Hoxa9promoter
P = 0.047
Rel
. enr
ichm
ent
(fold
of n
eg c
trl)
H3K4me3
05
101520
0
1
2
3
Hox
a9 C
TCF
per
SC
(AU
)
Scr Mll1
P = 0.0001
siRNA0
0.5
1.0P = 0.043
Hox
a9 C
TCF
per
SC
(fol
d c
hang
e)
Scr Wdr5siRNA
eGFP
+ m
yo�b
res
020406080
100
Vehicle OICR-9429
P = 0.012
150 P = 0.011
0
50
100
Scr Mll1eGFP
+ m
yo�b
res
(% o
f Scr
shR
NA
)
shRNA
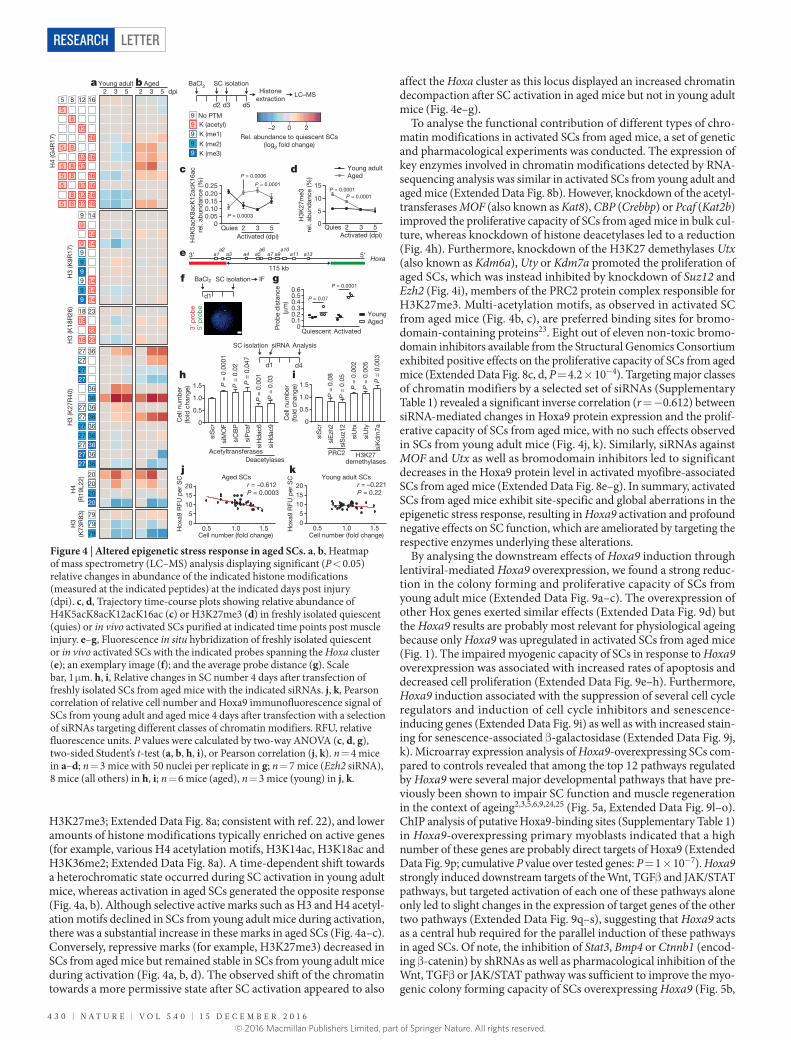
Figure 3 | Mll1 complex-dependent chromatin modification induces Hoxa9 and limits muscle regeneration in aged mice. a–c, ChIP–quantitative PCR (qPCR) analysis of the indicated Hox promoters (Pr) and exons (Ex) in activated SCs from young adult and aged mice using antibodies against H3K4me3 (a), Mll1 (b), or Wdr5 (c). d, e, CTCF for Hoxa9 per SC after Mll1 siRNA (d) or Wdr5 siRNA transfection (e) of freshly isolated myofibre-associated SCs from aged mice. f–h, Transplantation of eGFP-labelled SCs from aged mice. f, Representative immunofluorescence staining for eGFP, laminin and DAPI in engrafted tibialis anterior muscles after transplantation of OICR-9429 treated SCs. Scale bar, 50 μm. g, h, Quantification of donor-derived (eGFP+) myofibres after transplantation of OICR-9429-treated (g) or shRNA-treated (h) SCs. P values were calculated by two-way ANOVA (b, c), two-sided Student’s t-test (a, g, h) or two-sided Mann–Whitney U-test (d, e). n = 6 mice in a; n = 7 mice (young), n = 10 mice (aged) in b, c; n = 109 nuclei (Scr siRNA), n = 110 nuclei (Mll1 siRNA) from 3 mice in d; n = 116 nuclei (Scr siRNA), n = 65 nuclei (Wdr5 siRNA) from 3 mice in e; n = 5 recipient mice in g; n = 6 recipient mice in h.
© 2016 Macmillan Publishers Limited, part of Springer Nature. All rights reserved.
LetterreSeArCH
4 3 0 | N A T U R E | V O L 5 4 0 | 1 5 d E c E m b E R 2 0 1 6
H3K27me3; Extended Data Fig. 8a; consistent with ref. 22), and lower amounts of histone modifications typically enriched on active genes (for example, various H4 acetylation motifs, H3K14ac, H3K18ac and H3K36me2; Extended Data Fig. 8a). A time-dependent shift towards a heterochromatic state occurred during SC activation in young adult mice, whereas activation in aged SCs generated the opposite response (Fig. 4a, b). Although selective active marks such as H3 and H4 acetyl-ation motifs declined in SCs from young adult mice during activation, there was a substantial increase in these marks in aged SCs (Fig. 4a–c). Conversely, repressive marks (for example, H3K27me3) decreased in SCs from aged mice but remained stable in SCs from young adult mice during activation (Fig. 4a, b, d). The observed shift of the chromatin towards a more permissive state after SC activation appeared to also
affect the Hoxa cluster as this locus displayed an increased chromatin decompaction after SC activation in aged mice but not in young adult mice (Fig. 4e–g).
To analyse the functional contribution of different types of chro-matin modifications in activated SCs from aged mice, a set of genetic and pharmacological experiments was conducted. The expression of key enzymes involved in chromatin modifications detected by RNA-sequencing analysis was similar in activated SCs from young adult and aged mice (Extended Data Fig. 8b). However, knockdown of the acetyl-transferases MOF (also known as Kat8), CBP (Crebbp) or Pcaf (Kat2b) improved the proliferative capacity of SCs from aged mice in bulk cul-ture, whereas knockdown of histone deacetylases led to a reduction (Fig. 4h). Furthermore, knockdown of the H3K27 demethylases Utx (also known as Kdm6a), Uty or Kdm7a promoted the proliferation of aged SCs, which was instead inhibited by knockdown of Suz12 and Ezh2 (Fig. 4i), members of the PRC2 protein complex responsible for H3K27me3. Multi-acetylation motifs, as observed in activated SC from aged mice (Fig. 4b, c), are preferred binding sites for bromo-domain-containing proteins23. Eight out of eleven non-toxic bromo-domain inhibitors available from the Structural Genomics Consortium exhibited positive effects on the proliferative capacity of SCs from aged mice (Extended Data Fig. 8c, d, P = 4.2 × 10⁻⁴). Targeting major classes of chromatin modifiers by a selected set of siRNAs (Supplementary Table 1) revealed a significant inverse correlation (r = −0.612) between siRNA-mediated changes in Hoxa9 protein expression and the prolif-erative capacity of SCs from aged mice, with no such effects observed in SCs from young adult mice (Fig. 4j, k). Similarly, siRNAs against MOF and Utx as well as bromodomain inhibitors led to significant decreases in the Hoxa9 protein level in activated myofibre-associated SCs from aged mice (Extended Data Fig. 8e–g). In summary, activated SCs from aged mice exhibit site-specific and global aberrations in the epigenetic stress response, resulting in Hoxa9 activation and profound negative effects on SC function, which are ameliorated by targeting the respective enzymes underlying these alterations.
By analysing the downstream effects of Hoxa9 induction through lentiviral-mediated Hoxa9 overexpression, we found a strong reduc-tion in the colony forming and proliferative capacity of SCs from young adult mice (Extended Data Fig. 9a–c). The overexpression of other Hox genes exerted similar effects (Extended Data Fig. 9d) but the Hoxa9 results are probably most relevant for physiological ageing because only Hoxa9 was upregulated in activated SCs from aged mice (Fig. 1). The impaired myogenic capacity of SCs in response to Hoxa9 overexpression was associated with increased rates of apoptosis and decreased cell proliferation (Extended Data Fig. 9e–h). Furthermore, Hoxa9 induction associated with the suppression of several cell cycle regulators and induction of cell cycle inhibitors and senescence- inducing genes (Extended Data Fig. 9i) as well as with increased stain-ing for senescence-associated β-galactosidase (Extended Data Fig. 9j, k). Microarray expression analysis of Hoxa9-overexpressing SCs com-pared to controls revealed that among the top 12 pathways regulated by Hoxa9 were several major developmental pathways that have pre-viously been shown to impair SC function and muscle regeneration in the context of ageing2,3,5,6,9,24,25 (Fig. 5a, Extended Data Fig. 9l–o). ChIP analysis of putative Hoxa9-binding sites (Supplementary Table 1) in Hoxa9-overexpressing primary myoblasts indicated that a high number of these genes are probably direct targets of Hoxa9 (Extended Data Fig. 9p; cumulative P value over tested genes: P = 1 × 10⁻⁷). Hoxa9 strongly induced downstream targets of the Wnt, TGFβ and JAK/STAT pathways, but targeted activation of each one of these pathways alone only led to slight changes in the expression of target genes of the other two pathways (Extended Data Fig. 9q–s), suggesting that Hoxa9 acts as a central hub required for the parallel induction of these pathways in aged SCs. Of note, the inhibition of Stat3, Bmp4 or Ctnnb1 (encod-ing β-catenin) by shRNAs as well as pharmacological inhibition of the Wnt, TGFβ or JAK/STAT pathway was sufficient to improve the myo-genic colony forming capacity of SCs overexpressing Hoxa9 (Fig. 5b,
e
5′ p
rob
e3′
pro
be
3′ 5′
115 kb
a1a2
a3 a4 a5a6
a7 a9a10
a11 a13Hoxa
a
f g
h i
k
SC isolation
H4
(G4R
17)
H3
(K9R
17)
H3
(K18
R26
)H
3 (K
27R
40)
H4
(R19
L22)
H3
(K73
R83
)
BaCl2
d1
IF
j
0
0.5
1.0
1.5 P =
0.0
001
siM
OF
siC
BP
siP
caf
siS
cr
siH
dac
6
siH
dac
9
Cel
l num
ber
(fold
cha
nge) P
= 0
.02
P =
0.0
47
P =
0.0
01
P =
0.0
3
DeacetylasesAcetyltransferases
Aged SCs
0.5 1.0 1.505
101520
Cell number (fold change)
Hox
a9 R
FU p
er S
C
r = –0.612P = 0.0003
Young adult SCs
0.5 1.0 1.505
101520
Cell number (fold change)
Hox
a9 R
FU p
er S
C
r = –0.221P = 0.22
0
5
10
15
Quies 2 3 5Activated (dpi)
H3K
27m
e3re
l. ab
und
ance
(%)
P = 0.0001P = 0.0001
SC isolationBaCl2Histone
extractionLC–MS
d2 d3 d5
9 14
1414
9
9
5 8 12 16
812
16
16
161616
12
1212
12
8
88
816128
5
5
555
5
18 23
2323
18
18
999999
141414
27 36272727
363636363636
3636
36
2727
272727
2727
20202020
797979
2 3 5Young adult
2 3 5Aged
dpi
Rel. abundance to quiescent SCs(log2 fold change)
–2 20
b
c d
siE
zh2
siS
uz12
siU
tx
siS
cr
siU
ty
siK
dm
7a
PRC2 H3K27demethylases
Cel
l num
ber
(fold
cha
nge)
0
0.5
1.0
1.5
P =
0.0
8
P =
0.0
5
P =
0.0
02
P =
0.0
05
P =
0.0
03
00.050.100.150.200.25
H4K
5acK
8acK
12ac
K16
acre
l. ab
und
ance
(%)
Quies 2 3 5Activated (dpi)
P = 0.0001
P = 0.0006
P = 0.0003
00.10.20.30.40.50.6
Pro
be
dis
tanc
e(μ
m)
Quiescent Activated
P = 0.0001
P = 0.07
9999
No PTMK (acetyl)K (me1)
K (me2)K (me3)
9
Young adultAged
AgedYoung
SC isolation
d1 d4
AnalysissiRNA
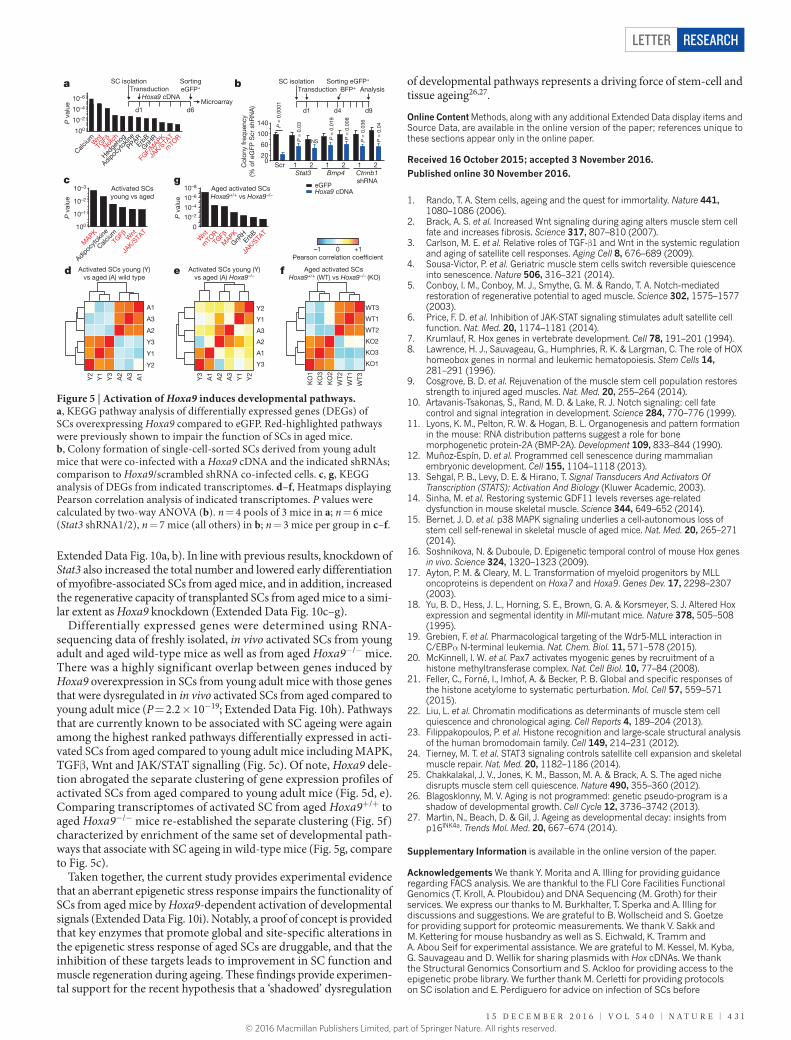
Figure 4 | Altered epigenetic stress response in aged SCs. a, b, Heatmap of mass spectrometry (LC–MS) analysis displaying significant (P < 0.05) relative changes in abundance of the indicated histone modifications (measured at the indicated peptides) at the indicated days post injury (dpi). c, d, Trajectory time-course plots showing relative abundance of H4K5acK8acK12acK16ac (c) or H3K27me3 (d) in freshly isolated quiescent (quies) or in vivo activated SCs purified at indicated time points post muscle injury. e–g, Fluorescence in situ hybridization of freshly isolated quiescent or in vivo activated SCs with the indicated probes spanning the Hoxa cluster (e); an exemplary image (f); and the average probe distance (g). Scale bar, 1 μm. h, i, Relative changes in SC number 4 days after transfection of freshly isolated SCs from aged mice with the indicated siRNAs. j, k, Pearson correlation of relative cell number and Hoxa9 immunofluorescence signal of SCs from young adult and aged mice 4 days after transfection with a selection of siRNAs targeting different classes of chromatin modifiers. RFU, relative fluorescence units. P values were calculated by two-way ANOVA (c, d, g), two-sided Student’s t-test (a, b, h, i), or Pearson correlation (j, k). n = 4 mice in a–d; n = 3 mice with 50 nuclei per replicate in g; n = 7 mice (Ezh2 siRNA), 8 mice (all others) in h, i; n = 6 mice (aged), n = 3 mice (young) in j, k.
© 2016 Macmillan Publishers Limited, part of Springer Nature. All rights reserved.
Letter reSeArCH
1 5 d E c E m b E R 2 0 1 6 | V O L 5 4 0 | N A T U R E | 4 3 1
Extended Data Fig. 10a, b). In line with previous results, knockdown of Stat3 also increased the total number and lowered early differentiation of myofibre-associated SCs from aged mice, and in addition, increased the regenerative capacity of transplanted SCs from aged mice to a simi-lar extent as Hoxa9 knockdown (Extended Data Fig. 10c–g).
Differentially expressed genes were determined using RNA-sequencing data of freshly isolated, in vivo activated SCs from young adult and aged wild-type mice as well as from aged Hoxa9−/− mice. There was a highly significant overlap between genes induced by Hoxa9 overexpression in SCs from young adult mice with those genes that were dysregulated in in vivo activated SCs from aged compared to young adult mice (P = 2.2 × 10⁻¹⁹; Extended Data Fig. 10h). Pathways that are currently known to be associated with SC ageing were again among the highest ranked pathways differentially expressed in acti-vated SCs from aged compared to young adult mice including MAPK, TGFβ, Wnt and JAK/STAT signalling (Fig. 5c). Of note, Hoxa9 dele-tion abrogated the separate clustering of gene expression profiles of activated SCs from aged compared to young adult mice (Fig. 5d, e). Comparing transcriptomes of activated SC from aged Hoxa9+/+ to aged Hoxa9−/− mice re-established the separate clustering (Fig. 5f) characterized by enrichment of the same set of developmental path-ways that associate with SC ageing in wild-type mice (Fig. 5g, compare to Fig. 5c).
Taken together, the current study provides experimental evidence that an aberrant epigenetic stress response impairs the functionality of SCs from aged mice by Hoxa9-dependent activation of developmental signals (Extended Data Fig. 10i). Notably, a proof of concept is provided that key enzymes that promote global and site-specific alterations in the epigenetic stress response of aged SCs are druggable, and that the inhibition of these targets leads to improvement in SC function and muscle regeneration during ageing. These findings provide experimen-tal support for the recent hypothesis that a ‘shadowed’ dysregulation
of developmental pathways represents a driving force of stem-cell and tissue ageing26,27.
Online Content Methods, along with any additional Extended Data display items and Source Data, are available in the online version of the paper; references unique to these sections appear only in the online paper.
received 16 October 2015; accepted 3 November 2016.
Published online 30 November 2016.
1. Rando, T. A. Stem cells, ageing and the quest for immortality. Nature 441, 1080–1086 (2006).
2. Brack, A. S. et al. Increased Wnt signaling during aging alters muscle stem cell fate and increases fibrosis. Science 317, 807–810 (2007).
3. Carlson, M. E. et al. Relative roles of TGF-β1 and Wnt in the systemic regulation and aging of satellite cell responses. Aging Cell 8, 676–689 (2009).
4. Sousa-Victor, P. et al. Geriatric muscle stem cells switch reversible quiescence into senescence. Nature 506, 316–321 (2014).
5. Conboy, I. M., Conboy, M. J., Smythe, G. M. & Rando, T. A. Notch-mediated restoration of regenerative potential to aged muscle. Science 302, 1575–1577 (2003).
6. Price, F. D. et al. Inhibition of JAK-STAT signaling stimulates adult satellite cell function. Nat. Med. 20, 1174–1181 (2014).
7. Krumlauf, R. Hox genes in vertebrate development. Cell 78, 191–201 (1994).8. Lawrence, H. J., Sauvageau, G., Humphries, R. K. & Largman, C. The role of HOX
homeobox genes in normal and leukemic hematopoiesis. Stem Cells 14, 281–291 (1996).
9. Cosgrove, B. D. et al. Rejuvenation of the muscle stem cell population restores strength to injured aged muscles. Nat. Med. 20, 255–264 (2014).
10. Artavanis-Tsakonas, S., Rand, M. D. & Lake, R. J. Notch signaling: cell fate control and signal integration in development. Science 284, 770–776 (1999).
11. Lyons, K. M., Pelton, R. W. & Hogan, B. L. Organogenesis and pattern formation in the mouse: RNA distribution patterns suggest a role for bone morphogenetic protein-2A (BMP-2A). Development 109, 833–844 (1990).
12. Muñoz-Espín, D. et al. Programmed cell senescence during mammalian embryonic development. Cell 155, 1104–1118 (2013).
13. Sehgal, P. B., Levy, D. E. & Hirano, T. Signal Transducers And Activators Of Transcription (STATS): Activation And Biology (Kluwer Academic, 2003).
14. Sinha, M. et al. Restoring systemic GDF11 levels reverses age-related dysfunction in mouse skeletal muscle. Science 344, 649–652 (2014).
15. Bernet, J. D. et al. p38 MAPK signaling underlies a cell-autonomous loss of stem cell self-renewal in skeletal muscle of aged mice. Nat. Med. 20, 265–271 (2014).
16. Soshnikova, N. & Duboule, D. Epigenetic temporal control of mouse Hox genes in vivo. Science 324, 1320–1323 (2009).
17. Ayton, P. M. & Cleary, M. L. Transformation of myeloid progenitors by MLL oncoproteins is dependent on Hoxa7 and Hoxa9. Genes Dev. 17, 2298–2307 (2003).
18. Yu, B. D., Hess, J. L., Horning, S. E., Brown, G. A. & Korsmeyer, S. J. Altered Hox expression and segmental identity in Mll-mutant mice. Nature 378, 505–508 (1995).
19. Grebien, F. et al. Pharmacological targeting of the Wdr5-MLL interaction in C/EBPα N-terminal leukemia. Nat. Chem. Biol. 11, 571–578 (2015).
20. McKinnell, I. W. et al. Pax7 activates myogenic genes by recruitment of a histone methyltransferase complex. Nat. Cell Biol. 10, 77–84 (2008).
21. Feller, C., Forné, I., Imhof, A. & Becker, P. B. Global and specific responses of the histone acetylome to systematic perturbation. Mol. Cell 57, 559–571 (2015).
22. Liu, L. et al. Chromatin modifications as determinants of muscle stem cell quiescence and chronological aging. Cell Reports 4, 189–204 (2013).
23. Filippakopoulos, P. et al. Histone recognition and large-scale structural analysis of the human bromodomain family. Cell 149, 214–231 (2012).
24. Tierney, M. T. et al. STAT3 signaling controls satellite cell expansion and skeletal muscle repair. Nat. Med. 20, 1182–1186 (2014).
25. Chakkalakal, J. V., Jones, K. M., Basson, M. A. & Brack, A. S. The aged niche disrupts muscle stem cell quiescence. Nature 490, 355–360 (2012).
26. Blagosklonny, M. V. Aging is not programmed: genetic pseudo-program is a shadow of developmental growth. Cell Cycle 12, 3736–3742 (2013).
27. Martin, N., Beach, D. & Gil, J. Ageing as developmental decay: insights from p16INK4a. Trends Mol. Med. 20, 667–674 (2014).
a SC isolationTransduction
SortingeGFP+
Microarrayd1 d6
Hoxa9 cDNA
P v
alue
P v
alue
P v
alue
10–6
10–4
10–2
100
10–3
10–2
10–1
100
CalciumW
nt
TGFβNot
ch
Hedge
hog
PPARErb
B
Adipocyto
kine
GnHR
FGF/
MAPK
JAK/S
TAT
mTO
R
020
60
100
140
ScrStat3 Bmp4 Ctnnb1
shRNA
1 2 1 2 1 2Col
ony
freq
uenc
y(%
of e
GFP
Scr
shR
NA
)
P =
0.0
001
P =
0.0
3
NS P =
0.0
19
P =
0.0
08
P =
0.0
36
P =
0.0
4
b SC isolationTransduction
Sorting eGFP+
BFP+
d1 d4
Analysis
d9
MAPK
TGFβ W
nt
JAK/S
TAT
Adipocyto
kine
Calcium
Activated SCsyoung vs aged
gc
f
A1
A3
A2
Y3
Y1
Y2
Y2
A1
A3
A2
Y3
Y1
Activated SCs young (Y)vs aged (A) wild type
A1
A3
A2
Y3
Y1
Y2
Y3
Y2
A1
A3
A2
Y1
Activated SCs young (Y)vs aged (A) Hoxa9–/–
WT3
WT2
WT1
KO2
KO3
KO1W
T3
KO
2
KO
3
KO
1
WT2
WT1
Aged activated SCs Hoxa9+/+ (WT) vs Hoxa9–/– (KO)
–1 +10Pearson correlation coef�cient
d
10–8
10–6
10–4
10–2
0
Wnt
mTO
RTG
FβM
APK
GnRH
JAK/S
TAT
ErbB
Aged activated SCs Hoxa9+/+ vs Hoxa9–/–
e
Hoxa9 cDNAeGFP
Figure 5 | Activation of Hoxa9 induces developmental pathways. a, KEGG pathway analysis of differentially expressed genes (DEGs) of SCs overexpressing Hoxa9 compared to eGFP. Red-highlighted pathways were previously shown to impair the function of SCs in aged mice. b, Colony formation of single-cell-sorted SCs derived from young adult mice that were co-infected with a Hoxa9 cDNA and the indicated shRNAs; comparison to Hoxa9/scrambled shRNA co-infected cells. c, g, KEGG analysis of DEGs from indicated transcriptomes. d–f, Heatmaps displaying Pearson correlation analysis of indicated transcriptomes. P values were calculated by two-way ANOVA (b). n = 4 pools of 3 mice in a; n = 6 mice (Stat3 shRNA1/2), n = 7 mice (all others) in b; n = 3 mice per group in c–f.
Supplementary Information is available in the online version of the paper.
Acknowledgements We thank Y. Morita and A. Illing for providing guidance regarding FACS analysis. We are thankful to the FLI Core Facilities Functional Genomics (T. Kroll, A. Ploubidou) and DNA Sequencing (M. Groth) for their services. We express our thanks to M. Burkhalter, T. Sperka and A. Illing for discussions and suggestions. We are grateful to B. Wollscheid and S. Goetze for providing support for proteomic measurements. We thank V. Sakk and M. Kettering for mouse husbandry as well as S. Eichwald, K. Tramm and A. Abou Seif for experimental assistance. We are grateful to M. Kessel, M. Kyba, G. Sauvageau and D. Wellik for sharing plasmids with Hox cDNAs. We thank the Structural Genomics Consortium and S. Ackloo for providing access to the epigenetic probe library. We further thank M. Cerletti for providing protocols on SC isolation and E. Perdiguero for advice on infection of SCs before
© 2016 Macmillan Publishers Limited, part of Springer Nature. All rights reserved.
LetterreSeArCH
4 3 2 | N A T U R E | V O L 5 4 0 | 1 5 d E c E m b E R 2 0 1 6
transplantation. Work on this project in K.L.R.’s laboratory was supported by the DGF (RU-745/10, RU-745/12), the ERC (2012-AdG 323136), the state of Thuringia, and intramural funds from the Leibniz association. J.V.M. was supported by a grant from the DFG (MA-3975/2-1). C.F. acknowledges support by the DFG (FE-1544/1-1) and EMBO (long-term postdoctoral fellowship ALTF 55-2015). R.A. was supported by the ERC (AdvGr 670821 (Proteomics 4D)). The funding for the Hoxa9−/− mice to K.L.M. was provided by a grant of the NIH (HL096108). R.R. was supported by a grant from the NIH (R01GM106056). This work was further supported by grants to H.A.K. from the DFG (SFB 1074 project Z1), the BMBF (Gerontosys II, Forschungskern SyStaR, project ID 0315894A), and the European Community’s Seventh Framework Programme 390 (FP7/2007-2013, grant agreement 602783).
Author Contributions S.S. designed and performed most experiments, analysed data, interpreted results and wrote the manuscript. F.B. designed and performed RNAi, ChIP and FISH experiments on isolated SCs, analysed data, interpreted results and wrote the manuscript. C.F. and R.A. designed and performed LC–MS experiments, analysed data, interpreted results and wrote the manuscript. A.H.B., U.K., H.H., C.S.V. and M.S. performed individual experiments
and analysed data. A.L. performed microarray experiments. D.B.L. provided support and suggestions for ChIP experiments. K.L.M. provided Hoxa9−/− mice. J.M.K. and H.A.K. performed microarray and pathway analysis, analysed putative Hoxa9-binding sites and provided support for statistical analysis. B.X. and R.R. conducted analysis of putative Hoxa9-binding sites. F.N. analysed RNA-sequencing data and performed correlation analysis. J.V.M. and S.T. conceived the project, designed and performed individual experiments, interpreted results and wrote the manuscript. K.L.R. conceived the project, designed experiments, interpreted results and wrote the manuscript.
Author Information Reprints and permissions information is available at www.nature.com/reprints. The authors declare no competing financial interests. Readers are welcome to comment on the online version of the paper. Correspondence and requests for materials should be addressed to J.V.M. ([email protected]), S.T. ([email protected]) or K.L.R. ([email protected]).
reviewer Information Nature thanks J. Gil and the other anonymous reviewer(s) for their contribution to the peer review of this work.
© 2016 Macmillan Publishers Limited, part of Springer Nature. All rights reserved.
Letter reSeArCH
MethOdSData reporting. No statistical methods were used to estimate sample size. No ran-domization was used. No animals were excluded. The evaluator was blinded to the identity of the specific sample as much as the nature of the experiment allowed it.Mice. We purchased female young adult C57/BL6j mice (3–4 months) and aged C57/BL6J mice (22–28 months) from Janvier (wild-type mice). Female and male Hoxa9−/− mice have been described28 and were obtained together with age- and gender-matched littermate controls from K. L. Medina. Mice were housed in a pathogen-free environment and fed with a standard diet ad libitum. Animal experiments were approved by the Thüringer Landesamt für Verbraucherschutz (Germany) under Reg.-Nr. 03-006/13, 03-012/13 and 03-007/15 and by the Regierungspräsidium Tübingen (Germany) under Reg.-Nr. 35/9185.81-3/919.Muscle injury. Mice were anaesthetized using isoflurane in air and oxygen through a nose cone. For SC activation, muscles were injured by injecting a total volume of 50 μl of 1.2% BaCl2 (Sigma) into approximately 20 sites in the hindlimb muscles. For regeneration and transplantation experiments, tibialis anterior muscle of the right leg was injected with 50 μl cardiotoxin (CTX, 10 μM, Sigma).SC isolation and FACS. Muscles from hindlimbs from young adult or aged mice were dissected and collected in PBS on ice. Muscles were rinsed with PBS, minced with scissors and incubated in DMEM with Collagenase (0.2%, Biochrom) for 90 min at 37 °C and 70 r.p.m. Digested muscles were washed with 10% FBS in PBS, triturated and incubated in Collagenase (0.0125%) and Dispase (0.4%, Life Technologies) for 30 min at 37 °C and 100 r.p.m. The muscle slurry was diluted with 10% FBS in PBS, filtered through 100-μm cell strainers and spun down at 500g for 5 min. Cell pellets were resuspended in FACS buffer (2% FBS in HBSS) and filtered through 40-μm cell strainers and pelleted at 500g for 5 min. Pellets were resuspended in FACS buffer and stained with anti-mouse CD45 PE conjugate (30-F11, eBioscience), anti-mouse CD11b PE conjugate (M1/70, eBioscience), anti-mouse Sca-1 PE conjugate (D7, BioLegend), anti-mouse CD31 PE/Cy7 con-jugate (390, BioLegend) and anti-mouse α7-integrin Alexa Fluor 647 conjugate (R2F2, AbLab) for 20 min at 4 °C on a rotating wheel. Cells were washed with FACS buffer. Live cells were identified as calcein blue positive (1:1,000, Invitrogen) and propidium iodide negative (PI, 1 μg ml−1, BD Biosciences). SCs were identified as CD45−Sca-1−CD11b−CD31−α7-integrin+. Cell sorting was performed on a FACSAriaIII with Diva Software (BD).Culture of SCs. SCs and SC-derived primary myoblasts were cultured at 37 °C, 5% CO2, 3% O2 and 95% humidity in growth medium on collagen/laminin-coated tissue culture plates for the indicated time periods. Growth medium was comprised of F10 (Life Technologies) with 20% horse serum (GE), 1% penicillin/streptomycin (Life Technologies) and 5 ng ml−1 bFGF (Sigma). For coating, tissue culture plates were incubated with 1 mg ml−1 collagen (Sigma) and 10 mg ml−1 laminin (Life Technologies) in ddH2O for at least 1 h at 37 °C and allowed to air-dry. For pas-saging or FACS analysis, cultured cells were incubated with 0.5% trypsin in PBS for 3 min at 37 °C and collected in FACS buffer. Treatment of SCs with noggin (Prepotech) or DKK1 (Prepotech) was done at 100 ng ml−1 concentration. SCs and SC-derived primary myoblasts were treated with 1 μM of chemical probes provided by the Structural Genomics Consortium (SGC, http://www.thesgc.org/chemical-probes/epigenetics)29,30. OICR-9429 and bromodomain inhibitors were described previously19,31–39.Clonal myogenesis assay. Freshly isolated SCs from young adult and aged mice were sorted in growth medium in 96-well plates using the automated cell deposi-tion unit of the FACSAriaIII. After 5 days, wells containing myogenic colonies were counted by brightfield microscopy. For clonal analysis of lentivirus-transduced SCs, infected (eGFP+ and/or BFP+) live (DAPI−) cells were sorted as one cell per well in growth medium and wells containing myogenic colonies were counted by fluorescence microscopy (Axio Observer, Zeiss) after 5 days. A colony was defined by the presence of at least two cells.Alamar blue assay. SCs or SC-derived primary myoblasts were seeded at 500 cells per well in growth medium into 96-well plates. After 4 days of culture, the viability was measured by adding Alamar Blue (Life Technologies) as 10% of the sample volume. Cells were incubated for 2 h at 37 °C and fluorescence intensity was measured at an excitation/emission wavelength of 560/590 nm.BrdU assay. SCs were incubated with 5 μM BrdU (Sigma) in growth medium for 2 h. Cells were fixed with 4% PFA, permeabilized with 0.5% Triton X-100 and incu-bated with 2 N HCl/PBS for 30 min at room temperature. Incorporated BrdU was detected using anti-BrdU (347580, BD Biosciences) and Alexa-594 fluorochrome (Life Technologies) for 1 h at room temperature. Nuclei were counterstained with DAPI in PBS.TUNEL assay. TUNEL assay was performed using the In situ Cell Death Detection Kit, Texas Red (Roche) according to the manufacturer’s instructions.Senescence-associated β-galactosidase assay. SCs were fixed in 4% PFA and stained with staining solution (5 mM potassium ferricyanide, 5 mM potassium
ferrocyanide, 2 mM MgCl2, 150 mM NaCl, 1 mg ml−1 X-Gal) in citrate/sodium- phosphate buffer (pH 6) overnight at 37 °C. Staining solution was removed by rinsing several times with PBS.Myofibre isolation and culture. Individual myofibres were isolated from the exten-sor digitorum longus muscle as described previously40,41. Isolated myofibres were cultured in DMEM containing 20% FBS and 1% chicken embryo extract (Biomol) in dishes coated with horse serum. Freshly isolated fibres or fibres cultured for 24–34 h and 72 h were fixed with 2% PFA and subjected to immunofluorescence analysis. Clusters of SCs were counted on at least 10–15 fibres per replicate. A cluster was defined by the presence of at least three adjacent cells. For quanti-fication of immunofluorescence staining of myofibre-associated quiescent and activated SCs, at least 20 fibres were analysed per replicate. Treatment of myofibre- associated SCs with chemical probes provided by the Structural Genomics Consortium (SGC) was done 4 h after isolation at 1 μM concentration.siRNA transfection. Transfection of SCs was performed in a reverse manner: SCs were seeded in growth medium into individual wells of a 384-well plate pre-filled with transfection mix. For floating cultures of single myofibres, transfections were performed 4 h after isolation in myofibre culture medium. Transfections were done using Lipofectamin RNAiMAX (Life Technologies) according to manufacturer’s instructions. For gene knockdown either Silencer Select siRNAs (Life Technologies) or ON-TARGETplus siRNA SMART-pools (Dharmacon) were used. Respective Silencer Select or ON-TARGETplus SMART-pool non-targeting siRNAs were used as negative control. siRNA sequences are listed in Supplementary Table 1. Transfection efficiency was monitored using a Cy3-labelled control siRNA (Life Technologies). After transfection, FACS-sorted SCs or myofibre-associated SCs were cultured for the indicated time periods and fixed in 2% PFA in PBS. In vivo knockdown experiments were performed as described earlier41. siRNA sequences were modified to the Accell self-delivering format (Dharmacon) and 100 μg Accell siRNA were injected into tibialis anterior muscle 2 days after CTX injury. In vivo knockdown was evaluated from SCs iso-lated from injected tibialis anterior muscle 3 days after transfection. Transfected muscles were collected 5 days after siRNA injection, frozen in 10% sucrose/OCT in liquid nitrogen and stored at −80 °C.Lentivirus production and transduction. Lentivirus was produced in Lenti-X cells (Clonetech) after co-transfection of 15 μg shRNA or cDNA plasmid, 10 μg psPAX2 helper plasmid and 5 μg pMD2.G according to standard procedures42. Virus was concentrated by centrifugation for 2.5 h at 106,800g and 4 °C, and virus pellet was resuspended in sterile PBS. Lentiviral transduction was carried out in growth medium supplemented with 8 μg ml−1 polybrene (Sigma).Plasmids. cDNA was inserted into the SF-LV-cDNA-eGFP plasmid43. Primers used for cloning of individual Hox cDNAs are listed in Supplementary Table 1. shRNA was inserted into the SF-LV-shRNA-eGFP plasmid using mir30 primers (Supplementary Table 1). shRNA sequences are listed in Supplementary Table 1.SC transplantation. SCs were FACS purified and transduced with a lentivirus on Retronectin (Takara) coated 48-well plates4. After 8–10 h, SCs were obtained by resuspension and washed several times with FACS buffer. For each engraftment, 10,000 SCs were resuspended in 0.9% NaCl and immediately transplanted into tibialis anterior muscles of adult immunosuppressed mice that had been injured with CTX 2 days before. Immunosuppression with FK506 (5 mg kg−1 body weight, Sigma) was started at the day of injury using osmotic pumps (model 2004, Alzet) and maintained throughout the entire time of engraftment. Engrafted muscles were collected 3 weeks after transplantation and fixed in 4% PFA for 30 min at room temperature followed by incubation in 30% sucrose/PBS overnight at 4 °C. Fixed muscles were frozen in 10% sucrose/OCT in liquid nitrogen and stored at −80 °C.Immunohistochemistry. Cryosections of 10 μm were cut from frozen muscle using the Microm HM 550. Cryosections were rinsed once with PBS and fixed in 2% PFA in PBS for 5 min at room temperature. Sections were rinsed three times for 5 min with PBS, permeabilized with 0.5% Triton X-100/0.1 M glycine in PBS for 5 min at room temperature followed again by rinsing them three times with PBS. Sections were blocked in PBS supplemented with 5% horse serum and 1:40 mouse on mouse blocking reagent (Vector labs) for 1 h at room temperature. Incubation with primary antibodies was carried out overnight at 4 °C. The next day, sections were rinsed three times with PBS followed by incubation with secondary antibod-ies for 1 h at room temperature. Sections were rinsed again with PBS and nuclei were counterstained with 1:1,000 DAPI in PBS before mounting with Permafluor (Thermo Scientific). Slides were stored at 4 °C until analysis. The following pri-mary antibodies were used: 1:1,000 chicken anti-GFP (ab6556, AbCam), 1:1,000 rabbit anti-laminin (L9393, Sigma), 1:200 rabbit anti-Ki67 (ab15580, AbCam), undiluted mouse anti-Pax7 (DSHB). The following secondary antibodies were used at 1:1,000: anti-chicken IgG Alexa-Fluor 488, anti-rabbit IgG Alexa-Fluor 488, anti-mouse IgG1 Alexa-Fluor 594 (Life Technologies).
© 2016 Macmillan Publishers Limited, part of Springer Nature. All rights reserved.
LetterreSeArCH
Immunofluorescence. Freshly isolated SCs were allowed to settle on poly-l- lysine-coated diagnostic microscope slides for 30 min at room temperature. All cells and myofibres were fixed with 2% PFA, permeabilized with 0.5% Triton X-100 and blocked with 10% horse serum in PBS for 1 h at room temperature. Cells and fibres were stained with primary antibodies in blocking solution overnight at 4 °C. Samples were washed three times with PBS and incubated with secondary antibod-ies for 1 h at room temperature. Nuclei were counterstained with DAPI. Cultured cells were kept in PBS; freshly isolated SCs and myofibres were mounted with Permafluor. The following primary antibodies were used: undiluted mouse anti-Pax7 (DSHB), 1:300 rabbit anti-Hoxa9 (07-178, Millipore), 1:500 mouse anti-Mll1 (05-765, Millipore), 1:500 rabbit anti-Wdr5 (A302-429A, Bethyl Laboratories), 1:300 rabbit anti-H3K4me3 (C15410003-50, Diagenode), 1:200 rabbit anti-MyoD (sc-304, Santa Cruz). The following secondary antibodies were used at 1:1,000: anti-rabbit IgG Alexa-Fluor 488, anti-mouse IgG Alexa-Fluor 594, anti-mouse IgG1 Alexa-Fluor 594 (Life Technologies).Fluorescence in situ hybridization (FISH). Chromatin compaction FISH was done as described previously44. DNA of the 3′- and 5′ probe (Fosmid clones WIBR1-1312N03 and WIBR1-2209G09, CHORI) was labelled with digoxigenin or biotin by nick-translation (Roche). 100 ng of probe DNA was used per slide, together with 5 μg mouse CotI DNA (Life Technologies) and 5 μg single-stranded DNA (Ambion). Approximately 5,000 freshly sorted SCs were allowed to settle on poly-l-lysine-coated diagnostic microscope slides for 30 min at room temperature and were fixed with 2% PFA for 5 min. After washing three times with PBS, slides were incubated with 0.1 M HCl for 5 min and permeabilized with 0.5% Triton X-100 in 0.5% saponin for 10 min before freeze–thaw in 20% glycerol in PBS. Denaturation was performed in 50% formamide, 1% Tween-20 and 10% dextran sulfate/2× SSC for 5 min at 75 °C before applying the hybridization cocktail. Probes were hybrid-ized overnight at 37 °C in a humified chamber. Slides were rinsed three times with 2× SSC, blocked with 2% BSA in 0.1% Tween-20 in PBS for 1 h at room temper-ature, and hybridized probes were visualized with anti-digoxigenin-rhodamine (S7165, Millipore) and Streptavidin-Cy2 (016-220-084, IR USA) for 30 min at room temperature. Nuclei were counterstained with DAPI.Digital image acquisition and processing. Immunofluorescence images of mus-cle sections, myofibres and freshly isolated SCs were acquired using the upright microscope Axio Imager (Zeiss) with 10×, 20× and 100× objectives and a monochrome camera. Brightfield and immunofluorescence images of cultured SCs were captured using the microscope Axio Observer (Zeiss) with 5×, 10× and 20× objectives and a monochrome camera. Image acquisition and processing was performed using the ZEN 2012 software (Zeiss). Brightness and contrast adjust-ments were applied to the entire image before the region of interest was selected. For the analysis of muscle sections, several images covering the whole area of the section were acquired in a rasterized manner and assembled in Photoshop CS6 (Adobe) to obtain an image of the entire section. Images were analysed using ImageJ software. The number of Pax7+ cells in regeneration experiments was normalized to the area of the entire muscle section. CTCF was determined for each SC using the calculation: integrated density − (area of selected cell × mean fluorescence of background readings) (ref. 45).RNA isolation and reverse transcription. Total RNA was isolated from freshly FACS-isolated or cultured SCs by using the MagMAX 96 total RNA Isolation Kit (Ambion) according to the manufacturer’s protocol. The GoScript Reverse Transcription System (Promega) was used for cDNA synthesis from total RNA according to manufacturer’s instructions.ChIP. 5 × 10⁴–1 × 10⁵ cells were crosslinked in 1% formaldehyde (Thermo Scientific) for 10 min. Crosslinking was quenched with glycine and cells were washed two times with ice-cold PBS. For ChIP of H3K4me3, cells were lysed in lysis buffer (1% SDS, 10 mM EDTA, 50 mM Tris-HCl pH 8.1, 1×Roche cOmplete Protease Inhibitor) and chromatin was sonicated in Snap Cap microTUBEs using a Covaris M220 sonicator to a fragment size of 150–300 bp. Chromatin was cleared for 10 min at 17,000g, and one-tenth of the chromatin was removed as input frac-tion. Chromatin was immunoprecipitated overnight with 20 μl Protein A/G bead mix (1:1, Dynabeads, Invitrogen) pre-coupled with 1 μg antibody (C15410003-50, Diagenode) in ChIP-dilution buffer (0.01% SDS, 1.1% Triton X-100, 1.2 mM EDTA, 167 mM NaCl, 16.7 mM Tris-HCl pH 8.1, 1× Roche cOmplete Protease Inhibitor). Beads were washed three times with low-salt buffer (0.1% SDS, 1% Triton X-100, 2 mM EDTA, 150 mM NaCl, Tris-HCl, pH 8.1) and three times with LiCl buffer (350 mM LiCl, 1% IPEGAL CA630, 1% deoxycholic acid, 1 mM EDTA, 10 mM Tris-HCl, pH 8.1). For ChIP of Mll1, Wdr5 or haemagglutinin (HA)-tagged Hoxa9 cells were resuspended in sonication buffer (0.1% SDS, 1% Triton X-100, 0.1% Na-deoxycholate, 1 mM EDTA, 140 mM NaCl, 50 mM HEPES, pH 7.9), incubated on ice for 10 min and sonicated to a fragment size of 300–600 bp as described above. Chromatin was cleared for 10 min at 17,000g and unspecific binding was absorbed with 5 μl of Protein G beads for 1 h. One-tenth (Mll1/Wdr5) or one-twentieth
(HA-tag) of the chromatin was removed as input fraction. Chromatin was immunoprecipitated overnight with 2 μg of antibody (Mll1: A300-086A, Wdr5: A302-429A, Bethyl Laboratories; HA-tag: ab9110, Abcam). Chromatin-antibody complexes were captured with 20 μl Protein A/G bead mix (1:1, Dynabeads, Invitrogen) for 2 h. Beads were washed twice with sonication buffer, twice with NaCl buffer (0.1% SDS, 1% Triton X-100, 0.1% Na-deoxycholate, 1 mM EDTA, 500 mM NaCl, 50 mM HEPES, pH 7.9), twice with LiCl buffer and once with TE buffer. Decrosslinking and elution was performed in 50 μl decrosslinking buffer (1% SDS, 100 mM NaHCO3, 250 mM NaCl) for 4 h at 65 °C with continuous shak-ing and subsequent Proteinase K treatment for 1 h at 45 °C. DNA was purified using Agencourt AMPure XP beads (Beckman Coulter) with a beads:sample ratio of 1.8:1 or MinElute PCR Purification Kit according to manufacturer’s protocols.Quantitative PCR. Quantitative PCR (qPCR) was performed with an ABI 7500 Real-Time PCR System (Applied Biosystems) in technical duplicates from the indicated number of biological replicates. The qPCR was carried out in a volume of 12 μl using the Absolute qPCR Rox Mix (Thermo Scientific) and the Universal Probe Library (Roche). Primer and probe sets for the detection of single genes are listed in Supplementary Table 1. Gapdh was detected with rodent Gapdh control reagents (Applied Biosystems). Relative expression values were calculated using the ΔCt method.
ΔCt = Ct[gene of interest] − Ct[Gapdh]Relative expression = 2(−ΔCt)
qPCR analysis of ChIP samples was performed using SYBR Green Supermix (Biorad) in a final reaction volume of 10 μl and 0.75 μM final primer concentration. Primers are listed in Supplementary Table 1. HA-tag ChIP signals were calculated as percentage of the input fraction. The ΔΔCt method was used to calculate fold enrichment of a genomic locus over the ChIP specific background control (Actb intergenic region for H3K4me3 or gene desert for Mll1 and Wdr5), both normal-ized to the signal in the input fraction:
ΔCt[normalized to input] = (Ct[ChIP] − (Ct[input] − log2(input dilution factor)))ΔΔCt = Δ Ct[region of choice normalized to input] − ΔCt[control region
normalized to input]Fold enrichment = 2(−ΔΔCt)
Nanostring analysis. Pellets of freshly isolated SCs were lysed with 3 μl RLT buffer (QIAGEN) and subjected to Nanostring analysis according to manufac-turer’s instructions using a custom-made Hox gene nCounter Elements TagSet (Nanostring Technologies). Relative expression to the housekeeping genes Gapdh, Hmbs and Polr2a was calculated using nSolver Software (v2.0) after background correction and normalization to hybridized probe signals.Proteomic analysis of histone modifications. Preparation of histones for mass spectrometry, data acquisition and analysis were essentially performed as described previously21 with modifications described below. In brief, histones were isolated by acid extraction, derivatised by d6-acetic anhydride (CD3CO, Aldrich) and digested with sequencing-grade trypsin (Promega) overnight at a trypsin:protein ratio of 1:20. To acetylate free peptide N termini, trypsinised histones were derivatised again for 45 min at 37 °C using 1:20 (v/v) d6-acetic anhydride (CD3CO, Aldrich) in 50 mM ammonium bicarbonate buffered to pH 8 by ammonium hydroxide solution. After derivatization, peptides were evaporated in a speed-vac at 37 °C to near dryness, resuspended in 50 μl of 0.1 formic acid and purified by a StageTip protocol using two discs of C18 followed by one disc of activated carbon (3 M Empore). After StageTip purification, the samples were evaporated in a speed-vac to near dryness, resuspended in 20 μl of 0.1% formic acid and stored at −20 °C until mass spectrometry acquisition. The histone samples were separated on a reversed-phase liquid chromatography column (75-μm, New Objective) that was packed in-house with a 15-cm stationary phase (ReproSil-Pur C18-AQ, 1.9 μm). The col-umn was connected to a nano-flow HPLC (EASY-nLC 1000; Thermo Scientific) and peptides were electrosprayed in a Q Exactive mass spectrometer (Thermo Fisher Scientific). Buffer A was composed of 0.1% formic acid in HPLC-grade water and buffer B was 0.1% formic acid in ACN. Peptides were eluted in a linear gradient with a flow rate of 300 nl per minute, starting at 3% B and ramping to 35% in 52 min, followed by an increase to 50% B in 4 min, followed by an increase to 98% in 4 min and then holding at 98% B for another 6 min. Mass spectrometry was operated in a combined shotgun-PRM mode targeting positional isomers. Ion chromatograms were extracted with Thermo Xcalibur and Skyline and data summarization and statistical analysis was performed in Excel and R. Relative abundances were calculated from the raw signal reads, according to the formulas described previously21 without further normalizations.
© 2016 Macmillan Publishers Limited, part of Springer Nature. All rights reserved.
Letter reSeArCH
Microarray and bioinformatics analysis. Gene expression analysis was performed using the Mouse GE 8x60K Microarray Kit (Agilent Technologies, Design ID 028005). 100 ng total RNA isolated from SCs were used for the labelling. Samples were labelled with the Low Input Quick Amp Labelling Kit (Agilent Technologies) according to the manufacturer’s instructions. Slides were scanned using a microar-ray scanner (Agilent Technologies). Expression data were extracted using the Feature Extraction software (Agilent Technologies). Preprocessing of expression data was performed according to Agilent’s standard workflow. Using five quality flags (gIsPosAndSignif, gIsFeatNonUnifOL, gIsWellAboveBG, gIsSaturated, and gIsFeatPopnOL) from the Feature Extraction software output, probes were labelled as detected, not detected, or compromised. Gene expression levels were back-ground corrected, and signals for duplicated probes were summarized by geometric mean of non-compromised probes. After log2 transformation, a percentile shift normalization at the 75% level and a baseline shift to the median baseline of all probes was performed. All computations were performed using the R statistical software framework (http://www.R-project.org). Differentially expressed genes were calculated by the shrinkage T-statistic46 and controlled for multiple testing by maintaining a false discovery rate (FDR) < 0.05 (ref. 47).RNA-sequencing analysis. Sequencing reads were filtered out for low quality sequences and trimmed of low quality bases by using FASTX-Toolkit (http://hannonlab.cshl.edu/fastx_toolkit/). Mapping to mm9 genome was performed by using TopHat software48. Gene quantification was performed by using HT-Seq and differentially expressed genes (DEGs) were estimated by using DESEQ2 (refs 49, 50) within the R statistical software framework (http://www.R-project.org) with P < 0.01. Pearson correlation heatmaps were generated by using custom R scripts by selecting genes having more than 10 read counts in all the samples of at least one condition and an interquartile range (IQR) > 0.5. Significance of overlapping DEGs was calculated by normal approximation of hypergeometric probability.Identification of Hoxa9-binding sites. Transcription start and end sites of putative Hoxa9 target genes were collected from the UCSC Genome Browser51 with mm8 track. Sequences in gene body regions (from transcription start to end sites), promoter regions (−2/+1 kb relative to transcription start sites), and distal intergenic regions (−50/+50 kb relative to transcription start sites) of 26 genes were prepared for identification of Hoxa9 binding sites. These sequences were aligned based on the previously reported consensus motifs for Hoxa9-Meis1-Pbx1 (ATGATTTATGGC)52 and Meis1 (TGTC)53. Putative Hoxa9-binding sites were aligned when they contained either no mismatch or one mismatch, and Meis1 motifs were aligned with no mismatch allowed. Hoxa9-binding sites with at least one Meis1-binding site within 300 bp on the same DNA strand were selected for further analysis. Identified Hoxa9-binding sites are listed in Supplementary Table 1.Statistics. If not stated otherwise, results are presented as mean and s.e.m. from the number of samples indicated in the figure legends. Two groups were compared by two-sided Student’s t-test or two-sided Mann–Whitney U-test. For multiple comparisons a two-way ANOVA was performed using a FDR < 0.5 to correct for multiple comparisons. *P < 0.05; **P < 0.01; ***P < 0.001; ****P < 0.0001. Statistical analysis was done using GraphPad Prism 6 software and R (v3.3.1).Data availability statement. Microarray and RNA-sequencing data that support the findings of this study have been deposited in the Gene Expression Omnibus (GEO) with the accession code GSE87812. Further data that support the findings of this study are available from the corresponding authors upon reasonable request. Source data for the Figures and Extended Data Figures are provided with the paper.
28. Lawrence, H. J. et al. Mice bearing a targeted interruption of the homeobox gene HOXA9 have defects in myeloid, erythroid, and lymphoid hematopoiesis. Blood 89, 1922–1930 (1997).
29. Brown, P. J. & Müller, S. Open access chemical probes for epigenetic targets. Future Med. Chem. 7, 1901–1917 (2015).
30. Barsyte-Lovejoy, D. et al. Chemical biology approaches for characterization of epigenetic regulators. Methods Enzymol. 574, 79–103 (2016).
31. Theodoulou, N. H. et al. Discovery of I-BRD9, a selective cell active chemical probe for bromodomain containing protein 9 inhibition. J. Med. Chem. 59, 1425–1439 (2016).
32. Picaud, S. et al. Generation of a selective small molecule inhibitor of the CBP/p300 bromodomain for leukemia therapy. Cancer Res. 75, 5106–5119 (2015).
33. Picaud, S. et al. PFI-1, a highly selective protein interaction inhibitor, targeting BET bromodomains. Cancer Res. 73, 3336–3346 (2013).
34. Martin, L. J. et al. Structure-based design of an in vivo active selective BRD9 inhibitor. J. Med. Chem. 59, 4462–4475 (2016).
35. Hay, D. A. et al. Discovery and optimization of small-molecule ligands for the CBP/p300 bromodomains. J. Am. Chem. Soc. 136, 9308–9319 (2014).
36. Drouin, L. et al. Structure enabled design of BAZ2-ICR, a chemical probe targeting the bromodomains of BAZ2A and BAZ2B. J. Med. Chem. 58, 2553–2559 (2015).
37. Clark, P. G. et al. LP99: discovery and synthesis of the first selective BRD7/9 bromodomain inhibitor. Angew. Chem. 127, 6315–6319 (2015).
38. Chen, P. et al. Discovery and characterization of GSK2801, a selective chemical probe for the bromodomains BAZ2A and BAZ2B. J. Med. Chem. 59, 1410–1424 (2016).
39. Filippakopoulos, P. et al. Selective inhibition of BET bromodomains. Nature 468, 1067–1073 (2010).
40. Pasut, A., Jones, A. E. & Rudnicki, M. A. Isolation and culture of individual myofibers and their satellite cells from adult skeletal muscle. J. Vis. Exp. 73, 50074 (2013).
41. Bentzinger, C. F. et al. Fibronectin regulates Wnt7a signaling and satellite cell expansion. Cell Stem Cell 12, 75–87 (2013).
42. Schambach, A. et al. Lentiviral vectors pseudotyped with murine ecotropic envelope: increased biosafety and convenience in preclinical research. Exp. Hematol. 34, 588–592 (2006).
43. Wang, J. et al. A differentiation checkpoint limits hematopoietic stem cell self-renewal in response to DNA damage. Cell 148, 1001–1014 (2012).
44. Chambeyron, S. & Bickmore, W. A. Chromatin decondensation and nuclear reorganization of the HoxB locus upon induction of transcription. Genes Dev. 18, 1119–1130 (2004).
45. Burgess, A. et al. Loss of human Greatwall results in G2 arrest and multiple mitotic defects due to deregulation of the cyclin B-Cdc2/PP2A balance. Proc. Natl Acad. Sci. USA 107, 12564–12569 (2010).
46. Opgen-Rhein, R. & Strimmer, K. Accurate ranking of differentially expressed genes by a distribution-free shrinkage approach. Stat. Appl. Genet. Mol. Biol. 6, http://dx.doi.org/10.2202/1544-6115.1252 (2007).
47. Benjamini, Y. & Hochberg, Y. Controlling the false discovery rate: a practical and powerful approach to multiple testing. J. R. Statist. Soc. B 57, 12 (1995).
48. Trapnell, C., Pachter, L. & Salzberg, S. L. TopHat: discovering splice junctions with RNA-Seq. Bioinformatics 25, 1105–1111 (2009).
49. Anders, S., Pyl, P. T. & Huber, W. HTSeq—a Python framework to work with high-throughput sequencing data. Bioinformatics 31, 166–169 (2015).
50. Love, M. I., Huber, W. & Anders, S. Moderated estimation of fold change and dispersion for RNA-seq data with DESeq2. Genome Biol. 15, 550 (2014).
51. Karolchik, D. et al. The UCSC Table Browser data retrieval tool. Nucleic Acids Res. 32, D493–D496 (2004).
52. Shen, W. F. et al. HOXA9 forms triple complexes with PBX2 and MEIS1 in myeloid cells. Mol. Cell. Biol. 19, 3051–3061 (1999).
53. Huang, Y. et al. Identification and characterization of Hoxa9 binding sites in hematopoietic cells. Blood 119, 388–398 (2012).
© 2016 Macmillan Publishers Limited, part of Springer Nature. All rights reserved.