epigenetic variation in the egfr gene generates
TRANSCRIPT

ARTICLE
Received 15 Jul 2014 | Accepted 5 Feb 2015 | Published 11 Mar 2015
Epigenetic variation in the Egfr gene generatesquantitative variation in a complex trait in antsSebastian Alvarado1,*,w, Rajendhran Rajakumar2,*,w, Ehab Abouheif2 & Moshe Szyf1
Complex quantitative traits, like size and behaviour, are a pervasive feature of natural
populations. Quantitative trait variation is the product of both genetic and environmental
factors, yet little is known about the mechanisms through which their interaction generates
this variation. Epigenetic processes, such as DNA methylation, can mediate gene-by-
environment interactions during development to generate discrete phenotypic variation. We
therefore investigated the developmental role of DNA methylation in generating continuous
size variation of workers in an ant colony, a key trait associated with division of labour. Here
we show that, in the carpenter ant Camponotus floridanus, global (genome-wide) DNA
methylation indirectly regulates quantitative methylation of the conserved cell-signalling gene
Epidermal growth factor receptor to generate continuous size variation of workers. DNA
methylation can therefore generate quantitative variation in a complex trait by quantitatively
regulating the transcription of a gene. This mechanism, alongside genetic variation, may
determine the phenotypic possibilities of loci for generating quantitative trait variation in
natural populations.
DOI: 10.1038/ncomms7513
1 Department of Pharmacology and Therapeutics, McGill University, 3655 Sir William Osler, Suite 1309, Montreal, Quebec, Canada H3G 1Y6. 2 Department ofBiology, McGill University, 1205 Dr Penfield, N3/6, Montreal, Quebec, Canada H3A 1B1. * These authors contributed equally to this work. w Present addresses:Department of Biology, Stanford University, 371 Serra Mall, Gilbert Biology 314, Palo Alto, California 94305-5020, USA (S.A.); Department of MolecularGenetics & Microbiology and UF Genetics Institute, University of Florida, 2033 Mowry Road, Gainesville, Florida 32610-3610, USA (R.R.). Correspondenceand requests for materials should be addressed to M.S. (email: [email protected]) or to E.A. (email: [email protected]).
NATURE COMMUNICATIONS | 6:6513 | DOI: 10.1038/ncomms7513 | www.nature.com/naturecommunications 1
& 2015 Macmillan Publishers Limited. All rights reserved.
Understanding how variation in quantitative traits isgenerated is important for mapping the genetic basis ofdisease, improving plant and animal breeding, and
predicting evolutionary changes1,2. The field of quantitativegenetics has produced a wealth of knowledge regarding thegenetic basis of quantitative trait variation, including the number,distribution and identification of large and small effect lociunderlying quantitative traits1–3. Little is known, however, abouthow the environment interacts with such loci and whether thisinteraction can generate quantitative trait variation4,5. Severalstudies have shown that epigenetic mechanisms, such as DNAmethylation and histone modifications, can mediate gene-by-environment interactions during development to generatediscrete phenotypic variation6–9. For example, in rats, DNAmethylation mediates the onset of stress tolerance in response tothe presence/absence of postnatal maternal care8, and in socialinsects, DNA methylation plays a role in regulating discretemorphological7 and behavioural10 differences between queen andworker castes. It remains unclear, however, what role DNAmethylation plays in generating quantitative trait variation.
Here, we use ant societies to address this question becausecontinuous variation in the size of individuals in the workercaste is a key trait associated with the division of labour,where differently sized workers can specialize in taskssuch as excavation, brood transport and foraging11–13. Allholometabolous insects (ants, bees, wasps, beetles, butterflies,moths and flies) do not grow as adults14,15. All growth occursduring the larval phase when larvae molt from one instar to thenext and during each instar14,15. Adults, due to their toughinflexible exoskeleton, do not molt and therefore their final bodysize is determined entirely by the end of larval development justbefore metamorphosis14,15. The final size of a worker in anant colony is therefore established during development16.Determination of final size of a worker is polyphenic, whichmeans that the same genome can produce a spectrum of finaladult sizes in response to environmental factors11,16,17. Studies inthe wild and in the lab spanning more than 100 years haveidentified nutrition levels and social interactions as criticalenvironmental factors that influence the final size of workersduring larval development16–19. In ant species where geneticvariation in the worker caste has been shown to be high, workerlarvae in the colony remain polyphenic, but may varyquantitatively in their response to these environmentalfactors20–22.
In the ant genus Camponotus, variation in worker size has beenshown to be influenced by nutrition in the form of protein,vitamins and minerals23,24. We chose the ant species C. floridanusbecause worker size variation is continuous, genetic variationbetween workers in a C. floridanus colony is low (workers are onaverage 75% related)25 and extensive sequencing efforts indicatethat within a colony there is no allelic bias between differentlysized workers26. Therefore, genetic variation alone cannot fullyexplain the diversity of worker size found in C. floridanus. Finally,the genome of C. floridanus is sequenced and has a DNAmethylation system26,27, thereby making this species an excellentmodel for understanding how gene-by-environment interactionsgenerate quantitative trait variation in natural populations.
DNA methylation in vertebrates occurs in regulatory elementsthat reside in promoter regions as well as inside and outside ofgene bodies throughout the genome28,29, and is known to repressgene function through the covalent modification of cytosineresidues within these elements30. In social insects, however, DNAmethylation occurs primarily in gene bodies28,29,31 and isgenerally associated with caste-specific alternative splicing26,32,33
and gene expression7,32. There is functional evidence inhoneybees that gene body methylation regulates alternative
splicing34 and can repress gene expression and phenotype7 in acaste-specific manner. Knockdown of a DNA methylatingenzyme (Dnmt3) in adult honeybee fat tissue affects alternativesplicing34, whereas knockdown of this enzyme in developinghoneybee larvae results in the appearance of queen-likemorphologies and a change in transcription levels of severaltypes of genes, including those involved in growth andmetabolism7. One of these growth-regulating genes Target ofrapamycin (Tor) is more methylated33 and is expressed at lowerlevels35 in developing workers than in queens. Knockdown of torin queen-destined larvae results in adults with workercharacteristics35, indicating that gene body methylation isinvolved in repressing the expression of Tor in workers.
In this study, we examine the hypothesis that naturallyoccurring inter-individual differences in a quantitative trait canalso be generated by environmental variation through quantita-tive inter-individual differences in DNA methylation. We showthat in colonies of the ant C. floridanus, natural inter-individualvariation in the size of workers correlates with the natural inter-individual variation in the state of methylation of the highlyconserved gene Egfr. We performed functional experiments todemonstrate that genome-wide DNA methylation indirectlyregulates the quantitative methylation of Egfr to generatequantitative variation in the size of workers. By linking acontinuous distribution in a trait in a natural population with acontinuous distribution of DNA methylation states in a singlegene, our study provides an epigenetic mechanism for generatingquantitative variation in organismal phenotypes.
ResultsWorker size variation and development in natural populations.To address the role that DNA methylation plays in the regulationof worker size variation in C. floridanus, we first determined thesize distribution of adult workers. We found that it is continuouswith two peaks in frequency that represent the two workersubcastes—minor ‘m’ and major ‘M’ workers11 in Fig. 1a,b.Although all workers form a continuous size distribution, minorsand majors are distinguished by head allometry (the size of theirheads relative to their bodies; Fig. 1c). To identify thedevelopmental stage where this dramatic variation in workersize is established, we determined the number of larval instars.We found that there are a total of four larval instars and that mostof the growth differences in size between workers are establishedduring the 4th (final) instar (Fig. 1d). The early 4th instar larvaehave not yet experienced this rapid growth (‘early’ in Fig. 1d),whereas late 4th instar larvae undergo a burst of growthproducing a continuous range of final larval sizes (Fig. 1d).Because final adult size is determined at the end of larvaldevelopment in insects14,15, including ants16, we can thereforeinfer that the smaller larvae (‘m’ in Fig. 1d) will develop into adultminor workers, whereas the larger larvae (‘M’ in Fig. 1d) willdevelop into major workers.
Worker size variation is linked to DNA methylation. We thentested if differential methylation at the genomic and gene levelsduring development may be involved in generating the con-tinuous distribution of worker size in C. floridanus. Beforeexamining the entire size continuum, however, we first used theextreme ends of the distribution to screen for dynamic changes inglobal DNA methylation that are associated with the early andlate phases of larval growth during the 4th instar. If DNAmethylation plays a role in regulating worker size variation, thenwe expected to find higher levels of methylation in the smallestworker larvae and lower levels of methylation in the largestworker larvae. Indeed, we found that early 4th instar larvae have
ARTICLE NATURE COMMUNICATIONS | DOI: 10.1038/ncomms7513
2 NATURE COMMUNICATIONS | 6:6513 | DOI: 10.1038/ncomms7513 | www.nature.com/naturecommunications
& 2015 Macmillan Publishers Limited. All rights reserved.

significantly lower levels of global methylation relative to late4th instar larvae (Fig. 2a) and 4th instar minor worker larvaewere significantly hypermethylated compared with 4th instarmajor worker larvae (Fig. 2a). We next compared expression
levels of key enzymatic regulators of DNA methylation9 (DNAmethyltransferase 1 (Dnmt1), DNA methyltransferase 3 (Dnmt3),Ten-eleven-translocation 2 (Tet2), Methyl-binding domain (Mbd)and Methyl CpG-binding protein 2 (Mecp2)) and histonemodification9 (Histone deacetylase 1 (Hdac1), Histonedeacetylase 3 (Hdac3), Histone acetyltransferase (Hat) andLysine-specific demethylase 1 (Lsd1)) and asked whetheralterations in the level of expression of these regulatorscorrespond to differences in global DNA methylation. Wefound that differences in levels of gene expression of Dnmt1,Dnmt3, Tet2, Mbd and Mecp2 (Fig. 2b,c and SupplementaryFig. 1a–d) as well as Hdac1 and Hat (Supplementary Fig. 1d,f)correspond to differences in global methylation levels during the4th instar. Considering that key enzymatic regulators of DNAmethylation, Mbd and Mecp2, are known to interact withHDACs36, both regulators of DNA methylation and histonemodification may contribute to the pattern of global DNAmethylation. Our results therefore suggest a link between globalDNA methylation and the regulation of the continuous workersize variation during the fourth instar in C. floridanus.
DNA methylation regulates worker size variation. To determinewhether global DNA methylation plays a functional role duringdevelopment to regulate the continuous size variation of workers,we manipulated levels of global methylation during the early4th instar. We used a hypomethylating agent, the inhibitor ofDNA methyltransferases 5-AZA-dCytidine (5-AZA-dC)37,and a hypermethylating agent, the methyl donor S-adenosylmethionine38 (SAM). Relative to controls, we found that 5-AZA-dC significantly reduced genomic methylation (SupplementaryFig. 3a) and shifted the continuous size distribution bysignificantly increasing the mean size of adult workers(Fig. 3b,e,f, Supplementary Fig. 2a–c). In contrast, we foundthat SAM increased genomic methylation as expected (althoughnot statistically significant; Supplementary Fig. 3b) and shifts thecontinuous size distribution by significantly decreasing the meansize of adult workers (Fig. 3a,c,d and Supplementary Fig. 2d–f).Although SAM has many biological functions, its role inmediating global DNA methylation and sizing is reinforcedby the contrasting effect on genomic methylation levels andphenotype caused by 5-AZA-dC, a well-known hypomethylatingagent. Finally, because worker size is sensitive to environmentalconditions (nutrition and social interactions), the size range ofworkers emerging from our control replicates is always smallerthan in our lab-reared wild-type colonies (see insets Fig. 3a,b).This means that we are generally underestimating the magnitudeof the effect of these drug treatments on shifting the continuoussize distribution of workers (Figs 1a and 3a,b). These resultsdemonstrate that, during larval development, global DNA
40
a b
m
M
b
a b c d e
ac
d
e
30
20
10
0
Length (µm)
1,65
01,
7001,
7501,
8001,
8501,
9001,
9502,
0002,
0502,
1002,
1502,
2002,
2502,
3002,
3502,
4002,
4502,
500
Fre
quen
cy
c3,000 Head with
Scapelength
2,500
2,000
Adu
lt he
ad w
idth
(µm
)
1,500Mm
1,000
1,40
0
Scape length (µm)(proxy for body size)
1,60
0
1,80
0
2,00
0
2,20
0
2,40
0
2,60
0
8,000 m
m
Early
Early
M
M
6,000
4,000
2,000
0
Width of head capsule (µm)
300
400
500
600
Larv
al le
ngth
(µm
)
d
Figure 1 | Continuous size distribution of workers in C. floridanus.
(a) Continuous distribution of adult size of C. floridanus workers (n¼ 179).
This distribution is based on scape length (b), a common proxy for body
size. (b) Representative categories of sizing continuum in natural
C. floridanus populations that exists from smallest a to largest e.
Magnification is �8. (c) Allometric classification of adult C. floridanus
workers into major and minor workers. Adult head width was plotted
against adult scape length. Minor and major adult workers are distinguished
by a break in the allometry curve. Blue circles indicate minor workers,
red squares indicate major workers. (d) Developmental stages and
establishment of final worker sizes (n¼ 197); minor worker-destined larvae
are indicated by m and major worker-destined larvae are indicated by M.
Magnification of inset is � 30.
0.90 4×10⁻⁶
3×10⁻⁶
2×10⁻⁶
1×10⁻⁶
0
3×10⁻⁷
*Dnmt3
*******
2×10⁻⁷
1×10⁻⁷
0Early m MEarly m M
mR
NA
/rps
49
mR
NA
/rps
49
Dnmt1
******
*****
*0.85
0.80
0.75
0.70
0.65Early m M
Inde
x m
ethy
latio
n
Figure 2 | DNA methylation profiles during development. (a) Genomic methylation in early 4th instar, as well as minor and major larvae in late
4th instar. Genomic methylation is shown as a ratio of [MspI/HpaII] cuts to provide an index of overall DNA methylation. Transcription level of (b) Dnmt1
and (c) Dnmt3 in early 4th instar larvae (white bar), late minor worker larvae (grey bar) and late major worker larvae (black bar). Bars indicate mean,
whereas error bars indicate±s.e.m. Statistical significance values for Student’s t-test are as follows: *Po0.05, **Po0.01, ***Po0.001, ****Po0.0001.
Sample sizes for each larval category is nZ30 individual larvae.
NATURE COMMUNICATIONS | DOI: 10.1038/ncomms7513 ARTICLE
NATURE COMMUNICATIONS | 6:6513 | DOI: 10.1038/ncomms7513 | www.nature.com/naturecommunications 3
& 2015 Macmillan Publishers Limited. All rights reserved.

methylation is involved in regulating continuous worker sizedistribution in C. floridanus.
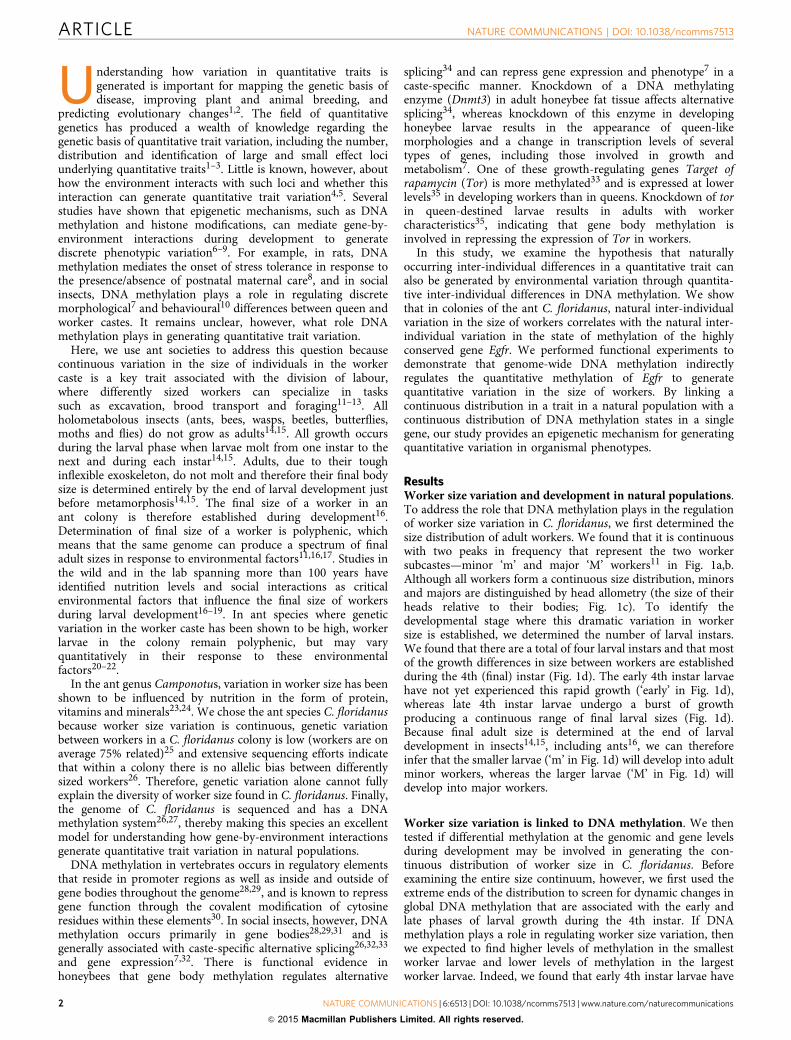
EGFR regulates worker size variation. To identify potentialtargets of DNA methylation, we assayed the expression of a panelof genes (Juvenile hormone acid methyltransferase (JHAMT2),Juvenile hormone esterase (JHE2), Target of rapamycin (Tor),Phosphatase and tensin homologue (Pten), chico, Epidermalgrowth factor receptor (Egfr)) from pathways known to playcritical roles in regulating discrete size differences in social insects(Supplementary Fig. 4)35,39–41. We found that Egfr shows themost dramatic increase in expression within 4th instar minorworker larvae (Fig. 4a and Supplementary Fig. 4f). EGFR acts as acell surface receptor that binds specific extracellular proteinligands, including growth factors from the epidermal growthfactor and transforming growth factor (alpha) families. Oncebound, EGFR stimulates phosphorylation and activatesdownstream pathways, including the Mitogen-activated proteinkinase, Serine-threonine protein kinase and c-Jun N-terminalkinase pathways, leading to the regulation of DNA synthesis,growth, cell proliferation, differentiation and many other vitalcellular processes42. In honeybees, dietary cues (royal jelly)stimulate EGFR signalling, which regulates size anddevelopmental timing, leading to the development of queens39.Furthermore, in fruit flies, mapping loci that underlie quantitativetraits (quantitative trait loci or QTLs) has identified Egfr as agenetic locus with a major effect on variation in quantitativesizing43. To determine the developmental role of EGFRin regulating the continuous variation in worker size inC. floridanus, we inhibited EGFR signalling during the early 4thinstar using a pharmacological inhibitor (PD 153035). Thisinhibitor is known to be specific to EGFR44, and as expected,significantly inhibits EGFR phosphorylation 24 h post treatment(Supplementary Fig. 3c,d). We discovered that, relative tocontrols, inhibition of EGFR shifts the continuous sizedistribution by significantly increasing the mean size of adult
workers (Fig. 4c–e and Supplementary Fig. 2g–i). This dramaticeffect of EGFR inhibition indicates that EGFR is involved inregulating the continuous size distribution of workers inC. floridanus.
DNA methylation regulates worker size variation through EGFR.To determine whether global DNA methylation developmentallyregulates continuous size distribution in workers through EGFR,we assayed Egfr methylation and expression levels after weexperimentally treated early 4th instar larvae with SAM and5-AZA-dC. We found an inverse relationship between levels ofglobal DNA methylation and Egfr expression. Increasing globalmethylation by SAM treatment during the 4th larval instar resultsin decreased methylation and increased expression of Egfr(Supplementary Fig. 5a,b), whereas decreasing global methylationby 5-AZA-dC treatment results in increased methylation anddecreased expression of Egfr (Supplementary Fig. 5c,d). Thisindicates that other intermediate genes or processes downstreamto global changes in DNA methylation state mediate this inverserelationship45,46. Furthermore, DNA methylation and EGFRsignalling may regulate worker size differences by affectingdevelopmental timing. In ants, increasing the duration ofdevelopment gives worker larvae more time to grow resultingin larger adult workers, whereas decreasing the duration ofdevelopment gives larvae less time to grow resulting in smalleradult workers47. We found that the duration of development wasshortened following SAM treatment, whereas it was extendedafter EGFR inhibition (Supplementary Fig. 6a,c). 5-AZA-dC didnot affect developmental timing possibly because higherconcentration may be required to elicit such a response orbecause 5-AZA-dC affects on sizing may operate through adevelopmental timing-independent mechanism. Our resultsindicate that global DNA methylation indirectly regulates theexpression and methylation levels of Egfr during development,which in turn regulates the continuous size distribution ofworkers possibly through changes in developmental timing.
840 403020100
H2SO4
SAM
Length (µm)
Head width
*
6
4
2
0
Head width Scape length
********1,400
1,300
1,200
1,100
1,000
900
2,200
2,000
1,800
1,600
1,400
1,200H2SO4n =14
H2SO4n =14
SAMn =18
SAMn =18
H2On =17
H2On =17
5-AZA-dcn =16
5-AZA-dCn =16
µm µm
1,40
01,
450
1,50
01,
550
1,60
01,
650
1,70
01,
750
1,90
01,
950
2,00
01,
800
1,85
0
Fre
quen
cy8 30
20100
H2O
5-AZA-dC
Length (µm)
6
4
2
0
1,500 2,200 ****
Scape length
2,000
1,800
1,600
1,400
µm
1,400
1,300
1,200
1,100
1,000
µm
1,65
01,
700
1,75
01,
900
1,95
02,
000
1,80
01,
850
Fre
quen
cy
Figure 3 | Pharmacological manipulation of global (genome-wide) DNA methylation shifts mean of continuous worker size distribution. Hatched
bars indicate effect of (a) SAM (n¼ 18) and (b) 5-AZA-dC (n¼ 16) administration at the early 4th instar, whereas white bars indicate controls (H2SO4 for
SAM and H2O for 5-AZA-dC) relative to WT distribution of sizes seen in inset. SAM-treated animals (black box) compared with control (white box; n¼ 14)
for (c) head width and (d) scape length. 5-AZA-dC-treated (black box) animals compared with control (white box; n¼ 17) for (e) head width and (f) scape
length. Boxplot whiskers indicate min and max. Box defined by 25th percentile, mode and 75th percentile. Bars indicate mean and error bars
indicate±s.e.m. Statistical significance values for Student’s t-test are as follows: *Po0.05, ****Po0.0001. Note that all scape length and head width
measurement data are normally distributed (tested with Shapiro-Wilk’s test).
ARTICLE NATURE COMMUNICATIONS | DOI: 10.1038/ncomms7513
4 NATURE COMMUNICATIONS | 6:6513 | DOI: 10.1038/ncomms7513 | www.nature.com/naturecommunications
& 2015 Macmillan Publishers Limited. All rights reserved.
Quantitative methylation of Egfr generates worker size variation.We then discovered that DNA methylation through the specificmethylation of Egfr not only regulates, but also generates a largepart of the continuous worker size distribution. We found thatquantitative differences in DNA methylation of Egfr is highlycorrelated to the final size of individual worker larvae, which
spans the entire larval size range of the distribution, includingminor and major worker larvae. Because final adult size isdetermined at the end of larval development14–16, we cantherefore infer that these quantitative differences in DNAmethylation of Egfr are also correlated to final adult size. In theC. floridanus genome, CpG dinucleotide methylation is primarilyconcentrated at the beginning of the protein-coding region of allgenes26. We therefore screened the first 225 bp of Egfr andidentified all CpG dinucleotides. We then determined the %methylation for each of these CpG dinucleotides in 50 individuallate 4th instar larvae that represent the entire size continuum ofworkers. Of all the CpG dinucleotides screened, we discoveredfour sites for which the level of DNA methylation is significantlycorrelated to the final size of late 4th instar larvae (Fig. 4b,f andSupplementary Fig. 7). Two of these sites (CG þ 101, R2¼ 0.66and CG þ 182, R2¼ 0.24) remained statistically significant afterBonferroni correction for multiple comparisons (SupplementaryFig. 7 and Supplementary Table 2). We then cloned this sequenceinto a CpG-free luciferase construct to determine whether theseCpG dinucleotides, when methylated, affect the transcription ofEgfr. We show that this differentially methylated region of Egfrcould direct the transcription of this luciferase reporter in humanHEK293 cells suggesting that it is a bona fide transcriptionregulatory region and that DNA methylation can indeed repressits transcriptional activity (Fig. 4g). Finally, in order to rule outsequence variation in this region of Egfr as a possible cause for theobserved size differences of individual workers, we sequenced thisregion from the smallest (minor) and the largest (major) workersand found no genetic differences (Supplementary Fig. 8).Collectively, our results indicate that DNA methylationquantitatively regulates Egfr during larval development togenerate a large part of the continuous worker size distribution.
DiscussionGeneration of continuous worker size variation by the epigeneticcontrol of Egfr can be hypothesized as follows (Fig. 5): variationin environmental factors leads to the hypermethylation (increase)or hypomethylation (decrease) of genomic DNA methylationlevels during development of final instar larvae. Although ourstudy did not determine the specific environmental factors thatcause natural variation in DNA methylation, previous studies inants, including other species in the genus Camponotus, haveestablished both nutritional variation and social interactions ascauses for variations in worker size16–19,23,24. Hyper- or Hypo-methylation in genomic DNA methylation levels then translatesinto the differential quantitative methylation of Egfr throughintermediary genes or processes. Histone modifications areknown to be key regulators in C. floridanus48, making them apossible candidate for this intermediary regulation of the inverserelationship between global DNA methylation and methylation ofEgfr. This results in quantitative inter-individual differences in thetranscription of Egfr in the colony, which in turn generates thedifferential growth attained by late final instar larvae. InC. floridanus, we show that quantitative methylation at Egfrexplains a large proportion of the variance (465%) of final larvalsize in natural colonies. This, combined with our drug treatmentresults and the fact that final adult size is determined by the finalsize of larvae14,15, suggests a causal relationship betweenmethylation, Egfr, and the final size of adult workers.
In ants, Egfr may be positioned as a key regulator of conservedpathways; in honeybees, diet activates EGFR to regulate severalimportant downstream pathways, including the TOR, juvenilehormone and insulin signalling pathways39. In other animals,EGFR signalling is also known to play a role in regulating DNAmethylation through downstream activation of DNMTs49
0Early m M
2×101
4×101
mR
NA
/rps
49 6×101
8×101 **** *******
Egfr
0Early m M
5×101
1×101
% M
ethy
latio
n C
G +
101
2×101 *******
**Egfr
1,100
0
1,70
017
,50
1,80
01,
850
1,90
01,
950
2,00
021
,00
2,15
02,
050
2
Freq
uenc
y
4
6
8
1,200
DMSOn=18
DMSOEGFRi
12
EGFRin=17
1,300
1,500
1,600
1,400
µm
****Head width
1,600
1,800
DMSOn=18
EGFRin=17
2,000
2,400
2,200µm
****
Scape length
Length (µm)
20
10
0
4,00
05,
000
6,00
0
Larval length (µm)7,
000
8,00
09,
000
40
30
% M
ethy
latio
n
50
P <0.0001R2=0.6599
Larval length vs CG +101
2×10³
S AS mS0
4×10³
Luc/
tota
l pro
tein
6×10³
8×10³ ***
Figure 4 | The role and regulation of Egfr in generating quantitative
variation in worker size. (a) Egfr expression in early 4th (white bar), late
4th instar minor (grey bar) and major larvae (black bar; nZ30). (b) Percent
(%) methylation of site CpG þ 101 in Egfr for early 4th instar (white bar),
late 4th instar minor (grey bar) and major larvae (black bar; nZ30). EGFR
inhibition of early 4th instar worker larvae (black box) compared with
control DMSO (white box) for (c) head width and (d) scape length. Scape
and head width measurement data are normally distributed (tested with
Shapiro-Wilk’s test). Boxplot whiskers indicate min and max. Box defined by
25th percentile, mode and 75th percentile. (e) EGFR inhibition at the early
4th instar and its effect on sizing distribution (hatched bars; n¼ 17)
compared with control DMSO (white bars; n¼ 18) relative to WT
distribution of sizes seen in inset. (f) Linear regression between percent
(%) methylation of Egfr site þ 101 (y-axis) and final larval length in mm
(x-axis) across a spectrum of larval sizes (n¼ 50). (g) Egfr promoter cloned
into luciferase reporter pCpGl in sense (S), antisense (AS) and methylated
sense (mS). Bars indicate luciferase activity from the pCpGl construct
relative to total protein (n¼ 3). Data shown as mean and error bars
indicate±s.e.m. Statistical significance values for Student’s t-test are as
follows: *Po0.05, **Po0.01, ***Po0.001, ****Po0.0001.
NATURE COMMUNICATIONS | DOI: 10.1038/ncomms7513 ARTICLE
NATURE COMMUNICATIONS | 6:6513 | DOI: 10.1038/ncomms7513 | www.nature.com/naturecommunications 5
& 2015 Macmillan Publishers Limited. All rights reserved.

resulting in altered cellular growth. This raises the possibility thatin ants, Egfr may not only be a target of DNA methylation butmay in turn also regulate DNA methylation. It is important tonote that the main goal of our study was to understand thedevelopmental role of DNA methylation in producingquantitative variation in worker size and not castedetermination, that is, producing minor and major workersubcastes with their discrete allometric differences between headand body size (Fig. 1c). Caste determination is a complex processthat may require more than just a size increase through Egfr.Major worker subcastes have many discrete features other thansize11, which are not present in minor worker subcastes, and mayrequire juvenile hormone and other factors.
The quantitative methylation of specific loci, like Egfr, mayrepresent a more general mechanism for the generation andevolution of quantitative trait variation across animals. DNAmethylation, the EGFR pathway and specific pathways down-stream of EGFR are highly conserved across animals, and DNAmethylation is known to be transgenerationally inherited9,50–52.In vertebrates, quantitative differences in methylation of aninserted retroviral element in front of the Agouti gene in mousedefines differences in coat colour53, and the distribution of coatcolours could be shifted by altering the methyl content inmaternal diet53. It remains to be shown, however, whether naturalinter-individual epigenetic variation of this inserted retroviralelement generates variation in coat colour in natural populations.This mechanism may also underlie associations found betweenepigenetic variation and disease susceptibility, like that found forType II diabetes in humans54, as well as quantitative traits, likethat found for flowering time and height in plants51.
Finally, our results hold important implications for quantitativegenetics. The eventual unification of Mendelian inheritance withDarwin’s theory of natural selection was made possible by theinfinitesimal model55, which assumes that quantitative traitvariation is generated by the action of an infinite number ofloci that have small and equal effects on the phenotype3,56. Theevolution of quantitative traits is therefore thought to occurthrough random mutations across these loci3,56. However, theempirical search for QTLs has revealed that trait variation oftenmaps to specific genetic regions of small or large effect, and withspecific functions4,57. The apparent gap between the assumptionsof the infinitesimal model and the results of QTL analyses isfurther exacerbated by the fact that countless studies havedemonstrated that QTLs cannot in themselves explain allheritable variation underlying quantitative traits5, such asgrowth or size in humans58, Arabidopsis59 and yeast60. Thesedifficulties underscore the many challenges that remain inunderstanding the genetic basis of quantitative trait variation3,5.Our findings may help resolve these outstanding challenges in thefield of quantitative genetics because they show that thephenotypic possibilities of a genetic locus may be determinedby both genetic variation and the influence of the environmentthrough quantitative DNA methylation. Therefore, alongsidegenetic variation, the environment can generate a vast array ofquantitative trait variation in natural populations.
MethodsCollection of samples. We collected mated queens from Tallahassee, Florida,USA. Mature colonies originating from single queens were maintained in plasticboxes with glass test tubes filled with water constrained by cotton wool, and werefed a combination of mealworms, crickets, fruit flies and Bhatkar-Whitcomb diet asin Rajakumar et al.16 All colonies were maintained at 27 �C, 70% humidity and 12 hday:night cycle. Larval and adult sampling, genotyping and pharmacologicalexperiments were conducted on a single colony to control for colony andpopulation variation and began after the colony had matured for approximately4 years. In order to conduct SAM (luminometric methylation assay (LUMA)),5-AZA-dC (LUMA) and EGFRi (western blot) validation assays, which aredescribed in more detail below, we pooled samples to be treated from multiplecolonies because the assays required a significant amount of material.
Determination of the number of instars for worker larvae. To describe theepigenetic status of specific developmental stages of larval development, thenumber of larval instars was determined. The colony which larvae were taken fromwas not in the process of producing reproductives (males or queens). This isimportant because larvae of Camponotus species that become reproductive havebeen suggested to have a different number of instars compared with workerlarvae61. To discriminate between instars, widths of the head capsules of larvaewere measured as previously described62. Larvae analysed that were designated asminor ‘m’ or major ‘M’ worker larvae are terminal larvae, meaning that they havereached the end of larval development, which we have determined is at the end ofthe fourth instar. m and M worker larvae share the same head capsule size butdiffer in overall body size. A larvae is classified as terminal if it meets the twofollowing requirements: the gut of the larvae is completely black and the fat cells of
Environmental variation(nutrition, social interactions)
Global DNAhypermethylation
Intermediary genes
Egfr
Egfr methylation level
Othergenes
Othergenes
Freq
uenc
y
Size
Egfr transcription level
Global DNAhypomethylation
Figure 5 | Model for the generation of a continuous distribution of
worker size through quantitative DNA methylation of Egfr. Solid black
lines indicate our results, whereas dashed black lines indicate our
inferences from the literature. Lines with perpendicular tips indicate
repression, whereas lines with arrowheads indicate activation.
Environmental variation may lead to either global DNA hyper- or
hypo-methylation (dashed black lines). Intermediary genes or processes
quantitatively modulate this global DNA methylation state (solid black
lines) into a specific level of Egfr methylation (black lollipops and box with
increasing gradient from left to right, where an increase in black
corresponds to increasing levels of methylation), which results in a specific
level of Egfr transcription level (box with decreasing gradient from left to
right, where a decrease in black corresponds to decrease in Egfr
transcription levels). Other genes may also be involved in generating
quantitative size variation (dashed black lines). The level of Egfr
transcription then translates to quantitative size variation of worker larvae
(solid black lines). Finally, we infer that the continuous size distribution of
final size worker larvae translates into the continuous size distribution of
adult workers (dashed black lines).
ARTICLE NATURE COMMUNICATIONS | DOI: 10.1038/ncomms7513
6 NATURE COMMUNICATIONS | 6:6513 | DOI: 10.1038/ncomms7513 | www.nature.com/naturecommunications
& 2015 Macmillan Publishers Limited. All rights reserved.

the larvae are at peak density and completely engulf the gut63. When the larvaeexhibit those two characters, then they are at their terminal stage. Larvaedesignated m or M that were used specifically for analysis (LUMA, bisulfitesequencing, quantitative-PCR) were the smallest and largest terminal larvae,respectively, in order to ensure their fate. Adults described as m or M is designatedas such based on allometric differences (detailed in ‘Measuring of adult workers’section).
Culturing of pharmacologically treated larvae. To determine the role ofmethylation during worker larval development, early 4th instar (the last instarbased on Fig. 1d) larvae were selected for methylome and EGFR signallingmanipulation. SAM, a methyl donor to DNA methyltransferases38 (B9003S, NewEngland Biolabs), was applied at a concentration of 32 mM (dissolved in 10%ethanol and 0.005 M sulfuric acid). 5-AZA-dC, a cytidine analogue inhibitor ofDNA methylation37 (A3656, Sigma-Aldrich), was applied at a concentration of10 mM (dissolved in water). Last, the highly specific and potent quinazolone EGFRinhibitor, PD153035, which acts through the suppression of epidermal growthfactor-dependent EGFR phosphorylation44 (234491, EMD Millipore), was appliedat a concentration of 10 mM (dissolved in dimethylsulphoxide). Larvae wereisolated and placed laterally on a Petri dish with the aid of a microscope. A volumeof 4 ml of solution was then applied topically allowing for absorption and larvalfeeding. After treatment, larvae were setup in plastic boxes and fed in the samemanner as colonies. For each treatment, 40 larvae were treated and 80 adult minorworkers were supplemented to the box to care for them. Half of the larvae werecollected at the end of larval development for further quantitative gene expressionas well as pyrosequencing, while the other half were left to develop. Timing ofeclosion (the beginning of adulthood) was monitored for the remaining larvae ofeach treatment. Newly emerged adults were subsequently measured to detect anymorphological effects of the drug treatments. To validate effects of SAM and5-AZA-dC on global methylation levels, 50 larvae treated with SAM, 5-AZA-dCand their respective controls were collected for LUMA.
Measuring of adult workers. Workers were measured for several parameters forthe purpose of identifying any shifts in size that might have been caused by themanipulation of larval methylation or EGFR signalling inhibition. In particular, wemeasured scape length, head width, thorax length, thorax width and mandiblelength as in Diniz-Filho (1994). In Camponotus, Diniz-Filho (1994) found thathead width exhibited positive allometry (Fig. 1c), whereas scape length was iso-metric and suggested that for a bivariate analysis of allometry, scape length couldbe used as an independent variable (due to its isometry)64. Isometric measures, likescape length, are highly correlated and proportional to body size64 and thereforeserve as independent and accurate proxies for body size to examine the sizefrequency of individuals of a colony. In a similar manner, head width and scapelength were used in another Camponotus species65 as well as other polymorphic antspecies11. An added advantage for measuring the length of the scape is itssimplicity and therefore it reduces any technical variation in measurementsbetween individuals. Therefore, to determine the relative distribution of sizes(Fig. 1a,b), we used scape length as a proxy for body size. By characterizing theallometry found within the continuous size distribution of workers, we couldclassify minor (m) and major (M) worker adults (Fig. 1a,c).
Microscopy. We used a Zeiss Discovery V12 stereomicroscope and ZeissAxiovision software to measure the larvae (in mm) and adults (in mm). For larvalimaging, we used an Olympus TM3000 tabletop scanning electron microscope.
DNA and RNA extraction. Larvae were collected and pooled (n¼ 20) for eachinstar and immediately frozen at � 80 �C. Since our trait of interest, size, is avariable specific to a large proportion of cells within the animal, we assumed thatheterogeneous tissues across individual larvae would still provide data relevant tosize as a trait. DNA and RNA were both extracted using Allprep DNA/RNAextraction kits (80204, Qiagen) as instructed for animal tissues. Homogenization ofsamples was achieved using RLTþ provided with pestle grinding. Individual larvaeselected at the fourth instar were also processed in a similar manner. A DNAseon-column step was done in all samples during RNA extraction. All samples werequantified using Nanodrop 1000 (Thermo Scientific).
Luminometric methylation assay. LUMA is a high-throughput assay used todetermine global (genome-wide) DNA methylation. The LUMA method used inour study is a modification described by Karimi et al.66 LUMA involves thedigestion of genomic DNA by a methylation-sensitive (HPAII) or -insensitive(MSPI) restriction enzymes in combination with an internal control restrictionenzyme (EcoRI) to normalize the DNA input. EcoRI (FD0274), HpaII (FD0514)and MspI (FD0541) were all purchased from Thermo Scientific. Both HpaII andMspI restriction enzymes recognize and cleave 50-CCGG-30 sequences producing50-CG overhangs, whereas EcoRI recognizes and cleaves 50-GAATTC-30 sequencesand produces 50-AATT overhangs. The extent of cleavage is determined by abioluminetric polymerase extension assay, which measures the filling in of the
sticky ends generated by the enzymatic digestion using a four-step pyrosequencingreaction.
Samples were incubated (37 �C, 4 h) and then heat inactivated (80 �C, 20 min).Digested genomic DNA (15ml) was mixed with pyrosequencing annealing buffer(15 ml; Qiagen). Samples were transferred to 24-well pyrosequencing plates forsequencing (PyroMark 24; Biotage). Peak heights for C and A represent the HpaIIand MspI cuts (methylation) and EcoRI (input DNA), respectively. The formulato calculate an index of genomic methylation is: [MspI (C)/ EcoRI (A)]/[HpaII(C)/ EcoRI (A)]. The higher the ratio between MspI cuts (cleaves all CCGG sites)and HpaII cuts (cleaves only unmethylated CCGG), the higher the methylationlevel. All samples were run in triplicate. This method only measures an absoluteindex of methylation across the entire genome so equal bidirectional differences inDNA methylation are unlikely to register observable differences.
Bisulfite mapping, sequencing and expression analyses. DNA was treated withsodium bisulfite and primers (Supplementary Table 1) were designed for convertedproducts of the 50 region (based on Kamakura, 2011) of C. floridanus Egfr (scaffold550: bp113394-bp113619; located using GBrowse of the Hymenoptera GenomeDatabase67 Bankit ID KP325210). Bisulfite conversion was done with EpitectBisulfite Conversion kit (Qiagen). Bisulfite PCRs were amplified using two roundsof PCR using outer and nested primers (see Supplementary Table 1). Cyclingconditions involved an initial step of 5 min at 95 �C followed by 35 cycles of 95 �Cfor 1 min, Tm for 2.5 min, 72 �C for 1 min and followed by 5 min of 72 �C. PCRproducts were sequenced using the Biotage Pyrosequencer as previouslydescribed68.
For all samples, 500 ng of RNA was subjected to RT–PCR according tomanufacturer’s protocols (Roche) and quantified using quantitative PCR on theLightcycler 480 (Roche). Primers for all genes (Supplementary Table 1) werecreated across exon boundaries. As a housekeeping gene, we used RPS49 fornormalization as it was previously shown to have stable expression both acrosslarval development and following juvenile hormone manipulation in Apismellifera69. Quantitative PCR was amplified with a pre-incubation at 95 �C for10 min followed by 45 cycles of 95 �C for 10 s, 60 �C for 10 s, 72 �C for 10 s followedby 10 min of 72 �C.
In vitro luciferase assay. The 50 region of Egfr corresponding to that described inA. mellifera39 was amplified using the ‘Luciferase construct PCR primers’(Supplementary Table 1) generating a 378-bp fragment of the 50 region of theC. floridanus Egfr gene (scaffold 550: bp113394-bp113772; located using GBrowseof the Hymenoptera Genome Database67). BamHI and HindIII restriction siteswere incorporated into the primers in order to generate restriction sites to clone thefragment into the CpG-less pCpGl (ref. 70) in 50 to 30 (sense) or 30 to 50 (antisense)orientation, respectively. As the vector does not contain CpG sites, all methylatedsites are contained in the Egfr 50 region. The constructs were methylated in vitrowith SssI CpG DNA methyltransferases (M0226L, New England Biolabs) aspreviously described68. Transfections were performed using calcium phosphateprecipitation as described previously into HEK293 cells (CRL-1573, AmericanType Culture Collection). Cells were harvested 48 h after transfection and luciferaseactivity was assayed using the Luciferase Assay System (Promega).
Western blotting analyses. Fifty larvae treated with dimethylsulphoxide or EGFRinhibitor were collected 24 h after treatment and homogenized in RIPA buffer(1� PBS, 1% NP-40, 0.5% sodium deoxycholate, 0.1% SDS and 1� completeprotease inhibitors; Roche Diagnostics). Total protein yield was determined usingBradford assay (Bio-Rad) and a total of 30 mg of protein was loaded onto a 10%SDS–polyacrylamide gel electrophoresis. As adapted from bees39, protein extractswere immunoblotted with anti-EGFR (sc-33746, Santa Cruz Biotech) and anti-phosphotyrosine PY20 antibody (525295, Millipore) at 1:1,000 dilution. EGFR wasthen blotted by a secondary anti-rabbit (sc-2004, Santa Cruz Biotech) and PY20was blotted by anti-mouse at 1:5,000 dilution. For quantification, total EGFR wasdetermined with anti-EGFR followed by stripping at pH 6.8 and re-blotting withanti-phosphotyrosine in triplicates to determine overall tyrosine posphorylation.The intensities of the signals were then quantified using Image J software and totalphosphorylation was measured and presented as the ratio between the intensityof the phosphorylated band corresponding to EGFR divided by intensity of totalEGFR.
EGFR genotyping in adults. Minor (n¼ 9) and major (n¼ 8) representing theextremes of adult development (a and e, see Fig. 1B). Abdomens were removedfrom adults to exclude exogenous DNA from gastrointestinal microbiota. TemplateDNA was used with primers used to amplify the EGFR locus used for luciferasepromoter constructs (see Supplementary Table 1). Cycling conditions involved aninitial step of 5 min at 95 �C followed by 35 cycles of 95 �C for 1 min, 60 �C for2.5 min, 72 �C 1 min, followed by 5 min of 72 �C. PCR products were performed atthe Genome Quebec Innovation Centre (Montreal, Canada) using both forwardand reverse primers.
NATURE COMMUNICATIONS | DOI: 10.1038/ncomms7513 ARTICLE
NATURE COMMUNICATIONS | 6:6513 | DOI: 10.1038/ncomms7513 | www.nature.com/naturecommunications 7
& 2015 Macmillan Publishers Limited. All rights reserved.

Statistical analysis. All data are expressed as mean±s.e.m., except developmentaltime, which is expressed as standard deviation (s.d.) and morphometrics in theform of box-and-whisker plots. Comparisons between groups were performedusing two-tailed, unpaired Student’s t-test, except in the case of unequal variancefor which the Mann–Whitney U-test was performed. Multivariate analysis ofvariance performed considered all morphometric traits, significance was set atPo0.05 and Pillai’s Trace was used. Correlations of percent methylation withterminal larval size were calculated using Pearson correlation and significance wasinitially set at Po0.05 followed by Bonferroni correction for multiple tests,implemented to correct for multiple comparisons. Statistical analysis was under-taken using Prism (GraphPad Software Inc.) except for multivariate analysis ofvariance, which was performed in R.
References1. Falconer, D. S. & Mackay, T. F. C. Introduction to Quantitative Genetics, 4 edn
(Longmans Green, 1996).2. Lynch, M. & Walsh, B. Genetics and Analysis of Quantitative Traits (Sinauer
Associates, 1998).3. Roff, D. A. A centennial celebration for quantitative genetics. Evolution 61,
1017–1032 (2007).4. Flint, J. & Mackay, T. F. C. Genetic architecture of quantitative traits in mice,
flies, and humans. Genome Res. 19, 723–733 (2009).5. Eichler, E. E. et al. Missing heritability and strategies for finding the underlying
causes of complex disease. Nat. Rev. Genet. 11, 446–450 (2010).6. Schmitz, R. J., Sung, S. & Amasino, R. M. Histone arginine methylation is
required for vernalization-induced epigenetic silencing of FLC in winter-annualArabidopsis thaliana. Proc. Natl Acad. Sci. USA 105, 411–416 (2008).
7. Kucharski, R., Maleszka, J., Foret, S. & Maleszka, R. Nutritional control ofreproductive status in honeybees via DNA methylation. Science 319, 1827–1830(2008).
8. Weaver, I. C. et al. Epigenetic programming by maternal behavior. Nat.Neurosci. 7, 847–854 (2004).
9. Jaenisch, R. & Bird, A. Epigenetic regulation of gene expression: how thegenome integrates intrinsic and environmental signals. Nature Genet. 33,245–254 (2003).
10. Herb, B. R. et al. Reversible switching between epigenetic states in honeybeebehavioral subcastes. Nat. Neurosci. 10 (2012).
11. Wilson, E. O. The origin and evolution of polymorphism in ants. Q. Rev. Biol.28, 136–156 (1953).
12. Holldobler, B. & Wilson, E. O. The Ants (Belknap Press of Harvard Univ.,1990).
13. Wilson, E. O. Caste and division of labor in leaf-cutter ants (Hymenoptera,Formicidae, Atta).1. The overall pattern in Atta-Sexdens. Behav. Ecol. Sociobiol.7, 143–156 (1980).
14. Klowden, M. J. Physiological Systems in Insects, 3rd edn (Academic Press, 2013).15. Nijhout, H. F. The control of body size in insects. Dev. Biol. 261, 1–9 (2003).16. Rajakumar, R. et al. Ancestral developmental potential facilitates parallel
evolution in ants. Science 335, 79–82 (2012).17. Wheeler, D. E. & Nijhout, H. F. Soldier determination in Pheidole bicarinata—
inhibition by adult soldiers. J. Insect Physiol. 30, 127–135 (1984).18. Wheeler, W. M. A neglected factor in evolution. Science 15, 766–774 (1902).19. Goetsch, W. Die entstehung der ‘soldaten’ im ameisenstaat.
Naturwissenschaften 25, 803–808 (1937).20. Hughes, W. O., Sumner, S., Van Borm, S. & Boomsma, J. J. Worker caste
polymorphism has a genetic basis in Acromyrmex leaf-cutting ants. Proc. NatlAcad. Sci. USA 100, 9394–9397 (2003).
21. Smith, C. R., Anderson, K. E., Tillberg, C. V., Gadau, J. & Suarez, A. V. Castedetermination in a polymorphic social insect: nutritional, social, and geneticfactors. Am. Nat. 172, 497–507 (2008).
22. Wiernasz, D. C. & Cole, B. J. Patriline shifting leads to apparent genetic castedetermination in harvester ants. Proc. Natl Acad. Sci. USA 107, 12958–12962(2010).
23. Smith, F. Effect of reduced food supply upon the stature of Camponotus ants.Entomol. News 53, 133–135 (1942).
24. Smith, F. Nutritional requirements of Camponotus ants. Ann. Entomol. Soc.Am. 37, 401–408 (1944).
25. Gadau, J., Heinze, J., Holldobler, B. & Schmid, M. Population and colonystructure of the carpenter ant Camponotus floridanus. Mol. Ecol. 5, 785–792(1996).
26. Bonasio, R. et al. Genome-wide and caste-specific DNA methylomes of the antsCamponotus floridanus and Harpegnathos saltator. Curr. Biol. 22, 1755–1764(2012).
27. Bonasio, R. et al. Genomic comparison of the ants Camponotus floridanus andHarpegnathos saltator. Science 329, 1068–1071 (2010).
28. Zemach, A., McDaniel, I. E., Silva, P. & Zilberman, D. Genome-wideevolutionary analysis of eukaryotic DNA methylation. Science 328, 916–919(2010).
29. Feng, S. et al. Conservation and divergence of methylation patterning in plantsand animals. Proc. Natl Acad. Sci. USA 107, 8689–8694 (2010).
30. Razin, A. & Riggs, A. D. DNA methylation and gene function. Science 210,604–610 (1980).
31. Hunt, B. G., Glastad, K. M., Yi, S. V. & Goodisman, M. A. The function ofintragenic DNA methylation: insights from insect epigenomes. Integr. Comp.Biol. 53, 319–328 (2013).
32. Lyko, F. et al. The honey bee epigenomes: differential methylation of brainDNA in queens and workers. PLoS Biol. 8, e1000506 (2010).
33. Foret, S. et al. DNA methylation dynamics, metabolic fluxes, gene splicing, andalternative phenotypes in honey bees. Proc. Natl Acad. Sci. USA 109, 4968–4973(2012).
34. Li-Byarlay, H. et al. RNA interference knockdown of DNA methyl-transferase 3affects gene alternative splicing in the honey bee. Proc. Natl Acad. Sci. USA 110,12750–12755 (2013).
35. Patel, A. et al. The making of a queen: TOR pathway is a key player in dipheniccaste development. PLoS ONE 2, e509 (2007).
36. Nan, X. et al. Transcriptional repression by the methyl-CpG-binding proteinMeCP2 involves a histone deacetylase complex. Nature 393, 386–389 (1998).
37. Juttermann, R., Li, E. & Jaenisch, R. Toxicity of 5-aza-2’-deoxycytidine tomammalian cells is mediated primarily by covalent trapping of DNAmethyltransferase rather than DNA demethylation. Proc. Natl Acad. Sci. USA91, 11797–11801 (1994).
38. Smith, S. S., Kaplan, B. E., Sowers, L. C. & Newman, E. M. Mechanism ofhuman methyl-directed DNA methyltransferase and the fidelity of cytosinemethylation. Proc. Natl Acad. Sci. USA 89, 4744–4748 (1992).
39. Kamakura, M. Royalactin induces queen differentiation in honeybees. Nature473, 478–483 (2011).
40. Mutti, N. S., Wang, Y., Kaftanoglu, O. & Amdam, G. V. Honey beePTEN—description, developmental knockdown, and tissue-specific expressionof splice-variants correlated with alternative social phenotypes. PLoS ONE 6,e22195 (2011).
41. Mutti, N. S. et al. IRS and TOR nutrient-signaling pathways act via juvenilehormone to influence honey bee caste fate. J. Exp. Biol. 214, 3977–3984 (2011).
42. Jorissen, R. N. et al. Epidermal growth factor receptor: mechanisms ofactivation and signalling. Exp. Cell Res. 284, 31–53 (2003).
43. Turner, T. L., Stewart, A. D., Fields, A. T., Rice, W. R. & Tarone, A. M.Population-based resequencing of experimentally evolved populations revealsthe genetic basis of body size variation in Drosophila melanogaster. PLoS Genet.7, e1001336 (2011).
44. Fry, D. W. et al. A specific inhibitor of the epidermal growth factor receptortyrosine kinase. Science 265, 1093–1095 (1994).
45. Lubin, F. D., Roth, T. L. & Sweatt, J. D. Epigenetic regulation of bdnf genetranscription in the consolidation of fear memory. J. Neurosci. 28, 10576–10586(2008).
46. Broday, L., Lee, Y. W. & Costa, M. 5-Azacytidine induces transgene silencing byDNA methylation in Chinese hamster cells. Mol. Cell Biol. 19, 3198–3204(1999).
47. Wheeler, D. E. & Nijhout, H. F. Soldier determination in ants: new role forjuvenile hormone. Science 213, 361–363 (1981).
48. Simola, D. F. et al. A chromatin link to caste identity in the carpenter antCamponotus floridanus. Genome Res. 23, 486–496 (2013).
49. Samudio-Ruiz, S. L. & Hudson, L. G. Increased DNA methyltransferase activityand DNA methylation following epidermal growth factor stimulation inovarian cancer cells. Epigenetics 7, 216–224 (2012).
50. Bonduriansky, R., Crean, A. J. & Day, T. The implications of nongeneticinheritance for evolution in changing environments. Evol. Appl. 5, 192–201(2012).
51. Johannes, F. et al. Assessing the impact of transgenerational epigeneticvariation on complex traits. PLoS Genet. 5, e1000530 (2009).
52. Danchin, E. et al. Beyond DNA: integrating inclusive inheritance into anextended theory of evolution. Nat. Rev. Genet. 12, 475–486 (2011).
53. Waterland, R. A. & Jirtle, R. L. Transposable elements: targets for earlynutritional effects on epigenetic gene regulation. Mol. Cell Biol. 23, 5293–5300(2003).
54. Toperoff, G. et al. Genome-wide survey reveals predisposing diabetes type2-related DNA methylation variations in human peripheral blood. Hum. Mol.Genet. 21, 371–383 (2012).
55. Provine, W. B. The Origins of Theoretical Population Genetics, 2nd edn (Univ.Chicago, 2001).
56. Rockman, M. V. The Qtn program and the alleles that matter for evolution: allthat’s gold does not glitter. Evolution 66, 1–17 (2012).
57. Farrall, M. Quantitative genetic variation: a post-modern view. Hum. Mol.Genet. 13, R1–R7 (2004).
58. Yang, J. et al. Common SNPs explain a large proportion of the heritability forhuman height. Nat. Genet. 42, 565–569 (2010).
59. Kroymann, J. & Mitchell-Olds, T. Epistasis and balanced polymorphisminfluencing complex trait variation. Nature 435, 95–98 (2005).
ARTICLE NATURE COMMUNICATIONS | DOI: 10.1038/ncomms7513
8 NATURE COMMUNICATIONS | 6:6513 | DOI: 10.1038/ncomms7513 | www.nature.com/naturecommunications
& 2015 Macmillan Publishers Limited. All rights reserved.
60. Steinmetz, L. M. et al. Dissecting the architecture of a quantitative trait locus inyeast. Nature 416, 326–330 (2002).
61. Dartigues, D. & Passera, L. Larval polymorphism and the apparition of femalecastes in Camponotus-Aethiops Latreille (Hymenoptera, Formicidae). BulletinDe La Societe Zoologique De France 104, 197–207 (1979).
62. Solis, D. R. et al. Morphological description of the immatures of the ant,Monomorium floricola. J. Insect Sci. 10, 15 (2010).
63. Wheeler, G. C. & Wheeler, J. Ant larvae: review and synthesis. Entomol. Soc.Washington 7, 1–108 (1976).
64. Diniz-Filho, J. A. F., Vonzuben, C. J., Fowler, H. G., Schlindwein, M. N. &Bueno, O. C. Multivariate morphometrics and allometry in a polymorphic ant.Insectes Soc. 41, 153–163 (1994).
65. Fraser, V. S., Kaufmann, B., Oldroyd, B. P. & Crozier, R. H. Genetic influenceon caste in the ant Camponotus consobrinus. Behav. Ecol. Sociobiol. 47,188–194 (2000).
66. Karimi, M. et al. LUMA (LUminometric Methylation Assay)--a highthroughput method to the analysis of genomic DNA methylation. Exp. Cell Res.312, 1989–1995 (2006).
67. Munoz-Torres, M. C. et al. Hymenoptera Genome Database: integratedcommunity resources for insect species of the order Hymenoptera. NucleicAcids Res. 39, D658–D662 (2011).
68. Alvarado, S., Wyglinski, J., Suderman, M., Andrews, S. A. & Szyf, M.Methylated DNA binding domain protein 2 (MBD2) coordinately silences geneexpression through activation of the microRNA hsa-mir-496 promoter inbreast cancer cell line. PLoS ONE 8, e74009 (2013).
69. Lourenco, A. P., Mackert, A., dos Santos Cristino, A. & Simoes, Z. L. P.Validation of reference genes for gene expression studies in the honey bee, Apismellifera, by quantitative real-time RT-PCR. Adipologie 39, 372–385 (2008).
70. Klug, M. & Rehli, M. Functional analysis of promoter CpG methylation using aCpG-free luciferase reporter vector. Epigenetics 1, 127–130 (2006).
AcknowledgementsWe thank M. Tajerian for inspiring this collaboration. We also thank D. Roff, R. Barrett,Y. Idaghdour, E. Despland and Abouheif Lab members for comments on the manuscript.Finally, we thank W. Tschinkel, J. King and L. Davis for help with collection andidentification and S. Silvestrin, E. Lo, B. Fung, T. Chen, Y. Chen and J. Fan for help withcolonies. Thanks to Dominic Ouellette and Melanie Couture for taking photos forpanel 1B. This work was supported by the Sackler McGill programme in psychobiologyand epigenetics to M.S. a grant from the Canadian Institute of Health Research to M.S.(MOP-42411) and Canada Research Chairs programme and NSERC Discovery grants to E.A.
Author contributionsS.A. and R.R contributed equally to this work. S.A., R.R., E.A. and M.S. conceived anddesigned the experiments. S.A. and R.R. performed the experiments. S.A., R.R., E.A. andM.S. analysed the data. S.A., R.R., E.A., and M.S. wrote the paper.
Additional informationAccession codes. The Egfr promoter sequence generated in this study has been depositedin NCBI nucleotide database under accession code KP325210.
Supplementary Information accompanies this paper at http://www.nature.com/naturecommunications
Competing financial interests: The authors declare no competing financial interests.
Reprints and permission information is available online at http://npg.nature.com/reprintsandpermissions/
How to cite this article: Alvarado, S. et al. Epigenetic variation in the Egfr genegenerates quantitative variation in a complex trait in ants. Nat. Commun. 6:6513doi: 10.1038/ncomms7513 (2015).
NATURE COMMUNICATIONS | DOI: 10.1038/ncomms7513 ARTICLE
NATURE COMMUNICATIONS | 6:6513 | DOI: 10.1038/ncomms7513 | www.nature.com/naturecommunications 9
& 2015 Macmillan Publishers Limited. All rights reserved.

Supplementary Figure 1: Quantitative gene expression of additional DNA methylation and histone modification regulators. Expression of (A) Mbd, (B) Mecp2, (C) Tet2 (D) Hdac1, (E) Hdac3, (F) Hat, (G) Lsd1 in early 4th instar larvae (white bar), late 4th instar minor worker larvae (grey bar) and late 4th instar major worker larvae (black bar). Bars indicate mean, while error bars indicate ± s.e.m. Statistical significance values for Student’s t-test are as follows: *= p<0.05, **=p<0.01, ***=p<0.001, ****=p<0.0001. Sample sizes for each larval category is n ≥ 30 individual larvae.

Supplementary Figure 2: Additional morphometric measurements of 5-AZA-dC, SAM, and EGFRi treatments. (A) Mandible length (B) Thorax length and (C) Thorax width of 5-AZA-dC treated animals (black box)(n=17) and controls (white box; H2O)(n=16). (D) Mandible length, (E) Thorax length and (F) Thorax width in SAM treated animals (black box)(n=18) and controls (white box; H2SO4)(n=14). (G) Mandible length, (H) Thorax length and (I) Thorax width in EGFR inhibited animals (black box)(n=17) and controls (white box; DMSO)(n=18). Boxplot whiskers indicate min and max. Box defined by 25th percentile, mode, and 75th percentile. Statistical significance values for Student’s t-test are as follows: *= p<0.05, ***=p<0.001, ****=p<0.0001. All measurement data are normally distributed (tested with Shapiro-Wilk’s test). To consider all 5 measurements together, we used a MANOVA analysis to statistically test for differences of treatments with controls across the animal (including scape length and head width of Fig.2 and Fig. 3). MANOVA statistics are as follows: SAM (pillai trace=0.76571, F= 17.649, p=3.045e-09); 5-AZA-dC (pillai trace=0.81913, F= 24.456, p=3.045e-09); EGFRi (pillai trace= 0.85263, F= 33.556, p=3.293e-11).

Supplementary Figure 3: Validation of drug treatments for 5-AZA-dC, SAM and EGFRi treatments. (A) Genomic methylation of 5-AZA-dC treated early 4th instar larvae represented as an index of [MspI/HpaII] restriction enzyme cutting quantified by LUMA (n=50). (B) Genomic methylation of SAM treated early 4th instar larvae represented as an index of [MspI/HpaII] restriction enzyme cutting quantified by LUMA(n=50). (C) Dephosphorylation of EGFR following 24 hours inhibition of early 4th instar larvae (n=50), quantified from Western blot. (D) Qualitative Western blot analysis of DMSO and EGFRi treated animals. Bars indicate mean, while error bars indicate ± s.e.m. Statistical significance values for Student’s t-test are as follows: *= p<0.05.

Supplementary Figure 4: Quantitative gene expression of key regulators of growth. (A) JHAMT2, (B) JHE2, (C) Tor, (D) Pten, (E) chico, (F) Egfr in early 4th instar larvae (white bar), late 4th instar minor worker larvae (grey bar) and late 4th instar major worker larvae (black bar). Bars indicate mean, while error bars indicate ± s.e.m. Statistical significance values for Student’s t-test are as follows: *= p<0.05, **=p<0.01, ***=p<0.001, ****=p<0.0001. Sample sizes for each larval category is pooled from n ≥ 30 individual larvae.
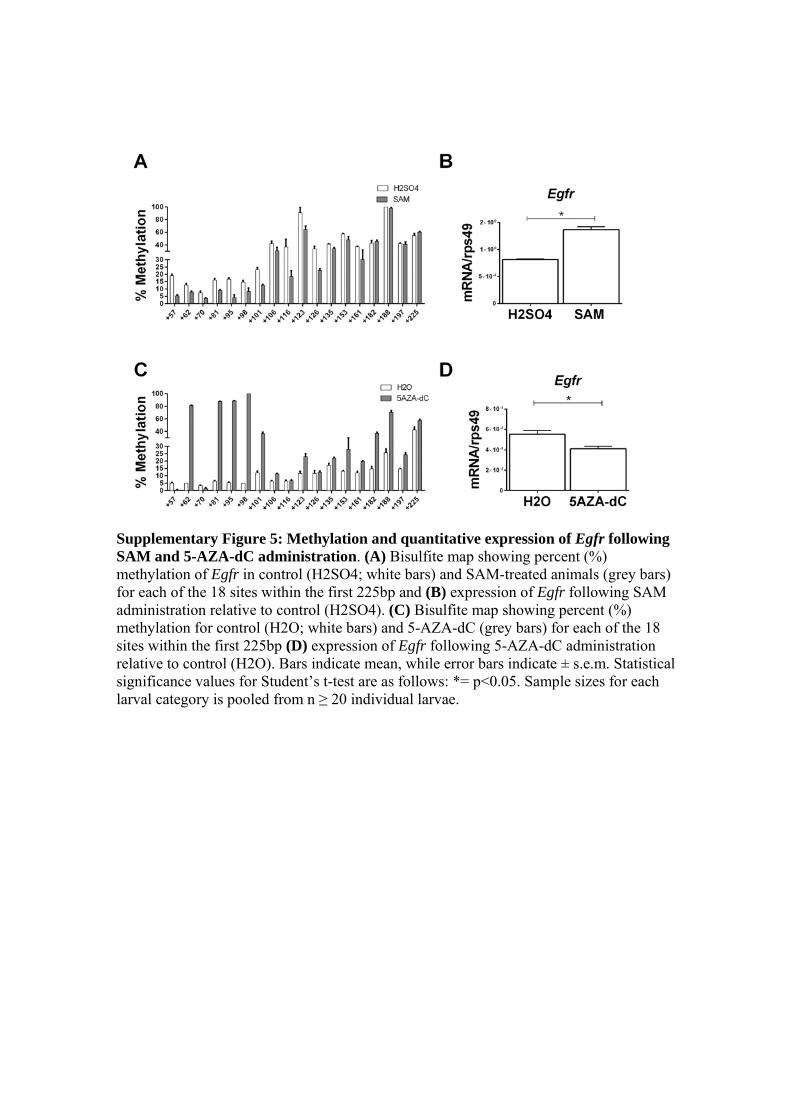
Supplementary Figure 5: Methylation and quantitative expression of Egfr following SAM and 5-AZA-dC administration. (A) Bisulfite map showing percent (%) methylation of Egfr in control (H2SO4; white bars) and SAM-treated animals (grey bars) for each of the 18 sites within the first 225bp and (B) expression of Egfr following SAM administration relative to control (H2SO4). (C) Bisulfite map showing percent (%) methylation for control (H2O; white bars) and 5-AZA-dC (grey bars) for each of the 18 sites within the first 225bp (D) expression of Egfr following 5-AZA-dC administration relative to control (H2O). Bars indicate mean, while error bars indicate ± s.e.m. Statistical significance values for Student’s t-test are as follows: *= p<0.05. Sample sizes for each larval category is pooled from n ≥ 20 individual larvae.

Supplementary Figure 6: Developmental time is affected by global (genome-wide) DNA methylation and EGFR signaling. Days till eclosion (time from treatment of early 4th instar larvae till the beginning of adulthood) for worker larvae after (A) SAM administration (hatched bar)(n=14) relative to control (H2SO4; white bar)(n=18), (B) 5-AZA-dC administration (hatched bar)(n=16) relative to control (H2O; white bar)(n=17), and (C) EGFR inhibition (hatched bar)(n=17) relative to control (DMSO; white bar)(n=18). Frequency of eclosion timing was not always normally distributed (tested with Shapiro-Wilk’s test). Therefore the Mann-Whitney U test was used to compare controls with respective pharmacological manipulation. Bars indicate mean and error bars indicate standard deviation. Statistical significance values for Student’s t-test are as follows: ****=p<0.0001.

Supplementary Figure. 7: Association of percent (%) methylation of Egfr CpG sites and final size of workers. Map of CpG dinucleotides at top (methylated sites indicated by black lollipops). Regression of percent (%) methylation (y-axis) versus terminal larval length in μm (x-axis) for all 18 CpG dinucleotides occurring in the first 225bp of Egfr (n=50). Regressions of CpG sites +101, +153, +182 and +197 with larval size were significant (Table S2). Following Bonferroni correction for multiple comparisons, sites +101 and +182 remain significant (solid blue box and arrows), while site +153 and +197 became marginally insignificant (dashed box and arrow). Refer to Table S2 for all statistical information.

minor_1 TCTGCCATATCAAGACGATCAATTGGGAGGAAATAATTACCGGTCCGGGAGGCCGGTACT 60 minor_2 TCTGCCATATCAAGACGATCAATTGGGAGGAAATAATTACCGGTCCGGGAGGCCGGTACT 60 minor_3 TCTGCCATATCAAGACGATCAATTGGGAGGAAATAATTACCGGTCCGGGAGGCCGGTACT 60 minor_4 TCTGCCATATCAAGACGATCAATTGGGAGGAAATAATTACCGGTCCGGGAGGCCGGTACT 60 minor_5 TCTGCCATATCAAGACGATCAATTGGGAGGAAATAATTACCGGTCCGGGAGGCCGGTACT 60 minor_6 TCTGCCATATCAAGACGATCAATTGGGAGGAAATAATTACCGGTCCGGGAGGCCGGTACT 60 minor_7 TCTGCCATATCAAGACGATCAATTGGGAGGAAATAATTACCGGTCCGGGAGGCCGGTACT 60 minor_8 TCTGCCATATCAAGACGATCAATTGGGAGGAAATAATTACCGGTCCGGGAGGCCGGTACT 60 minor_9 TCTGCCATATCAAGACGATCAATTGGGAGGAAATAATTACCGGTCCGGGAGGCCGGTACT 60 major_10 TCTGCCATATCAAGACGATCAATTGGGAGGAAATAATTACCGGTCCGGGAGGCCGGTACT 60 major_11 TCTGCCATATCAAGACGATCAATTGGGAGGAAATAATTACCGGTCCGGGAGGCCGGTACT 60 major_12 TCTGCCATATCAAGACGATCAATTGGGAGGAAATAATTACCGGTCCGGGAGGCCGGTACT 60 major_13 TCTGCCATATCAAGACGATCAATTGGGAGGAAATAATTACCGGTCCGGGAGGCCGGTACT 60 major_14 TCTGCCATATCAAGACGATCAATTGGGAGGAAATAATTACCGGTCCGGGAGGCCGGTACT 60 major_15 TCTGCCATATCAAGACGATCAATTGGGAGGAAATAATTACCGGTCCGGGAGGCCGGTACT 60 major_16 TCTGCCATATCAAGACGATCAATTGGGAGGAAATAATTACCGGTCCGGGAGGCCGGTACT 60 major_17 TCTGCCATATCAAGACGATCAATTGGGAGGAAATAATTACCGGTCCGGGAGGCCGGTACT 60 ************************************************************ 101 minor_1 TTTACGTGTACAATTTTACGTCGCCGGAACGCAATTGTCCGGAATGCGACGAGAGCTGCG 120 minor_2 TTTACGTGTACAATTTTACGTCGCCGGAACGCAATTGTCCGGAATGCGACGAGAGCTGCG 120 minor_3 TTTACGTGTACAATTTTACGTCGCCGGAACGCAATTGTCCGGAATGCGACGAGAGCTGCG 120 minor_4 TTTACGTGTACAATTTTACGTCGCCGGAACGCAATTGTCCGGAATGCGACGAGAGCTGCG 120 minor_5 TTTACGTGTACAATTTTACGTCGCCGGAACGCAATTGTCCGGAATGCGACGAGAGCTGCG 120 minor_6 TTTACGTGTACAATTTTACGTCGCCGGAACGCAATTGTCCGGAATGCGACGAGAGCTGCG 120 minor_7 TTTACGTGTACAATTTTACGTCGCCGGAACGCAATTGTCCGGAATGCGACGAGAGCTGCG 120 minor_8 TTTACGTGTACAATTTTACGTCGCCGGAACGCAATTGTCCGGAATGCGACGAGAGCTGCG 120 minor_9 TTTACGTGTACAATTTTACGTCGCCGGAACGCAATTGTCCGGAATGCGACGAGAGCTGCG 120 major_10 TTTACGTGTACAATTTTACGTCGCCGGAACGCAATTGTCCGGAATGCGACGAGAGCTGCG 120 major_11 TTTACGTGTACAATTTTACGTCGCCGGAACGCAATTGTCCGGAATGCGACGAGAGCTGCG 120 major_12 TTTACGTGTACAATTTTACGTCGCCGGAACGCAATTGTCCGGAATGCGACGAGAGCTGCG 120 major_13 TTTACGTGTACAATTTTACGTCGCCGGAACGCAATTGTCCGGAATGCGACGAGAGCTGCG 120 major_14 TTTACGTGTACAATTTTACGTCGCCGGAACGCAATTGTCCGGAATGCGACGAGAGCTGCG 120 major_15 TTTACGTGTACAATTTTACGTCGCCGGAACGCAATTGTCCGGAATGCGACGAGAGCTGCG 120 major_16 TTTACGTGTACAATTTTACGTCGCCGGAACGCAATTGTCCGGAATGCGACGAGAGCTGCG 120 major_17 TTTACGTGTACAATTTTACGTCGCCGGAACGCAATTGTCCGGAATGCGACGAGAGCTGCG 120 ************************************************************ 153 182 minor_1 AACAGGGTTGCTGGGGCGAGGGTCCGGAGAACTGTCAAAAGTACTCGAAGACGAACTGCT 180 minor_2 AACAGGGTTGCTGGGGCGAGGGTCCGGAGAACTGTCAAAAGTACTCGAAGACGAACTGCT 180 minor_3 AACAGGGTTGCTGGGGCGAGGGTCCGGAGAACTGTCAAAAGTACTCGAAGACGAACTGCT 180 minor_4 AACAGGGTTGCTGGGGCGAGGGTCCGGAGAACTGTCAAAAGTACTCGAAGACGAACTGCT 180 minor_5 AACAGGGTTGCTGGGGCGAGGGTCCGGAGAACTGTCAAAAGTACTCGAAGACGAACTGCT 180 minor_6 AACAGGGTTGCTGGGGCGAGGGTCCGGAGAACTGTCAAAAGTACTCGAAGACGAACTGCT 180 minor_7 AACAGGGTTGCTGGGGCGAGGGTCCGGAGAACTGTCAAAAGTACTCGAAGACGAACTGCT 180 minor_8 AACAGGGTTGCTGGGGCGAGGGTCCGGAGAACTGTCAAAAGTACTCGAAGACGAACTGCT 180 minor_9 AACAGGGTTGCTGGGGCGAGGGTCCGGAGAACTGTCAAAAGTACTCGAAGACGAACTGCT 180 major_10 AACAGGGTTGCTGGGGCGAGGGTCCGGAGAACTGTCAAAAGTACTCGAAGACGAACTGCT 180 major_11 AACAGGGTTGCTGGGGCGAGGGTCCGGAGAACTGTCAAAAGTACTCGAAGACGAACTGCT 180 major_12 AACAGGGTTGCTGGGGCGAGGGTCCGGAGAACTGTCAAAAGTACTCGAAGACGAACTGCT 180 major_13 AACAGGGTTGCTGGGGCGAGGGTCCGGAGAACTGTCAAAAGTACTCGAAGACGAACTGCT 180 major_14 AACAGGGTTGCTGGGGCGAGGGTCCGGAGAACTGTCAAAAGTACTCGAAGACGAACTGCT 180 major_15 AACAGGGTTGCTGGGGCGAGGGTCCGGAGAACTGTCAAAAGTACTCGAAGACGAACTGCT 180 major_16 AACAGGGTTGCTGGGGCGAGGGTCCGGAGAACTGTCAAAAGTACTCGAAGACGAACTGCT 180 major_17 AACAGGGTTGCTGGGGCGAGGGTCCGGAGAACTGTCAAAAGTACTCGAAGACGAACTGCT 180 ************************************************************ 197 minor_1 CGCCTCAGTGCTGGCAGGGCAGGTGTTTCGGTCCTAATCCACGCGAGTGTTGCCATCTTT 240 minor_2 CGCCTCAGTGCTGGCAGGGCAGGTGTTTCGGTCCTAATCCACGCGAGTGTTGCCATCTTT 240 minor_3 CGCCTCAGTGCTGGCAGGGCAGGTGTTTCGGTCCTAATCCACGCGAGTGTTGCCATCTTT 240 minor_4 CGCCTCAGTGCTGGCAGGGCAGGTGTTTCGGTCCTAATCCACGCGAGTGTTGCCATCTTT 240 minor_5 CGCCTCAGTGCTGGCAGGGCAGGTGTTTCGGTCCTAATCCACGCGAGTGTTGCCATCTTT 240 minor_6 CGCCTCAGTGCTGGCAGGGCAGGTGTTTCGGTCCTAATCCACGCGAGTGTTGCCATCTTT 240 minor_7 CGCCTCAGTGCTGGCAGGGCAGGTGTTTCGGTCCTAATCCACGCGAGTGTTGCCATCTTT 240 minor_8 CGCCTCAGTGCTGGCAGGGCAGGTGTTTCGGTCCTAATCCACGCGAGTGTTGCCATCTTT 240 minor_9 CGCCTCAGTGCTGGCAGGGCAGGTGTTTCGGTCCTAATCCACGCGAGTGTTGCCATCTTT 240 major_10 CGCCTCAGTGCTGGCAGGGCAGGTGTTTCGGTCCTAATCCACGCGAGTGTTGCCATCTTT 240 major_11 CGCCTCAGTGCTGGCAGGGCAGGTGTTTCGGTCCTAATCCACGCGAGTGTTGCCATCTTT 240 major_12 CGCCTCAGTGCTGGCAGGGCAGGTGTTTCGGTCCTAATCCACGCGAGTGTTGCCATCTTT 240 major_13 CGCCTCAGTGCTGGCAGGGCAGGTGTTTCGGTCCTAATCCACGCGAGTGTTGCCATCTTT 240 major_14 CGCCTCAGTGCTGGCAGGGCAGGTGTTTCGGTCCTAATCCACGCGAGTGTTGCCATCTTT 240 major_15 CGCCTCAGTGCTGGCAGGGCAGGTGTTTCGGTCCTAATCCACGCGAGTGTTGCCATCTTT 240 major_16 CGCCTCAGTGCTGGCAGGGCAGGTGTTTCGGTCCTAATCCACGCGAGTGTTGCCATCTTT 240 major_17 CGCCTCAGTGCTGGCAGGGCAGGTGTTTCGGTCCTAATCCACGCGAGTGTTGCCATCTTT 240 ************************************************************
Supplementary Figure 8: There is no allelic bias between minor and major workers. Sequence alignment of the EGFR locus studied in minor (n=9) vs major (n=8) workers. Minor and majors were selected from the extremes of sizing phenotypes (a and e)

described in Fig. 1A. Alignment was performed using ClustalW2 multiple sequence alignment. All CpGs are bolded with those assayed for methylation in blue. CpGs correlated with size are highlighted in yellow and numbered to correspond with the physical map of EGFR locus studied.

Supplementary Table 1: Primers used for all experiments Bisulfite primers r1bisEGFRfor TTTTAGTGTTGGTAGGGTAGGTGTTr1bisEGFRrev AAAAATTCTTACAAACAAAACAATCr1s1EGFR GGTAGGGTAGGTGTTTr2bisEGFRfor TGGGTATGTATAATAATTATAATTTTTGTTr2bisEGFRrev ACACCTACCCTACCAACACTAAAACr2s1EGFR AATTGGGAGGAAATAATTAqPCRChico‐1for AGTCACGGGTGCGACTGTChico‐1rev CTGAGTCCGACGAGCACATChico‐2for CCTCTGGGTGCGACTGTGChico‐2rev CTGAGTCCGACGAGCACATChico‐3for AGATCCGTTTTACGGTGTGCChico‐3rev TGTCCCTCGTTGTTGGTACAJHAMT1for CTAAAACGAGTCTCACAGATTCCJHAMT1rev CTTTTGGGCCTCTTTGGTTTDNMT1for CTGTGTGCCTTTGACACTGGDNMT1rev TGGCCCCATATCTTTTGTTGDNMT3afor GACTGCTGCTTGAAGGAACCDNMT3arev TTTGAATGTAGTCGCGCATCMBDfor GGAATGGATCTGCCAAAGAAMBDrev CCGTTTTCGATCCTGTTTGTTET1for AGATAGTTTGCCCGATGGTGTET1rev TTTCGAGAGCTGTCATTCCAMAPKfor ACGAGGTTTAAGCATGAAAATATAAMAPKrev AACAATATATACGTCTTTCATTTGCTCWDR5for TGGGAATTAAGTTCGGGTAAAWDR5rev TGAGATTGGATTGTGGATTAAAATORfor TGCATTAAAGGTAGCAACGGTATORrev TATCCGGATCTCCCAACAAGPTENfor GGTCAAGCATGTCTGCGTTAPTENrev TTCCGAACCTCGTAAACACCJHE1for TTTATCCCGTAGCCGATTTGJHE1rev GCAATCTCCACCTGCTTCTCJHE2for GCTGAATTCATCGCTGACAAJHE2rev GAAAATGCGGACCAAGAAGAJHAMT2for TCCAAATGCAGTAATAATGGGTAJHAMT2rev TTCGAATTTGAGCTGTTTCTCAEGFRfor GCACGTACCAGAGGGATGTTEGFRrev AAGCCGTATCCTGTGCACTTLSD1for TCGCCACATTTCGTAAATCALSD1rev TCTTTTGGAACCGTTTGACC

HATfor CACAAGGCGATTTGAGGTCTHATrev AAAACCAATCGTCGCGTATCHDAC3for GAGTAAAGTCTGGCGCGAAGHDAC3rev ATCGACTTGGCTGCTTCAGTHDAC1for AATTCCTGAGGATGGTGCTGHDAC1rev TCCTGACCTTTTTCCAAACGMECP2for TCATGCATCTCGCTCAAAACMECP2rev AACGGCACCATCCGTAGTAGLuciferaseconstructprimers pcpglEGFRforS ggatccTATACCTCTGCCATATCAAGACGApcpglEGFRrevS AAGCTTTATAGCAAAAAGACAGAAGAATCGTGpcpglEGFRforAS AAGCTTTATACCTCTGCCATATCAAGACGApcpglEGFRrevAS ggatccTATAGCAAAAAGACAGAAGAATCGTG

Supplementary Table 2: Parameter estimates and Bonferroni‐corrected statistical conclusions for regression analyses between percent methylation of 18 CpG sites within first 225bp of Egfr and final larval size (see Supplemental figure 5)
CpG R‐squared p‐value
Bonferroni‐corrected statistical conclusions (experiment‐wide α value = 0.00278
+57 0.04525 0.1381 n.s.
+62 0.06923 0.0649 n.s.
+70 0.0001212 0.9395 n.s.
+81 0.05805 0.0919 n.s.
+95 0.0000637 0.9561 n.s.
+98 0.04392 0.1441 n.s.
+101 0.6599 <0.0001 significant
+106 0.01769 0.3572 n.s.
+116 0.002905 0.7107 n.s.
+123 0.0002577 0.9119 n.s.
+126 0.005211 0.6184 n.s.
+135 0.00005444 0.9603 n.s.
+153 0.1701 0.0074 n.s.
+161 0.003666 0.7069 n.s.
+182 0.243 0.0019 significant
+188 0.0002717 0.9229 n.s.
+197 0.1101 0.0449 n.s.
+225 0.001243 0.8359 n.s.