epipolar resampling of stereo image base on … resampling of stereo image base on airbase in the...
TRANSCRIPT

See discussions, stats, and author profiles for this publication at: https://www.researchgate.net/publication/242571335
Epipolar Resampling of Stereo Image Base on Airbase in the Digital
Article
CITATIONS
0
READS
66
1 author:
Tran Trung Anh
Hanoi University of Mining and Geology
1 PUBLICATION 0 CITATIONS
SEE PROFILE
All content following this page was uploaded by Tran Trung Anh on 26 June 2015.
The user has requested enhancement of the downloaded file.
Epipolar Resampling of Stereo Image Base on Airbase in the Digital
Photogrammetry
TRAN Trung Anh, Vietnam
KEYWORDS: epipolar re-sampling, stereo image, digital photogrammetry, automatic matching. SUMMARY The paper refers to the epipolar resampling method of stereo images. This method is based on the airbase and the exterior orientation parameters (EOP) of the left and the right original stereo images. The epipolar resampling and the correction of lens-distortion images are carried out simultaneously. The perspective centers of the normalized images will be the same as those of the original images. The nomalized images have the common rotation angles and the epipolar line in the left and the right images have same y coordinate whereas y paralax has been eliminated. The nomalized images assist the stereo display process as well as makes its easier and quicker in automatic matching in the digital photogrammetry.
TS 5D – Monitoring Using Vision Technologies Tran Trung Anh Epipolar resampling of stereo image base on airbase in the digital photogrammetry 7th FIG Regional Conference Spatial Data Serving People: Land Governance and the Environment – Building the Capacity Hanoi, Vietnam, 19-22 October 2009
1/13
Epipolar Resampling of Stereo Image Base on Airbase in the Digital
Photogrammetry
TRAN Trung Anh, Vietnam
1. INTRODUCTION Image resampling according to epipolar geometry is a prerequisite for a variety of photogrammetric tasks such as image matching, Digital Elevation Model (DEM) and ortho-photo generation, aerial triangulation, map compilation, and stereoscopic viewing. The resampling process of imagery captured by frame camera has been established and implemented in current Digital Photogrammetric Workstations (DPW). The main objective of epipolar resampling is to generate normalized images, which have the innate property that corresponding points lie on the same rows (removing lens distortions). The normalized images of stereo pair also have the clearly exterior orientation parameters. The algorithm has three basic calculations: Epipolar resampling of frame images, correction of lens distortion and resampling methods. In this paper, Section 2 contains background information about: Epipolar resampling of stereo image pair (standardize epipolar line base on airbase), lens distortion and resampling methods, which presented equations very clearly. Section 3 is dedicated to the analysis of the epipolar resampling in the technical process. Experimental results using image pair of Cocsau open mine are presented in Section 4. Finally Section 5 includes the conclusions. 2. BACKGROUND 2.1. Epipolar resampling of stereo image pair It is important to list some terms with their definitions before going into any detailed discussion (Cho et al., 1992). These terms will be used throughout the analysis of the epipolar geometry of frame images. Figure 1 shows two frame images, relatively oriented similar to that at the time of exposure. S1 and S2 are the perspective centres of the left and right images at the time of exposure, respectively. And it also shows two nomalized images, which have the common rotation angles and the epipolar line in the left and the right images have same y coordinate whereas y paralax has been eliminated. As discussed earlier, resampling frame images requires that the new images need to be parallel to the air base. In this case, the epipolar lines in both images will be parallel. As seen in Figure 1, a new plane, parallel to the air base and containing the normalized images, can be used. It must be noted that there is no unique plane that will result in parallel epipolar lines.
TS 5D – Monitoring Using Vision Technologies Tran Trung Anh Epipolar resampling of stereo image base on airbase in the digital photogrammetry 7th FIG Regional Conference Spatial Data Serving People: Land Governance and the Environment – Building the Capacity Hanoi, Vietnam, 19-22 October 2009
2/13
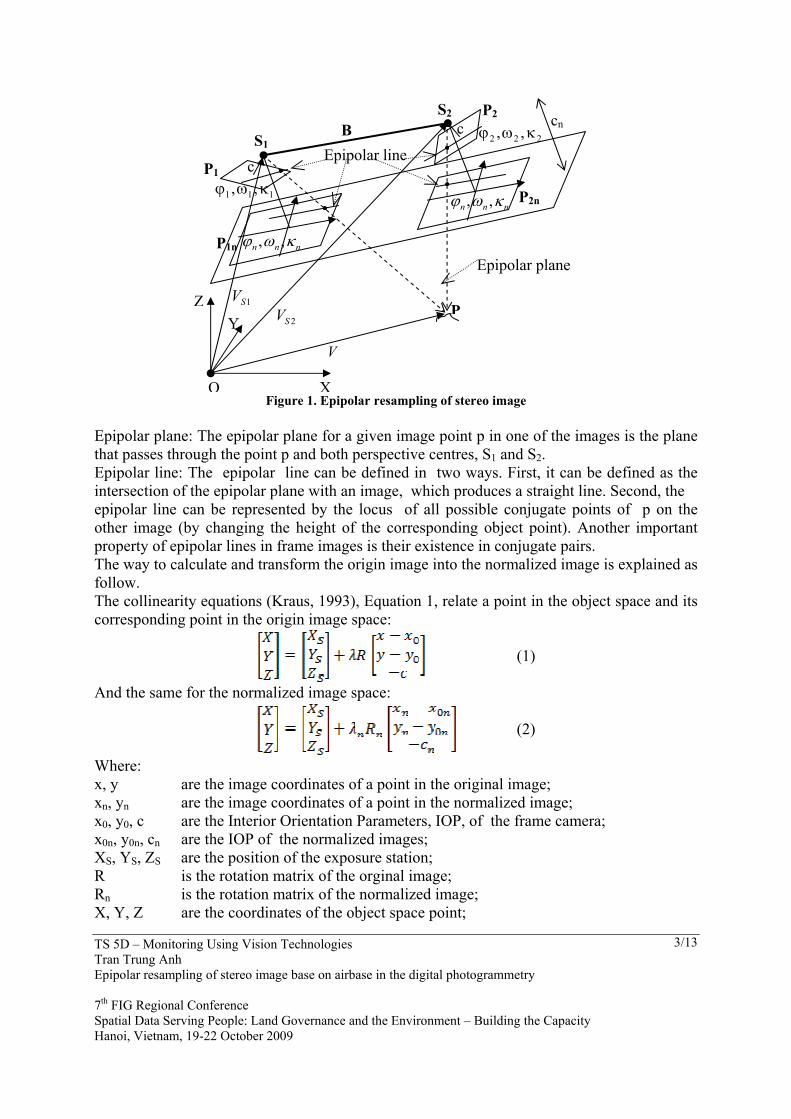
Figure 1. Epipolar resampling of stereo image
Epipolar plane
Y Z
V
2SV 1SV
nnn κωϕ ,,
S1
S2
B cn
222 ,, κωϕc
P
P1
P2
P1n
P2n
Epipolar line
nnn κωϕ ,,
c 111 ,, κωϕ
O X
Epipolar plane: The epipolar plane for a given image point p in one of the images is the plane that passes through the point p and both perspective centres, S1 and S2. Epipolar line: The epipolar line can be defined in two ways. First, it can be defined as the intersection of the epipolar plane with an image, which produces a straight line. Second, the epipolar line can be represented by the locus of all possible conjugate points of p on the other image (by changing the height of the corresponding object point). Another important property of epipolar lines in frame images is their existence in conjugate pairs. The way to calculate and transform the origin image into the normalized image is explained as follow. The collinearity equations (Kraus, 1993), Equation 1, relate a point in the object space and its corresponding point in the origin image space:
(1)
And the same for the normalized image space:
(2)
Where: x, y are the image coordinates of a point in the original image; xn, yn are the image coordinates of a point in the normalized image; x0, y0, c are the Interior Orientation Parameters, IOP, of the frame camera; x0n, y0n, cn are the IOP of the normalized images; XS, YS, ZS are the position of the exposure station; R is the rotation matrix of the orginal image; Rn is the rotation matrix of the normalized image; X, Y, Z are the coordinates of the object space point;
TS 5D – Monitoring Using Vision Technologies Tran Trung Anh Epipolar resampling of stereo image base on airbase in the digital photogrammetry 7th FIG Regional Conference Spatial Data Serving People: Land Governance and the Environment – Building the Capacity Hanoi, Vietnam, 19-22 October 2009
3/13
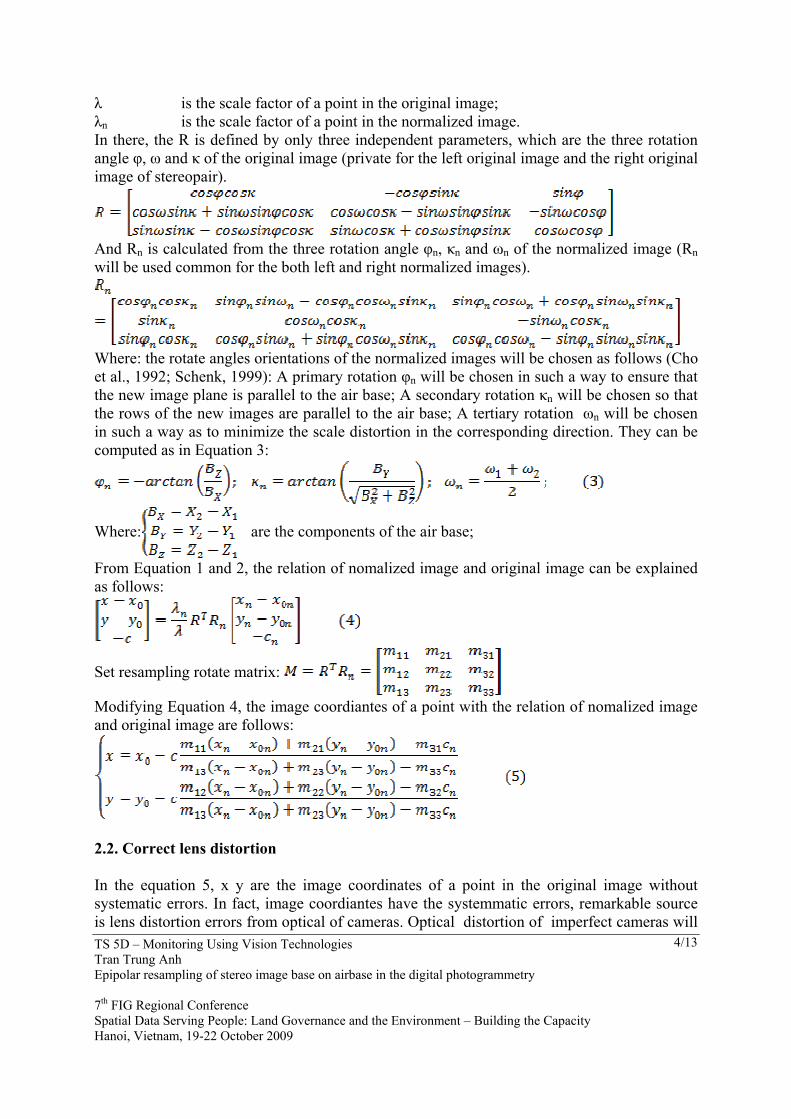
λ is the scale factor of a point in the original image; λn is the scale factor of a point in the normalized image. In there, the R is defined by only three independent parameters, which are the three rotation angle φ, ω and κ of the original image (private for the left original image and the right original image of stereopair).
And Rn is calculated from the three rotation angle φn, κn and ωn of the normalized image (Rn will be used common for the both left and right normalized images).
Where: the rotate angles orientations of the normalized images will be chosen as follows (Cho et al., 1992; Schenk, 1999): A primary rotation φn will be chosen in such a way to ensure that the new image plane is parallel to the air base; A secondary rotation κn will be chosen so that the rows of the new images are parallel to the air base; A tertiary rotation ωn will be chosen in such a way as to minimize the scale distortion in the corresponding direction. They can be computed as in Equation 3:
Where: are the components of the air base;
From Equation 1 and 2, the relation of nomalized image and original image can be explained as follows:
Set resampling rotate matrix:
Modifying Equation 4, the image coordiantes of a point with the relation of nomalized image and original image are follows:
2.2. Correct lens distortion In the equation 5, x y are the image coordinates of a point in the original image without systematic errors. In fact, image coordiantes have the systemmatic errors, remarkable source is lens distortion errors from optical of cameras. Optical distortion of imperfect cameras will TS 5D – Monitoring Using Vision Technologies Tran Trung Anh Epipolar resampling of stereo image base on airbase in the digital photogrammetry 7th FIG Regional Conference Spatial Data Serving People: Land Governance and the Environment – Building the Capacity Hanoi, Vietnam, 19-22 October 2009
4/13
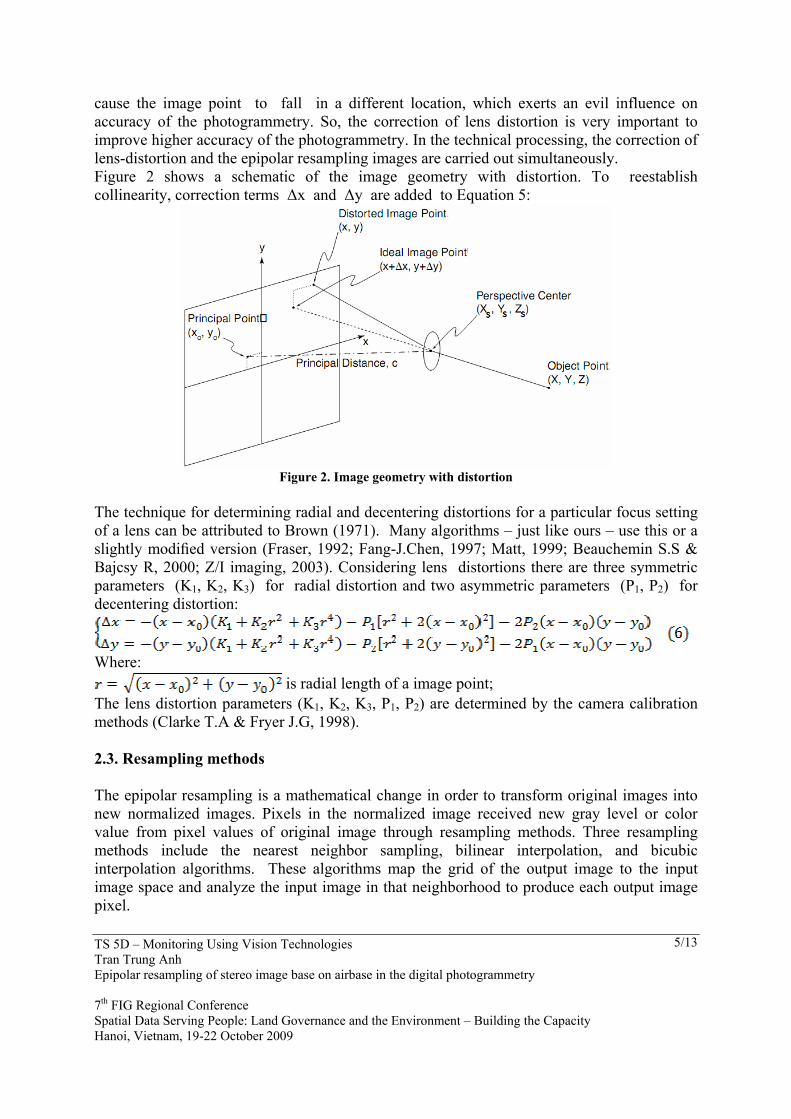
cause the image point to fall in a different location, which exerts an evil influence on accuracy of the photogrammetry. So, the correction of lens distortion is very important to improve higher accuracy of the photogrammetry. In the technical processing, the correction of lens-distortion and the epipolar resampling images are carried out simultaneously. Figure 2 shows a schematic of the image geometry with distortion. To reestablish collinearity, correction terms ∆x and ∆y are added to Equation 5:
Figure 2. Image geometry with distortion
The technique for determining radial and decentering distortions for a particular focus setting of a lens can be attributed to Brown (1971). Many algorithms – just like ours – use this or a slightly modified version (Fraser, 1992; Fang-J.Chen, 1997; Matt, 1999; Beauchemin S.S & Bajcsy R, 2000; Z/I imaging, 2003). Considering lens distortions there are three symmetric parameters (K1, K2, K3) for radial distortion and two asymmetric parameters (P1, P2) for decentering distortion:
Where:
is radial length of a image point; The lens distortion parameters (K1, K2, K3, P1, P2) are determined by the camera calibration methods (Clarke T.A & Fryer J.G, 1998). 2.3. Resampling methods The epipolar resampling is a mathematical change in order to transform original images into new normalized images. Pixels in the normalized image received new gray level or color value from pixel values of original image through resampling methods. Three resampling methods include the nearest neighbor sampling, bilinear interpolation, and bicubic interpolation algorithms. These algorithms map the grid of the output image to the input image space and analyze the input image in that neighborhood to produce each output image pixel.
TS 5D – Monitoring Using Vision Technologies Tran Trung Anh Epipolar resampling of stereo image base on airbase in the digital photogrammetry 7th FIG Regional Conference Spatial Data Serving People: Land Governance and the Environment – Building the Capacity Hanoi, Vietnam, 19-22 October 2009
5/13
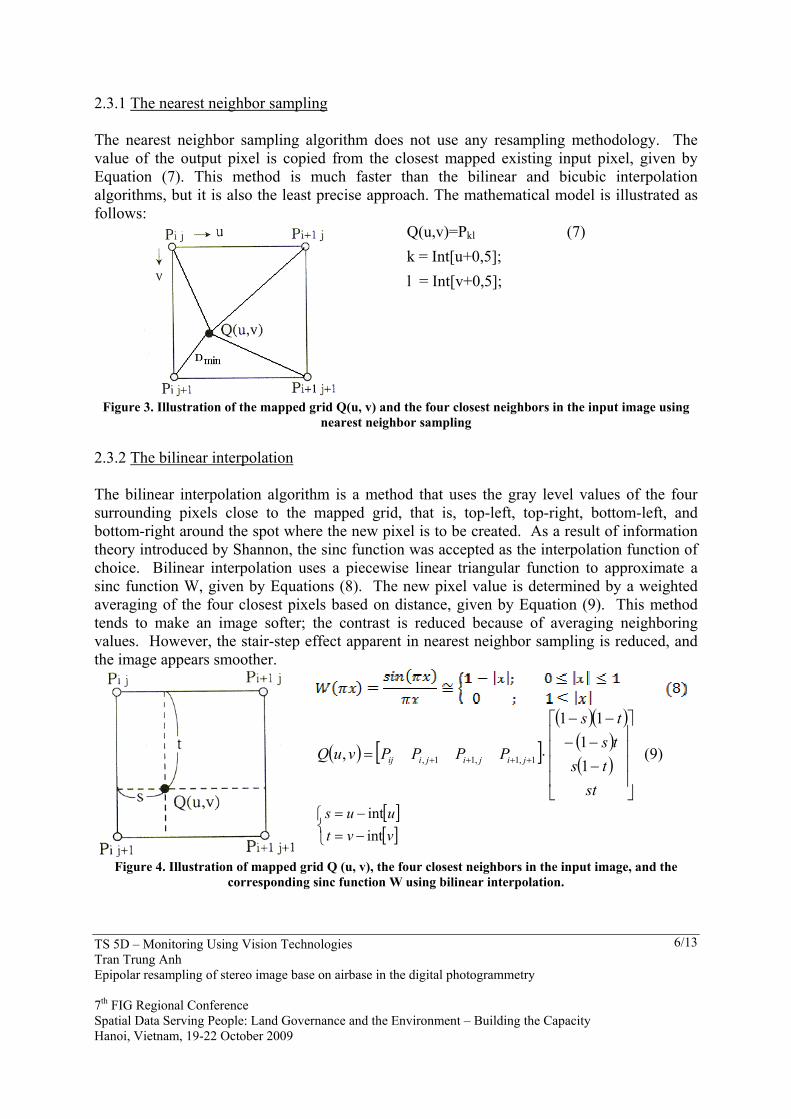
2.3.1 The nearest neighbor sampling The nearest neighbor sampling algorithm does not use any resampling methodology. The value of the output pixel is copied from the closest mapped existing input pixel, given by Equation (7). This method is much faster than the bilinear and bicubic interpolation algorithms, but it is also the least precise approach. The mathematical model is illustrated as follows:
Q(u,v)=Pkl (7) k = Int[u+0,5]; l = Int[v+0,5];
Figure 3. Illustration of the mapped grid Q(u, v) and the four closest neighbors in the input image using nearest neighbor sampling
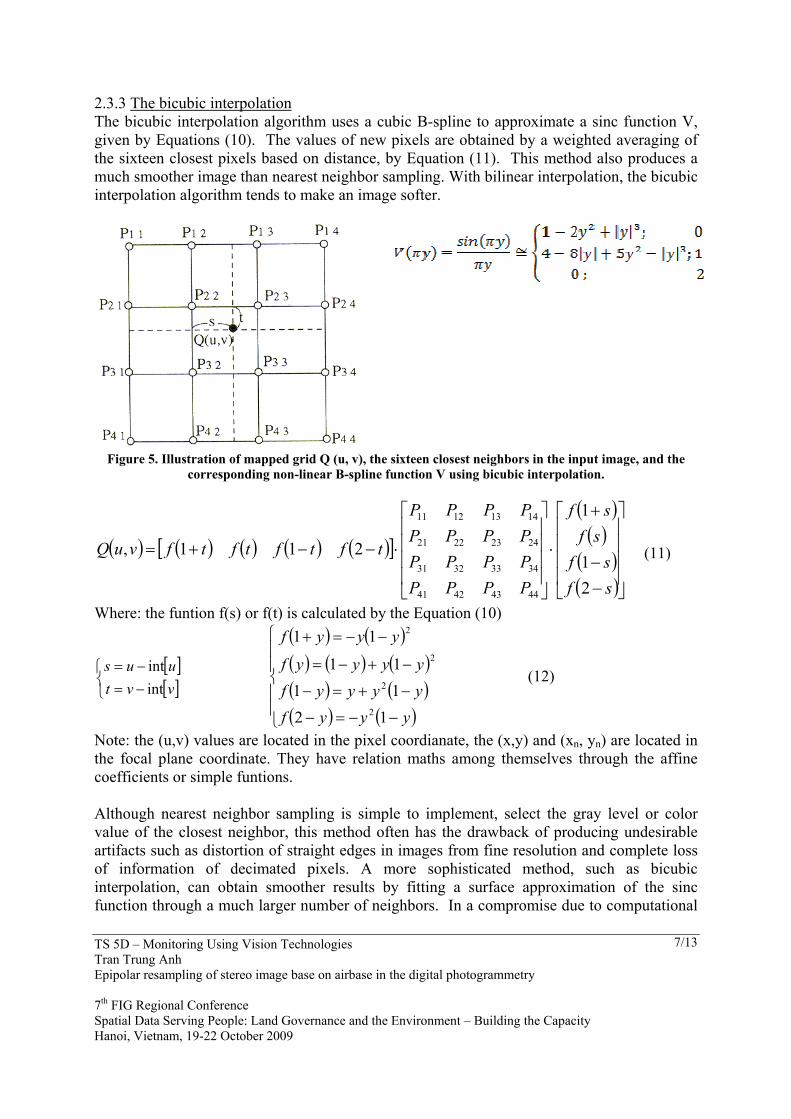
2.3.2 The bilinear interpolation The bilinear interpolation algorithm is a method that uses the gray level values of the four surrounding pixels close to the mapped grid, that is, top-left, top-right, bottom-left, and bottom-right around the spot where the new pixel is to be created. As a result of information theory introduced by Shannon, the sinc function was accepted as the interpolation function of choice. Bilinear interpolation uses a piecewise linear triangular function to approximate a sinc function W, given by Equations (8). The new pixel value is determined by a weighted averaging of the four closest pixels based on distance, given by Equation (9). This method tends to make an image softer; the contrast is reduced because of averaging neighboring values. However, the stair-step effect apparent in nearest neighbor sampling is reduced, and the image appears smoother.
( ) [ ]( )( )
( )( )
−−−−−
⋅= ++++
sttststs
PPPPvuQ jijijiij 11
11
, 1,1,11, (9)
[ ][ ]
−=−=
vvtuus
intint
Figure 4. Illustration of mapped grid Q (u, v), the four closest neighbors in the input image, and the corresponding sinc function W using bilinear interpolation.
TS 5D – Monitoring Using Vision Technologies Tran Trung Anh Epipolar resampling of stereo image base on airbase in the digital photogrammetry 7th FIG Regional Conference Spatial Data Serving People: Land Governance and the Environment – Building the Capacity Hanoi, Vietnam, 19-22 October 2009
6/13
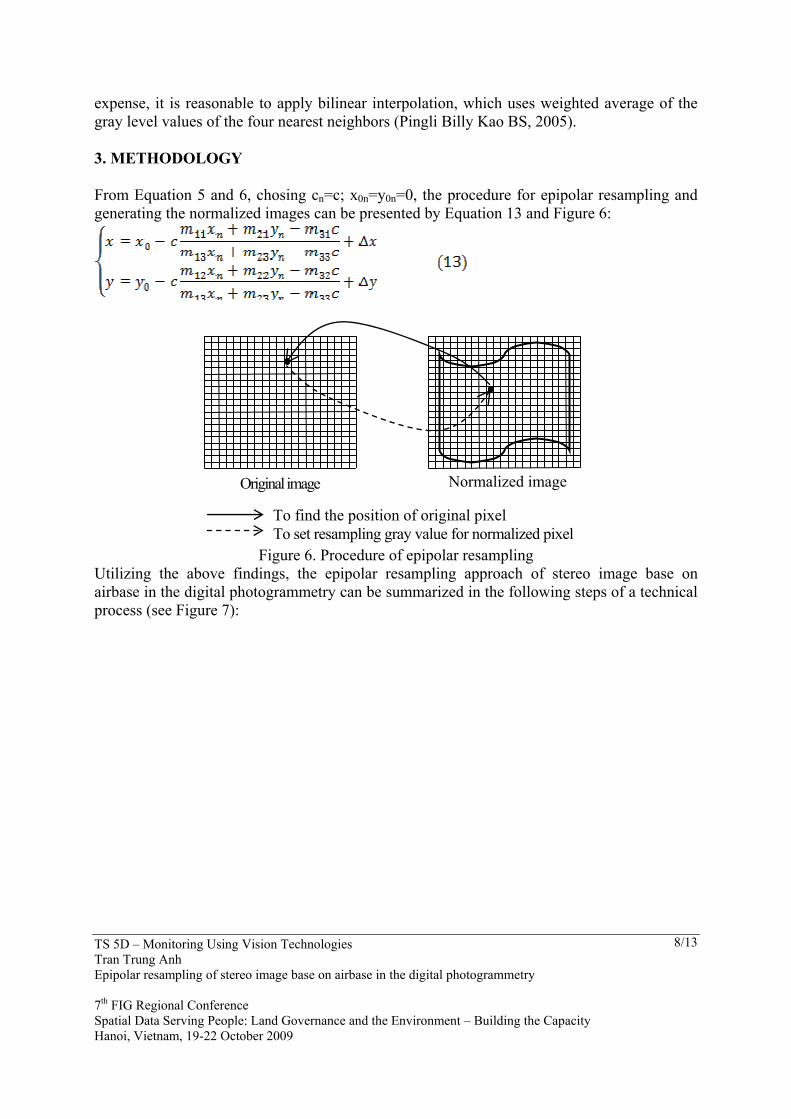
2.3.3 The bicubic interpolation The bicubic interpolation algorithm uses a cubic B-spline to approximate a sinc function V, given by Equations (10). The values of new pixels are obtained by a weighted averaging of the sixteen closest pixels based on distance, by Equation (11). This method also produces a much smoother image than nearest neighbor sampling. With bilinear interpolation, the bicubic interpolation algorithm tends to make an image softer.
Figure 5. Illustration of mapped grid Q (u, v), the sixteen closest neighbors in the input image, and the
corresponding non-linear B-spline function V using bicubic interpolation.
( ) ( ) ( ) ( ) ( )[ ]
( )( )
( )( )
−−
+
⋅
⋅−−+=
sfsfsfsf
PPPPPPPPPPPPPPPP
tftftftfvuQ
21
1
211,
44434241
34333231
24232221
14131211
(11)
Where: the funtion f(s) or f(t) is calculated by the Equation (10)
[ ][ ]
−=−=
vvtuus
intint
( ) ( )( ) ( ) ( )( ) ( )( ) ( )
−−=−
−+=−
−+−=
−−=+
yyyfyyyyfyyyyf
yyyf
121111
11
2
2
2
2
(12)
Note: the (u,v) values are located in the pixel coordianate, the (x,y) and (xn, yn) are located in the focal plane coordinate. They have relation maths among themselves through the affine coefficients or simple funtions. Although nearest neighbor sampling is simple to implement, select the gray level or color value of the closest neighbor, this method often has the drawback of producing undesirable artifacts such as distortion of straight edges in images from fine resolution and complete loss of information of decimated pixels. A more sophisticated method, such as bicubic interpolation, can obtain smoother results by fitting a surface approximation of the sinc function through a much larger number of neighbors. In a compromise due to computational
TS 5D – Monitoring Using Vision Technologies Tran Trung Anh Epipolar resampling of stereo image base on airbase in the digital photogrammetry 7th FIG Regional Conference Spatial Data Serving People: Land Governance and the Environment – Building the Capacity Hanoi, Vietnam, 19-22 October 2009
7/13
expense, it is reasonable to apply bilinear interpolation, which uses weighted average of the gray level values of the four nearest neighbors (Pingli Billy Kao BS, 2005). 3. METHODOLOGY From Equation 5 and 6, chosing cn=c; x0n=y0n=0, the procedure for epipolar resampling and generating the normalized images can be presented by Equation 13 and Figure 6:
Original image Normalized image
To find the position of original pixel To set resampling gray value for normalized pixel
Figure 6. Procedure of epipolar resampling Utilizing the above findings, the epipolar resampling approach of stereo image base on airbase in the digital photogrammetry can be summarized in the following steps of a technical process (see Figure 7):
TS 5D – Monitoring Using Vision Technologies Tran Trung Anh Epipolar resampling of stereo image base on airbase in the digital photogrammetry 7th FIG Regional Conference Spatial Data Serving People: Land Governance and the Environment – Building the Capacity Hanoi, Vietnam, 19-22 October 2009
8/13
IOP & lens distortions parameters
Right original image Left original image
Matrix rotate of normalized image
Resampling rotate matrix of right image
Resampling rotate matrix of left image
Epipolar resampling of the right image
Epipolar resampling of the left image
The normalized images of stereopairs
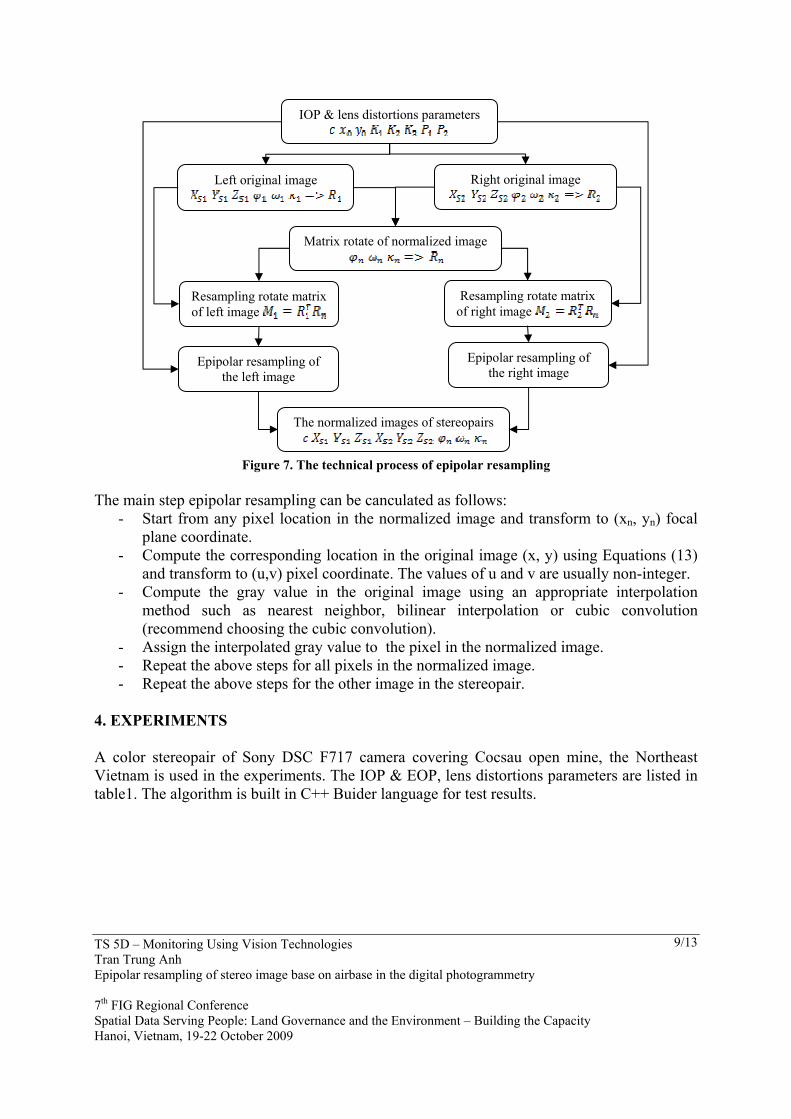
Figure 7. The technical process of epipolar resampling
The main step epipolar resampling can be canculated as follows:
- Start from any pixel location in the normalized image and transform to (xn, yn) focal plane coordinate.
- Compute the corresponding location in the original image (x, y) using Equations (13) and transform to (u,v) pixel coordinate. The values of u and v are usually non-integer.
- Compute the gray value in the original image using an appropriate interpolation method such as nearest neighbor, bilinear interpolation or cubic convolution (recommend choosing the cubic convolution).
- Assign the interpolated gray value to the pixel in the normalized image. - Repeat the above steps for all pixels in the normalized image. - Repeat the above steps for the other image in the stereopair.
4. EXPERIMENTS A color stereopair of Sony DSC F717 camera covering Cocsau open mine, the Northeast Vietnam is used in the experiments. The IOP & EOP, lens distortions parameters are listed in table1. The algorithm is built in C++ Buider language for test results.
TS 5D – Monitoring Using Vision Technologies Tran Trung Anh Epipolar resampling of stereo image base on airbase in the digital photogrammetry 7th FIG Regional Conference Spatial Data Serving People: Land Governance and the Environment – Building the Capacity Hanoi, Vietnam, 19-22 October 2009
9/13

Original image pair Normalized image pair IOP (in mm) c=85.744; x0=0.058; y0=-0.322 cn=85.744; x0n=0; y0n=0; Lens distortion K1=1,41x10⁻²; K2=-2,95x10⁻⁵; K3=5,4x10⁻⁵;
P1=1,15x10⁻⁵; P2=-1,8x10⁻⁵; None of lens distortion
Exposure station XS1 = 429431.925m; YS1 = 26130.463m; ZS1 = -6.067m;
XS2 =429468.119m; YS2 = 26126.323m; ZS2 = -5.678m;
Keep of original values
Rotate angles φ1=2.0816 deg ω1=89.4106 deg κ1=0.3054 deg
φ2=5.2593 deg ω2=86.9550 deg κ2=1.5160 deg
φn=-0.6164 deg ωn=88.1828 deg κn=-6.5245 deg
Table1. Sony DSC F717 data for epipolar resampling
Figure 8. Left and right origin images of Cocsau open mine, the Northeast Vietnam
Figure 9. Left and right nomalized images of Cocsau open mine, the Northeast Vietnam
TS 5D – Monitoring Using Vision Technologies Tran Trung Anh Epipolar resampling of stereo image base on airbase in the digital photogrammetry 7th FIG Regional Conference Spatial Data Serving People: Land Governance and the Environment – Building the Capacity Hanoi, Vietnam, 19-22 October 2009
10/13
The original image pair
The normalized image pair The object space coordinate ID
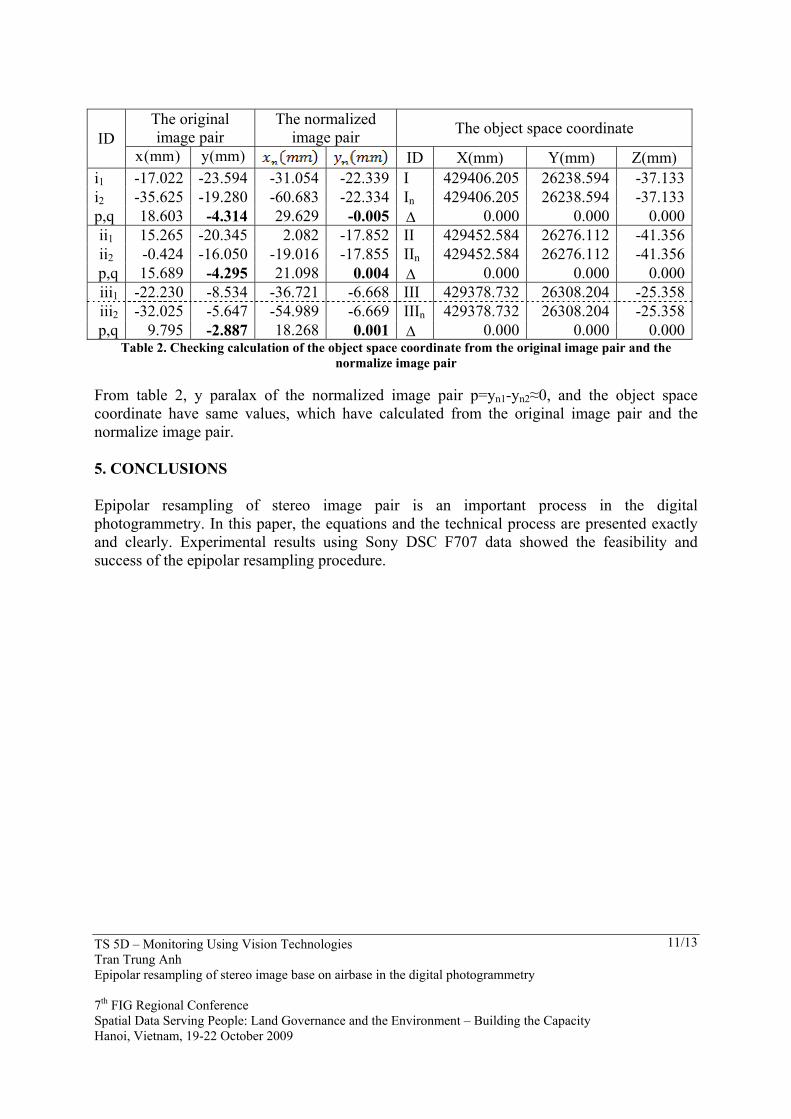
)mm(x )mm(y ID X(mm) Y(mm) Z(mm) i1 -17.022 -23.594 -31.054 -22.339 I 429406.205 26238.594 -37.133i2 -35.625 -19.280 -60.683 -22.334 In 429406.205 26238.594 -37.133p,q 18.603 -4.314 29.629 -0.005 ∆ 0.000 0.000 0.000ii1 15.265 -20.345 2.082 -17.852 II 429452.584 26276.112 -41.356ii2 -0.424 -16.050 -19.016 -17.855 IIn 429452.584 26276.112 -41.356p,q 15.689 -4.295 21.098 0.004 ∆ 0.000 0.000 0.000iii1 -22.230 -8.534 -36.721 -6.668 III 429378.732 26308.204 -25.358iii2 -32.025 -5.647 -54.989 -6.669 IIIn 429378.732 26308.204 -25.358p,q 9.795 -2.887 18.268 0.001 ∆ 0.000 0.000 0.000
Table 2. Checking calculation of the object space coordinate from the original image pair and the normalize image pair
From table 2, y paralax of the normalized image pair p=yn1-yn2≈0, and the object space coordinate have same values, which have calculated from the original image pair and the normalize image pair. 5. CONCLUSIONS Epipolar resampling of stereo image pair is an important process in the digital photogrammetry. In this paper, the equations and the technical process are presented exactly and clearly. Experimental results using Sony DSC F707 data showed the feasibility and success of the epipolar resampling procedure.
TS 5D – Monitoring Using Vision Technologies Tran Trung Anh Epipolar resampling of stereo image base on airbase in the digital photogrammetry 7th FIG Regional Conference Spatial Data Serving People: Land Governance and the Environment – Building the Capacity Hanoi, Vietnam, 19-22 October 2009
11/13
REFERENCES Beauchemin S.S & Bajcsy R, 2000. Modelling and Re-moving Radial and Tangential Distortions in Spherical Lenses, Theoretical Foundations of Computer Vision 2000, pp. 1–21. Brown, D.C., 1971. Close Range Camera Calibration, Photo.Eng., 37(8):855-866. Cho, W., T. Schenk, and M. Madani, 1992. Resampling Digital Imagery to Epipolar Geometry, IAPRS International Archives of Photogrammetry and Remote Sensing, 29(B3): 404-408. Clarke T.A & Fryer J.G, 1998. The Development of Camera Calibration Methods and Models, Photogrammetric Record, 16(91): pp51-66. Fang-Jenq Chen, 1997. Application of Least-Squares Adjustment Technique to Geometric camera Calibration and Photogrammetric Flow Visualization, NASA Langley Research Center Hampton, Virginia 23681-0001. Fraser, C.S., 1992. Photogrammetric Camera Component Calibration - A Review of Analytical Techniques. XVII Congress International Society of Photogrammetry & Remote Sensing, Washington, D. C., August 1992. Matt H. Steves, 1999. AeroSys Aerotriangulation User guide version 3.0, AeroSys Consulting 1401 Portland Avenue Saint Paul, MN 55104 USA. Morgan, M., 2004. Epipolar Resampling of Linear Array Scanner Scenes, PhD Dissertation, Department of Geomatics Engineering, University of Calgary, Canada. Kraus, K. 1993. Photogrammetry, Dümmler Verlag, Bonn., Volume 1, 397p. Pingli Billy Kao BS, 2005. Image Resizing with Maximum Entropy Algorithm, MSc Dissertation, the Department of Electrical and Computer Engineering, the Texas Tech University, USA. Schenk, T., 1999. Digital Photogrammetry - Volume I, TerraScience, Laurelville, Ohio, USA, 428p. Z/I imaging Corporation, 2003. ImageStation Digital Mensuration (ISDM) User’s Guide, USA.
TS 5D – Monitoring Using Vision Technologies Tran Trung Anh Epipolar resampling of stereo image base on airbase in the digital photogrammetry 7th FIG Regional Conference Spatial Data Serving People: Land Governance and the Environment – Building the Capacity Hanoi, Vietnam, 19-22 October 2009
12/13

TS 5D – Monitoring Using Vision Technologies Tran Trung Anh Epipolar resampling of stereo image base on airbase in the digital photogrammetry 7th FIG Regional Conference Spatial Data Serving People: Land Governance and the Environment – Building the Capacity Hanoi, Vietnam, 19-22 October 2009
13/13
CONTACTS TRAN Trung Anh Hanoi University of Mining and Geology Address: Dongngac – Tuliem City: Hanoi COUNTRY: VIETNAM Tel. +84.987831886 Fax + Email: [email protected] Web site: www.humg.edu.vn
View publication statsView publication stats