epri global climate change research seminar (may'08) - … · 2019-03-05 · index value gdp...
TRANSCRIPT
Understanding Model Estimates of the Economic Costs of Climate Policy
EPRI Global Climate Change Research SeminarMay 22, 2008
Tom WilsonSenior Program Manager
2© 2007 Electric Power Research Institute, Inc. All rights reserved.
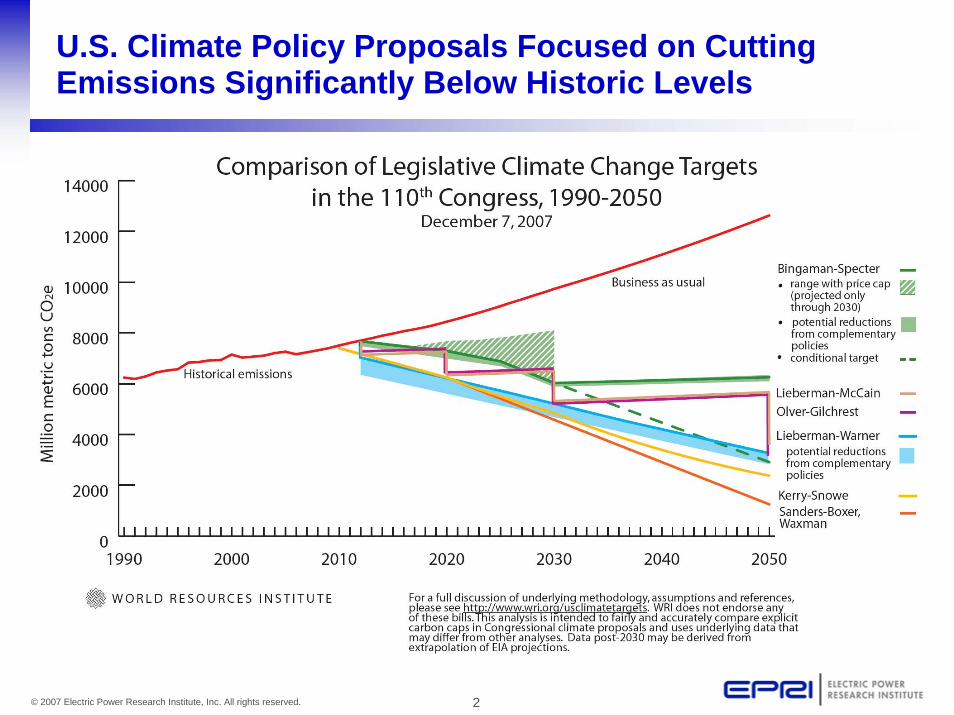
U.S. Climate Policy Proposals Focused on Cutting Emissions Significantly Below Historic Levels

3© 2007 Electric Power Research Institute, Inc. All rights reserved.
Elements of Lieberman-Warner Climate Security Act of 2007
• Economy-wide Coverage – about 87% of 2005 emissions– Downstream on coal (units > 5,000 tons/yr)– Upstream on oil, gas, F-gases, N2O
• Targets for Covered Sectors (in MtCO2e)2012: 5,7752020: 4,9242030: 3,8602050: 1,732 (~ 70% below 2005 level)
• Cap-and-trade system– 22.5% auction phasing to 69.5% by 2030– Permits/auction revenues designated for a wide array of uses
• Provisions for limited use of offsets• Cost containment via a Carbon Market Efficiency Board
4© 2007 Electric Power Research Institute, Inc. All rights reserved.
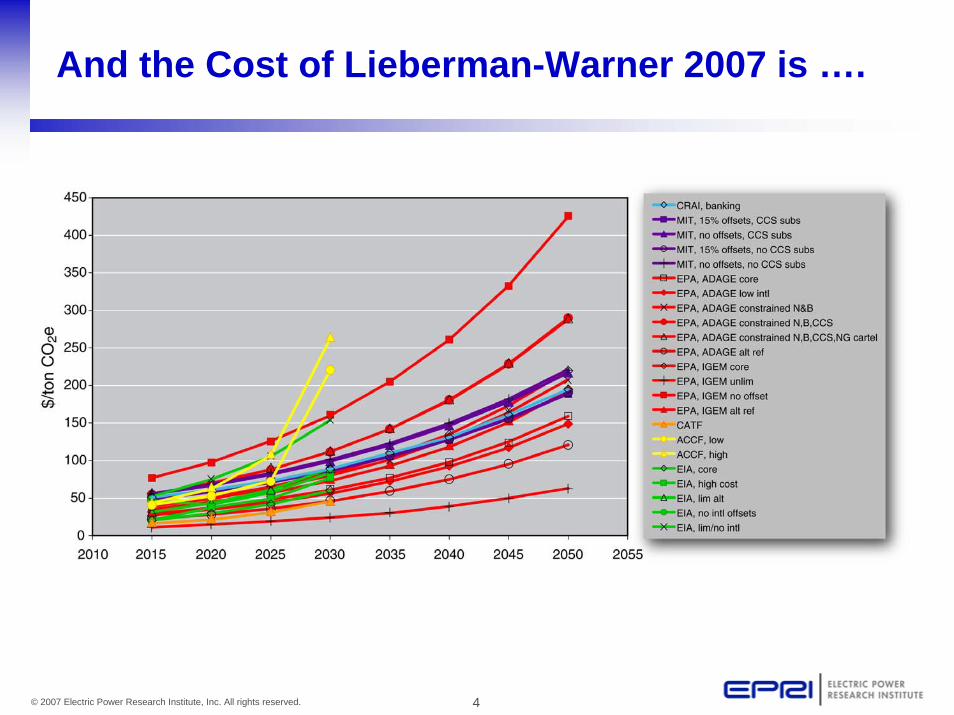
And the Cost of Lieberman-Warner 2007 is ….
5© 2007 Electric Power Research Institute, Inc. All rights reserved.
Topics
• A Digression – A Perspective on Using Models• Models and Modelers• Different Assumptions Often Make the Biggest Differences• Concluding Thoughts
6© 2007 Electric Power Research Institute, Inc. All rights reserved.
Part I:What Are Models Good For?
“It’s hard to make predictions, especially about the future”
-Yogi BerraFamous American philosopher (and baseball player)

7© 2007 Electric Power Research Institute, Inc. All rights reserved.
The Challenge of Modeling (Thanks to Jae Edmonds)
“I’m amused year after year by your high emissions scenarios – and happy to see others now chuckle at them too!”
– Note Jae got from a friend in 1983
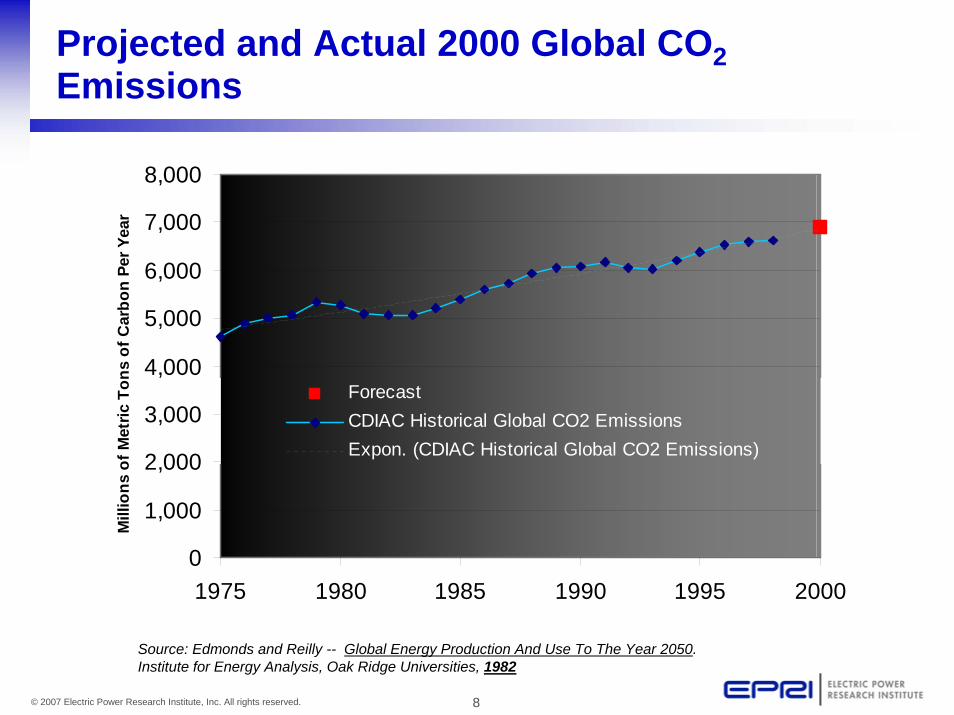
Examine Jae and John’s Forecasts of 2000 CO2Emissions + Oil Prices
… Made in 1982
8© 2007 Electric Power Research Institute, Inc. All rights reserved.
Projected and Actual 2000 Global CO2Emissions
0
1,000
2,000
3,000
4,000
5,000
6,000
7,000
8,000
1975 1980 1985 1990 1995 2000
Mill
ions
of M
etric
Ton
s of
Car
bon
Per Y
ear
ForecastCDIAC Historical Global CO2 EmissionsExpon. (CDIAC Historical Global CO2 Emissions)
Source: Edmonds and Reilly -- Global Energy Production And Use To The Year 2050. Institute for Energy Analysis, Oak Ridge Universities, 1982
9© 2007 Electric Power Research Institute, Inc. All rights reserved.
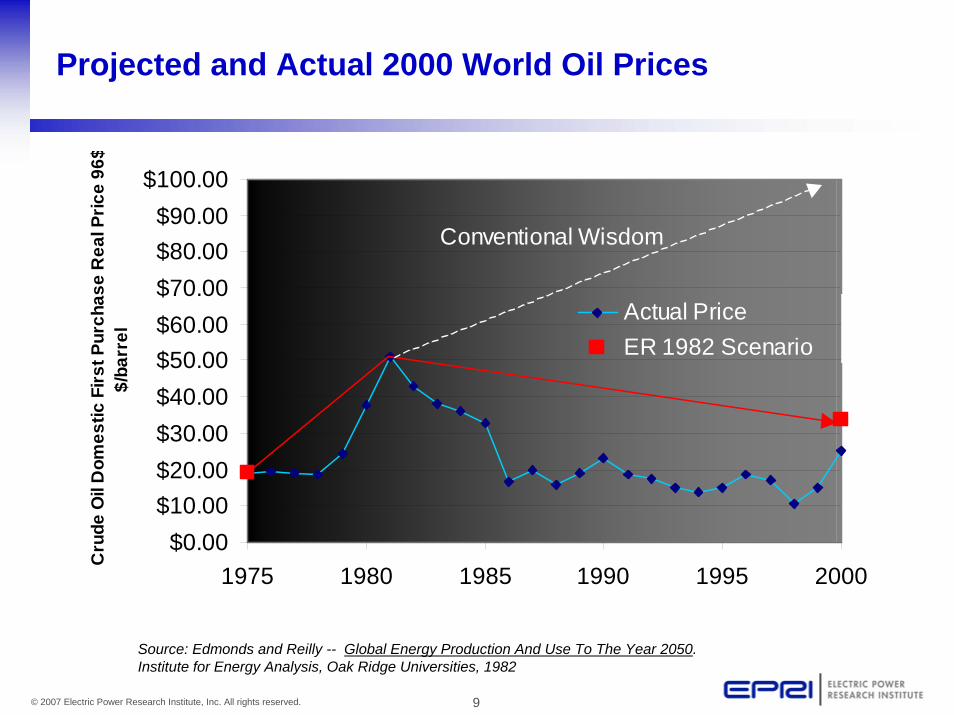
Projected and Actual 2000 World Oil Prices
$0.00$10.00$20.00$30.00$40.00$50.00$60.00$70.00$80.00$90.00
$100.00
1975 1980 1985 1990 1995 2000
Cru
de O
il D
omes
tic F
irst P
urch
ase
Rea
l Pric
e 96
$$/
barr
el
Actual PriceER 1982 Scenario
Conventional Wisdom
Source: Edmonds and Reilly -- Global Energy Production And Use To The Year 2050. Institute for Energy Analysis, Oak Ridge Universities, 1982
10© 2007 Electric Power Research Institute, Inc. All rights reserved.
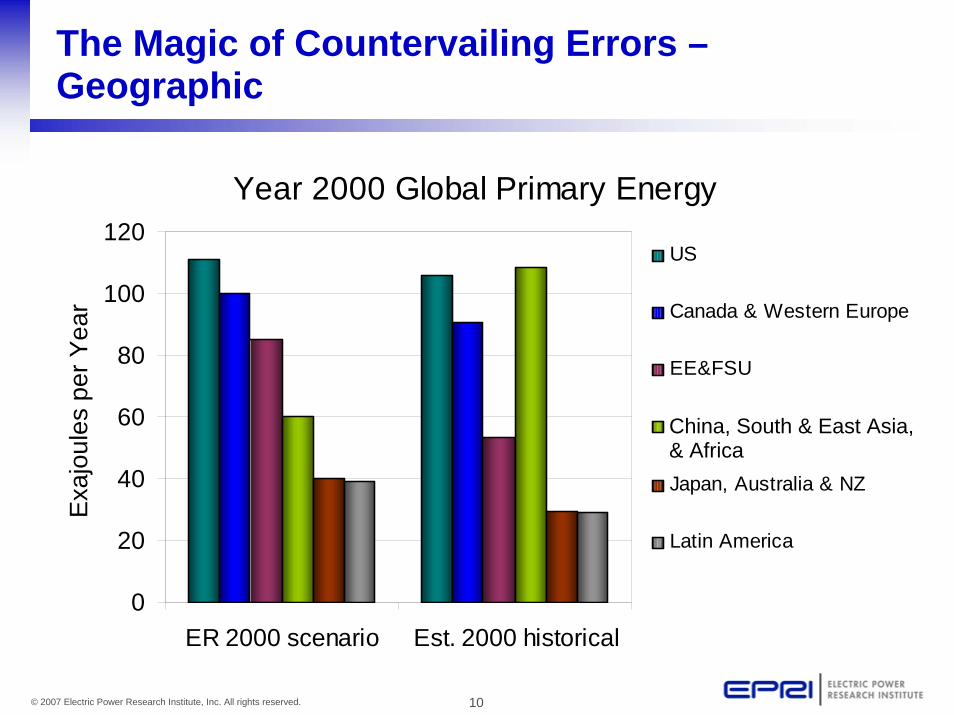
The Magic of Countervailing Errors –Geographic
Year 2000 Global Primary Energy
0
20
40
60
80
100
120
ER 2000 scenario Est. 2000 historical
Exa
joul
es p
er Y
ear
US
Canada & Western Europe
EE&FSU
China, South & East Asis,& Africa
Japan, Australia & NZ
Latin America
China, South & East Asia,& Africa
Exa
joul
espe
r Yea
r
11© 2007 Electric Power Research Institute, Inc. All rights reserved.
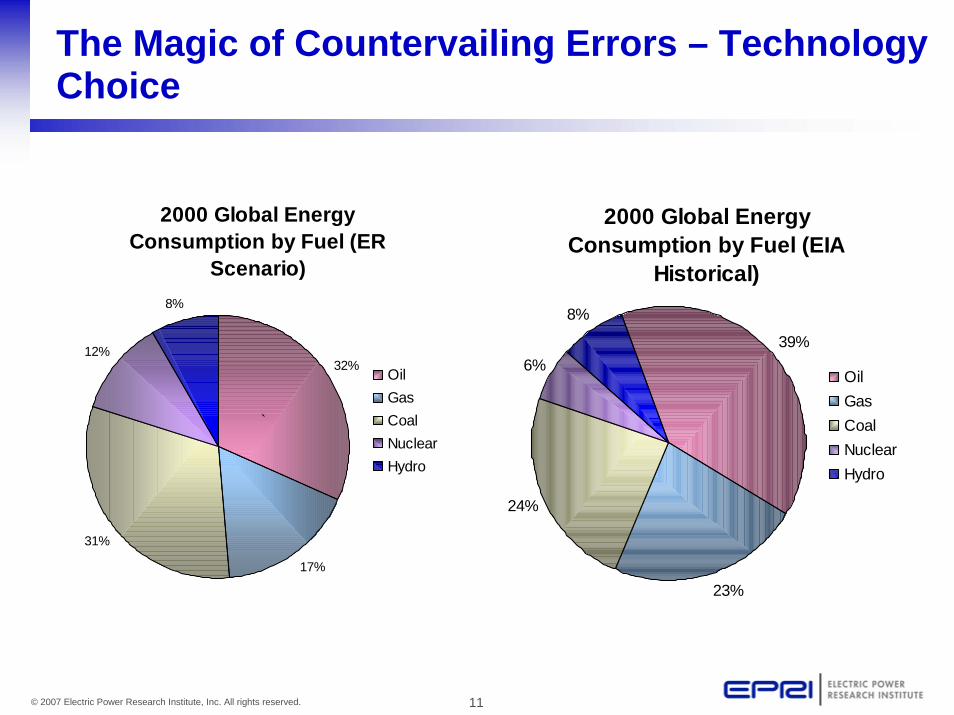
The Magic of Countervailing Errors – Technology Choice
2000 Global Energy Consumption by Fuel (ER
Scenario)
32%
17%
31%
12%
8%
OilGasCoalNuclearHydro
`
2000 Global Energy Consumption by Fuel (EIA
Historical)
39%
23%
24%
6%
8%
OilGasCoalNuclearHydro

12© 2007 Electric Power Research Institute, Inc. All rights reserved.
Insights from This Example
• Important stuff happens, especially over 10, 20, or 40 year time horizons– Models can provide very useful insights … but are less
useful for providing “predictions”– Some things are easier to “predict” than others
• What could happen to change “predictions” dramatically?– Extended recession?– Rebound of the US$?– Technology accident?– Technology breakthrough?
• What modeling insights seem robust?
13© 2007 Electric Power Research Institute, Inc. All rights reserved.
Part II: Modelers and Models
14© 2007 Electric Power Research Institute, Inc. All rights reserved.
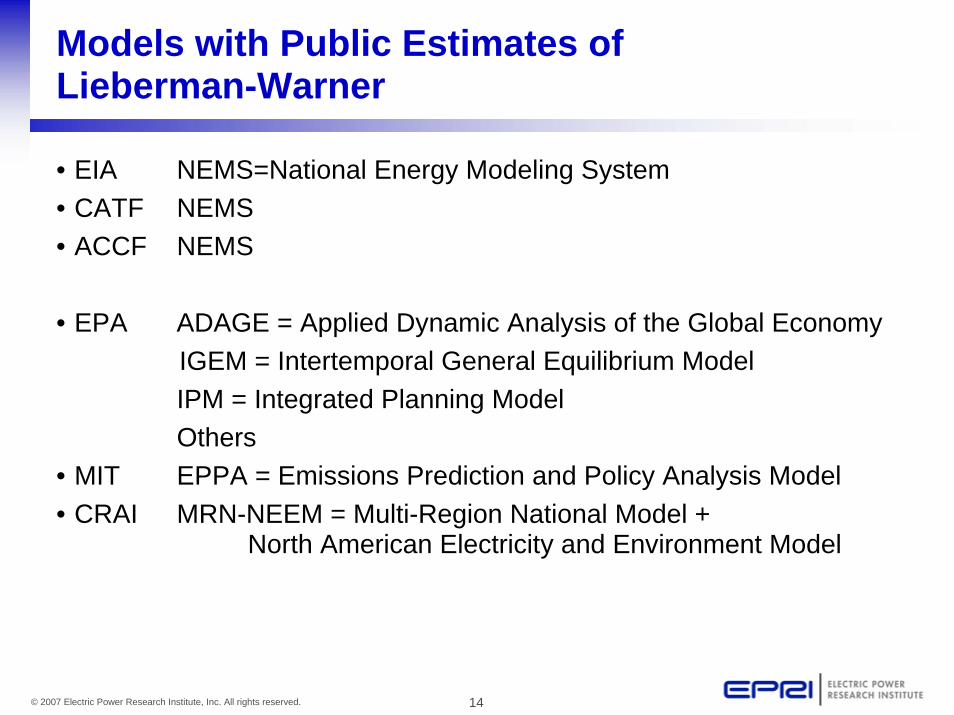
Models with Public Estimates of Lieberman-Warner
• EIA NEMS=National Energy Modeling System• CATF NEMS• ACCF NEMS
• EPA ADAGE = Applied Dynamic Analysis of the Global EconomyIGEM = Intertemporal General Equilibrium ModelIPM = Integrated Planning ModelOthers
• MIT EPPA = Emissions Prediction and Policy Analysis Model• CRAI MRN-NEEM = Multi-Region National Model +
North American Electricity and Environment Model
15© 2007 Electric Power Research Institute, Inc. All rights reserved.
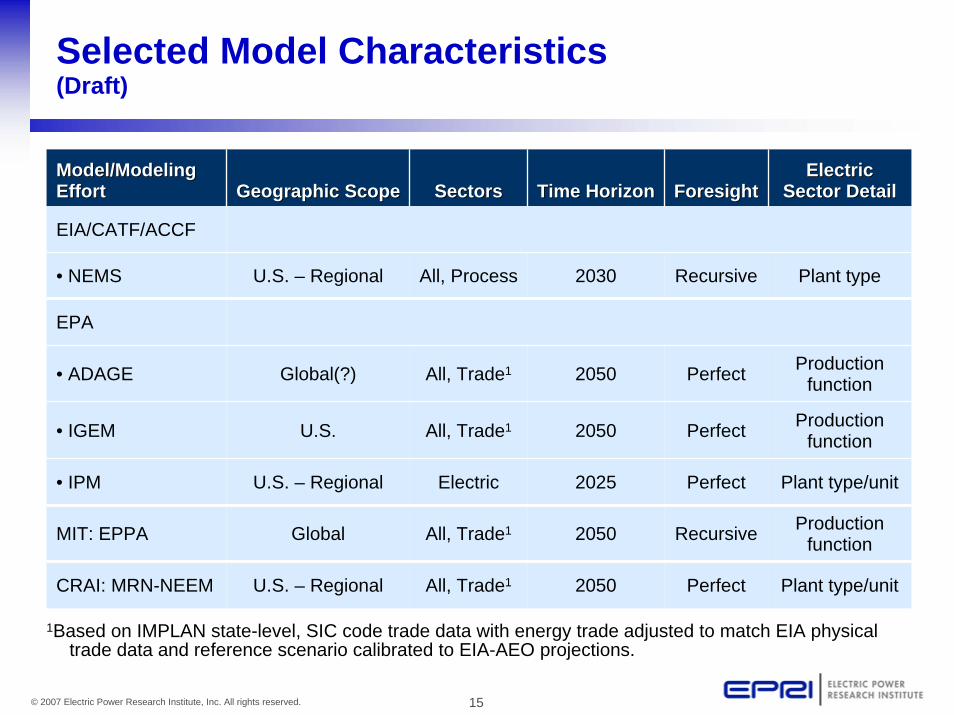
Selected Model Characteristics(Draft)
Model/Modeling Model/Modeling EffortEffort Geographic ScopeGeographic Scope SectorsSectors Time HorizonTime Horizon ForesightForesight
Electric Electric Sector DetailSector Detail
EIA/CATF/ACCF
• NEMS U.S. – Regional All, Process 2030 Recursive Plant type
EPA
• ADAGE Global(?) All, Trade1 2050 Perfect Production function
• IGEM U.S. All, Trade1 2050 Perfect Production function
• IPM U.S. – Regional Electric 2025 Perfect Plant type/unit
MIT: EPPA Global All, Trade1 2050 Recursive Production function
CRAI: MRN-NEEM U.S. – Regional All, Trade1 2050 Perfect Plant type/unit
1Based on IMPLAN state-level, SIC code trade data with energy trade adjusted to match EIA physical trade data and reference scenario calibrated to EIA-AEO projections.
16© 2007 Electric Power Research Institute, Inc. All rights reserved.
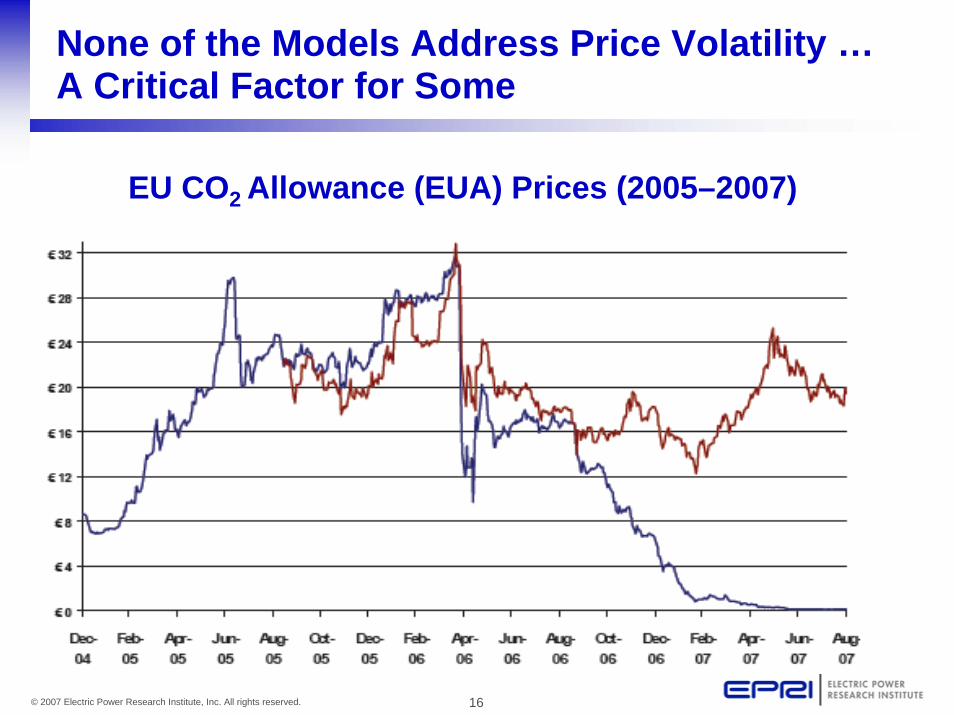
None of the Models Address Price Volatility …A Critical Factor for Some
EU CO2 Allowance (EUA) Prices (2005–2007)
17© 2007 Electric Power Research Institute, Inc. All rights reserved.
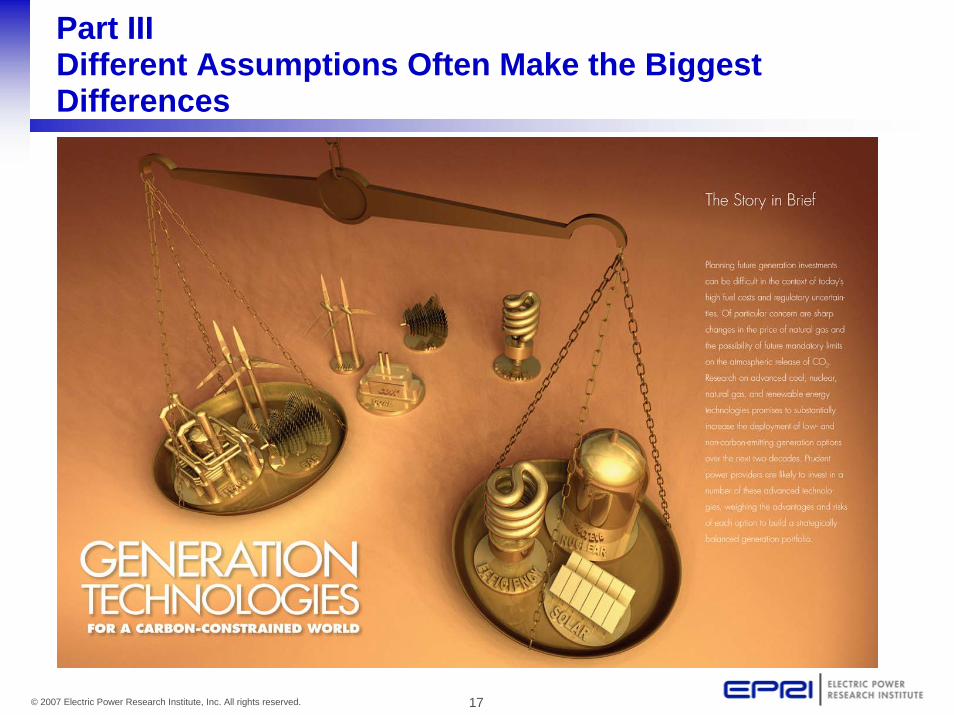
Part IIIDifferent Assumptions Often Make the Biggest Differences
18© 2007 Electric Power Research Institute, Inc. All rights reserved.
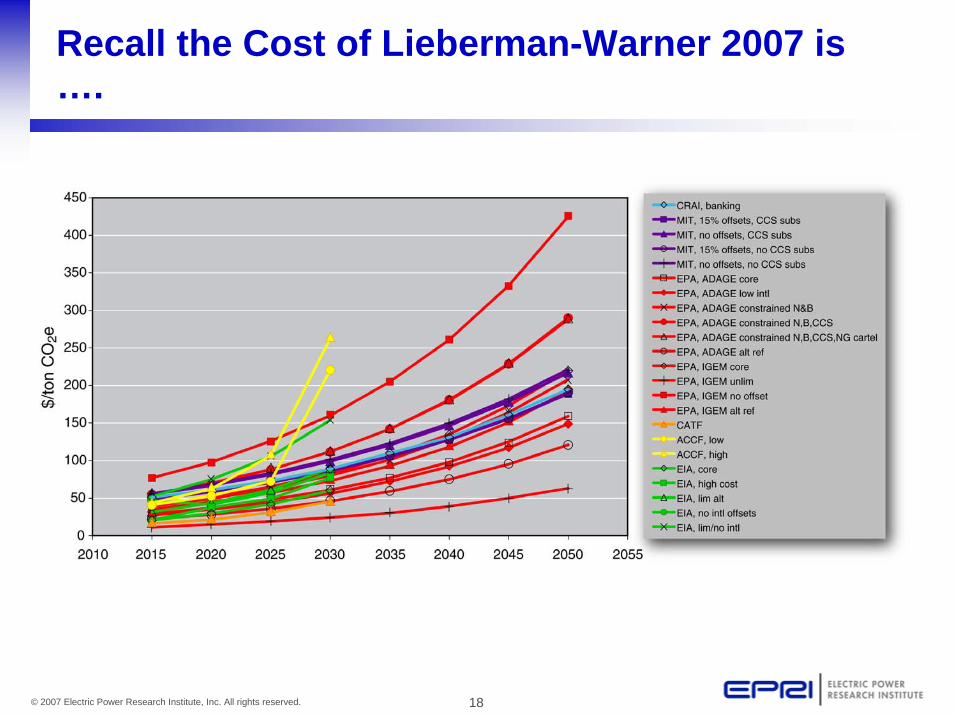
Recall the Cost of Lieberman-Warner 2007 is ….

19© 2007 Electric Power Research Institute, Inc. All rights reserved.
Cost Estimates from Application of NEMS by EIA, CATF, and NAM/ACCF
20© 2007 Electric Power Research Institute, Inc. All rights reserved.
Key Assumptions IncludeUncertainties and Policy Levers
I will talk about four uncertainties:• Reference Case• Technology Cost• “Non-economic” limits on technology deployment• Offsets
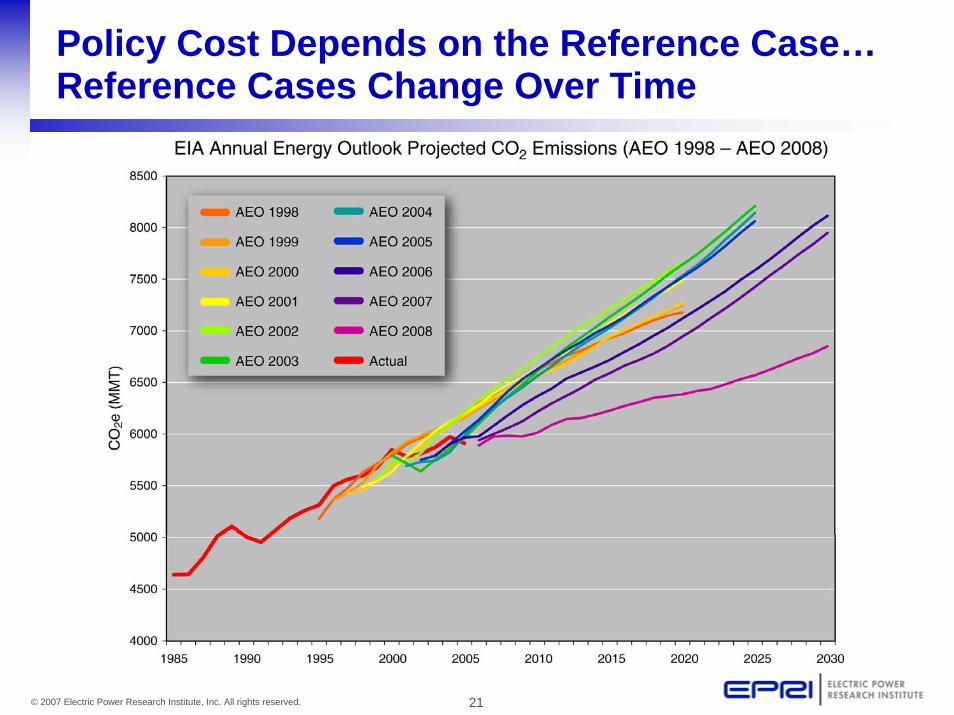
21© 2007 Electric Power Research Institute, Inc. All rights reserved.
Policy Cost Depends on the Reference Case…Reference Cases Change Over Time
22© 2007 Electric Power Research Institute, Inc. All rights reserved.
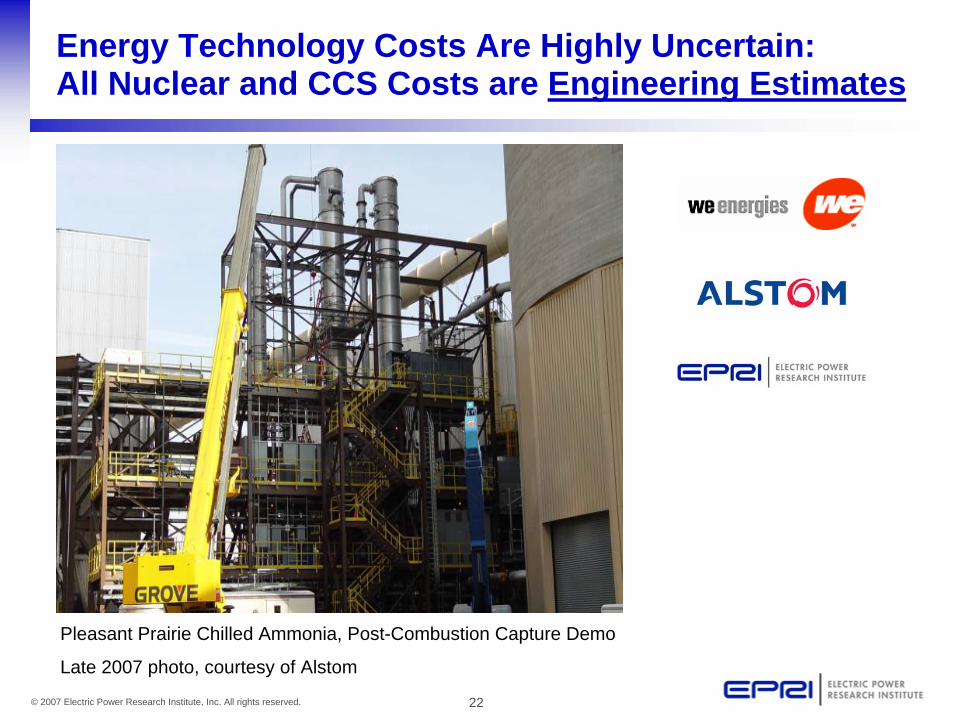
Energy Technology Costs Are Highly Uncertain:All Nuclear and CCS Costs are Engineering Estimates
Pleasant Prairie Chilled Ammonia, Post-Combustion Capture Demo
Late 2007 photo, courtesy of Alstom

23© 2007 Electric Power Research Institute, Inc. All rights reserved.
100
110
120
130
140
150
160
170
2000 2001 2002 2003 2004 2005 2006 2007 2008
Mid-Year
Inde
x Va
lue
GDP Deflator
EIA Generation Data –PC & IGCC
Chemical Engineering Plant Cost Index -CEPCI
Marshall & Swift Equipment Cost Index
Handy-Whitman –Electricity Utility Construction
RS Means Construction Cost Index
IHS-CERA Downstream Construction Cost Index -DCCI
Nelson Farrar Refinery Construction Inflation Index
Construction Cost Escalation Continues(Comparison of Several Cost Indices, Mid-2000 = 100)
Energy Technology Costs Are Highly Uncertain:Are Today’s Costs a New “Plateau” or a “Bubble”
24© 2007 Electric Power Research Institute, Inc. All rights reserved.
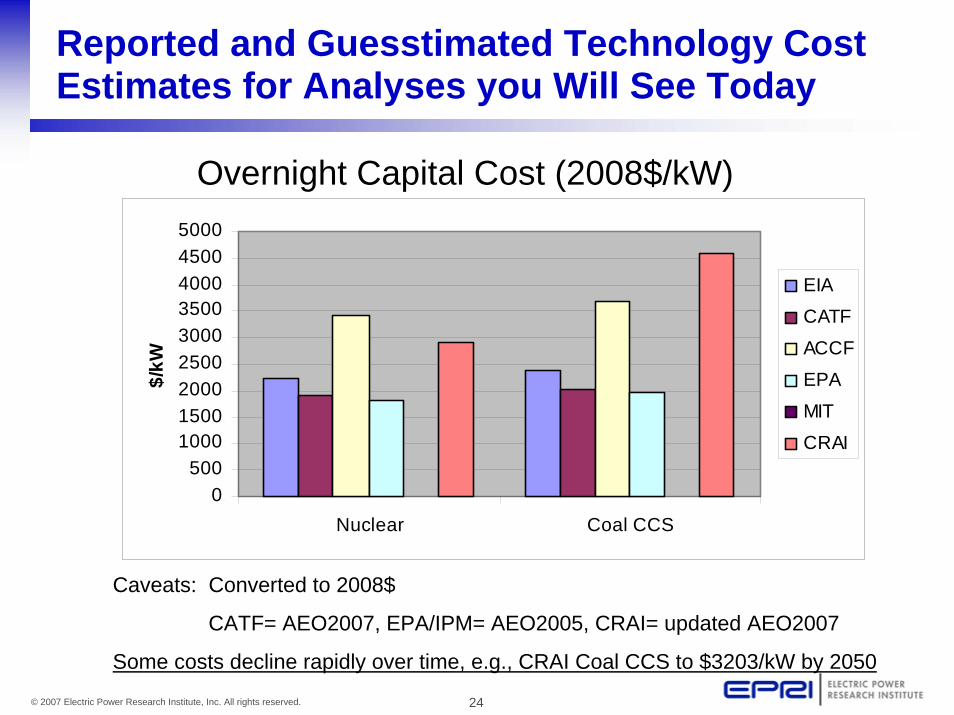
Reported and Guesstimated Technology Cost Estimates for Analyses you Will See Today
Overnight Capital Cost (2008$/kW)
Caveats: Converted to 2008$
CATF= AEO2007, EPA/IPM= AEO2005, CRAI= updated AEO2007
Some costs decline rapidly over time, e.g., CRAI Coal CCS to $3203/kW by 2050
0500
100015002000250030003500400045005000
Nuclear Coal CCS
$/kW
EIA
CATF
ACCF
EPA
MIT
CRAI
25© 2007 Electric Power Research Institute, Inc. All rights reserved.
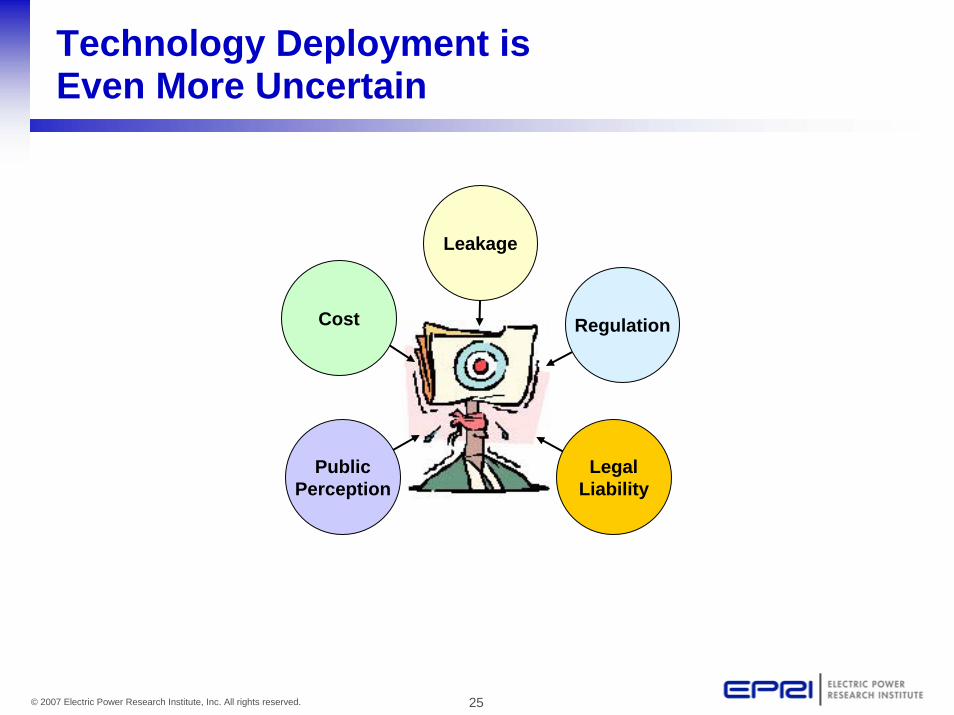
Technology Deployment is Even More Uncertain
PublicPerception
Cost
Leakage
Regulation
LegalLiability
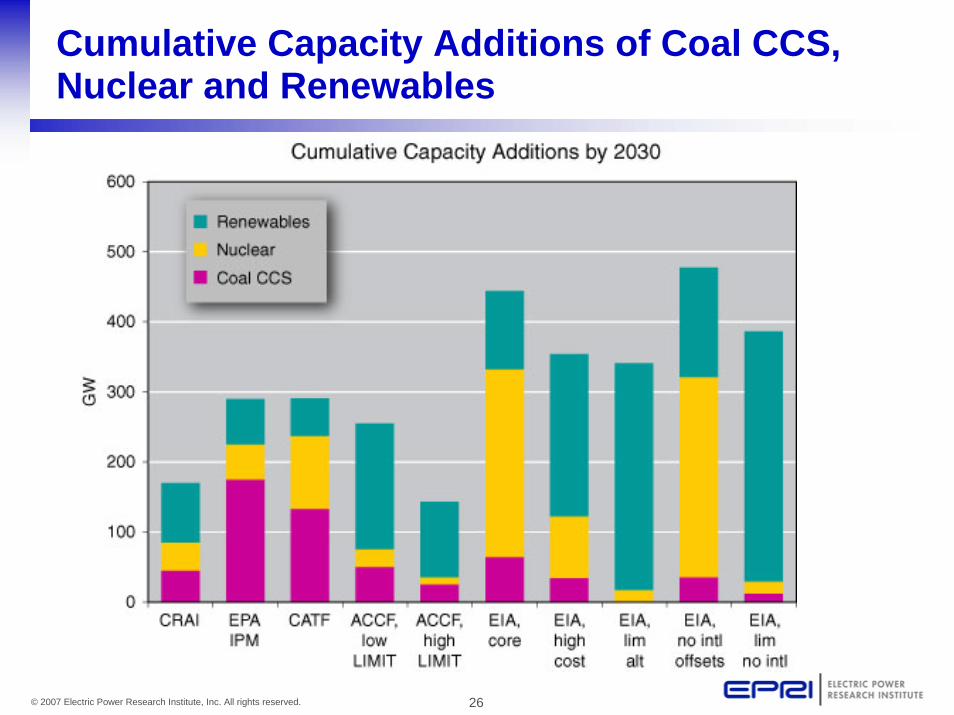
26© 2007 Electric Power Research Institute, Inc. All rights reserved.
Cumulative Capacity Additions of Coal CCS, Nuclear and Renewables
27© 2007 Electric Power Research Institute, Inc. All rights reserved.
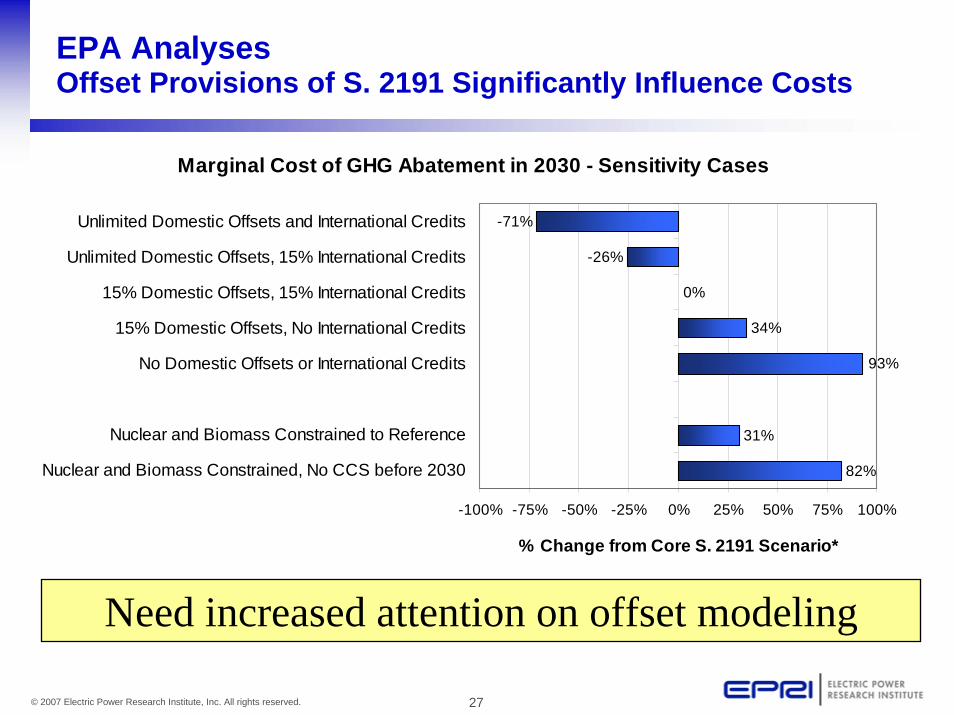
EPA AnalysesOffset Provisions of S. 2191 Significantly Influence Costs
Marginal Cost of GHG Abatement in 2030 - Sensitivity Cases
82%
31%
34%
0%
-26%
-71%
93%
-100% -75% -50% -25% 0% 25% 50% 75% 100%
Nuclear and Biomass Constrained, No CCS before 2030
Nuclear and Biomass Constrained to Reference
No Domestic Offsets or International Credits
15% Domestic Offsets, No International Credits
15% Domestic Offsets, 15% International Credits
Unlimited Domestic Offsets, 15% International Credits
Unlimited Domestic Offsets and International Credits
% Change from Core S. 2191 Scenario*
Need increased attention on offset modeling
28© 2007 Electric Power Research Institute, Inc. All rights reserved.
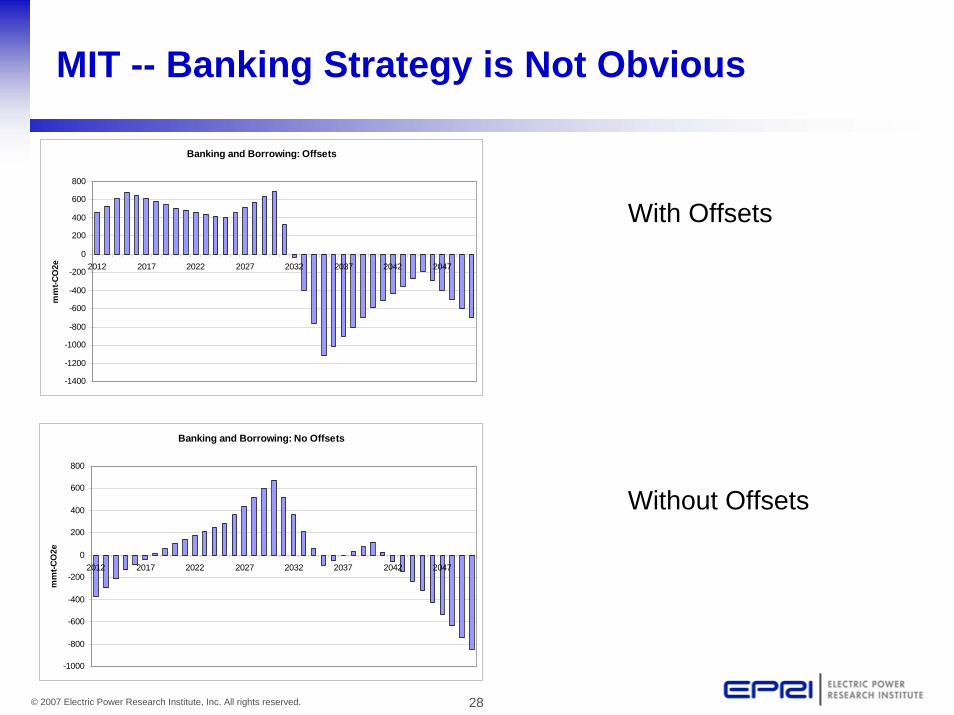
MIT -- Banking Strategy is Not Obvious
Banking and Borrowing: Offsets
-1400
-1200
-1000
-800
-600
-400
-200
0
200
400
600
800
2012 2017 2022 2027 2032 2037 2042 2047
mm
t-CO
2e
Banking and Borrowing: No Offsets
-1000
-800
-600
-400
-200
0
200
400
600
800
2012 2017 2022 2027 2032 2037 2042 2047
mm
t-CO
2e
With Offsets
Without Offsets
29© 2007 Electric Power Research Institute, Inc. All rights reserved.
Concluding Thoughts
• US climate policy analyses likely to be released frequently over the next few years
• All of the models here are credible• None are great predictors; but all can provide important
insights about policy• Differences in cost estimates appear to represent true
uncertainties (e.g., technology deployment) and effects of policy choices (e.g., use of offsets) more than differences in models
I would be more worried and feel less-informed if there were little diversity in the cost estimates
30© 2007 Electric Power Research Institute, Inc. All rights reserved.
May 8 Workshop Presentations at www.epri.com