epsdt review 1999
TRANSCRIPT

External Quality Review 1999 EPSDT Review Page 4.1
Study Population
Study Questions
EPSDT [KN1]Review 1999 This study assessed compliance with the Early and Periodic Screening, Diagnosis and Treatment (EPSDT) recommendations. The EPSDT periodicity table was introduced over 30 years ago as part of the federal Medicaid program in the United States (Olsen et al, 1998). The emphasis of EPSDT service components is on developmental assessment and early identification of risk-associated problems in children. EPSDT components should be provided at recommended intervals for children from birth through age 21. The age-specific EPSDT recommended components for Michigan Medicaid enrollees is attached in the Appendix.
The population for the EPSDT study included children enrolled continuously for the 12 months of the review period
January 1, 1999 through December 31, 1999. In addition, each child incurred one or more office visits with a health care provider during the review period. The population was stratified by age group based upon the age achieved by each child on the birthday occurring within the study period. The ages were stratified as follows: § 0-2 years § 3-6 years § 7-12 years § 13-21 years
Study questions developed for the 1999 EPSDT evaluation were used to formulate data abstraction indicators, and as a
framework for reporting study results. Results based on the study questions are reported in the following categories: § What percentage of enrollees in age groups 0-2, 3-6, 7-12, and 13-21 had a minimum
of one EPSDT service component during 1999? § What percentage of enrollees received EPSDT service components of history,
immunization review, measurement, sensory screening, developmental assessment and inspection during 1999?
§ What percentage of enrollees received age-appropriate hemoglobin testing, lead
testing, and TB testing during 1999? Beginning in 1987 the Michigan Public Health Act required sickle cell screening of all newborn infants. Since this testing is provided at the time of birth and may not have been documented in physician office records, sickle cell screening was not reviewed for this study. In addition, urinalysis screening was not reported for EQR 1999. The necessity for routine urinalysis screening for children under age two is controversial and the American Academy
Purpose of Study

External Quality Review 1999 EPSDT Review Page 4.2
Limitations
Results
of Pediatrics (AAP) does not recommend urine testing of children before the age of five years.
The population of Michigan Medicaid children studied for EQR 1999 was stratified into four age groups, while the EQR
1998 review was based on a population inclusive of children aged 0 to less than 2 years. The EQR 1999 age group 0-2 years included children with a second birthday occurring during the study period; however, children in the EQR 1998 population had not achieved a second birthday during the study period. To allow for comparative discussion of EPSDT findings, MPRO identified a population in EQR 1999 data similar to the population in EQR 1998 including children aged 0 to less than 2 years. The similar populations will be discussed throughout this report to provide comparison of EQR 1998 and EQR 1999 findings. It should be noted that although the population used to compare EQR 1998 and EQR 1999 includes children of the same age, enrollment criteria for selection of the populations varied for the two studies. The impact of these selection differences on the study results is unknown.
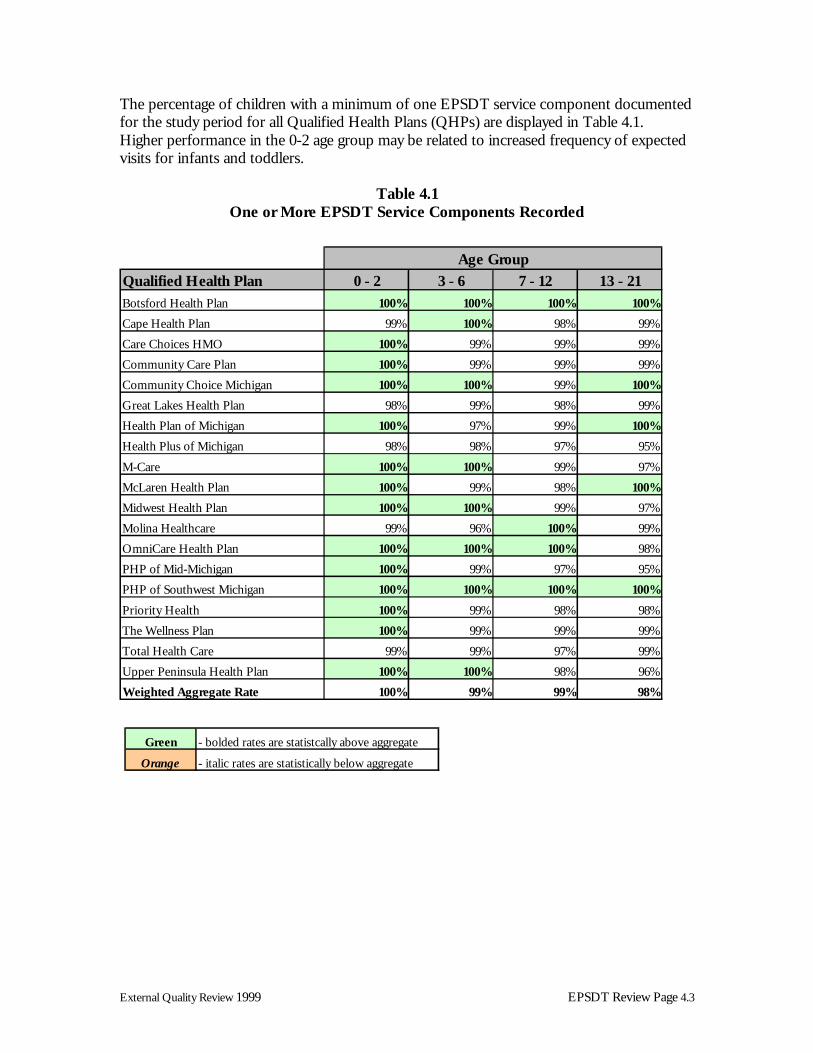
One or More EPSDT Service Components ➪ 100% of enrollees aged 0-2 received one or more EPSDT service components ➪ 99% of enrollees aged 3-6 received one or more EPSDT service components ➪ 99% of enrollees aged 7-12 received one or more EPSDT service components ➪ 98% of enrollees aged 13-21 received one or more EPSDT service components One or more EPSDT service components were provided during the review period for each of the studied age groups as noted in Table 4.1. Weighted aggregate findings from EQR 1999 indicated that one or more services were provided for 100% of enrolled children aged 0-2 years. For a similar population of children aged 0 to less than 2, 99% of medical records reviewed for both EQR 1999 and EQR 1998 included documentation of one or more service component. The QHP results were compared to aggregate rates using the two-tailed binomial Z test for statistical significance. In tables throughout this report, performance rates significantly above the weighted aggregate are displayed in bold green; rates below the weighted aggregate are presented in italic orange.
External Quality Review 1999 EPSDT Review Page 4.3
The percentage of children with a minimum of one EPSDT service component documented for the study period for all Qualified Health Plans (QHPs) are displayed in Table 4.1. Higher performance in the 0-2 age group may be related to increased frequency of expected visits for infants and toddlers.
Table 4.1 One or More EPSDT Service Components Recorded
Qualified Health Plan 0 - 2 3 - 6 7 - 12 13 - 21Botsford Health Plan 100% 100% 100% 100%
Cape Health Plan 99% 100% 98% 99%
Care Choices HMO 100% 99% 99% 99%
Community Care Plan 100% 99% 99% 99%
Community Choice Michigan 100% 100% 99% 100%
Great Lakes Health Plan 98% 99% 98% 99%
Health Plan of Michigan 100% 97% 99% 100%
Health Plus of Michigan 98% 98% 97% 95%
M-Care 100% 100% 99% 97%
McLaren Health Plan 100% 99% 98% 100%
Midwest Health Plan 100% 100% 99% 97%
Molina Healthcare 99% 96% 100% 99%
OmniCare Health Plan 100% 100% 100% 98%
PHP of Mid-Michigan 100% 99% 97% 95%
PHP of Southwest Michigan 100% 100% 100% 100%
Priority Health 100% 99% 98% 98%
The Wellness Plan 100% 99% 99% 99%
Total Health Care 99% 99% 97% 99%
Upper Peninsula Health Plan 100% 100% 98% 96%
Weighted Aggregate Rate 100% 99% 99% 98%
Age Group
Green - bolded rates are statistcally above aggregate
Orange - italic rates are statistically below aggregate

External Quality Review 1999 EPSDT Review Page 4.4
Multiple EPSDT Service Components EPSDT involves periodic examinations of children to provide early assessment and recognition of physical or mental problems and to provide health care treatment to address identified problems. It requires distinct, age-appropriate screening procedures and testing. Early detection and treatment are especially important for children who have developmental delays, emotional or behavioral problems, nutritional deficits, infections, and sensory problems related to hearing or vision. Specific components reviewed in this study included: § Initial or interval history § Immunization review § Height measurement § Weight measurement § Head circumference measurement § Blood pressure measurement § Vision screening § Hearing screening § Dental inspection § Interpretive conference § Nutritional assessment § Developmental assessment § Physical examination § Anticipatory guidance
Results displayed in Tables 4.2 through 4.15 identify the percentage of children who received the recommended age-specific services when indicated for each QHP. Initial/Interval History ➪ 76% of enrollees aged 0-2 received one or more initial/interval histories ➪ 68% of enrollees aged 3-6 received one or more initial/interval histories ➪ 58% of enrollees aged 7-12 received one or more initial/interval histories ➪ 59% of enrollees aged 13-21 received one or more initial/interval histories Initial and interval histories allow for an individualized plan of care and contribute to the coordination and continuity of services provided for each child. For children aged 0-2 years, 76% of records reviewed in EQR 1999 included an initial or interval history. However, comparison of similar populations of children aged 0 to less than 2 years revealed that 83% of records reviewed in EQR 1999 and 84% of records reviewed in EQR 1998 included an initial or interval history.

External Quality Review 1999 EPSDT Review Page 4.5
Medical records with the inclusion of a documented history demonstrated considerable variation among the QHPs. Performance rates for all QHPs are displayed in Table 4.2.
Table 4.2
One or More Initial/Interval Histories Recorded
Qualified Health Plan 0 - 2 3 - 6 7 - 1 2 13 - 21
Botsford Health Plan 67% 50% 50% 59%
Cape Health Plan 68% 68% 45% 51%
Care Choices HMO 92% 65% 68% 58%
Community Care Plan 80% 83% 53% 60%
Community Choice Michigan 84% 74% 64% 56%
Great Lakes Health Plan 79% 71% 60% 66%
Health Plan of Michigan 73% 52% 58% 72%
Health Plus of Michigan 64% 56% 47% 55%
M-Care 78% 78% 73% 67%
McLaren Health Plan 73% 67% 51% 45%
Midwest Health Plan 63% 55% 57% 50%
Molina Healthcare 76% 72% 72% 67%
OmniCare Health Plan 70% 62% 54% 54%
PHP of Mid-Michigan 71% 69% 65% 48%
PHP of Southwest Michigan 92% 73% 61% 56%
Priority Health 84% 71% 60% 57%
The Wellness Plan 79% 72% 60% 61%
Total Health Care 75% 68% 54% 65%
Upper Peninsula Health Plan 75% 70% 59% 63%
W eighted Aggregate Rate 76% 68% 58% 59%
A ge Group
Green - bolded rates are statistcally above aggregate
Orange - italic rates are statistically below aggregate

External Quality Review 1999 EPSDT Review Page 4.6
Immunization ➪ 85% of records of enrollees aged 0-2 documented immunization review ➪ 71% of records of enrollees aged 3-6 documented immunization review ➪ 48% of records of enrollees aged 7-12 documented immunization review ➪ 36% of records of enrollees aged 13-21 documented immunization review It is extremely important for the health care provider to review the immunization record of an enrollee to determine if further age-appropriate vaccinations are required. Results in Table 4.3 demonstrate a wide range of variability in the percentage of records that included a documented history of immunizations. Considerable differences were noted across age groups. This indicator was not measured in EQR 1998 so comparative data were not available. Results indicated that the immunization status was most frequently recorded for children aged 0-2, and least frequently recorded for those aged 13-21.
Table 4.3 Review of Immunization Status Recorded
Qualified Health Plan 0 - 2 3 - 6 7 - 12 13 - 21
Botsford Health Plan 94% 85% 59% 48%
Cape Health Plan 86% 75% 50% 32%
Care Choices HMO 92% 69% 49% 46%
Community Care Plan 81% 69% 33% 28%
Community Choice Michigan 90% 78% 55% 39%
Great Lakes Health Plan 87% 71% 47% 33%
Health Plan of Michigan 89% 66% 45% 46%
Health Plus of Michigan 80% 63% 43% 35%
M-Care 87% 80% 49% 43%
McLaren Health Plan 83% 52% 33% 24%
Midwest Health Plan 69% 78% 60% 31%
Molina Healthcare 58% 46% 19% 22%
OmniCare Health Plan 86% 69% 44% 38%
PHP of Mid-Michigan 85% 69% 42% 41%
PHP of Southwest Michigan 88% 80% 47% 32%
Priority Health 87% 64% 57% 42%
The Wellness Plan 89% 73% 56% 39%
Total Health Care 91% 80% 56% 48%
Upper Peninsula Health Plan 79% 64% 21% 22%
Weighted Aggregate Rate 85% 71% 48% 36%
Age Group
Green - bolded rates are statistcally above aggregate
Orange - italic rates are statistically below aggregate

External Quality Review 1999 EPSDT Review Page 4.7
Height Measurements ➪ 83% of enrollees aged 0-2 received one or more height measurements ➪ 78% of enrollees aged 3-6 received one or more height measurements ➪ 66% of enrollees aged 7-12 received one or more height measurements ➪ 56% of enrollees aged 13-21 received one or more height measurements For EQR 1999, height and weight measurements received were measured separately and findings are displayed in Tables 4.4 and 4.5. The combined measures in EQR 1998 indicated that height and weight were recorded for 93% of children aged 0 to less than 2 years. Height measurements, when compared to age-specific standards, provide useful information of a child’s growth and suggest additional evaluation when measurements deviate from the acceptable range. The adherence rate for one or more height measurements documented in the medical record is displayed in Table 4.4 for each QHP. For children aged 0-2 years, 83% of records included one or more height measurement compared to 56% of those aged 13-21.
Table 4.4 One or More Height Measurements Recorded
Qualified Health Plan 0 - 2 3 - 6 7 - 12 1 3 - 21
Botsford Health Plan 71% 65% 69% 65%
C ape Health Plan 84% 79% 76% 55%
C are Choices HMO 92% 73% 72% 58%
Community Care Plan 84% 84% 67% 55%
Community Choice Michigan 90% 81% 73% 56%
Great Lakes Health Plan 88% 89% 74% 63%
Health Plan of Michigan 74% 61% 67% 69%
Health Plus of Michigan 88% 77% 66% 56%
M-Care 78% 66% 56% 57%
McLaren Health Plan 88% 78% 57% 72%
Midwest Health Plan 82% 87% 76% 56%
Molina Healthcare 65% 75% 50% 41%
OmniCare Health Plan 94% 77% 95% 74%
PHP of Mid-Michigan 79% 71% 57% 53%
PHP of Southwest Michigan 82% 77% 66% 52%
Priority Health 89% 80% 73% 60%
The Wellness Plan 73% 76% 52% 47%
Total Health Care 90% 80% 71% 65%
Upper Peninsula Health Plan 76% 73% 65% 59%
W eighted Aggregate Rate 83% 78% 66% 56%
A ge Group
Green - bolded rates are statistcally above aggregate
Orange - italic rates are statistically below aggregate

External Quality Review 1999 EPSDT Review Page 4.8
Weight Measurement ➪ 97% of enrollees aged 0-2 received one or more weight measurements ➪ 96% of enrollees aged 3-6 received one or more weight measurements ➪ 93% of enrollees aged 7-12 received one or more weight measurements ➪ 92% of enrollees aged 13-21 received one or more weight measurements Weight measurements during childhood provide information of growth and development when compared to standards recommended by the AAP. Weight measurement findings outside of the acceptable standard may suggest further clinical evaluation and planned interventions to assist an enrollee in maintaining optimal health. The percentage of medical records with one or more weight measurements recorded demonstrated less variability among QHPs than findings for height measurement. For all age groups studied, the rate of adherence for this indicator was 92% or greater based on weighted averages, as shown in Table 4.5.
Table 4.5 One or More Weight Measurements Recorded
Qualified Health Plan 0 - 2 3 - 6 7 - 12 13 - 21Botsford Health Plan 100% 97% 97% 98%
Cape Health Plan 96% 99% 95% 88%
Care Choices HMO 99% 97% 91% 91%
Community Care Plan 96% 94% 91% 83%
Community Choice Michigan 98% 98% 93% 93%
Great Lakes Health Plan 96% 98% 94% 91%
Health Plan of Michigan 93% 74% 80% 84%
Health Plus of Michigan 94% 94% 83% 90%
M-Care 97% 94% 94% 89%
McLaren Health Plan 97% 94% 92% 96%
Midwest Health Plan 100% 99% 96% 86%
Molina Healthcare 94% 93% 97% 91%
OmniCare Health Plan 100% 95% 100% 93%
PHP of Mid-Michigan 95% 95% 91% 84%
PHP of Southwest Michigan 97% 97% 99% 98%
Priority Health 99% 99% 93% 93%
The Wellness Plan 99% 97% 94% 94%
Total Health Care 98% 97% 95% 98%
Upper Peninsula Health Plan 90% 96% 90% 89%
Weighted Aggregate Rate 97% 96% 93% 92%
Age Group
Green - bolded rates are statistcally above aggregate
Orange - italic rates are statistically below aggregate

External Quality Review 1999 EPSDT Review Page 4.9
Head Circumference Measurement ➪ 68% of medical records of enrollees aged 0-2 included one or more head
circumference measurement Measurement of head circumference is primarily applicable for children under age two and this was the only age group studied for EQR 1999. For children aged 0-2, head circumference was obtained for 68% of the population studied. Comparison of similar populations of children aged 0 to less than 2 indicated that 84% of records reviewed for EQR 1999 and 87% of EQR 1998 records included documentation of head circumference.
Table 4.6
One or More Head Circumference Recorded
Qualified Health Plan 0 - 2 3 - 6 7 - 12 13 - 21Botsford Health Plan 63%
Cape Health Plan 58%
Care Choices HMO 82%
Community Care Plan 70%
Community Choice Michigan 73%
Great Lakes Health Plan 66%
Health Plan of Michigan 63%
Health Plus of Michigan 64%
M-Care 73%
McLaren Health Plan 69%
Midwest Health Plan 52%
Molina Healthcare 60%
OmniCare Health Plan 66%
PHP of Mid-Michigan 58%
PHP of Southwest Michigan 77%
Priority Health 82%
The Wellness Plan 67%
Total Health Care 76%
Upper Peninsula Health Plan 66%
Weighted Aggregate Rate 68%
Age Group
Green - bolded rates are statistcally above aggregate
Orange - italic rates are statistically below aggregate

External Quality Review 1999 EPSDT Review Page 4.10
Blood Pressure Measurement ➪ 58% of enrollees aged 3-6 received one or more blood pressure measurements ➪ 56% of enrollees aged 7-12 received one or more blood pressure measurements ➪ 76% of enrollees aged 13-21 received one or more blood pressure measurements The EPSDT component of blood pressure measurement is recommended for children aged three years and older. Blood pressure readings higher or lower than standards accepted by AAP may suggest conditions of hypertension or hypotension. Abnormal findings are indicators for further clinical evaluation and planned interventions to maintain an optimal health status for the child. Detailed results are displayed in Table 4.7. Since this indicator was not reported for EQR 1998, comparative data were not available. Blood pressure measurements were obtained most frequently in the 13-21 age group, across all QHPs.
Table 4.7
One or More Blood Pressure Measurements Recorded
Qualified Health Plan 0 - 2 3 - 6 7 - 12 13 - 21Botsford Health Plan 48% 56% 74%
Cape Health Plan 50% 39% 60%
Care Choices HMO 51% 60% 81%
Community Care Plan 68% 62% 77%
Community Choice Michigan 68% 72% 89%
Great Lakes Health Plan 63% 69% 81%
Health Plan of Michigan 46% 49% 78%
Health Plus of Michigan 53% 49% 76%
M-Care 56% 54% 71%
McLaren Health Plan 49% 54% 80%
Midwest Health Plan 57% 53% 67%
Molina Healthcare 41% 51% 73%
OmniCare Health Plan 49% 49% 77%
PHP of Mid-Michigan 58% 63% 65%
PHP of Southwest Michigan 65% 61% 84%
Priority Health 63% 69% 80%
The Wellness Plan 63% 52% 72%
Total Health Care 55% 48% 78%
Upper Peninsula Health Plan 48% 59% 81%
Weighted Aggregate Rate 58% 56% 76%
Age Group
Green - bolded rates are statistcally above aggregate
Orange - italic rates are statistically below aggregate

External Quality Review 1999 EPSDT Review Page 4.11
Vision Screening ➪ 49% of enrollees aged 0-2 received one or more vision screenings ➪ 45% of enrollees aged 3-6 received one or more vision screenings ➪ 37% of enrollees aged 7-12 received one or more vision screenings ➪ 29% of enrollees aged 13-21 received one or more vision screenings Children who were screened by their health care provider and determined not to be at risk were excluded from the denominator. Early detection of visual difficulties enables health care providers to treat young patients early and potentially improve outcomes of planned interventions. Providers often screen visual acuity in the very young by observing an infant’s eyes “track” an object moved across his or her field of vision. Objective vision screening methods include the red reflex test, fixation test, or corneal light reflex test.

External Quality Review 1999 EPSDT Review Page 4.12
Adherence rates for this indicator are displayed in Table 4.8. EQR 1999 results indicated that 49% of children aged 0-2 received vision screening during the study period. In a similar population of children 0 to less than 2 years, vision screening was recorded in 57% of EQR 1999 medical records compared to 67% of EQR 1998 medical records. The 1999 performance rate decreased from the prior year. Vision screenings occurred most frequently among children aged 0-2 years and least frequently among enrollees aged 13-21.
Table 4.8 One or More Vision Screenings Recorded
Qualified Health Plan 0 - 2 3 - 6 7 - 12 13 - 21Botsford Health Plan 67% 55% 46% 46%
Cape Health Plan 36% 35% 15% 31%
Care Choices HMO 56% 32% 32% 21%
Community Care Plan 57% 71% 44% 28%
Community Choice Michigan 52% 47% 31% 27%
Great Lakes Health Plan 46% 48% 34% 30%
Health Plan of Michigan 31% 25% 35% 38%
Health Plus of Michigan 42% 39% 46% 39%
M-Care 51% 45% 34% 36%
McLaren Health Plan 51% 41% 30% 27%
Midwest Health Plan 36% 41% 39% 18%
Molina Healthcare 40% 24% 25% 31%
OmniCare Health Plan 39% 29% 39% 23%
PHP of Mid-Michigan 55% 43% 37% 31%
PHP of Southwest Michigan 76% 49% 37% 27%
Priority Health 51% 57% 47% 35%
The Wellness Plan 54% 54% 43% 26%
Total Health Care 58% 43% 41% 33%
Upper Peninsula Health Plan 28% 33% 13% 17%
Weighted Aggregate Rate 49% 45% 37% 29%
Age Group
Green - bolded rates are statistcally above aggregate
Orange - italic rates are statistically below aggregate

External Quality Review 1999 EPSDT Review Page 4.13
Hearing Screening ➪ 49% of enrollees aged 0-2 received one or more hearing screenings ➪ 50% of enrollees aged 3-6 received one or more one hearing screenings ➪ 49% of enrollees aged 7-12 received one or more hearing screenings ➪ 52% of enrollees aged 13-21 received one or more hearing screenings Identification of hearing difficulties at a young age allows for early interventions and reduction in the potential for developmental delays related to hearing deficits. Health care providers can assess an infant’s ability to hear by observing the child’s reaction to clapping or other noises. For more objective evaluation of hearing, health care providers may use methods including an otoacoustic emissions test or an auditory brainstem response. Documentation in the medical record of any age-appropriate subjective or objective hearing test by the health care provider was considered acceptable for this study.
During the EQR 1999 study period, 49% of medical records reviewed for enrollees aged 0-2 displayed evidence of hearing screening (see Table 4.9).

External Quality Review 1999 EPSDT Review Page 4.14
To allow for comparison of EQR 1998 and EQR 1999 findings for this indicator, data for a similar population of children 0 to less than 2 years were analyzed. In EQR 1999, 56% of this population received hearing screening compared to 63% in EQR 1998, demonstrating a decrease in performance in 1999 compared to 1998. Based on weighted averages, hearing screening tests occurred at comparable rates among all age groups.
Table 4.9 One or More Hearing Screenings Recorded
Qualified Health Plan 0 - 2 3 - 6 7 - 1 2 13 - 21
Botsford Health Plan 43% 57% 64% 69%
Cape Health Plan 42% 47% 50% 61%
Care Choices HMO 60% 43% 40% 40%
Community Care Plan 59% 64% 61% 68%
Community Choice Michigan 43% 54% 56% 54%
Great Lakes Health Plan 62% 57% 49% 52%
Health Plan of Michigan 29% 30% 61% 65%
Health Plus of Michigan 36% 43% 41% 48%
M-Care 56% 54% 37% 55%
McLaren Health Plan 58% 52% 34% 34%
Midwest Health Plan 35% 52% 49% 41%
Molina Healthcare 51% 39% 52% 60%
OmniCare Health Plan 42% 46% 44% 38%
PHP of Mid-Michigan 56% 51% 54% 53%
PHP of Southwest Michigan 66% 49% 54% 63%
Priority Health 65% 55% 58% 62%
The Wellness Plan 51% 54% 51% 52%
Total Health Care 53% 47% 47% 48%
Upper Peninsula Health Plan 25% 35% 48% 54%
Weighted Aggregate Rate 49% 50% 49% 52%
Age Group
Green - bolded rates are statistcally above aggregate
Orange - italic rates are statistically below aggregate

External Quality Review 1999 EPSDT Review Page 4.15
Dental Inspection ➪ 42% of enrollees aged 0-2 received one or more dental inspections ➪ 34% of enrollees aged 3-6 received one or more dental inspections ➪ 23% of enrollees aged 7-12 received one or more dental inspections ➪ 18% of enrollees aged 13-21 received one or more dental inspections Dental inspections assess the development and integrity of the child’s teeth and supportive tissues to determine problems or potential difficulties. Adherence rates for documentation of oral cavity inspections are displayed in Table 4.10. Of children aged 0-2 years, a dental inspection was recorded for 42% during the EQR 1999 study period. To allow for comparison of EQR 1998 and EQR 1999 findings for this indicator, data for a similar population of children 0 to less than 2 years was analyzed. The rate for dental inspection was 51%; the EQR 1998 rate was 46%. Weighted averages indicated that dental inspections occurred most frequently among children aged 0-2 and least frequently among those aged 13-21.
Table 4.10 One or More Dental Inspections Recorded
Qualified Health Plan 0 - 2 3 - 6 7 - 1 2 13 - 21
Botsford Health Plan 37% 25% 13% 19%
Cape Health Plan 23% 15% 16% 15%
Care Choices HMO 38% 27% 15% 12%
Community Care Plan 36% 21% 17% 17%
Community Choice Michigan 46% 38% 20% 16%
Great Lakes Health Plan 36% 40% 25% 19%
Health Plan of Michigan 27% 20% 18% 18%
Health Plus of Michigan 21% 20% 13% 7%
M-Care 37% 29% 14% 11%
McLaren Health Plan 17% 10% 3% 12%
Midwest Health Plan 76% 59% 48% 39%
Molina Healthcare 32% 16% 17% 12%
OmniCare Health Plan 38% 15% 11% 13%
PHP of Mid-Michigan 55% 39% 29% 23%
PHP of Southwest Michigan 42% 34% 24% 16%
Priority Health 42% 37% 24% 21%
The Wellness Plan 55% 49% 30% 23%
Total Health Care 48% 40% 35% 23%
Upper Peninsula Health Plan 32% 14% 8% 12%
Weighted Aggregate Rate 42% 34% 23% 18%
Age Group
Green - bolded rates are statistcally above aggregate
Orange - italic rates are statistically below aggregate

External Quality Review 1999 EPSDT Review Page 4.16
Interpretive Conference ➪ 75% of enrollees aged 0-2 received one or more interpretive conferences ➪ 65% of enrollees aged 3-6 received one or more interpretive conferences ➪ 54% of enrollees aged 7-12 received one or more interpretive conferences ➪ 51% of enrollees aged 13-21 received one or more interpretive conferences An interpretive conference occurs at the time of an office visit and is an opportunity for the health care provider to discuss clinical findings and planned interventions with the child’s parent. Likewise, the interpretive conference is intended to answer parent questions and clarify understanding of the child’s health needs.

External Quality Review 1999 EPSDT Review Page 4.17
Documentation of an interpretive conference was noted in 75% of the records reviewed for children aged 0-2 years for EQR 1999. A similar population of children aged 0 to less than 2 was analyzed to provide data more comparable to the previous EQR study. Results indicated that 81% of this population had a least one interpretive conference recorded in EQR 1999 compared to 78% in EQR 1998. This was not a statistically significant difference. Weighted averages indicated that interpretive conference occurred most frequently among children aged 0-2 and least frequently among those aged 13-21.
Table 4.11 One or More Interpretive Conferences Recorded
Qualified Health Plan 0 - 2 3 - 6 7 - 1 2 13 - 21
Botsford Health Plan 65% 47% 31% 44%
Cape Health Plan 59% 60% 41% 40%
Care Choices HMO 82% 69% 56% 60%
Community Care Plan 73% 73% 56% 59%
Community Choice Michigan 84% 86% 60% 49%
Great Lakes Health Plan 71% 54% 48% 44%
Health Plan of Michigan 73% 53% 59% 74%
Health Plus of Michigan 65% 56% 40% 39%
M-Care 77% 69% 48% 51%
McLaren Health Plan 73% 65% 54% 37%
Midwest Health Plan 81% 74% 60% 59%
Molina Healthcare 75% 71% 63% 60%
OmniCare Health Plan 73% 60% 54% 54%
PHP of Mid-Michigan 73% 66% 52% 47%
PHP of Southwest Michigan 86% 76% 67% 75%
Priority Health 87% 74% 64% 64%
The Wellness Plan 71% 66% 59% 48%
Total Health Care 80% 67% 53% 56%
Upper Peninsula Health Plan 82% 62% 49% 66%
Weighted Aggregate Rate 75% 65% 54% 51%
Age Group
Green - bolded rates are statistcally above aggregate
Orange - italic rates are statistically below aggregate

External Quality Review 1999 EPSDT Review Page 4.18
Nutritional Assessment ➪ 61% of records of enrollees aged 0-2 recorded one or more nutritional assessments ➪ 41% of records of enrollees aged 3-6 recorded one or more nutritional assessments ➪ 29% of records of enrollees aged 7-12 recorded one or more nutritional
assessments ➪ 22% of records of enrollees aged 13-21 recorded one or more nutritional
assessments Nutritional assessment is an important component of well child care. The health care provider should be aware of the enrollee’s nutritional intake and relate this information to other findings from the overall assessment. For a nutritional assessment, the health care provider reviews the child’s food intake and eating habits. The assessment considers the appropriateness of nutritional choices and the possible need for nutritional supplements. Results reported in Table 4.12 indicate that a nutritional assessment was most frequently documented in the medical records of enrollees aged 0-2. One or more nutritional assessments were recorded during the EQR 1999 review period for 61% of the children in this age group. Analysis of a similar population of children aged 0 to less than 2 reported that 73% of records reviewed in EQR 1999 met this indicator compared to 81% of EQR 1998 records.

External Quality Review 1999 EPSDT Review Page 4.19
The performance rate decreased in 1999 from the prior year. Weighted averages demonstrated that nutritional assessments occurred most frequently among children aged 0-2 years and least frequently among those aged 13-21.
Table 4.12
One or More Nutritional Assessments Recorded
Qualified Health Plan 0 - 2 3 - 6 7 - 1 2 13 - 21Botsford Health Plan 61% 35% 17% 33%
Cape Health Plan 30% 15% 14% 12%
Care Choices HMO 76% 57% 32% 27%
Community Care Plan 73% 51% 25% 24%
Community Choice Michigan 71% 48% 28% 29%
Great Lakes Health Plan 62% 42% 27% 20%
Health Plan of Michigan 49% 32% 31% 31%
Health Plus of Michigan 49% 31% 23% 19%
M-Care 74% 53% 35% 24%
McLaren Health Plan 66% 38% 21% 21%
Midwest Health Plan 53% 49% 34% 23%
Molina Healthcare 56% 24% 23% 17%
OmniCare Health Plan 45% 20% 19% 13%
PHP of Mid-Michigan 61% 51% 40% 30%
PHP of Southwest Michigan 85% 49% 26% 29%
Priority Health 84% 59% 47% 33%
The Wellness Plan 58% 48% 35% 17%
Total Health Care 56% 42% 32% 31%
Upper Peninsula Health Plan 72% 28% 15% 22%
W eighted Aggregate Rate 61% 41% 29% 22%
A ge Group
Green - bolded rates are statistcally above aggregate
Orange - italic rates are statistically below aggregate

External Quality Review 1999 EPSDT Review Page 4.20
Developmental Assessment ➪ 65% of enrollees aged 0-2 received one or more developmental assessments ➪ 47% of enrollees aged 3-6 received one or more developmental assessments ➪ 35% of enrollees aged 7-12 received one or more developmental assessments ➪ 30% of enrollees aged 13-21 received one or more developmental assessments A developmental assessment evaluates a child’s attainment of established milestones such as the ability to recognize shapes, first words, or crawling. Measurements of intellectual, psychosocial, and cognitive development might be included in developmental assessment as well as speech and language formation. Assessment documentation may include a listing of milestones achieved, a checklist of tasks the child is able to perform, or a formal assessment form including gross and fine motor skills.

External Quality Review 1999 EPSDT Review Page 4.21
Results for EQR 1999 documentation of developmental assessments are reported in Table 4.13. The highest level of adherence for this indicator occurred among children aged 0-2 with a developmental assessment recorded in 65% of records reviewed. In an analysis of a similar population of children aged 0 to less than 2, 79% of records reviewed for EQR 1998 met the indicator compared to 77% for EQR 1999. This was not a statistically significant difference. Weighted averages demonstrated that developmental assessments occurred most frequently among children aged 0-2 and least frequently among those aged 13-21.
Table 4.13 One or More Developmental Assessments Recorded
Qualified Health Plan 0 - 2 3 - 6 7 - 1 2 13 - 21Botsford Health Plan 59% 42% 29% 41%
Cape Health Plan 55% 38% 23% 23%
Care Choices HMO 75% 43% 37% 34%
Community Care Plan 71% 67% 28% 35%
Community Choice Michigan 78% 59% 37% 40%
Great Lakes Health Plan 68% 49% 35% 25%
Health Plan of Michigan 60% 25% 34% 39%
Health Plus of Michigan 51% 40% 27% 26%
M-Care 72% 49% 38% 35%
McLaren Health Plan 66% 51% 26% 25%
Midwest Health Plan 50% 44% 37% 27%
Molina Healthcare 57% 24% 26% 36%
OmniCare Health Plan 53% 32% 33% 26%
PHP of Mid-Michigan 68% 57% 45% 36%
PHP of Southwest Michigan 86% 62% 46% 35%
Priority Health 81% 64% 49% 44%
The Wellness Plan 61% 49% 37% 25%
Total Health Care 64% 44% 41% 37%
Upper Peninsula Health Plan 69% 35% 31% 30%
W eighted Aggregate Rate 65% 47% 35% 30%
A ge Group
Green - bolded rates are statistcally above aggregate
Orange - italic rates are statistically below aggregate

External Quality Review 1999 EPSDT Review Page 4.22
Physical Examination ➪ 70% of records of enrollees aged 0-2 included one or more physical examinations ➪ 60% of records of enrollees aged 3-6 included one or more physical examinations ➪ 45% of records of enrollees aged 7-12 included one or more physical examinations ➪ 39% of records of enrollees aged 13-21 included one or more physical
examinations A child’s physical examination minimally includes inspection of the eyes, ears, nose, throat, chest, abdomen, and extremities. Review findings for documentation of a physical examination for all QHPs across all age groups are reported in Table 4.14. The weighted aggregate rate for documentation of one or more physical examinations during the review period for children aged 0-2 was 70%. Analysis of a similar population of enrollees aged 0 to less than 2 demonstrated that 78% of records reviewed for EQR 1999 included a physical examination compared to 93% of EQR 1998 records. The performance rate decreased in 1999 from the prior year. Weighted averages demonstrated that physical examinations were recorded most frequently among children aged 0-2 years and least frequently among those aged 13-21.
Table 4.14 One or More Physical Examinations Recorded
Qualified Health Plan 0 - 2 3 - 6 7 - 1 2 13 - 21Botsford Health Plan 76% 63% 47% 54%
Cape Health Plan 68% 52% 34% 31%
Care Choices HMO 74% 52% 45% 39%
Community Care Plan 71% 71% 40% 37%
Community Choice Michigan 80% 72% 35% 37%
Great Lakes Health Plan 62% 55% 38% 42%
Health Plan of Michigan 66% 68% 56% 58%
Health Plus of Michigan 61% 52% 39% 37%
M-Care 73% 64% 43% 48%
McLaren Health Plan 68% 49% 18% 40%
Midwest Health Plan 82% 75% 53% 53%
Molina Healthcare 58% 34% 41% 30%
OmniCare Health Plan 71% 54% 58% 52%
PHP of Mid-Michigan 82% 71% 52% 47%
PHP of Southwest Michigan 82% 71% 53% 38%
Priority Health 78% 69% 53% 48%
The Wellness Plan 65% 60% 50% 28%
Total Health Care 73% 63% 54% 48%
Upper Peninsula Health Plan 69% 46% 23% 36%
W eighted Aggregate Rate 70% 60% 45% 39%
A ge Group
Green - bolded rates are statistcally above aggregate
Orange - italic rates are statistically below aggregate

External Quality Review 1999 EPSDT Review Page 4.23
Anticipatory Guidance ➪ 55% of enrollees aged 0-2 received anticipatory guidance ➪ 41% of enrollees aged 3-6 received anticipatory guidance ➪ 27% of enrollees aged 7-12 received anticipatory guidance ➪ 25% of enrollees aged 13-21 received anticipatory guidance A number of educational and informative services are essential components of well child care. Anticipatory guidance, or discussion of “anticipated conditions” that the parent or child may encounter in different age groups assists them in preparing for safety and developmental concerns. Educational information of approved safety seats, seat belt usage, and poison control measures anticipate the parent’s needs in providing a safe environment for their child. Information of age-specific physical growth and skills development assists parents in recognizing normal progress or areas of concern in their child’s development.

External Quality Review 1999 EPSDT Review Page 4.24
EQR 1999 results demonstrated considerable variation in documentation of anticipatory guidance as displayed in Table 4.15. For children aged 0-2 years, 55% of records reviewed included documentation of one or more anticipatory guidance. In a similar population of children aged 0 to less than 2, 66% of records reviewed for EQR 1999 met this indicator compared to 70% of those reviewed for EQR 1998. This was not a statistically significant difference. Weighted averages demonstrated that anticipatory guidance was recorded most frequently among children aged 0-2 years and least frequently among those aged 13-21.
Table 4.15 Anticipatory Guidance Recorded
Qualified Health Plan 0 - 2 3 - 6 7 - 1 2 13 - 21Botsford Health Plan 38% 30%
Cape Health Plan 26% 21%
Care Choices HMO 36% 27%
Community Care Plan 63% 22% 32%
75% 54% 33%
Great Lakes Health Plan 49% 27%
Health Plan of Michigan 46% 41% 35%
41% 32% 14%
M-Care 47% 29%
McLaren Health Plan 58% 26% 24%
55% 45% 31%
Molina Healthcare 11% 9%
OmniCare Health Plan 48% 28% 18%
65% 48% 31%
PHP of Southwest Michigan 53% 34%
Priority Health 73% 47% 40%
54% 42% 22%
Total Health Care 40% 34%
Upper Peninsula Health Plan 45% 10% 24%
55% 41% 25%
Green - bolded rates are statistcally above aggregate
- italic rates are statistically below aggregate

External Quality Review 1999 EPSDT Review Page 4.25
EPSDT Procedures Tuberculin Skin Testing ➪ 14% of enrollees aged 0-2 received one or more tuberculin skin tests ➪ 23% of enrollees aged 3-6 received one or more tuberculin skin tests A screening test for tuberculosis (TB) infection or disease should be performed for infants and children with identified high risk factors. Risk assessment focuses on children exposed to any relative, playmate, or other acquaintance with active or inactive TB. The Michigan Medicaid population of children aged 0-6 years was evaluated for TB testing in EQR 1999.

External Quality Review 1999 EPSDT Review Page 4.26
EQR 1999 results for enrollees are displayed in Table 4.16. Findings were not reported for children in the age groups 7-12 and 13-21. For children aged 0-2 years, 14% of records reviewed included documentation of one or more tuberculin skin tests. In a population of children aged 12-18 months, 12% of records reviewed for EQR 1999 met this indicator compared to 15% of those reviewed for EQR 1998. This finding represented no significant difference between years. The weighted aggregate rates of 14% and 23% may suggest an area for potential improvement among all QHPs.
Table 4.16 One or More Tuberculin Tests Recorded
Qualified Health Plan 0 - 2 3 - 6 7 - 12 13 - 21
25% 42%
Care Choices HMO 6% 9%
Community Care Plan 15% 6%
Community Choice Michigan 16% 18%
Great Lakes Health Plan 8% 22%
Health Plan of Michigan 26% 22%
Health Plus of Michigan 4% 9%
M-Care 12% 17%
McLaren Health Plan 2% 6%
Midwest Health Plan 19% 28%
Molina Healthcare 1% 1%
OmniCare Health Plan 18% 29%
PHP of Mid-Michigan 7% 4%
PHP of Southwest Michigan 5% 14%
Priority Health 9% 9%
The Wellness Plan 25% 39%
Total Health Care 24% 40%
Upper Peninsula Health Plan 1% 3%
Weighted Aggregate Rate 14% 23%
Age Group
Green - bolded rates are statistcally above aggregate
Orange - italic rates are statistically below aggregate

External Quality Review 1999 EPSDT Review Page 4.27
Blood Lead Level Testing ➪ 27% of at-risk children aged 0-2 received one or more blood lead level tests ➪ 25% of at-risk children aged 3-6 received one or more blood lead level tests Among environmental risks faced by children in the United States, lead poisoning is the number one hazard. It occurs most frequently in children under the age of six, and when undiagnosed or untreated may result in death. Early detection and treatment are essential since cognitive impairment associated with lead poisoning are only partially reversible when blood lead levels are successfully lowered. The most common sources of lead poisoning are paint found in older homes and leaded gasoline deposited in the soil. It is currently estimated that 75% of homes in the United States contain lead paint (Perkins, 1999). EQR 1999 results for screening of enrollees for blood lead level for all QHPs among children aged 0-6 are reported in Table 4.17. Screening for blood lead levels was not measured or reported for this population for EQR 1998. The weighted aggregate rates of 27% and 25% may suggest an area for potential improvement among all QHPs.
Table 4.17 One or More Blood Lead Tests Recorded
Qualified Health Plan 0 - 2 3 - 6 7 - 12 13 - 21
Botsford Health Plan 23% 45%
Cape Health Plan 29% 29%
Care Choices HMO 14% 17%
Community Care Plan 17% 13%
Community Choice Michigan 39% 32%
Great Lakes Health Plan 22% 20%
Health Plan of Michigan 16% 18%
Health Plus of Michigan 17% 11%
M-Care 12% 17%
McLaren Health Plan 10% 5%
Midwest Health Plan 27% 38%
Molina Healthcare 7% 10%
OmniCare Health Plan 31% 30%
PHP of Mid-Michigan 30% 14%
PHP of Southwest Michigan 23% 14%
Priority Health 35% 7%
The Wellness Plan 35% 38%
Total Health Care 31% 37%
Upper Peninsula Health Plan 15% 14%
Weighted Aggregate Rate 27% 25%
Age Group

External Quality Review 1999 EPSDT Review Page 4.28
Green - bolded rates are statistcally above aggregate
Orange - italic rates are statistically below aggregate
External Quality Review 1999 EPSDT Review Page 4.29
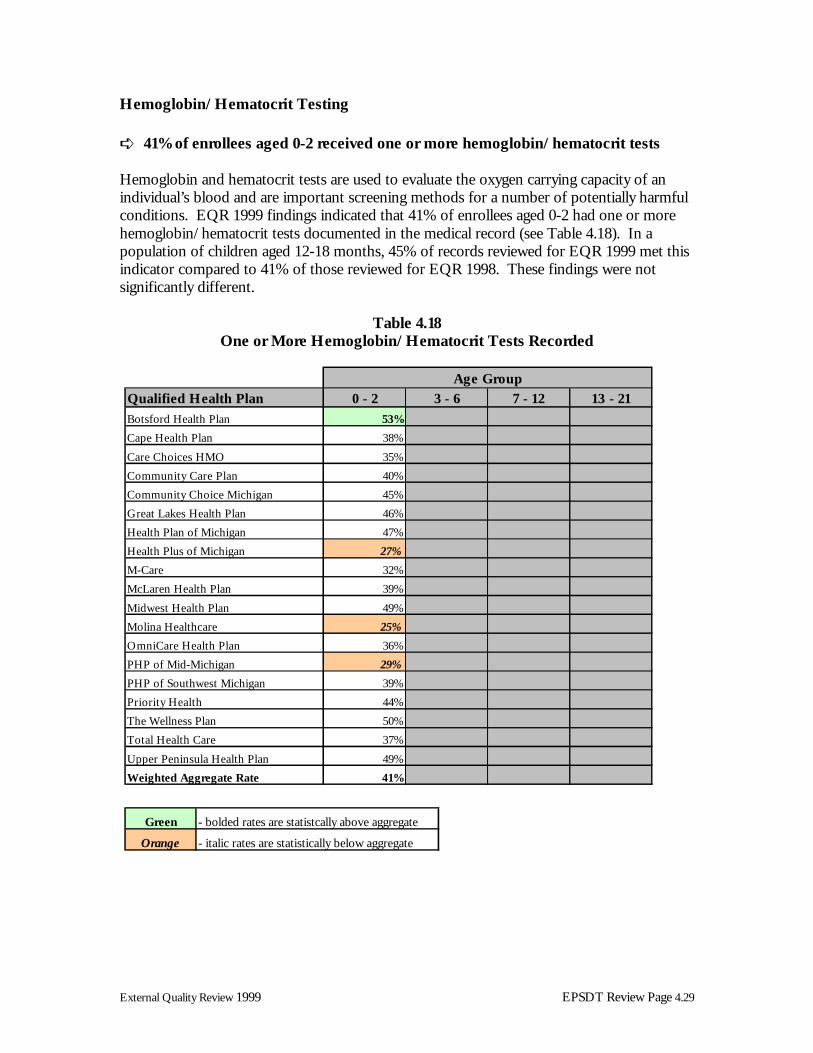
Hemoglobin/Hematocrit Testing ➪ 41% of enrollees aged 0-2 received one or more hemoglobin/hematocrit tests Hemoglobin and hematocrit tests are used to evaluate the oxygen carrying capacity of an individual’s blood and are important screening methods for a number of potentially harmful conditions. EQR 1999 findings indicated that 41% of enrollees aged 0-2 had one or more hemoglobin/hematocrit tests documented in the medical record (see Table 4.18). In a population of children aged 12-18 months, 45% of records reviewed for EQR 1999 met this indicator compared to 41% of those reviewed for EQR 1998. These findings were not significantly different.
Table 4.18 One or More Hemoglobin/Hematocrit Tests Recorded
Qualified Health Plan 0 - 2 3 - 6 7 - 12 13 - 21
Botsford Health Plan 53%
Cape Health Plan 38%
Care Choices HMO 35%
Community Care Plan 40%
Community Choice Michigan 45%
Great Lakes Health Plan 46%
Health Plan of Michigan 47%
Health Plus of Michigan 27%
M-Care 32%
McLaren Health Plan 39%
Midwest Health Plan 49%
Molina Healthcare 25%
OmniCare Health Plan 36%
PHP of Mid-Michigan 29%
PHP of Southwest Michigan 39%
Priority Health 44%
The Wellness Plan 50%
Total Health Care 37%
Upper Peninsula Health Plan 49%
Weighted Aggregate Rate 41%
Age Group
Green - bolded rates are statistcally above aggregate
Orange - italic rates are statistically below aggregate

External Quality Review 1999 EPSDT Review Page 4.30
Discussion
Because EQR 1999 included a broader range of children’s age groups (0-2, 3-6, 7-12, 13-21) not all findings were comparable
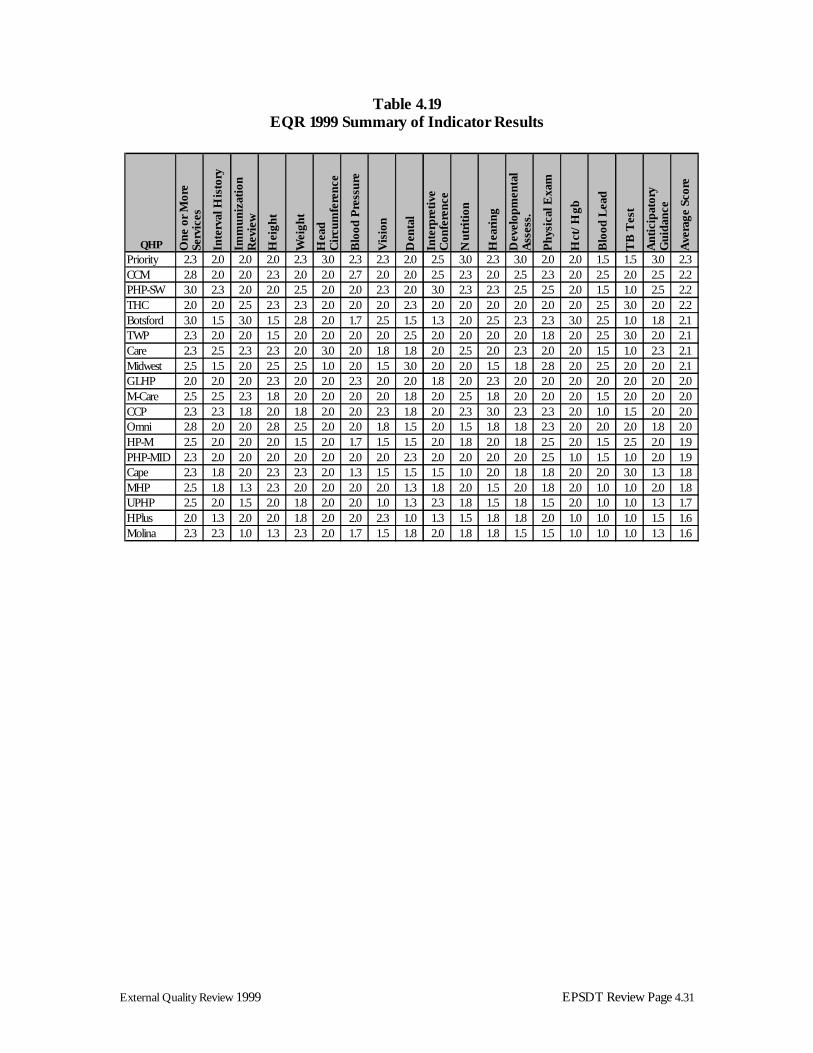
to past performance. Aggregate findings overall remained stable between EQR 1999 and EQR 1998 for the population of enrollees aged 0 to less than 2 among nine of 13 indicators with comparable data. Downward trends were noted for four indicators including hearing screening, vision screening, physical inspection, and nutritional assessment. The comparative differences for these indicators were in a range of 7% to 15%. Although data suggest a trend of improvement for three indicators including dental inspection, hemoglobin/hematocrit testing and interpretive conferences, these differences were not statistically significant. These indicators continued to be areas of lowest performance overall for EQR EPSDT 1999. The data from this focus study were used to calculate a score to determine the performance of each plan for each indicator. The maximum score for each indicator was three, with a minimum of one. A score of “three” was assigned when the rate for the plan for each indicator was statistically significantly higher than the weighted aggregate rate for that indicator. A score of “two” was assigned for rates similar to the weighted aggregate, and a score of “one” was assigned when the rate was significantly lower than the weighted aggregate. Scores were calculated for each age range and each indicator. An average was then calculated to determine a composite score for each QHP for the focus study. The QHPs were then sorted by score to determine the ranking of each plan within the range of scores. The four highest performing QHPs identified in the EPSDT Review were Priority Health Care, Community Choice Michigan, Physicians Health Plan of Southwest Michigan, and Total Health Care. Figure 4.19 displays QHP performance for the EQR EPSDT study, with highest ranking performances at the top.
External Quality Review 1999 EPSDT Review Page 4.31
Table 4.19 EQR 1999 Summary of Indicator Results
QHP One
or
Mor
e Se
rvic
es
Inte
rval
His
tory
Imm
uniz
atio
n R
evie
w
Hei
ght
Wei
ght
Hea
d C
ircu
mfe
renc
e
Blo
od P
ress
ure
Vis
ion
Den
tal
Inte
rpre
tive
C
onfe
renc
e
Nut
riti
on
Hea
ring
Dev
elop
men
tal
Ass
ess.
Phy
sica
l Exa
m
Hct
/Hgb
Blo
od L
ead
TB
Tes
t
Ant
icip
ator
y G
uida
nce
Ave
rage
Sco
re
Priority 2.3 2.0 2.0 2.0 2.3 3.0 2.3 2.3 2.0 2.5 3.0 2.3 3.0 2.0 2.0 1.5 1.5 3.0 2.3CCM 2.8 2.0 2.0 2.3 2.0 2.0 2.7 2.0 2.0 2.5 2.3 2.0 2.5 2.3 2.0 2.5 2.0 2.5 2.2PHP-SW 3.0 2.3 2.0 2.0 2.5 2.0 2.0 2.3 2.0 3.0 2.3 2.3 2.5 2.5 2.0 1.5 1.0 2.5 2.2THC 2.0 2.0 2.5 2.3 2.3 2.0 2.0 2.0 2.3 2.0 2.0 2.0 2.0 2.0 2.0 2.5 3.0 2.0 2.2Botsford 3.0 1.5 3.0 1.5 2.8 2.0 1.7 2.5 1.5 1.3 2.0 2.5 2.3 2.3 3.0 2.5 1.0 1.8 2.1TWP 2.3 2.0 2.0 1.5 2.0 2.0 2.0 2.0 2.5 2.0 2.0 2.0 2.0 1.8 2.0 2.5 3.0 2.0 2.1Care 2.3 2.5 2.3 2.3 2.0 3.0 2.0 1.8 1.8 2.0 2.5 2.0 2.3 2.0 2.0 1.5 1.0 2.3 2.1Midwest 2.5 1.5 2.0 2.5 2.5 1.0 2.0 1.5 3.0 2.0 2.0 1.5 1.8 2.8 2.0 2.5 2.0 2.0 2.1GLHP 2.0 2.0 2.0 2.3 2.0 2.0 2.3 2.0 2.0 1.8 2.0 2.3 2.0 2.0 2.0 2.0 2.0 2.0 2.0M-Care 2.5 2.5 2.3 1.8 2.0 2.0 2.0 2.0 1.8 2.0 2.5 1.8 2.0 2.0 2.0 1.5 2.0 2.0 2.0CCP 2.3 2.3 1.8 2.0 1.8 2.0 2.0 2.3 1.8 2.0 2.3 3.0 2.3 2.3 2.0 1.0 1.5 2.0 2.0Omni 2.8 2.0 2.0 2.8 2.5 2.0 2.0 1.8 1.5 2.0 1.5 1.8 1.8 2.3 2.0 2.0 2.0 1.8 2.0HP-M 2.5 2.0 2.0 2.0 1.5 2.0 1.7 1.5 1.5 2.0 1.8 2.0 1.8 2.5 2.0 1.5 2.5 2.0 1.9PHP-MID 2.3 2.0 2.0 2.0 2.0 2.0 2.0 2.0 2.3 2.0 2.0 2.0 2.0 2.5 1.0 1.5 1.0 2.0 1.9Cape 2.3 1.8 2.0 2.3 2.3 2.0 1.3 1.5 1.5 1.5 1.0 2.0 1.8 1.8 2.0 2.0 3.0 1.3 1.8MHP 2.5 1.8 1.3 2.3 2.0 2.0 2.0 2.0 1.3 1.8 2.0 1.5 2.0 1.8 2.0 1.0 1.0 2.0 1.8UPHP 2.5 2.0 1.5 2.0 1.8 2.0 2.0 1.0 1.3 2.3 1.8 1.5 1.8 1.5 2.0 1.0 1.0 1.3 1.7HPlus 2.0 1.3 2.0 2.0 1.8 2.0 2.0 2.3 1.0 1.3 1.5 1.8 1.8 2.0 1.0 1.0 1.0 1.5 1.6Molina 2.3 2.3 1.0 1.3 2.3 2.0 1.7 1.5 1.8 2.0 1.8 1.8 1.5 1.5 1.0 1.0 1.0 1.3 1.6

External Quality Review 1999 EPSDT Review Page 4.32
References
Olson, K., Perkins, J., & Pate, T. (1998). Children’s Health Under Medicaid [Web Page]. Available: http://nhelp.org/pubs/child1998healthxsum.html. [Accessed Jan 2000]. Perkins, J. (1999). The Child Health Law and Policy Project of the National Health Law Program [Web Page]. Available: http://www.healthlaw.org/pubs/199911leadweek.html. [Accessed Jan 2001].

Page: 1 [KN1]LINKS ARE NOT AUTOMATICALLY UPDATED – NEED TO DO MANUALLY