equalization of medipix2 imaging detector energy thresholds
TRANSCRIPT

Journal of Instrumentation
Equalization of Medipix2 imaging detector energythresholds using measurement of polychromatic X-ray beam attenuationTo cite this article J Uher and J Jakubek 2011 JINST 6 C11012
View the article online for updates and enhancements
You may also likeEqualization of Medipix family detectorenergy thresholds using X-ray tubespectrum high energy cut-offD Kozhevnikov and P Smolyanskiy
-
Improved-RPC for the CMS muon systemupgrade for the HL-LHCP Kumari KS Lee A Gelmi et al
-
The CMS RPC detector performance andstability during LHC RUN-2MA Shah R Hadjiska A Fagot et al
-
Recent citationsTimepix3 Temperature influence on X-raymeasurements in counting mode with SisensorMartin Urban and Daniela Doubravovaacute
-
Equalization of Medipix family detectorenergy thresholds using X-ray tubespectrum high energy cut-offD Kozhevnikov and P Smolyanskiy
-
Tutorial on X-ray photon counting detectorcharacterizationLiqiang Ren et al
-
This content was downloaded from IP address 12118977170 on 08112021 at 0405
2011 JINST 6 C11012
PUBLISHED BY IOP PUBLISHING FOR SISSA
RECEIVED September 15 2011REVISED October 23 2011
ACCEPTED November 9 2011PUBLISHED November 16 2011
13th INTERNATIONAL WORKSHOP ON RADIATION IMAGING DETECTORS3ndash7 JULY 2011ETH ZURICH SWITZERLAND
Equalization of Medipix2 imaging detector energythresholds using measurement of polychromaticX-ray beam attenuation
J Uherab1 J Jakubekc
aCSIRO Process Science and EngineeringLucas Heights NSW Australia
bCSIRO Minerals Down UnderNational Research Flagship Australia
cIEAP-CTUHorska 3a22 Prague Czech Republic
E-mail josefuhercsiroau
ABSTRACT The single photon counting pixel detector Medipix2 is a powerful tool for energyresolved X-ray imaging It allows the energies of incoming X-rays to be discriminated by settingan energy threshold common to all pixels As the parameters of individual pixels vary each pixelfurther contains a 3-bit digital-to-analogue converter (DAC) adjustment Values of these DACsare traditionally determined by finding the noise floor in each pixel Our approach is based ona polychromatic X-ray beam attenuation measurement An attenuation curve is measured usingvarying thickness of aluminium foil The attenuation curve is fitted in each pixel with a functioncalculating the detected signal Free parameters of the fit are the beam intensity and the energythreshold The measurement is done twice with the threshold adjustment set to minimum respmaximum value in all pixels The result is a calibration of the adjustment DACs allowing thevalue of the adjustment DAC in each pixel to be found such that the dispersion of energy thresholdsbetween pixels is minimized It is a fast and simple to use method that does not require modificationof the imaging setup It will be shown that it reduces the dispersion of threshold values by up to40 compared to the noise-floor based technique of equalization
KEYWORDS X-ray detectors Detector alignment and calibration methods (lasers sources particle-beams) X-ray radiography and digital radiography (DR)
1Corresponding author
ccopy 2011 IOP Publishing Ltd and SISSA doi1010881748-0221611C11012
2011 JINST 6 C11012
Contents
1 Introduction 1
2 Calculation of polychromatic X-ray beam attenuation curve 2
3 Threshold equalization 4
4 Improvement of signal uniformity in X-ray images 5
5 Conclusion 6
1 Introduction
We are focusing our research on material resolved X-ray transmission micro-imaging We areessentially trying to associate colours to materials identified in X-ray images by analysing thetransmission spectrum of X-rays [1] These techniques are based on the single photon countingimaging detectors Medipix [2] and allow discrimination of elements that differ by as little as onlyone atomic number [1] However achieving such result requires very good characterisation andcalibration of the X-ray imaging setup the Medipix2 detector in particular
The detector used in the presented work was Medipix2 in version MXR [2] Medipix2 is ahybrid pixel detector with array of 256times256 pixels with pitch of 55 microm The total sensitive areais 14times14 cm2 Each pixel contains its own electronics consisting of an amplifier discriminator(energy threshold) and 13-bit counter The device we used in our experiments has a 300 microm thicksilicon sensor
The energy discrimination threshold is set the same for all pixels However the parameters ofelectronics slightly vary from pixel to pixel Therefore each pixel contains 3-bit threshold adjust-ment to set offset of the energy discrimination digital-to-analogue converter (DAC) individuallyThis helps to obtain a uniform response from the pixels
Traditionally the 3-bit threshold adjustment is found using the noise floor of the readoutchip [3] This technique of threshold equalization is implemented in the Pixelman software [4]that has become a standard for Medipix detector readout and control It has been shown that thisprocedure of threshold equalization is sufficient for low energy thresholds just above the noisefloor However the 3-bit individual per-pixel adjustment only provides correction of the energythreshold offset and not correction of the pixel-to-pixel amplifier gain variation Therefore as itwill be shown later it is not suitable for cases where the threshold is set to higher energy fur-ther above the noise floor This problem has been tackled by the application of mono-energeticX-rays based threshold equalization [5] That equalization technique reduced the spread of thresh-old values by about 38 at a threshold level of 21 keV Nevertheless the latter technique requireschanges to the X-ray imaging setup by placing the detector in a position suitable for detection of the
ndash 1 ndash
2011 JINST 6 C11012
mono-energetic X-rays (usually X-ray fluorescences) Moreover the reasonably achievable flux ofmono-energetic X-rays is usually quite low and therefore this equalization technique is also rathertime consuming
We present a new threshold equalization technique that is based on the detection of a polychro-matic X-ray beam emitted directly from the X-ray tube Our approach utilizes the characterisationof polychromatic X-ray beam attenuation curves It allows the true X-ray energy discriminationthreshold to be determined on a per-pixel basis and therefore finding an optimal value of the 3-bitthreshold adjustment The steps of the new technique are
1) setting all 3-bit threshold adjustments to minimum (0)
2) measuring X-ray attenuation curves in aluminium foils
3) fitting the attenuation curves measured in individual pixels with a model of the attenuationobtaining true values of thresholds in all pixels
4) setting all 3-bit threshold adjustments to maximum (7)
5) measuring X-ray attenuation curves in aluminium foils
6) fitting the attenuation curves measured in individual pixels
7) finding a settings of the 3-bit adjustments in all pixels using results of steps 3) and 6) suchthat the spread of true threshold values between individual pixels is minimal
The presented technique does not require changes in the position of the detector within theX-ray imaging setup and it is considerably faster as it uses the primary beam of the X-ray tube
2 Calculation of polychromatic X-ray beam attenuation curve
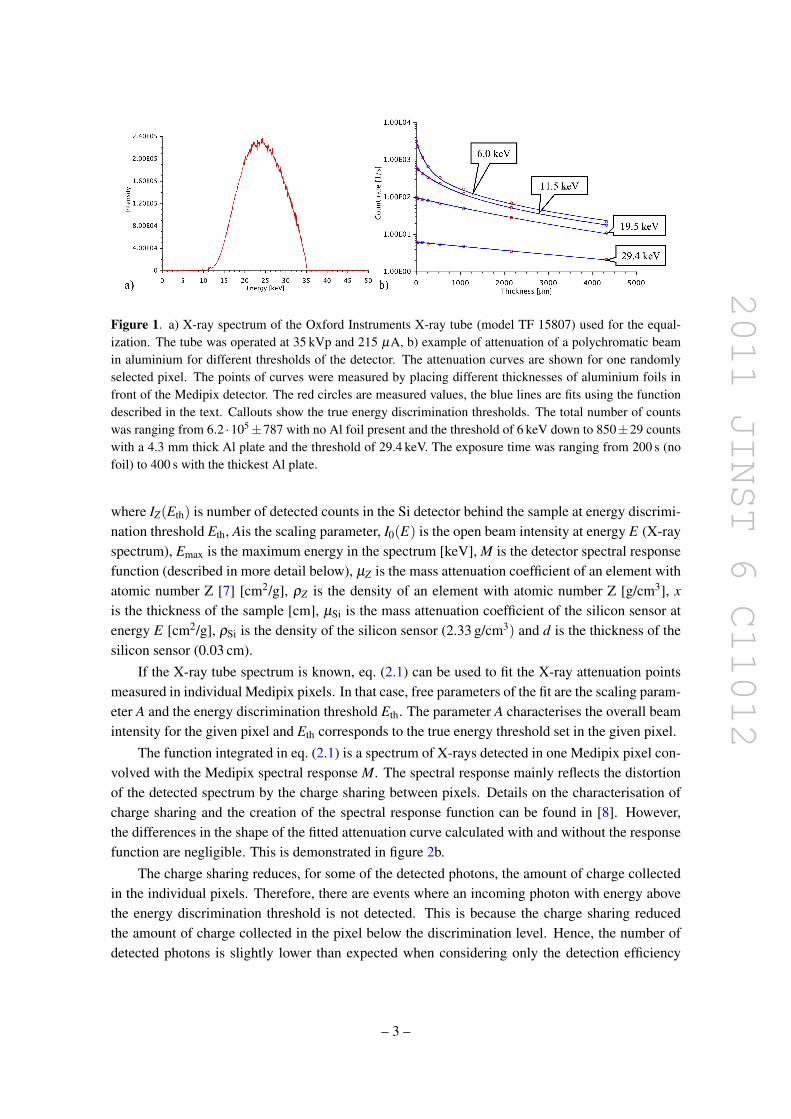
The X-ray tubes used for imaging generate X-rays through Bremsstrahlung The emitted spectrumis continuous and contains depending on the tube exit window X-ray energies from (nearly) zeroup the energy corresponding to the electron accelerating voltage of the tube The X-ray tube spec-trum used for the equalization described here is shown in figure 1a Photons of different energyare attenuated at different level and therefore the overall attenuation of the beam is not exponentialThis leads to the well-know effect of beam-hardening [6] The beam-hardening effect can be usedto identify materials contained in the sample [1] or characterize the energy sensitivity of the de-tector (ie the energy threshold set) An example of X-ray attenuation curves for aluminium withexperimental data measured by Medipix is shown in figure 1b It is clearly visible that the shapeof the curve depends on the energy discrimination threshold applied in the detector However thethreshold is set in values of the digital-to-analogue converter Hence the precise true thresholdvalue in keV may not be known Analysis of the shape of attenuation curves can give informationabout the true set energy discrimination threshold value
The signal (number of counts) detected in a pixel in the detector for an element with atomicnumber Z is calculated using
IZ (Eth) = AEmaxintEth
[M lowast
[I0 (E) middot eminusmicroZ(E)ρZx middot
(1minus eminusmicroSi(E)ρSid
)]]dE (21)
ndash 2 ndash
2011 JINST 6 C11012
Figure 1 a) X-ray spectrum of the Oxford Instruments X-ray tube (model TF 15807) used for the equal-ization The tube was operated at 35 kVp and 215 microA b) example of attenuation of a polychromatic beamin aluminium for different thresholds of the detector The attenuation curves are shown for one randomlyselected pixel The points of curves were measured by placing different thicknesses of aluminium foils infront of the Medipix detector The red circles are measured values the blue lines are fits using the functiondescribed in the text Callouts show the true energy discrimination thresholds The total number of countswas ranging from 62 middot105plusmn787 with no Al foil present and the threshold of 6 keV down to 850plusmn29 countswith a 43 mm thick Al plate and the threshold of 294 keV The exposure time was ranging from 200 s (nofoil) to 400 s with the thickest Al plate
where IZ(Eth) is number of detected counts in the Si detector behind the sample at energy discrimi-nation threshold Eth Ais the scaling parameter I0(E) is the open beam intensity at energy E (X-rayspectrum) Emax is the maximum energy in the spectrum [keV] M is the detector spectral responsefunction (described in more detail below) microZ is the mass attenuation coefficient of an element withatomic number Z [7] [cm2g] ρZ is the density of an element with atomic number Z [gcm3] xis the thickness of the sample [cm] microSi is the mass attenuation coefficient of the silicon sensor atenergy E [cm2g] ρSi is the density of the silicon sensor (233 gcm3) and d is the thickness of thesilicon sensor (003 cm)
If the X-ray tube spectrum is known eq (21) can be used to fit the X-ray attenuation pointsmeasured in individual Medipix pixels In that case free parameters of the fit are the scaling param-eter A and the energy discrimination threshold Eth The parameter A characterises the overall beamintensity for the given pixel and Eth corresponds to the true energy threshold set in the given pixel
The function integrated in eq (21) is a spectrum of X-rays detected in one Medipix pixel con-volved with the Medipix spectral response M The spectral response mainly reflects the distortionof the detected spectrum by the charge sharing between pixels Details on the characterisation ofcharge sharing and the creation of the spectral response function can be found in [8] Howeverthe differences in the shape of the fitted attenuation curve calculated with and without the responsefunction are negligible This is demonstrated in figure 2b
The charge sharing reduces for some of the detected photons the amount of charge collectedin the individual pixels Therefore there are events where an incoming photon with energy abovethe energy discrimination threshold is not detected This is because the charge sharing reducedthe amount of charge collected in the pixel below the discrimination level Hence the number ofdetected photons is slightly lower than expected when considering only the detection efficiency
ndash 3 ndash
2011 JINST 6 C11012
Figure 2 a) measured attenuation curve (circles) fitted with the function in eq (21) that included the detec-tor spectral response (blue line) and did not include the spectral response (red line nevertheless overlappedby the blue line) b) fit residuals mdash blue with the response matrix and red without
of the 300 microm thick Silicon sensor The Medipix energy response function in the eq (21) takesthis into account The threshold found by the fit is therefore slightly higher if the energy responseis omitted from the eq (21) The higher value of the threshold ldquocompensatesrdquo for the missingphotons The threshold found for the case in figure 2 with the detector response included was175 keV The result was 191 keV when the response was omitted The presented technique ofthreshold equalization considers only differences between the found values of thresholds at valuesof the individual pixel adjustment bits of 0 and 7 Therefore it is not sensitive to the systematicoffsets of found thresholds The detector energy response could therefore be neglected and thetechnique of threshold equalization greatly simplified
3 Threshold equalization
The attenuation curve fitting was implemented in the in-house developed data analysis softwareDataMaster [9] that has been over time extended by modules for X-ray image analysis Fittingall 65k pixels takes about 5 minutes on 266 GHz dual core Intel processor Results of individualsteps of the described threshold equalization procedure are shown in figure 3 The final valuesof equalization bits in pixels were found such that the resulting distribution of thresholds had itsmean value in the middle of threshold distributions with the adjustment bits set to value of 0 and 7Figure 3 also contains the distribution of energy discrimination thresholds (also determined byfitting of the attenuation curves) for the chip equalized using the noise floor The full-width-at-half-maximum (FWHM) of this distribution was 14 keV The FWHM value of the threshold distributionfor the chip equalized using the presented technique was 11 keV The values of full-width-at-tenth-maximum (FWTM) were 27 keV vs 16 keV in favour of the new technique Each method ofequalization leads to a slightly different offset of the final distribution of equalized thresholds asvisible in figure 3 This offset can be compensated in the final X-ray image acquisition by adjustingthe threshold DAC value
ndash 4 ndash
2011 JINST 6 C11012
Figure 3 Distributions of found thresholds red mdash all adjustment bits set to 7 blue mdash all adjustment bitsset to 0 black mdash thresholds equalized using the polychromatic beam green mdash thresholds equalized usingthe noise floor The DAC of the energy threshold was set to value of 350 in both cases
4 Improvement of signal uniformity in X-ray images
The improvement in image quality thanks to the presented equalization technique is demonstratedin figure 4 The image shows the signal measured behind a 25 microm thick Sn foil The energydiscrimination threshold was set to an average value of 27 keV and the X-ray tube voltage was setto 50 kVp The threshold value was chosen to be close to the k-edge of Sn which is 292 keV [7]Setting the threshold as close to the k-edge as possible improves the quality and reliability of thematerial resolved imaging See [1] for details Even though the average threshold value is belowthe energy of the k-edge some of the pixels fall with their true energy threshold above the energyof the k-edge This causes a significant drop in the number of measured counts in these pixelsThe wider spread of threshold values with the chip equalized using the noise floor leads to a highernon-uniformity of the image The presented equalization technique reduces the spread of countsby 40 in this case
It could be argued that the non-uniformity of the detector response in figure 4 could be cor-rected using the flat-field correction or the signal-to-equivalent thickness calibration (STC whichprovides better results than the flat-field correction [6]) Figure 5 shows that the new thresholdequalization technique actually also improves quality of the STC calibrated images
The STC method relies on similarities in the shapes of X-ray attenuation coefficients as func-tions of energy Therefore it satisfactorily corrects non-uniformities in cases where the energy dis-crimination threshold is far enough from the abrupt changes in the attenuation coefficients causedby the k and l-edges However in cases where the energy discrimination threshold is set close tothe energy of k or l-edge higher image uniformity has to be achieved by a better equalization ofthe sensor
ndash 5 ndash
2011 JINST 6 C11012
Figure 4 Histograms and images of the measured number of counts behind a 25 microm thick Sn foil Grey mdashwith the noise based threshold equalization black mdash with the polychromatic X-rays based technique Theenergy threshold was set to value of about 27 keV FWHM of the distribution with noise-based equalizationwas 6650 counts vs 4060 counts in the case of new equalization technique The FWTM was 12700 vs 7600in favour of the new equalization technique
Figure 5 Histograms and images of a 25 microm thick Sn foil after the signal-to-equivalent thickness calibrationThe FWHM of the final distribution was improved by the new equalization technique from 723 to 634 microm(12 improvement) and the FWTM from 1671 to 1099 microm (34 improvement)
5 Conclusion
We have presented a technique of energy discrimination threshold equalization that is based onthe analysis of polychromatic beam attenuation in aluminium foils The FWHM of the thresholdspread with the new equalization technique is about 20 lower compared to the noise-floor basedequalization FWTM values are improved by 40 Our threshold equalization technique com-pared to the mono-energetic X-rays based equalization [5] can be applied without re-arrangingthe X-ray imaging setup The presented threshold equalization procedure is considerably faster(minutes vs hours) thanks to the significantly higher available photon flux in the direct beam of theX-ray tube
Implementation of the new technique utilizes existing mechanical devices for the STC calibra-tion [10] Therefore it can be easily entirely automatized
ndash 6 ndash
2011 JINST 6 C11012
The new threshold equalization technique finds the major application in the material resolvedimaging where it helps to improve the pixel-to-pixel uniformity of the imaging detector
Acknowledgments
We acknowledge the support of CERN Medipix Collaboration in providing a Medixpix2 detectorfor use in these experiments
References
[1] J Uher J Jakubek S Mayo A Stevenson and JTickner X-ray beam hardening based materialrecognition in micro-imaging 2011 JINST 6 P08015
[2] httpmedipixwebcernchMEDIPIX
[3] L Tlustos et al Imaging Properties of the Medipix2 System exploiting Single and Dual EnergyThresholds IEEE T Nuc Sci 53 (2006) 367
[4] T Holy J Jakubek S Pospisil J Uher D Vavrik and Z Vykydal Data acquisition and processingsoftware package for Medipix2 Nucl Instrum Methods A 563 (2006) 254
[5] S Procz J Lubke A Zwerger M Mix and M Fiederle Optimization of Medipix-2 Threshold Masksfor Spectroscopic X-Ray Imaging IEEE T Nuc Sci 56 (2009) 1795
[6] J Jakubek Data processing and image reconstruction methods for pixel detectors Nuc InstrumMethods A 576 (2007) 223
[7] httpphysicsnistgov
[8] J Uher G Harvey and J Jakubek X-ray fluorescence imaging with the Medipix2 single-photoncounting detector IEE Nuclear Science Symposium Conference Record (NSSMIC) (2010)
[9] J Uher G Roach and J Tickner Peak fitting and identification software library for high resolutiongamma-ray spectra Nuc Instrum Methods A 619 (2010) 459
[10] J Jakubek T Holy M Jakubek D Vavrik and Z Vykydal Experimental system for high resolutionX-ray transmission radiography Nuc Instrum Methods A 563 (2006) 278
ndash 7 ndash
- Introduction
- Calculation of polychromatic X-ray beam attenuation curve
- Threshold equalization
- Improvement of signal uniformity in X-ray images
- Conclusion
-
2011 JINST 6 C11012
PUBLISHED BY IOP PUBLISHING FOR SISSA
RECEIVED September 15 2011REVISED October 23 2011
ACCEPTED November 9 2011PUBLISHED November 16 2011
13th INTERNATIONAL WORKSHOP ON RADIATION IMAGING DETECTORS3ndash7 JULY 2011ETH ZURICH SWITZERLAND
Equalization of Medipix2 imaging detector energythresholds using measurement of polychromaticX-ray beam attenuation
J Uherab1 J Jakubekc
aCSIRO Process Science and EngineeringLucas Heights NSW Australia
bCSIRO Minerals Down UnderNational Research Flagship Australia
cIEAP-CTUHorska 3a22 Prague Czech Republic
E-mail josefuhercsiroau
ABSTRACT The single photon counting pixel detector Medipix2 is a powerful tool for energyresolved X-ray imaging It allows the energies of incoming X-rays to be discriminated by settingan energy threshold common to all pixels As the parameters of individual pixels vary each pixelfurther contains a 3-bit digital-to-analogue converter (DAC) adjustment Values of these DACsare traditionally determined by finding the noise floor in each pixel Our approach is based ona polychromatic X-ray beam attenuation measurement An attenuation curve is measured usingvarying thickness of aluminium foil The attenuation curve is fitted in each pixel with a functioncalculating the detected signal Free parameters of the fit are the beam intensity and the energythreshold The measurement is done twice with the threshold adjustment set to minimum respmaximum value in all pixels The result is a calibration of the adjustment DACs allowing thevalue of the adjustment DAC in each pixel to be found such that the dispersion of energy thresholdsbetween pixels is minimized It is a fast and simple to use method that does not require modificationof the imaging setup It will be shown that it reduces the dispersion of threshold values by up to40 compared to the noise-floor based technique of equalization
KEYWORDS X-ray detectors Detector alignment and calibration methods (lasers sources particle-beams) X-ray radiography and digital radiography (DR)
1Corresponding author
ccopy 2011 IOP Publishing Ltd and SISSA doi1010881748-0221611C11012
2011 JINST 6 C11012
Contents
1 Introduction 1
2 Calculation of polychromatic X-ray beam attenuation curve 2
3 Threshold equalization 4
4 Improvement of signal uniformity in X-ray images 5
5 Conclusion 6
1 Introduction
We are focusing our research on material resolved X-ray transmission micro-imaging We areessentially trying to associate colours to materials identified in X-ray images by analysing thetransmission spectrum of X-rays [1] These techniques are based on the single photon countingimaging detectors Medipix [2] and allow discrimination of elements that differ by as little as onlyone atomic number [1] However achieving such result requires very good characterisation andcalibration of the X-ray imaging setup the Medipix2 detector in particular
The detector used in the presented work was Medipix2 in version MXR [2] Medipix2 is ahybrid pixel detector with array of 256times256 pixels with pitch of 55 microm The total sensitive areais 14times14 cm2 Each pixel contains its own electronics consisting of an amplifier discriminator(energy threshold) and 13-bit counter The device we used in our experiments has a 300 microm thicksilicon sensor
The energy discrimination threshold is set the same for all pixels However the parameters ofelectronics slightly vary from pixel to pixel Therefore each pixel contains 3-bit threshold adjust-ment to set offset of the energy discrimination digital-to-analogue converter (DAC) individuallyThis helps to obtain a uniform response from the pixels
Traditionally the 3-bit threshold adjustment is found using the noise floor of the readoutchip [3] This technique of threshold equalization is implemented in the Pixelman software [4]that has become a standard for Medipix detector readout and control It has been shown that thisprocedure of threshold equalization is sufficient for low energy thresholds just above the noisefloor However the 3-bit individual per-pixel adjustment only provides correction of the energythreshold offset and not correction of the pixel-to-pixel amplifier gain variation Therefore as itwill be shown later it is not suitable for cases where the threshold is set to higher energy fur-ther above the noise floor This problem has been tackled by the application of mono-energeticX-rays based threshold equalization [5] That equalization technique reduced the spread of thresh-old values by about 38 at a threshold level of 21 keV Nevertheless the latter technique requireschanges to the X-ray imaging setup by placing the detector in a position suitable for detection of the
ndash 1 ndash
2011 JINST 6 C11012
mono-energetic X-rays (usually X-ray fluorescences) Moreover the reasonably achievable flux ofmono-energetic X-rays is usually quite low and therefore this equalization technique is also rathertime consuming
We present a new threshold equalization technique that is based on the detection of a polychro-matic X-ray beam emitted directly from the X-ray tube Our approach utilizes the characterisationof polychromatic X-ray beam attenuation curves It allows the true X-ray energy discriminationthreshold to be determined on a per-pixel basis and therefore finding an optimal value of the 3-bitthreshold adjustment The steps of the new technique are
1) setting all 3-bit threshold adjustments to minimum (0)
2) measuring X-ray attenuation curves in aluminium foils
3) fitting the attenuation curves measured in individual pixels with a model of the attenuationobtaining true values of thresholds in all pixels
4) setting all 3-bit threshold adjustments to maximum (7)
5) measuring X-ray attenuation curves in aluminium foils
6) fitting the attenuation curves measured in individual pixels
7) finding a settings of the 3-bit adjustments in all pixels using results of steps 3) and 6) suchthat the spread of true threshold values between individual pixels is minimal
The presented technique does not require changes in the position of the detector within theX-ray imaging setup and it is considerably faster as it uses the primary beam of the X-ray tube
2 Calculation of polychromatic X-ray beam attenuation curve
The X-ray tubes used for imaging generate X-rays through Bremsstrahlung The emitted spectrumis continuous and contains depending on the tube exit window X-ray energies from (nearly) zeroup the energy corresponding to the electron accelerating voltage of the tube The X-ray tube spec-trum used for the equalization described here is shown in figure 1a Photons of different energyare attenuated at different level and therefore the overall attenuation of the beam is not exponentialThis leads to the well-know effect of beam-hardening [6] The beam-hardening effect can be usedto identify materials contained in the sample [1] or characterize the energy sensitivity of the de-tector (ie the energy threshold set) An example of X-ray attenuation curves for aluminium withexperimental data measured by Medipix is shown in figure 1b It is clearly visible that the shapeof the curve depends on the energy discrimination threshold applied in the detector However thethreshold is set in values of the digital-to-analogue converter Hence the precise true thresholdvalue in keV may not be known Analysis of the shape of attenuation curves can give informationabout the true set energy discrimination threshold value
The signal (number of counts) detected in a pixel in the detector for an element with atomicnumber Z is calculated using
IZ (Eth) = AEmaxintEth
[M lowast
[I0 (E) middot eminusmicroZ(E)ρZx middot
(1minus eminusmicroSi(E)ρSid
)]]dE (21)
ndash 2 ndash
2011 JINST 6 C11012
Figure 1 a) X-ray spectrum of the Oxford Instruments X-ray tube (model TF 15807) used for the equal-ization The tube was operated at 35 kVp and 215 microA b) example of attenuation of a polychromatic beamin aluminium for different thresholds of the detector The attenuation curves are shown for one randomlyselected pixel The points of curves were measured by placing different thicknesses of aluminium foils infront of the Medipix detector The red circles are measured values the blue lines are fits using the functiondescribed in the text Callouts show the true energy discrimination thresholds The total number of countswas ranging from 62 middot105plusmn787 with no Al foil present and the threshold of 6 keV down to 850plusmn29 countswith a 43 mm thick Al plate and the threshold of 294 keV The exposure time was ranging from 200 s (nofoil) to 400 s with the thickest Al plate
where IZ(Eth) is number of detected counts in the Si detector behind the sample at energy discrimi-nation threshold Eth Ais the scaling parameter I0(E) is the open beam intensity at energy E (X-rayspectrum) Emax is the maximum energy in the spectrum [keV] M is the detector spectral responsefunction (described in more detail below) microZ is the mass attenuation coefficient of an element withatomic number Z [7] [cm2g] ρZ is the density of an element with atomic number Z [gcm3] xis the thickness of the sample [cm] microSi is the mass attenuation coefficient of the silicon sensor atenergy E [cm2g] ρSi is the density of the silicon sensor (233 gcm3) and d is the thickness of thesilicon sensor (003 cm)
If the X-ray tube spectrum is known eq (21) can be used to fit the X-ray attenuation pointsmeasured in individual Medipix pixels In that case free parameters of the fit are the scaling param-eter A and the energy discrimination threshold Eth The parameter A characterises the overall beamintensity for the given pixel and Eth corresponds to the true energy threshold set in the given pixel
The function integrated in eq (21) is a spectrum of X-rays detected in one Medipix pixel con-volved with the Medipix spectral response M The spectral response mainly reflects the distortionof the detected spectrum by the charge sharing between pixels Details on the characterisation ofcharge sharing and the creation of the spectral response function can be found in [8] Howeverthe differences in the shape of the fitted attenuation curve calculated with and without the responsefunction are negligible This is demonstrated in figure 2b
The charge sharing reduces for some of the detected photons the amount of charge collectedin the individual pixels Therefore there are events where an incoming photon with energy abovethe energy discrimination threshold is not detected This is because the charge sharing reducedthe amount of charge collected in the pixel below the discrimination level Hence the number ofdetected photons is slightly lower than expected when considering only the detection efficiency
ndash 3 ndash
2011 JINST 6 C11012
Figure 2 a) measured attenuation curve (circles) fitted with the function in eq (21) that included the detec-tor spectral response (blue line) and did not include the spectral response (red line nevertheless overlappedby the blue line) b) fit residuals mdash blue with the response matrix and red without
of the 300 microm thick Silicon sensor The Medipix energy response function in the eq (21) takesthis into account The threshold found by the fit is therefore slightly higher if the energy responseis omitted from the eq (21) The higher value of the threshold ldquocompensatesrdquo for the missingphotons The threshold found for the case in figure 2 with the detector response included was175 keV The result was 191 keV when the response was omitted The presented technique ofthreshold equalization considers only differences between the found values of thresholds at valuesof the individual pixel adjustment bits of 0 and 7 Therefore it is not sensitive to the systematicoffsets of found thresholds The detector energy response could therefore be neglected and thetechnique of threshold equalization greatly simplified
3 Threshold equalization
The attenuation curve fitting was implemented in the in-house developed data analysis softwareDataMaster [9] that has been over time extended by modules for X-ray image analysis Fittingall 65k pixels takes about 5 minutes on 266 GHz dual core Intel processor Results of individualsteps of the described threshold equalization procedure are shown in figure 3 The final valuesof equalization bits in pixels were found such that the resulting distribution of thresholds had itsmean value in the middle of threshold distributions with the adjustment bits set to value of 0 and 7Figure 3 also contains the distribution of energy discrimination thresholds (also determined byfitting of the attenuation curves) for the chip equalized using the noise floor The full-width-at-half-maximum (FWHM) of this distribution was 14 keV The FWHM value of the threshold distributionfor the chip equalized using the presented technique was 11 keV The values of full-width-at-tenth-maximum (FWTM) were 27 keV vs 16 keV in favour of the new technique Each method ofequalization leads to a slightly different offset of the final distribution of equalized thresholds asvisible in figure 3 This offset can be compensated in the final X-ray image acquisition by adjustingthe threshold DAC value
ndash 4 ndash
2011 JINST 6 C11012
Figure 3 Distributions of found thresholds red mdash all adjustment bits set to 7 blue mdash all adjustment bitsset to 0 black mdash thresholds equalized using the polychromatic beam green mdash thresholds equalized usingthe noise floor The DAC of the energy threshold was set to value of 350 in both cases
4 Improvement of signal uniformity in X-ray images
The improvement in image quality thanks to the presented equalization technique is demonstratedin figure 4 The image shows the signal measured behind a 25 microm thick Sn foil The energydiscrimination threshold was set to an average value of 27 keV and the X-ray tube voltage was setto 50 kVp The threshold value was chosen to be close to the k-edge of Sn which is 292 keV [7]Setting the threshold as close to the k-edge as possible improves the quality and reliability of thematerial resolved imaging See [1] for details Even though the average threshold value is belowthe energy of the k-edge some of the pixels fall with their true energy threshold above the energyof the k-edge This causes a significant drop in the number of measured counts in these pixelsThe wider spread of threshold values with the chip equalized using the noise floor leads to a highernon-uniformity of the image The presented equalization technique reduces the spread of countsby 40 in this case
It could be argued that the non-uniformity of the detector response in figure 4 could be cor-rected using the flat-field correction or the signal-to-equivalent thickness calibration (STC whichprovides better results than the flat-field correction [6]) Figure 5 shows that the new thresholdequalization technique actually also improves quality of the STC calibrated images
The STC method relies on similarities in the shapes of X-ray attenuation coefficients as func-tions of energy Therefore it satisfactorily corrects non-uniformities in cases where the energy dis-crimination threshold is far enough from the abrupt changes in the attenuation coefficients causedby the k and l-edges However in cases where the energy discrimination threshold is set close tothe energy of k or l-edge higher image uniformity has to be achieved by a better equalization ofthe sensor
ndash 5 ndash
2011 JINST 6 C11012
Figure 4 Histograms and images of the measured number of counts behind a 25 microm thick Sn foil Grey mdashwith the noise based threshold equalization black mdash with the polychromatic X-rays based technique Theenergy threshold was set to value of about 27 keV FWHM of the distribution with noise-based equalizationwas 6650 counts vs 4060 counts in the case of new equalization technique The FWTM was 12700 vs 7600in favour of the new equalization technique
Figure 5 Histograms and images of a 25 microm thick Sn foil after the signal-to-equivalent thickness calibrationThe FWHM of the final distribution was improved by the new equalization technique from 723 to 634 microm(12 improvement) and the FWTM from 1671 to 1099 microm (34 improvement)
5 Conclusion
We have presented a technique of energy discrimination threshold equalization that is based onthe analysis of polychromatic beam attenuation in aluminium foils The FWHM of the thresholdspread with the new equalization technique is about 20 lower compared to the noise-floor basedequalization FWTM values are improved by 40 Our threshold equalization technique com-pared to the mono-energetic X-rays based equalization [5] can be applied without re-arrangingthe X-ray imaging setup The presented threshold equalization procedure is considerably faster(minutes vs hours) thanks to the significantly higher available photon flux in the direct beam of theX-ray tube
Implementation of the new technique utilizes existing mechanical devices for the STC calibra-tion [10] Therefore it can be easily entirely automatized
ndash 6 ndash
2011 JINST 6 C11012
The new threshold equalization technique finds the major application in the material resolvedimaging where it helps to improve the pixel-to-pixel uniformity of the imaging detector
Acknowledgments
We acknowledge the support of CERN Medipix Collaboration in providing a Medixpix2 detectorfor use in these experiments
References
[1] J Uher J Jakubek S Mayo A Stevenson and JTickner X-ray beam hardening based materialrecognition in micro-imaging 2011 JINST 6 P08015
[2] httpmedipixwebcernchMEDIPIX
[3] L Tlustos et al Imaging Properties of the Medipix2 System exploiting Single and Dual EnergyThresholds IEEE T Nuc Sci 53 (2006) 367
[4] T Holy J Jakubek S Pospisil J Uher D Vavrik and Z Vykydal Data acquisition and processingsoftware package for Medipix2 Nucl Instrum Methods A 563 (2006) 254
[5] S Procz J Lubke A Zwerger M Mix and M Fiederle Optimization of Medipix-2 Threshold Masksfor Spectroscopic X-Ray Imaging IEEE T Nuc Sci 56 (2009) 1795
[6] J Jakubek Data processing and image reconstruction methods for pixel detectors Nuc InstrumMethods A 576 (2007) 223
[7] httpphysicsnistgov
[8] J Uher G Harvey and J Jakubek X-ray fluorescence imaging with the Medipix2 single-photoncounting detector IEE Nuclear Science Symposium Conference Record (NSSMIC) (2010)
[9] J Uher G Roach and J Tickner Peak fitting and identification software library for high resolutiongamma-ray spectra Nuc Instrum Methods A 619 (2010) 459
[10] J Jakubek T Holy M Jakubek D Vavrik and Z Vykydal Experimental system for high resolutionX-ray transmission radiography Nuc Instrum Methods A 563 (2006) 278
ndash 7 ndash
- Introduction
- Calculation of polychromatic X-ray beam attenuation curve
- Threshold equalization
- Improvement of signal uniformity in X-ray images
- Conclusion
-
2011 JINST 6 C11012
Contents
1 Introduction 1
2 Calculation of polychromatic X-ray beam attenuation curve 2
3 Threshold equalization 4
4 Improvement of signal uniformity in X-ray images 5
5 Conclusion 6
1 Introduction
We are focusing our research on material resolved X-ray transmission micro-imaging We areessentially trying to associate colours to materials identified in X-ray images by analysing thetransmission spectrum of X-rays [1] These techniques are based on the single photon countingimaging detectors Medipix [2] and allow discrimination of elements that differ by as little as onlyone atomic number [1] However achieving such result requires very good characterisation andcalibration of the X-ray imaging setup the Medipix2 detector in particular
The detector used in the presented work was Medipix2 in version MXR [2] Medipix2 is ahybrid pixel detector with array of 256times256 pixels with pitch of 55 microm The total sensitive areais 14times14 cm2 Each pixel contains its own electronics consisting of an amplifier discriminator(energy threshold) and 13-bit counter The device we used in our experiments has a 300 microm thicksilicon sensor
The energy discrimination threshold is set the same for all pixels However the parameters ofelectronics slightly vary from pixel to pixel Therefore each pixel contains 3-bit threshold adjust-ment to set offset of the energy discrimination digital-to-analogue converter (DAC) individuallyThis helps to obtain a uniform response from the pixels
Traditionally the 3-bit threshold adjustment is found using the noise floor of the readoutchip [3] This technique of threshold equalization is implemented in the Pixelman software [4]that has become a standard for Medipix detector readout and control It has been shown that thisprocedure of threshold equalization is sufficient for low energy thresholds just above the noisefloor However the 3-bit individual per-pixel adjustment only provides correction of the energythreshold offset and not correction of the pixel-to-pixel amplifier gain variation Therefore as itwill be shown later it is not suitable for cases where the threshold is set to higher energy fur-ther above the noise floor This problem has been tackled by the application of mono-energeticX-rays based threshold equalization [5] That equalization technique reduced the spread of thresh-old values by about 38 at a threshold level of 21 keV Nevertheless the latter technique requireschanges to the X-ray imaging setup by placing the detector in a position suitable for detection of the
ndash 1 ndash
2011 JINST 6 C11012
mono-energetic X-rays (usually X-ray fluorescences) Moreover the reasonably achievable flux ofmono-energetic X-rays is usually quite low and therefore this equalization technique is also rathertime consuming
We present a new threshold equalization technique that is based on the detection of a polychro-matic X-ray beam emitted directly from the X-ray tube Our approach utilizes the characterisationof polychromatic X-ray beam attenuation curves It allows the true X-ray energy discriminationthreshold to be determined on a per-pixel basis and therefore finding an optimal value of the 3-bitthreshold adjustment The steps of the new technique are
1) setting all 3-bit threshold adjustments to minimum (0)
2) measuring X-ray attenuation curves in aluminium foils
3) fitting the attenuation curves measured in individual pixels with a model of the attenuationobtaining true values of thresholds in all pixels
4) setting all 3-bit threshold adjustments to maximum (7)
5) measuring X-ray attenuation curves in aluminium foils
6) fitting the attenuation curves measured in individual pixels
7) finding a settings of the 3-bit adjustments in all pixels using results of steps 3) and 6) suchthat the spread of true threshold values between individual pixels is minimal
The presented technique does not require changes in the position of the detector within theX-ray imaging setup and it is considerably faster as it uses the primary beam of the X-ray tube
2 Calculation of polychromatic X-ray beam attenuation curve
The X-ray tubes used for imaging generate X-rays through Bremsstrahlung The emitted spectrumis continuous and contains depending on the tube exit window X-ray energies from (nearly) zeroup the energy corresponding to the electron accelerating voltage of the tube The X-ray tube spec-trum used for the equalization described here is shown in figure 1a Photons of different energyare attenuated at different level and therefore the overall attenuation of the beam is not exponentialThis leads to the well-know effect of beam-hardening [6] The beam-hardening effect can be usedto identify materials contained in the sample [1] or characterize the energy sensitivity of the de-tector (ie the energy threshold set) An example of X-ray attenuation curves for aluminium withexperimental data measured by Medipix is shown in figure 1b It is clearly visible that the shapeof the curve depends on the energy discrimination threshold applied in the detector However thethreshold is set in values of the digital-to-analogue converter Hence the precise true thresholdvalue in keV may not be known Analysis of the shape of attenuation curves can give informationabout the true set energy discrimination threshold value
The signal (number of counts) detected in a pixel in the detector for an element with atomicnumber Z is calculated using
IZ (Eth) = AEmaxintEth
[M lowast
[I0 (E) middot eminusmicroZ(E)ρZx middot
(1minus eminusmicroSi(E)ρSid
)]]dE (21)
ndash 2 ndash
2011 JINST 6 C11012
Figure 1 a) X-ray spectrum of the Oxford Instruments X-ray tube (model TF 15807) used for the equal-ization The tube was operated at 35 kVp and 215 microA b) example of attenuation of a polychromatic beamin aluminium for different thresholds of the detector The attenuation curves are shown for one randomlyselected pixel The points of curves were measured by placing different thicknesses of aluminium foils infront of the Medipix detector The red circles are measured values the blue lines are fits using the functiondescribed in the text Callouts show the true energy discrimination thresholds The total number of countswas ranging from 62 middot105plusmn787 with no Al foil present and the threshold of 6 keV down to 850plusmn29 countswith a 43 mm thick Al plate and the threshold of 294 keV The exposure time was ranging from 200 s (nofoil) to 400 s with the thickest Al plate
where IZ(Eth) is number of detected counts in the Si detector behind the sample at energy discrimi-nation threshold Eth Ais the scaling parameter I0(E) is the open beam intensity at energy E (X-rayspectrum) Emax is the maximum energy in the spectrum [keV] M is the detector spectral responsefunction (described in more detail below) microZ is the mass attenuation coefficient of an element withatomic number Z [7] [cm2g] ρZ is the density of an element with atomic number Z [gcm3] xis the thickness of the sample [cm] microSi is the mass attenuation coefficient of the silicon sensor atenergy E [cm2g] ρSi is the density of the silicon sensor (233 gcm3) and d is the thickness of thesilicon sensor (003 cm)
If the X-ray tube spectrum is known eq (21) can be used to fit the X-ray attenuation pointsmeasured in individual Medipix pixels In that case free parameters of the fit are the scaling param-eter A and the energy discrimination threshold Eth The parameter A characterises the overall beamintensity for the given pixel and Eth corresponds to the true energy threshold set in the given pixel
The function integrated in eq (21) is a spectrum of X-rays detected in one Medipix pixel con-volved with the Medipix spectral response M The spectral response mainly reflects the distortionof the detected spectrum by the charge sharing between pixels Details on the characterisation ofcharge sharing and the creation of the spectral response function can be found in [8] Howeverthe differences in the shape of the fitted attenuation curve calculated with and without the responsefunction are negligible This is demonstrated in figure 2b
The charge sharing reduces for some of the detected photons the amount of charge collectedin the individual pixels Therefore there are events where an incoming photon with energy abovethe energy discrimination threshold is not detected This is because the charge sharing reducedthe amount of charge collected in the pixel below the discrimination level Hence the number ofdetected photons is slightly lower than expected when considering only the detection efficiency
ndash 3 ndash
2011 JINST 6 C11012
Figure 2 a) measured attenuation curve (circles) fitted with the function in eq (21) that included the detec-tor spectral response (blue line) and did not include the spectral response (red line nevertheless overlappedby the blue line) b) fit residuals mdash blue with the response matrix and red without
of the 300 microm thick Silicon sensor The Medipix energy response function in the eq (21) takesthis into account The threshold found by the fit is therefore slightly higher if the energy responseis omitted from the eq (21) The higher value of the threshold ldquocompensatesrdquo for the missingphotons The threshold found for the case in figure 2 with the detector response included was175 keV The result was 191 keV when the response was omitted The presented technique ofthreshold equalization considers only differences between the found values of thresholds at valuesof the individual pixel adjustment bits of 0 and 7 Therefore it is not sensitive to the systematicoffsets of found thresholds The detector energy response could therefore be neglected and thetechnique of threshold equalization greatly simplified
3 Threshold equalization
The attenuation curve fitting was implemented in the in-house developed data analysis softwareDataMaster [9] that has been over time extended by modules for X-ray image analysis Fittingall 65k pixels takes about 5 minutes on 266 GHz dual core Intel processor Results of individualsteps of the described threshold equalization procedure are shown in figure 3 The final valuesof equalization bits in pixels were found such that the resulting distribution of thresholds had itsmean value in the middle of threshold distributions with the adjustment bits set to value of 0 and 7Figure 3 also contains the distribution of energy discrimination thresholds (also determined byfitting of the attenuation curves) for the chip equalized using the noise floor The full-width-at-half-maximum (FWHM) of this distribution was 14 keV The FWHM value of the threshold distributionfor the chip equalized using the presented technique was 11 keV The values of full-width-at-tenth-maximum (FWTM) were 27 keV vs 16 keV in favour of the new technique Each method ofequalization leads to a slightly different offset of the final distribution of equalized thresholds asvisible in figure 3 This offset can be compensated in the final X-ray image acquisition by adjustingthe threshold DAC value
ndash 4 ndash
2011 JINST 6 C11012
Figure 3 Distributions of found thresholds red mdash all adjustment bits set to 7 blue mdash all adjustment bitsset to 0 black mdash thresholds equalized using the polychromatic beam green mdash thresholds equalized usingthe noise floor The DAC of the energy threshold was set to value of 350 in both cases
4 Improvement of signal uniformity in X-ray images
The improvement in image quality thanks to the presented equalization technique is demonstratedin figure 4 The image shows the signal measured behind a 25 microm thick Sn foil The energydiscrimination threshold was set to an average value of 27 keV and the X-ray tube voltage was setto 50 kVp The threshold value was chosen to be close to the k-edge of Sn which is 292 keV [7]Setting the threshold as close to the k-edge as possible improves the quality and reliability of thematerial resolved imaging See [1] for details Even though the average threshold value is belowthe energy of the k-edge some of the pixels fall with their true energy threshold above the energyof the k-edge This causes a significant drop in the number of measured counts in these pixelsThe wider spread of threshold values with the chip equalized using the noise floor leads to a highernon-uniformity of the image The presented equalization technique reduces the spread of countsby 40 in this case
It could be argued that the non-uniformity of the detector response in figure 4 could be cor-rected using the flat-field correction or the signal-to-equivalent thickness calibration (STC whichprovides better results than the flat-field correction [6]) Figure 5 shows that the new thresholdequalization technique actually also improves quality of the STC calibrated images
The STC method relies on similarities in the shapes of X-ray attenuation coefficients as func-tions of energy Therefore it satisfactorily corrects non-uniformities in cases where the energy dis-crimination threshold is far enough from the abrupt changes in the attenuation coefficients causedby the k and l-edges However in cases where the energy discrimination threshold is set close tothe energy of k or l-edge higher image uniformity has to be achieved by a better equalization ofthe sensor
ndash 5 ndash
2011 JINST 6 C11012
Figure 4 Histograms and images of the measured number of counts behind a 25 microm thick Sn foil Grey mdashwith the noise based threshold equalization black mdash with the polychromatic X-rays based technique Theenergy threshold was set to value of about 27 keV FWHM of the distribution with noise-based equalizationwas 6650 counts vs 4060 counts in the case of new equalization technique The FWTM was 12700 vs 7600in favour of the new equalization technique
Figure 5 Histograms and images of a 25 microm thick Sn foil after the signal-to-equivalent thickness calibrationThe FWHM of the final distribution was improved by the new equalization technique from 723 to 634 microm(12 improvement) and the FWTM from 1671 to 1099 microm (34 improvement)
5 Conclusion
We have presented a technique of energy discrimination threshold equalization that is based onthe analysis of polychromatic beam attenuation in aluminium foils The FWHM of the thresholdspread with the new equalization technique is about 20 lower compared to the noise-floor basedequalization FWTM values are improved by 40 Our threshold equalization technique com-pared to the mono-energetic X-rays based equalization [5] can be applied without re-arrangingthe X-ray imaging setup The presented threshold equalization procedure is considerably faster(minutes vs hours) thanks to the significantly higher available photon flux in the direct beam of theX-ray tube
Implementation of the new technique utilizes existing mechanical devices for the STC calibra-tion [10] Therefore it can be easily entirely automatized
ndash 6 ndash
2011 JINST 6 C11012
The new threshold equalization technique finds the major application in the material resolvedimaging where it helps to improve the pixel-to-pixel uniformity of the imaging detector
Acknowledgments
We acknowledge the support of CERN Medipix Collaboration in providing a Medixpix2 detectorfor use in these experiments
References
[1] J Uher J Jakubek S Mayo A Stevenson and JTickner X-ray beam hardening based materialrecognition in micro-imaging 2011 JINST 6 P08015
[2] httpmedipixwebcernchMEDIPIX
[3] L Tlustos et al Imaging Properties of the Medipix2 System exploiting Single and Dual EnergyThresholds IEEE T Nuc Sci 53 (2006) 367
[4] T Holy J Jakubek S Pospisil J Uher D Vavrik and Z Vykydal Data acquisition and processingsoftware package for Medipix2 Nucl Instrum Methods A 563 (2006) 254
[5] S Procz J Lubke A Zwerger M Mix and M Fiederle Optimization of Medipix-2 Threshold Masksfor Spectroscopic X-Ray Imaging IEEE T Nuc Sci 56 (2009) 1795
[6] J Jakubek Data processing and image reconstruction methods for pixel detectors Nuc InstrumMethods A 576 (2007) 223
[7] httpphysicsnistgov
[8] J Uher G Harvey and J Jakubek X-ray fluorescence imaging with the Medipix2 single-photoncounting detector IEE Nuclear Science Symposium Conference Record (NSSMIC) (2010)
[9] J Uher G Roach and J Tickner Peak fitting and identification software library for high resolutiongamma-ray spectra Nuc Instrum Methods A 619 (2010) 459
[10] J Jakubek T Holy M Jakubek D Vavrik and Z Vykydal Experimental system for high resolutionX-ray transmission radiography Nuc Instrum Methods A 563 (2006) 278
ndash 7 ndash
- Introduction
- Calculation of polychromatic X-ray beam attenuation curve
- Threshold equalization
- Improvement of signal uniformity in X-ray images
- Conclusion
-

2011 JINST 6 C11012
mono-energetic X-rays (usually X-ray fluorescences) Moreover the reasonably achievable flux ofmono-energetic X-rays is usually quite low and therefore this equalization technique is also rathertime consuming
We present a new threshold equalization technique that is based on the detection of a polychro-matic X-ray beam emitted directly from the X-ray tube Our approach utilizes the characterisationof polychromatic X-ray beam attenuation curves It allows the true X-ray energy discriminationthreshold to be determined on a per-pixel basis and therefore finding an optimal value of the 3-bitthreshold adjustment The steps of the new technique are
1) setting all 3-bit threshold adjustments to minimum (0)
2) measuring X-ray attenuation curves in aluminium foils
3) fitting the attenuation curves measured in individual pixels with a model of the attenuationobtaining true values of thresholds in all pixels
4) setting all 3-bit threshold adjustments to maximum (7)
5) measuring X-ray attenuation curves in aluminium foils
6) fitting the attenuation curves measured in individual pixels
7) finding a settings of the 3-bit adjustments in all pixels using results of steps 3) and 6) suchthat the spread of true threshold values between individual pixels is minimal
The presented technique does not require changes in the position of the detector within theX-ray imaging setup and it is considerably faster as it uses the primary beam of the X-ray tube
2 Calculation of polychromatic X-ray beam attenuation curve
The X-ray tubes used for imaging generate X-rays through Bremsstrahlung The emitted spectrumis continuous and contains depending on the tube exit window X-ray energies from (nearly) zeroup the energy corresponding to the electron accelerating voltage of the tube The X-ray tube spec-trum used for the equalization described here is shown in figure 1a Photons of different energyare attenuated at different level and therefore the overall attenuation of the beam is not exponentialThis leads to the well-know effect of beam-hardening [6] The beam-hardening effect can be usedto identify materials contained in the sample [1] or characterize the energy sensitivity of the de-tector (ie the energy threshold set) An example of X-ray attenuation curves for aluminium withexperimental data measured by Medipix is shown in figure 1b It is clearly visible that the shapeof the curve depends on the energy discrimination threshold applied in the detector However thethreshold is set in values of the digital-to-analogue converter Hence the precise true thresholdvalue in keV may not be known Analysis of the shape of attenuation curves can give informationabout the true set energy discrimination threshold value
The signal (number of counts) detected in a pixel in the detector for an element with atomicnumber Z is calculated using
IZ (Eth) = AEmaxintEth
[M lowast
[I0 (E) middot eminusmicroZ(E)ρZx middot
(1minus eminusmicroSi(E)ρSid
)]]dE (21)
ndash 2 ndash
2011 JINST 6 C11012
Figure 1 a) X-ray spectrum of the Oxford Instruments X-ray tube (model TF 15807) used for the equal-ization The tube was operated at 35 kVp and 215 microA b) example of attenuation of a polychromatic beamin aluminium for different thresholds of the detector The attenuation curves are shown for one randomlyselected pixel The points of curves were measured by placing different thicknesses of aluminium foils infront of the Medipix detector The red circles are measured values the blue lines are fits using the functiondescribed in the text Callouts show the true energy discrimination thresholds The total number of countswas ranging from 62 middot105plusmn787 with no Al foil present and the threshold of 6 keV down to 850plusmn29 countswith a 43 mm thick Al plate and the threshold of 294 keV The exposure time was ranging from 200 s (nofoil) to 400 s with the thickest Al plate
where IZ(Eth) is number of detected counts in the Si detector behind the sample at energy discrimi-nation threshold Eth Ais the scaling parameter I0(E) is the open beam intensity at energy E (X-rayspectrum) Emax is the maximum energy in the spectrum [keV] M is the detector spectral responsefunction (described in more detail below) microZ is the mass attenuation coefficient of an element withatomic number Z [7] [cm2g] ρZ is the density of an element with atomic number Z [gcm3] xis the thickness of the sample [cm] microSi is the mass attenuation coefficient of the silicon sensor atenergy E [cm2g] ρSi is the density of the silicon sensor (233 gcm3) and d is the thickness of thesilicon sensor (003 cm)
If the X-ray tube spectrum is known eq (21) can be used to fit the X-ray attenuation pointsmeasured in individual Medipix pixels In that case free parameters of the fit are the scaling param-eter A and the energy discrimination threshold Eth The parameter A characterises the overall beamintensity for the given pixel and Eth corresponds to the true energy threshold set in the given pixel
The function integrated in eq (21) is a spectrum of X-rays detected in one Medipix pixel con-volved with the Medipix spectral response M The spectral response mainly reflects the distortionof the detected spectrum by the charge sharing between pixels Details on the characterisation ofcharge sharing and the creation of the spectral response function can be found in [8] Howeverthe differences in the shape of the fitted attenuation curve calculated with and without the responsefunction are negligible This is demonstrated in figure 2b
The charge sharing reduces for some of the detected photons the amount of charge collectedin the individual pixels Therefore there are events where an incoming photon with energy abovethe energy discrimination threshold is not detected This is because the charge sharing reducedthe amount of charge collected in the pixel below the discrimination level Hence the number ofdetected photons is slightly lower than expected when considering only the detection efficiency
ndash 3 ndash
2011 JINST 6 C11012
Figure 2 a) measured attenuation curve (circles) fitted with the function in eq (21) that included the detec-tor spectral response (blue line) and did not include the spectral response (red line nevertheless overlappedby the blue line) b) fit residuals mdash blue with the response matrix and red without
of the 300 microm thick Silicon sensor The Medipix energy response function in the eq (21) takesthis into account The threshold found by the fit is therefore slightly higher if the energy responseis omitted from the eq (21) The higher value of the threshold ldquocompensatesrdquo for the missingphotons The threshold found for the case in figure 2 with the detector response included was175 keV The result was 191 keV when the response was omitted The presented technique ofthreshold equalization considers only differences between the found values of thresholds at valuesof the individual pixel adjustment bits of 0 and 7 Therefore it is not sensitive to the systematicoffsets of found thresholds The detector energy response could therefore be neglected and thetechnique of threshold equalization greatly simplified
3 Threshold equalization
The attenuation curve fitting was implemented in the in-house developed data analysis softwareDataMaster [9] that has been over time extended by modules for X-ray image analysis Fittingall 65k pixels takes about 5 minutes on 266 GHz dual core Intel processor Results of individualsteps of the described threshold equalization procedure are shown in figure 3 The final valuesof equalization bits in pixels were found such that the resulting distribution of thresholds had itsmean value in the middle of threshold distributions with the adjustment bits set to value of 0 and 7Figure 3 also contains the distribution of energy discrimination thresholds (also determined byfitting of the attenuation curves) for the chip equalized using the noise floor The full-width-at-half-maximum (FWHM) of this distribution was 14 keV The FWHM value of the threshold distributionfor the chip equalized using the presented technique was 11 keV The values of full-width-at-tenth-maximum (FWTM) were 27 keV vs 16 keV in favour of the new technique Each method ofequalization leads to a slightly different offset of the final distribution of equalized thresholds asvisible in figure 3 This offset can be compensated in the final X-ray image acquisition by adjustingthe threshold DAC value
ndash 4 ndash
2011 JINST 6 C11012
Figure 3 Distributions of found thresholds red mdash all adjustment bits set to 7 blue mdash all adjustment bitsset to 0 black mdash thresholds equalized using the polychromatic beam green mdash thresholds equalized usingthe noise floor The DAC of the energy threshold was set to value of 350 in both cases
4 Improvement of signal uniformity in X-ray images
The improvement in image quality thanks to the presented equalization technique is demonstratedin figure 4 The image shows the signal measured behind a 25 microm thick Sn foil The energydiscrimination threshold was set to an average value of 27 keV and the X-ray tube voltage was setto 50 kVp The threshold value was chosen to be close to the k-edge of Sn which is 292 keV [7]Setting the threshold as close to the k-edge as possible improves the quality and reliability of thematerial resolved imaging See [1] for details Even though the average threshold value is belowthe energy of the k-edge some of the pixels fall with their true energy threshold above the energyof the k-edge This causes a significant drop in the number of measured counts in these pixelsThe wider spread of threshold values with the chip equalized using the noise floor leads to a highernon-uniformity of the image The presented equalization technique reduces the spread of countsby 40 in this case
It could be argued that the non-uniformity of the detector response in figure 4 could be cor-rected using the flat-field correction or the signal-to-equivalent thickness calibration (STC whichprovides better results than the flat-field correction [6]) Figure 5 shows that the new thresholdequalization technique actually also improves quality of the STC calibrated images
The STC method relies on similarities in the shapes of X-ray attenuation coefficients as func-tions of energy Therefore it satisfactorily corrects non-uniformities in cases where the energy dis-crimination threshold is far enough from the abrupt changes in the attenuation coefficients causedby the k and l-edges However in cases where the energy discrimination threshold is set close tothe energy of k or l-edge higher image uniformity has to be achieved by a better equalization ofthe sensor
ndash 5 ndash
2011 JINST 6 C11012
Figure 4 Histograms and images of the measured number of counts behind a 25 microm thick Sn foil Grey mdashwith the noise based threshold equalization black mdash with the polychromatic X-rays based technique Theenergy threshold was set to value of about 27 keV FWHM of the distribution with noise-based equalizationwas 6650 counts vs 4060 counts in the case of new equalization technique The FWTM was 12700 vs 7600in favour of the new equalization technique
Figure 5 Histograms and images of a 25 microm thick Sn foil after the signal-to-equivalent thickness calibrationThe FWHM of the final distribution was improved by the new equalization technique from 723 to 634 microm(12 improvement) and the FWTM from 1671 to 1099 microm (34 improvement)
5 Conclusion
We have presented a technique of energy discrimination threshold equalization that is based onthe analysis of polychromatic beam attenuation in aluminium foils The FWHM of the thresholdspread with the new equalization technique is about 20 lower compared to the noise-floor basedequalization FWTM values are improved by 40 Our threshold equalization technique com-pared to the mono-energetic X-rays based equalization [5] can be applied without re-arrangingthe X-ray imaging setup The presented threshold equalization procedure is considerably faster(minutes vs hours) thanks to the significantly higher available photon flux in the direct beam of theX-ray tube
Implementation of the new technique utilizes existing mechanical devices for the STC calibra-tion [10] Therefore it can be easily entirely automatized
ndash 6 ndash
2011 JINST 6 C11012
The new threshold equalization technique finds the major application in the material resolvedimaging where it helps to improve the pixel-to-pixel uniformity of the imaging detector
Acknowledgments
We acknowledge the support of CERN Medipix Collaboration in providing a Medixpix2 detectorfor use in these experiments
References
[1] J Uher J Jakubek S Mayo A Stevenson and JTickner X-ray beam hardening based materialrecognition in micro-imaging 2011 JINST 6 P08015
[2] httpmedipixwebcernchMEDIPIX
[3] L Tlustos et al Imaging Properties of the Medipix2 System exploiting Single and Dual EnergyThresholds IEEE T Nuc Sci 53 (2006) 367
[4] T Holy J Jakubek S Pospisil J Uher D Vavrik and Z Vykydal Data acquisition and processingsoftware package for Medipix2 Nucl Instrum Methods A 563 (2006) 254
[5] S Procz J Lubke A Zwerger M Mix and M Fiederle Optimization of Medipix-2 Threshold Masksfor Spectroscopic X-Ray Imaging IEEE T Nuc Sci 56 (2009) 1795
[6] J Jakubek Data processing and image reconstruction methods for pixel detectors Nuc InstrumMethods A 576 (2007) 223
[7] httpphysicsnistgov
[8] J Uher G Harvey and J Jakubek X-ray fluorescence imaging with the Medipix2 single-photoncounting detector IEE Nuclear Science Symposium Conference Record (NSSMIC) (2010)
[9] J Uher G Roach and J Tickner Peak fitting and identification software library for high resolutiongamma-ray spectra Nuc Instrum Methods A 619 (2010) 459
[10] J Jakubek T Holy M Jakubek D Vavrik and Z Vykydal Experimental system for high resolutionX-ray transmission radiography Nuc Instrum Methods A 563 (2006) 278
ndash 7 ndash
- Introduction
- Calculation of polychromatic X-ray beam attenuation curve
- Threshold equalization
- Improvement of signal uniformity in X-ray images
- Conclusion
-
2011 JINST 6 C11012
Figure 1 a) X-ray spectrum of the Oxford Instruments X-ray tube (model TF 15807) used for the equal-ization The tube was operated at 35 kVp and 215 microA b) example of attenuation of a polychromatic beamin aluminium for different thresholds of the detector The attenuation curves are shown for one randomlyselected pixel The points of curves were measured by placing different thicknesses of aluminium foils infront of the Medipix detector The red circles are measured values the blue lines are fits using the functiondescribed in the text Callouts show the true energy discrimination thresholds The total number of countswas ranging from 62 middot105plusmn787 with no Al foil present and the threshold of 6 keV down to 850plusmn29 countswith a 43 mm thick Al plate and the threshold of 294 keV The exposure time was ranging from 200 s (nofoil) to 400 s with the thickest Al plate
where IZ(Eth) is number of detected counts in the Si detector behind the sample at energy discrimi-nation threshold Eth Ais the scaling parameter I0(E) is the open beam intensity at energy E (X-rayspectrum) Emax is the maximum energy in the spectrum [keV] M is the detector spectral responsefunction (described in more detail below) microZ is the mass attenuation coefficient of an element withatomic number Z [7] [cm2g] ρZ is the density of an element with atomic number Z [gcm3] xis the thickness of the sample [cm] microSi is the mass attenuation coefficient of the silicon sensor atenergy E [cm2g] ρSi is the density of the silicon sensor (233 gcm3) and d is the thickness of thesilicon sensor (003 cm)
If the X-ray tube spectrum is known eq (21) can be used to fit the X-ray attenuation pointsmeasured in individual Medipix pixels In that case free parameters of the fit are the scaling param-eter A and the energy discrimination threshold Eth The parameter A characterises the overall beamintensity for the given pixel and Eth corresponds to the true energy threshold set in the given pixel
The function integrated in eq (21) is a spectrum of X-rays detected in one Medipix pixel con-volved with the Medipix spectral response M The spectral response mainly reflects the distortionof the detected spectrum by the charge sharing between pixels Details on the characterisation ofcharge sharing and the creation of the spectral response function can be found in [8] Howeverthe differences in the shape of the fitted attenuation curve calculated with and without the responsefunction are negligible This is demonstrated in figure 2b
The charge sharing reduces for some of the detected photons the amount of charge collectedin the individual pixels Therefore there are events where an incoming photon with energy abovethe energy discrimination threshold is not detected This is because the charge sharing reducedthe amount of charge collected in the pixel below the discrimination level Hence the number ofdetected photons is slightly lower than expected when considering only the detection efficiency
ndash 3 ndash
2011 JINST 6 C11012
Figure 2 a) measured attenuation curve (circles) fitted with the function in eq (21) that included the detec-tor spectral response (blue line) and did not include the spectral response (red line nevertheless overlappedby the blue line) b) fit residuals mdash blue with the response matrix and red without
of the 300 microm thick Silicon sensor The Medipix energy response function in the eq (21) takesthis into account The threshold found by the fit is therefore slightly higher if the energy responseis omitted from the eq (21) The higher value of the threshold ldquocompensatesrdquo for the missingphotons The threshold found for the case in figure 2 with the detector response included was175 keV The result was 191 keV when the response was omitted The presented technique ofthreshold equalization considers only differences between the found values of thresholds at valuesof the individual pixel adjustment bits of 0 and 7 Therefore it is not sensitive to the systematicoffsets of found thresholds The detector energy response could therefore be neglected and thetechnique of threshold equalization greatly simplified
3 Threshold equalization
The attenuation curve fitting was implemented in the in-house developed data analysis softwareDataMaster [9] that has been over time extended by modules for X-ray image analysis Fittingall 65k pixels takes about 5 minutes on 266 GHz dual core Intel processor Results of individualsteps of the described threshold equalization procedure are shown in figure 3 The final valuesof equalization bits in pixels were found such that the resulting distribution of thresholds had itsmean value in the middle of threshold distributions with the adjustment bits set to value of 0 and 7Figure 3 also contains the distribution of energy discrimination thresholds (also determined byfitting of the attenuation curves) for the chip equalized using the noise floor The full-width-at-half-maximum (FWHM) of this distribution was 14 keV The FWHM value of the threshold distributionfor the chip equalized using the presented technique was 11 keV The values of full-width-at-tenth-maximum (FWTM) were 27 keV vs 16 keV in favour of the new technique Each method ofequalization leads to a slightly different offset of the final distribution of equalized thresholds asvisible in figure 3 This offset can be compensated in the final X-ray image acquisition by adjustingthe threshold DAC value
ndash 4 ndash
2011 JINST 6 C11012
Figure 3 Distributions of found thresholds red mdash all adjustment bits set to 7 blue mdash all adjustment bitsset to 0 black mdash thresholds equalized using the polychromatic beam green mdash thresholds equalized usingthe noise floor The DAC of the energy threshold was set to value of 350 in both cases
4 Improvement of signal uniformity in X-ray images
The improvement in image quality thanks to the presented equalization technique is demonstratedin figure 4 The image shows the signal measured behind a 25 microm thick Sn foil The energydiscrimination threshold was set to an average value of 27 keV and the X-ray tube voltage was setto 50 kVp The threshold value was chosen to be close to the k-edge of Sn which is 292 keV [7]Setting the threshold as close to the k-edge as possible improves the quality and reliability of thematerial resolved imaging See [1] for details Even though the average threshold value is belowthe energy of the k-edge some of the pixels fall with their true energy threshold above the energyof the k-edge This causes a significant drop in the number of measured counts in these pixelsThe wider spread of threshold values with the chip equalized using the noise floor leads to a highernon-uniformity of the image The presented equalization technique reduces the spread of countsby 40 in this case
It could be argued that the non-uniformity of the detector response in figure 4 could be cor-rected using the flat-field correction or the signal-to-equivalent thickness calibration (STC whichprovides better results than the flat-field correction [6]) Figure 5 shows that the new thresholdequalization technique actually also improves quality of the STC calibrated images
The STC method relies on similarities in the shapes of X-ray attenuation coefficients as func-tions of energy Therefore it satisfactorily corrects non-uniformities in cases where the energy dis-crimination threshold is far enough from the abrupt changes in the attenuation coefficients causedby the k and l-edges However in cases where the energy discrimination threshold is set close tothe energy of k or l-edge higher image uniformity has to be achieved by a better equalization ofthe sensor
ndash 5 ndash
2011 JINST 6 C11012
Figure 4 Histograms and images of the measured number of counts behind a 25 microm thick Sn foil Grey mdashwith the noise based threshold equalization black mdash with the polychromatic X-rays based technique Theenergy threshold was set to value of about 27 keV FWHM of the distribution with noise-based equalizationwas 6650 counts vs 4060 counts in the case of new equalization technique The FWTM was 12700 vs 7600in favour of the new equalization technique
Figure 5 Histograms and images of a 25 microm thick Sn foil after the signal-to-equivalent thickness calibrationThe FWHM of the final distribution was improved by the new equalization technique from 723 to 634 microm(12 improvement) and the FWTM from 1671 to 1099 microm (34 improvement)
5 Conclusion
We have presented a technique of energy discrimination threshold equalization that is based onthe analysis of polychromatic beam attenuation in aluminium foils The FWHM of the thresholdspread with the new equalization technique is about 20 lower compared to the noise-floor basedequalization FWTM values are improved by 40 Our threshold equalization technique com-pared to the mono-energetic X-rays based equalization [5] can be applied without re-arrangingthe X-ray imaging setup The presented threshold equalization procedure is considerably faster(minutes vs hours) thanks to the significantly higher available photon flux in the direct beam of theX-ray tube
Implementation of the new technique utilizes existing mechanical devices for the STC calibra-tion [10] Therefore it can be easily entirely automatized
ndash 6 ndash
2011 JINST 6 C11012
The new threshold equalization technique finds the major application in the material resolvedimaging where it helps to improve the pixel-to-pixel uniformity of the imaging detector
Acknowledgments
We acknowledge the support of CERN Medipix Collaboration in providing a Medixpix2 detectorfor use in these experiments
References
[1] J Uher J Jakubek S Mayo A Stevenson and JTickner X-ray beam hardening based materialrecognition in micro-imaging 2011 JINST 6 P08015
[2] httpmedipixwebcernchMEDIPIX
[3] L Tlustos et al Imaging Properties of the Medipix2 System exploiting Single and Dual EnergyThresholds IEEE T Nuc Sci 53 (2006) 367
[4] T Holy J Jakubek S Pospisil J Uher D Vavrik and Z Vykydal Data acquisition and processingsoftware package for Medipix2 Nucl Instrum Methods A 563 (2006) 254
[5] S Procz J Lubke A Zwerger M Mix and M Fiederle Optimization of Medipix-2 Threshold Masksfor Spectroscopic X-Ray Imaging IEEE T Nuc Sci 56 (2009) 1795
[6] J Jakubek Data processing and image reconstruction methods for pixel detectors Nuc InstrumMethods A 576 (2007) 223
[7] httpphysicsnistgov
[8] J Uher G Harvey and J Jakubek X-ray fluorescence imaging with the Medipix2 single-photoncounting detector IEE Nuclear Science Symposium Conference Record (NSSMIC) (2010)
[9] J Uher G Roach and J Tickner Peak fitting and identification software library for high resolutiongamma-ray spectra Nuc Instrum Methods A 619 (2010) 459
[10] J Jakubek T Holy M Jakubek D Vavrik and Z Vykydal Experimental system for high resolutionX-ray transmission radiography Nuc Instrum Methods A 563 (2006) 278
ndash 7 ndash
- Introduction
- Calculation of polychromatic X-ray beam attenuation curve
- Threshold equalization
- Improvement of signal uniformity in X-ray images
- Conclusion
-
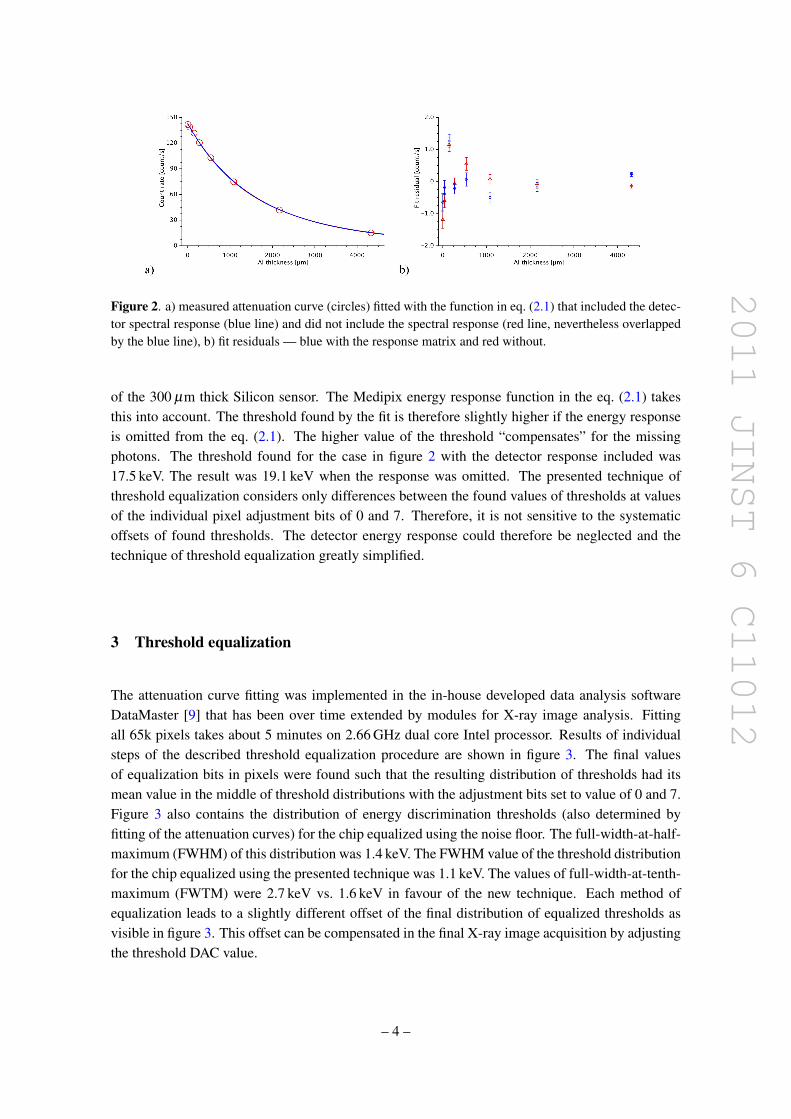
2011 JINST 6 C11012
Figure 3 Distributions of found thresholds red mdash all adjustment bits set to 7 blue mdash all adjustment bitsset to 0 black mdash thresholds equalized using the polychromatic beam green mdash thresholds equalized usingthe noise floor The DAC of the energy threshold was set to value of 350 in both cases
4 Improvement of signal uniformity in X-ray images
The improvement in image quality thanks to the presented equalization technique is demonstratedin figure 4 The image shows the signal measured behind a 25 microm thick Sn foil The energydiscrimination threshold was set to an average value of 27 keV and the X-ray tube voltage was setto 50 kVp The threshold value was chosen to be close to the k-edge of Sn which is 292 keV [7]Setting the threshold as close to the k-edge as possible improves the quality and reliability of thematerial resolved imaging See [1] for details Even though the average threshold value is belowthe energy of the k-edge some of the pixels fall with their true energy threshold above the energyof the k-edge This causes a significant drop in the number of measured counts in these pixelsThe wider spread of threshold values with the chip equalized using the noise floor leads to a highernon-uniformity of the image The presented equalization technique reduces the spread of countsby 40 in this case
It could be argued that the non-uniformity of the detector response in figure 4 could be cor-rected using the flat-field correction or the signal-to-equivalent thickness calibration (STC whichprovides better results than the flat-field correction [6]) Figure 5 shows that the new thresholdequalization technique actually also improves quality of the STC calibrated images
The STC method relies on similarities in the shapes of X-ray attenuation coefficients as func-tions of energy Therefore it satisfactorily corrects non-uniformities in cases where the energy dis-crimination threshold is far enough from the abrupt changes in the attenuation coefficients causedby the k and l-edges However in cases where the energy discrimination threshold is set close tothe energy of k or l-edge higher image uniformity has to be achieved by a better equalization ofthe sensor
ndash 5 ndash
2011 JINST 6 C11012
Figure 4 Histograms and images of the measured number of counts behind a 25 microm thick Sn foil Grey mdashwith the noise based threshold equalization black mdash with the polychromatic X-rays based technique Theenergy threshold was set to value of about 27 keV FWHM of the distribution with noise-based equalizationwas 6650 counts vs 4060 counts in the case of new equalization technique The FWTM was 12700 vs 7600in favour of the new equalization technique
Figure 5 Histograms and images of a 25 microm thick Sn foil after the signal-to-equivalent thickness calibrationThe FWHM of the final distribution was improved by the new equalization technique from 723 to 634 microm(12 improvement) and the FWTM from 1671 to 1099 microm (34 improvement)
5 Conclusion
We have presented a technique of energy discrimination threshold equalization that is based onthe analysis of polychromatic beam attenuation in aluminium foils The FWHM of the thresholdspread with the new equalization technique is about 20 lower compared to the noise-floor basedequalization FWTM values are improved by 40 Our threshold equalization technique com-pared to the mono-energetic X-rays based equalization [5] can be applied without re-arrangingthe X-ray imaging setup The presented threshold equalization procedure is considerably faster(minutes vs hours) thanks to the significantly higher available photon flux in the direct beam of theX-ray tube
Implementation of the new technique utilizes existing mechanical devices for the STC calibra-tion [10] Therefore it can be easily entirely automatized
ndash 6 ndash
2011 JINST 6 C11012
The new threshold equalization technique finds the major application in the material resolvedimaging where it helps to improve the pixel-to-pixel uniformity of the imaging detector
Acknowledgments
We acknowledge the support of CERN Medipix Collaboration in providing a Medixpix2 detectorfor use in these experiments
References
[1] J Uher J Jakubek S Mayo A Stevenson and JTickner X-ray beam hardening based materialrecognition in micro-imaging 2011 JINST 6 P08015
[2] httpmedipixwebcernchMEDIPIX
[3] L Tlustos et al Imaging Properties of the Medipix2 System exploiting Single and Dual EnergyThresholds IEEE T Nuc Sci 53 (2006) 367
[4] T Holy J Jakubek S Pospisil J Uher D Vavrik and Z Vykydal Data acquisition and processingsoftware package for Medipix2 Nucl Instrum Methods A 563 (2006) 254
[5] S Procz J Lubke A Zwerger M Mix and M Fiederle Optimization of Medipix-2 Threshold Masksfor Spectroscopic X-Ray Imaging IEEE T Nuc Sci 56 (2009) 1795
[6] J Jakubek Data processing and image reconstruction methods for pixel detectors Nuc InstrumMethods A 576 (2007) 223
[7] httpphysicsnistgov
[8] J Uher G Harvey and J Jakubek X-ray fluorescence imaging with the Medipix2 single-photoncounting detector IEE Nuclear Science Symposium Conference Record (NSSMIC) (2010)
[9] J Uher G Roach and J Tickner Peak fitting and identification software library for high resolutiongamma-ray spectra Nuc Instrum Methods A 619 (2010) 459
[10] J Jakubek T Holy M Jakubek D Vavrik and Z Vykydal Experimental system for high resolutionX-ray transmission radiography Nuc Instrum Methods A 563 (2006) 278
ndash 7 ndash
- Introduction
- Calculation of polychromatic X-ray beam attenuation curve
- Threshold equalization
- Improvement of signal uniformity in X-ray images
- Conclusion
-
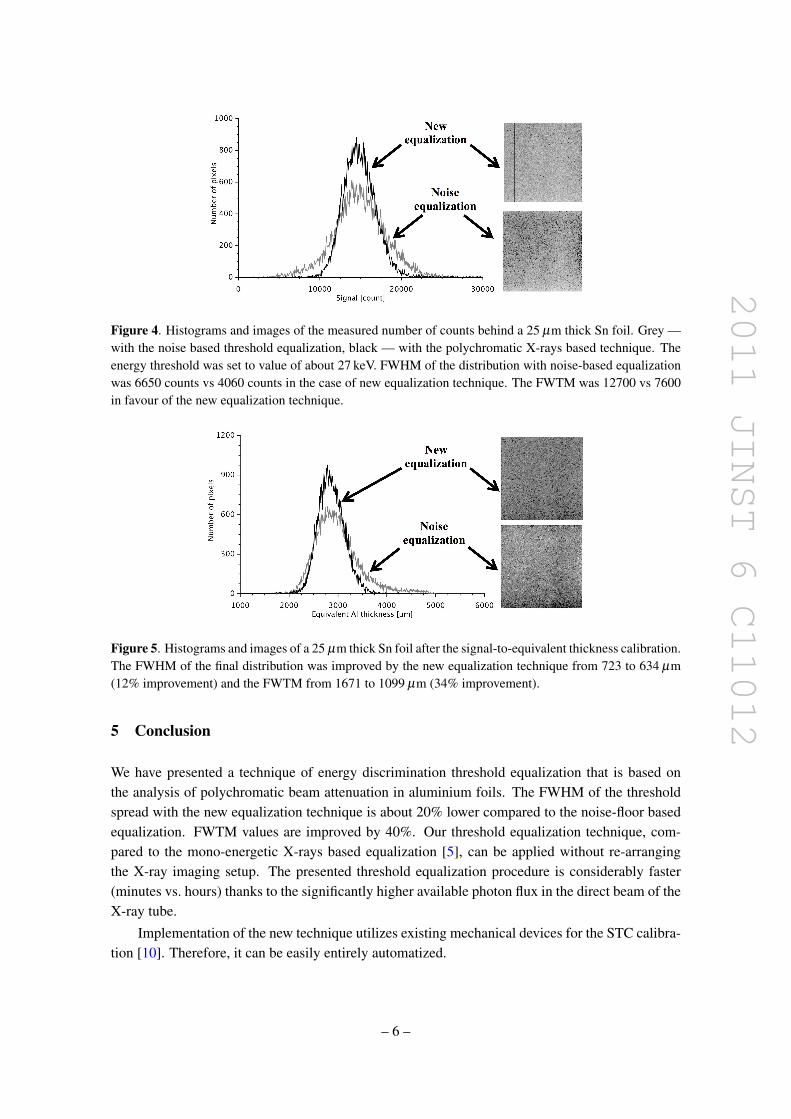
2011 JINST 6 C11012
The new threshold equalization technique finds the major application in the material resolvedimaging where it helps to improve the pixel-to-pixel uniformity of the imaging detector
Acknowledgments
We acknowledge the support of CERN Medipix Collaboration in providing a Medixpix2 detectorfor use in these experiments
References
[1] J Uher J Jakubek S Mayo A Stevenson and JTickner X-ray beam hardening based materialrecognition in micro-imaging 2011 JINST 6 P08015
[2] httpmedipixwebcernchMEDIPIX
[3] L Tlustos et al Imaging Properties of the Medipix2 System exploiting Single and Dual EnergyThresholds IEEE T Nuc Sci 53 (2006) 367
[4] T Holy J Jakubek S Pospisil J Uher D Vavrik and Z Vykydal Data acquisition and processingsoftware package for Medipix2 Nucl Instrum Methods A 563 (2006) 254
[5] S Procz J Lubke A Zwerger M Mix and M Fiederle Optimization of Medipix-2 Threshold Masksfor Spectroscopic X-Ray Imaging IEEE T Nuc Sci 56 (2009) 1795
[6] J Jakubek Data processing and image reconstruction methods for pixel detectors Nuc InstrumMethods A 576 (2007) 223
[7] httpphysicsnistgov
[8] J Uher G Harvey and J Jakubek X-ray fluorescence imaging with the Medipix2 single-photoncounting detector IEE Nuclear Science Symposium Conference Record (NSSMIC) (2010)
[9] J Uher G Roach and J Tickner Peak fitting and identification software library for high resolutiongamma-ray spectra Nuc Instrum Methods A 619 (2010) 459
[10] J Jakubek T Holy M Jakubek D Vavrik and Z Vykydal Experimental system for high resolutionX-ray transmission radiography Nuc Instrum Methods A 563 (2006) 278
ndash 7 ndash
- Introduction
- Calculation of polychromatic X-ray beam attenuation curve
- Threshold equalization
- Improvement of signal uniformity in X-ray images
- Conclusion
-