equipment noise and worker exposure in the coal mining ... · information circular 9492 equipment...
TRANSCRIPT
IC 9492 INFORMATION CIRCULAR/2006
Equipment Noise and Worker Exposure in the Coal Mining Industry
Department of Health and Human Services Centers for Disease Control and Prevention National Institute for Occupational Safety and Health
Information Circular 9492
Equipment Noise and Worker Exposure in the Coal Mining Industry
By Eric R. Bauer, Ph.D., Daniel R. Babich, and Jeffrey R. Vipperman, Ph.D.
DEPARTMENT OF HEALTH AND HUMAN SERVICES Public Health Service
Centers for Disease Control and Prevention National Institute for Occupational Safety and Health
Pittsburgh Research Laboratory Pittsburgh, PA
December 2006

This document is in the public domain and may be freely copied or reprinted.
DISCLAIMER
Mention of any company or product does not constitute endorsement by the National Institute for Occupational Safety and Health (NIOSH). In addition, citations to Web sites external to NIOSH do not constitute NIOSH endorsement of the sponsoring organizations or their programs or products. Furthermore, NIOSH is not responsible for the content of these Web sites.
ORDERING INFORMATION To receive documents or other information about occupational safety and health topics, contact NIOSH at
NIOSH—Publications Dissemination 4676 Columbia Parkway
Cincinnati, OH 45226–1998
Telephone: 1–800–35–NIOSH (1–800–356–4674) Fax: 513–533–8573
e-mail: [email protected]
or visit the NIOSH Web site at www.cdc.gov/niosh
DHHS (NIOSH) Publication No. 2007–105
December 2006
SAFER • HEALTHIER • PEOPLE™
CONTENTS
Page
Abstract ........................................................................................................................................................ 1 Glossary ....................................................................................................................................................... 2 Introduction.................................................................................................................................................. 3 Scope of research ......................................................................................................................................... 5 Instrumentation and data collection ............................................................................................................. 6 Results.......................................................................................................................................................... 9 Underground coal...................................................................................................................................10 Worker dose .....................................................................................................................................11 Task observations.............................................................................................................................11 Equipment noise...............................................................................................................................12 Surface coal............................................................................................................................................15 Worker dose .....................................................................................................................................16 Task observations.............................................................................................................................17 Dragline noise ..................................................................................................................................19 Coal preparation plants ..........................................................................................................................24 Worker dose .....................................................................................................................................24 Task observations.............................................................................................................................26 Area sound levels.............................................................................................................................26 Implications for exposure reduction ............................................................................................................29 Summary ......................................................................................................................................................30 Acknowledgments........................................................................................................................................31 References....................................................................................................................................................31 Appendix A.—Cumulative dose plots: underground coal ..........................................................................33 Appendix B.—Equipment noise profiles: underground coal......................................................................39 Appendix C.—Cumulative dose plots: surface coal ...................................................................................49 Appendix D.—Equipment noise profiles: surface coal ..............................................................................55 Appendix E.—Cumulative dose plots: coal preparation plants ..................................................................62 Appendix F.—Area noise profiles: coal preparation plants........................................................................66
ILLUSTRATIONS
1. Hearing loss as a function of miners’ age.................................................................................... 4 2. Hearing impairment in coal miners, metal/nonmetal miners, and nonoccupationally exposed males ......................................................................................................................... 4 3. Locations of noise surveys........................................................................................................... 6 4. Quest Q–400 dosimeter and microphone placement ................................................................... 8 5. Paper method of task observation ................................................................................................ 8 6. Task observation using a PDA..................................................................................................... 8 7. Mounted Quest 2900 SLM and Brüel & Kjær 2260 Investigator................................................ 9 8. Cumulative dose plot for roof bolter operator, with task observations........................................13 9. Sound profile plot of sound levels for a longwall shearer ...........................................................14 10. Sound profile of sound levels around a dual-boom roof bolter ...................................................14
11. Leq(A) sound levels around a Schroeder model 271 auxiliary fan ...............................................15
ILLUSTRATIONS–Continued
Page 12. Cumulative dose plot for a dragline oiler, Marion 8750 dragline................................................18 13. Cumulative dose plot for oiler when dragline is not operating....................................................18 14. Example of sound level measurement locations in a dragline.....................................................20
15. Motor-generator sets in back of dragline .....................................................................................20 16. Example of hoist and/or drag motors...........................................................................................21 17. Swing motor and gear ..................................................................................................................21 18. Page 736 dragline.........................................................................................................................21 19. Sound profile plot for a Page 736 dragline ..................................................................................22 20. Bucyrus-Erie 1570W dragline .....................................................................................................22 21. Sound profile plot for a Bucyrus-Erie 1570W dragline...............................................................23 22. Marion 8050 dragline...................................................................................................................23 23. Sound profile plot for a Marion 8050 dragline ............................................................................24 24. Typical coal preparation plant construction.................................................................................26 25. Cumulative dose plot for stationary equipment operator.............................................................27 26. Cumulative dose plot for prep plant mechanic ............................................................................27 27. Example of a low-sound-level preparation plant floor ................................................................28 28. Example of a high-sound-level preparation plant floor ...............................................................28 29. Example of a variable-sound-level preparation plant floor .........................................................29 A–1. Cumulative dose plot for a miner/bolter operator........................................................................33 A–2. Cumulative dose plot for right-side roof bolter operator .............................................................34 A–3. Cumulative dose plot for left-side roof bolter operator ...............................................................34 A–4. Cumulative dose plot for continuous mining machine operator..................................................35
A–5. Cumulative dose plot for shuttle car operator..............................................................................35 A–6. Cumulative dose plot for continuous mining machine helper .....................................................36 A–7. Cumulative dose plot for center bolter operator ..........................................................................36 A–8. Cumulative dose plot for head shearer operator ..........................................................................37 A–9. Cumulative dose plot for tail shearer operator.............................................................................37 A–10. Cumulative dose plot for stageloader (headgate) operator ..........................................................38
B–1. Leq(A) sound levels around a Joy miner/bolter during mining.....................................................40 B–2. Leq(A) sound levels around a Joy miner/bolter during bolting cycle ...........................................41 B–3. Leq(A) sound levels around an Alpine miner/bolter during mining only .....................................42 B–4. Leq(A) sound levels around an Alpine miner/bolter during mining and bolting ..........................42 B–5. Leq(A) sound levels around a Joy model 14BU10 loading machine ............................................43 B–6. Leq(A) sound levels around a Fletcher model DR–15–E single-boom roof bolting machine ......44 B–7. Leq(A) sound levels around a McLanahan HV–50 feeder-breaker...............................................45 B–8. Leq(A) sound levels around a Stamler model BF–14A–1Z–530 feeder-breaker..........................45 B–9. Leq(A) sound levels around Spendrup Dual 50 and Dual 60 hp fans ...........................................46
B–10. Leq(A) sound levels near shearer while cutting from tail to head.................................................47 B–11. Leq(A) sound levels around a longwall stageloader......................................................................47 B–12. Leq(A) sound levels around longwall hydraulics ..........................................................................48 C–1. Cumulative dose plot for Marion 8050 dragline oiler .................................................................49 C–2. Cumulative dose plot for Bucyrus-Erie 1260W dragline oiler ....................................................50 C–3. Cumulative dose plot for Bucyrus-Erie 2570W dragline oiler ....................................................50
ILLUSTRATIONS–Continued
Page
C–4. Cumulative dose plot for Marion 8200 dragline oiler .................................................................51 C–5. Cumulative dose plot for Marion 7800 dragline oiler .................................................................51 C–6. Cumulative dose plot for Page 736 dragline oiler/groundsman...................................................52 C–7. Cumulative dose plot for Bucyrus-Erie 1570W dragline oiler ....................................................52 C–8. Cumulative dose plot for Marion 8750 dragline oiler .................................................................53 C–9. Cumulative dose plot for Bucyrus-Erie 1370W dragline oiler ....................................................53 C–10. Cumulative dose plot for welder performing air arcing...............................................................54
D–1. Leq(A) sound levels in house of Page 752 dragline ......................................................................55 D–2. Leq(A) sound levels in house of Page 757 dragline ......................................................................56 D–3. Leq(A) sound levels in house of Bucyrus-Erie 1260W dragline...................................................56 D–4. Leq(A) sound levels in house of Bucyrus-Erie 1310W dragline...................................................57 D–5. Leq(A) sound levels in house of Bucyrus-Erie 2570W dragline...................................................57 D–6. Leq(A) sound levels in house of Marion 195M dragline ..............................................................58 D–7. Leq(A) sound levels in house of Marion 7800 dragline ................................................................58 D–8. Leq(A) sound levels in house of Marion 8200 dragline ................................................................59 D–9. Leq(A) sound levels in house of Marion 8750 dragline, 132-yd3 bucket......................................59
D–10. Leq(A) sound levels in house of Marion 8750 dragline, 110-yd3 bucket......................................60 D–11. Bucyrus-Erie 195B power shovel ................................................................................................60 D–12. Leq(A) sound levels in house of Bucyrus-Erie 195B power shovel..............................................61
E–1. Cumulative dose plot for a froth cell operator .............................................................................62 E–2. Cumulative dose plot for a third-floor operator...........................................................................63 E–3. Cumulative dose plot for an utilityman .......................................................................................63 E–4. Half-shift cumulative dose plot for a wet-plant attendant ...........................................................64 E–5. Cumulative dose plot for a sump floor operator ..........................................................................64 E–6. Cumulative dose plot for a control room operator.......................................................................65 E–7. Cumulative dose plot for a floor 4 plant mechanic......................................................................65 F–1 Leq(A) sound levels on a floor with many (23) vibrating screens ................................................66
F–2. Leq(A) sound levels on a floor with 10 vibrating screens.............................................................67 F–3. Leq(A) sound levels on a floor with eight vibrating screens.........................................................68 F–4. Leq(A) sound levels on a floor with only two vibrating screens...................................................69 F–5. Leq(A) sound levels on bottom floor containing sumps and pumps .............................................70 F–6. Leq(A) sound levels on bottom floor containing sumps, pumps, and belts...................................71 F–7. Leq(A) sound levels on top floor containing raw coal feed belt ...................................................72 F–8. Leq(A) sound levels on floor with mostly centrifuges ..................................................................73 F–9. Leq(A) sound levels on floor with magnetic separators only........................................................74
F–10. Leq(A) sound levels around froth flotation cells ...........................................................................75 F–11. Leq(A) sound levels on floor with primarily belts ........................................................................76 F–12. Leq(A) sound levels on floor with various types of processing equipment ..................................77

TABLES Page
1. Dosimeter settings............................................................................................................................ 6
2. Summary of worker noise exposure ................................................................................................ 9 3. Summary of equipment/area sound level profiles ...........................................................................10 4. Characteristics of underground coal mines surveyed ......................................................................11 5. Worker noise exposures in underground coal mines .......................................................................12 6. Characteristics of surface coal mines surveyed ...............................................................................16 7. Worker noise exposures in draglines ...............................................................................................16 8. Summary of dose measurements inside and outside of surface mining equipment ........................17 9. Summary of sound level measurements in draglines.......................................................................19 10. Characteristics of coal preparation plants surveyed.........................................................................25 11. Worker noise exposures in coal preparation plants .........................................................................25
UNIT OF MEASURE ABBREVIATIONS USED IN THIS REPORT dB decibel Hz hertz dBA decibel, A-weighted min minute in inch sec second ft foot tph ton per hour ft2 square foot yd3 cubic yard hr hour
EQUIPMENT NOISE AND WORKER EXPOSURE IN THE COAL MINING INDUSTRY
By Eric R. Bauer, Ph.D.,1 Daniel R. Babich,1
1Mining engineer, Pittsburgh Research Laboratory, National Institute for Occupational Safety and Health, Pittsburgh, PA.
and Jeffrey R. Vipperman, Ph.D.2
2Associate professor, Department of Mechanical Engineering, University of Pittsburgh, Pittsburgh, PA.
ABSTRACT
Prolonged exposure to loud noise can cause permanent damage to the auditory nerve and/or its sensory components. Despite regulations and efforts by government and industry to reduce noise-induced hearing loss (NIHL), it is still a problem in the U.S. coal mining industry. The Mine Safety and Health Administration noise standard (30 CFR3
3Code of Federal Regulations. See CFR in references.
62), which was enacted in September 2000, is aimed at reducing NIHL in the mining industry. To address NIHL in various aspects of coal mining and provide the necessary information to effectively implement control technologies, the National Institute for Occupational Safety and Health conducted a cross-sectional survey of noise sources and worker noise exposures. Noise surveys consisting of full-shift worker noise exposure (dose) determination, time-motion studies (task observations), and equipment and/or area noise profiling were completed in 8 underground coal mines, 10 surface coal mines, and 8 coal preparation plants. The studies revealed that more than 40% of all workers monitored were subject to noise exposures above 90 dBA TWA8. A summary of these studies is presented, their application to administrative and engineering controls is discussed, and exposure reduction methods are reviewed.
_____________
GLOSSARY
The definitions in this glossary are for the common noise and hearing loss prevention terms used in this report. If a more thorough definition or explanation is needed, see: NIOSH [1998], Franks et al. [1996], 30 CFR 62.101, or 64 Fed. Reg.4
4Federal Register. See Fed. Reg. in references.
2
49548 [1999].
A-weighting.—The weighting curve that accounts for the way the ear perceives the “loudness” of sounds. A-weighting is most responsive to the middle frequencies (500–4,000 Hz).
Criterion level.—The sound level that, if constantly applied for 8 hr, results in a dose of 100% of the permissible exposure level (PEL).
Decibel (dB).—The unit used to express the quantity of sound. The decibel scale is logarithmic: 0 dB approximates the threshold of hearing; 85–95 dB, the threshold of discomfort; and 120–140 dB, the threshold of pain.
Decibel, A-weighted (dBA).—The sound level using A-weighting. Dose.—The amount of actual exposure relative to the amount of allowable exposure. The noise dose is
calculated according to the following formula:
D = (C1/T1 + C2/T2 … + Cn/Tn) × 100,
where Cn = total time of exposure at a specified sound level, hr; and Tn = reference duration of exposure at that sound level, hr.
Dosimeter.—An instrument that measures sound levels over a specified interval, calculates the exposure as a function of sound level and sound duration, and describes the results in terms of dose, time-weighted average, etc.
Equivalent continuous sound level (Leq).—The average sound level for a measurement period based on a 3-dB exchange rate.
Exchange rate.—The relationship between sound level and dose, sometimes referred to as the “doubling rate.” For instance, if the level of an exposure increases by 5 dB (as adopted by the Mine Safety and Health Administration (MSHA)), the dose doubles.
Noise.—Undesired sound. Noise-induced hearing loss (NIHL).—A sensorineural hearing loss that is attributed to noise. Noise reduction rating.—A single-number rating that attempts to describe a hearing protector based on
how much the overall noise level is reduced by the hearing protector. Permissible exposure level (PEL).—A time-weighted average exposure that must not be exceeded
during an 8-hr work shift. The MSHA PEL is 90 dBA. Response.—The time constant of the measurements that accounts for the fluctuations in the sound
levels, i.e., dBA slow or fast. Sound.—Oscillation in pressure of a medium (air) that evokes an auditory sensation. Sound-level meter (SLM).—An instrument that measures sound and provides a readout of the resulting
measurement in decibels. Threshold level.—An exposure level that, when reached or exceeded, may be hazardous. For the
MSHA PEL, the threshold level is 90 dB. Time-weighted average–8 hour (TWA8).—The averaging of different exposure levels during an 8-hr
exposure period that is equivalent to an exposure resulting from a constant noise level.

____________
INTRODUCTION
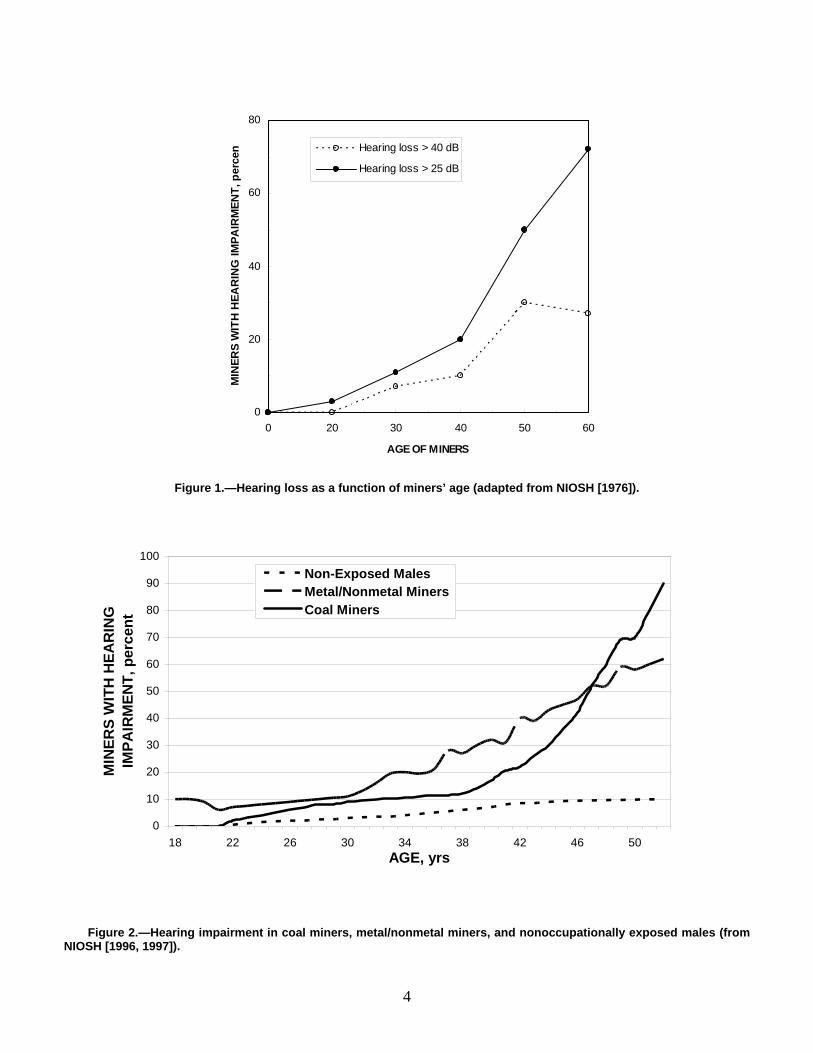
Prolonged exposure to high sound levels generally can cause permanent damage to the auditory nerve and/or its sensory components. This damage is known as noise-induced hearing loss (NIHL). It is irreversible and makes it difficult for the individual to hear and understand speech. NIHL is the most common occupational disease in the United States today. About 30 million workers are exposed to excessive noise levels or toxicants that are potentially hazardous to their hearing [Franks et al. 1996]. The problem is particularly severe in all sectors of mining. A previous analysis of NIHL in 1,349 coal miners revealed an alarming prevalence of severe hearing loss among older miners, as shown in Figure 1 [NIOSH 1976]. The median hearing threshold of retired miners was 20 dB greater than that of the general population. By age 60, more than 70% of miners had a hearing loss of more than 25 dB, and about 25% had a hearing loss of more than 40 dB. A 1996 analysis of NIHL in miners, also performed by NIOSH, showed an apparent worsening of NIHL, as shown in Figure 2. This analysis of a private company’s 20,022 audiograms indicated that the number of miners with hearing impairments increased dramatically with age until age 50, at which time 90% of the miners had hearing impairment [Franks 1996, 1997]. In addition to these findings by government researchers, academics have reported that the “policies and practices for preventing occupational hearing loss among miners are inadequate…there are deficiencies in nearly every sector: surveillance of exposure or of outcome, analysis, and intervention” [Weeks 1995]. The Federal Coal Mine Health and Safety Act of 1969 established requirements for protecting coal miners from excessive noise. Subsequently, the Federal Mine Safety and Health Amendments Act of 1977 broadened the scope to include all miners, regardless of mineral type.5
5A metal/nonmetal noise standard was in place prior to 1977.
Since the passage of these acts, there has been some progress in controlling mining noise. In fact, data from more than 60,000 full-shift MSHA noise surveys show that the noise exposure of certain occupations has decreased since the 1970s [Seiler et al. 1994]. However, in these same surveys, the percentage of coal miners with noise exposures exceeding federal regulations, unadjusted for the wearing of hearing protection, was 26.5% and 21.6% for surface and underground mining, respectively [Seiler et al. 1994]. Despite the extensive work with engineering controls, improved education, and hearing conservation programs in the 1970s and 1980s, NIHL remains one of the most pervasive health hazards in the mining industry [61 Fed. Reg. 66347 (1996)]. In response, MSHA published revised noise health standards for mining [64 Fed. Reg. 49548 (1999)]. One of the changes is the adoption of a provision similar to the Occupational Safety and Health Administration’s (OSHA) Hearing Conservation Amendment [46 Fed. Reg. 42622 (1983)].6
6The OSHA hearing conservation requirement, or action level, is 85 dBA TWA. Action level is exceeded when TWA ≥ 85 dBA, integrating all sounds from 80 to 130 dBA. Exceeding the action level requires program inclusion, hearing tests, and optional hearing protection for the affected worker.
3
MSHA concluded in a recent survey that if an OSHA-like hearing conservation program were adopted, hypothetically, 78% of the coal miners surveyed would be required to be in a hearing conservation program [Seiler and Giardino 1994]. Other requirements of the revised regulations are a permissible exposure level (PEL) of 90 dBA TWA8, no reduction in the noise exposure due to the use of personal hearing protection (which was the policy in coal mines based on the noise reduction rating of the specific hearing protection being worn), and the use of all feasible engineering and administrative controls to reduce a miner’s noise exposure to the PEL.
0
20
40
60
80
MIN
ERS
WIT
H H
EAR
ING
IMPA
IRM
ENT,
per
cen Hearing loss > 40 dB
Hearing loss > 25 dB
0 20 30 40 50 60
AGE OF MINERS
Figure 1.—Hearing loss as a function of miners’ age (adapted from NIOSH [1976]).
100
MIN
ERS
WIT
H H
EAR
ING
IM
PAIR
MEN
T, p
erce
nt
90
80
70
60
50
40
30
20
10
0
Non-Exposed Males Metal/Nonmetal Miners Coal Miners
18 22 26 30 34 38 42 46 50 AGE, yrs
Figure 2.—Hearing impairment in coal miners, metal/nonmetal miners, and nonoccupationally exposed males (from NIOSH [1996, 1997]).
4

A further complication of the NIHL problem in mining is that much of the existing noise and worker exposure information is outdated and has limited value for current research and engineering control decision-making. In many cases, the data are specific to machine type and were obtained simply for characterizing noise sources rather than exposure assessment. There is also a great range in sound levels for a given occupation. For example, sound levels for continuous miner operators have a modal value of 90 dBA and a range that varies from 80 to 105 dBA. As determined by the new noise health standards, a sound level of 80 dBA translates into a daily noise dose of 0%, while a 105-dBA level represents a daily noise dose of 800%. Yet, at present, there is insufficient information to explain this extreme variation in exposure for this and other mining occupations, and an understanding of this variability is necessary to identify appropriate solutions. Specifically, sound level data are needed that provide a time exposure history for workers correlated to information on noise sources. This information will provide the basis for targeting and selecting engineering controls, in combination with administrative controls and personal protection equipment, to reduce noise exposures among the mining workforce.
SCOPE OF RESEARCH
5
This research effort was conducted over several years and included eight underground coal mines, 10 surface coal mines and 8 coal preparation plants throughout the United States (Figure 3). In total, approximately 463 worker noise exposures (MSHA PELs), 75 worker task observations and 231 equipment noise profiles were completed. Noise exposure measurements were taken for longwall and continuous miner section face workers in underground mines, dragline crews at surface mines, and in-plant workers at coal preparation plants. The equipment noise profiles include stationary and semimobile underground mining equipment, floors, control rooms, electrical rooms, maintenance shops, and lunch rooms in preparation plants; and the “house,” revolving frame, and operator’s compartment of draglines. In addition, the mobile equipment at surface mines was monitored for dose inside and outside of the cabs.
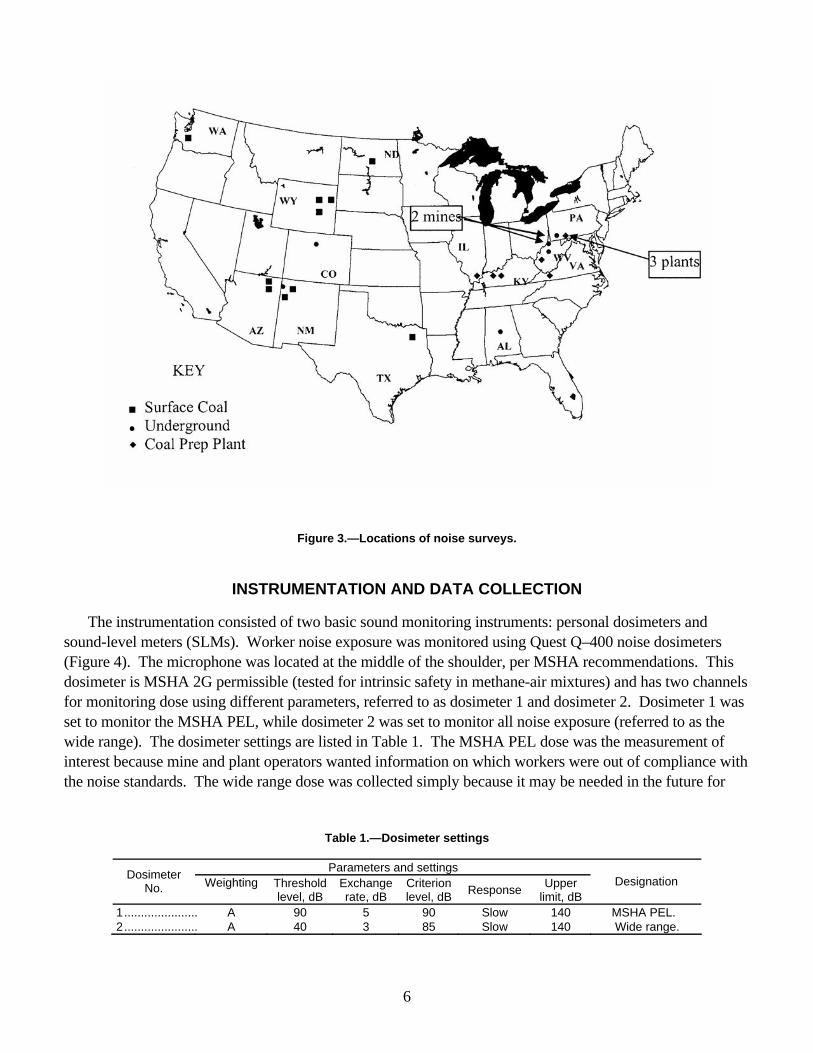
Figure 3.—Locations of noise surveys.
INSTRUMENTATION AND DATA COLLECTION
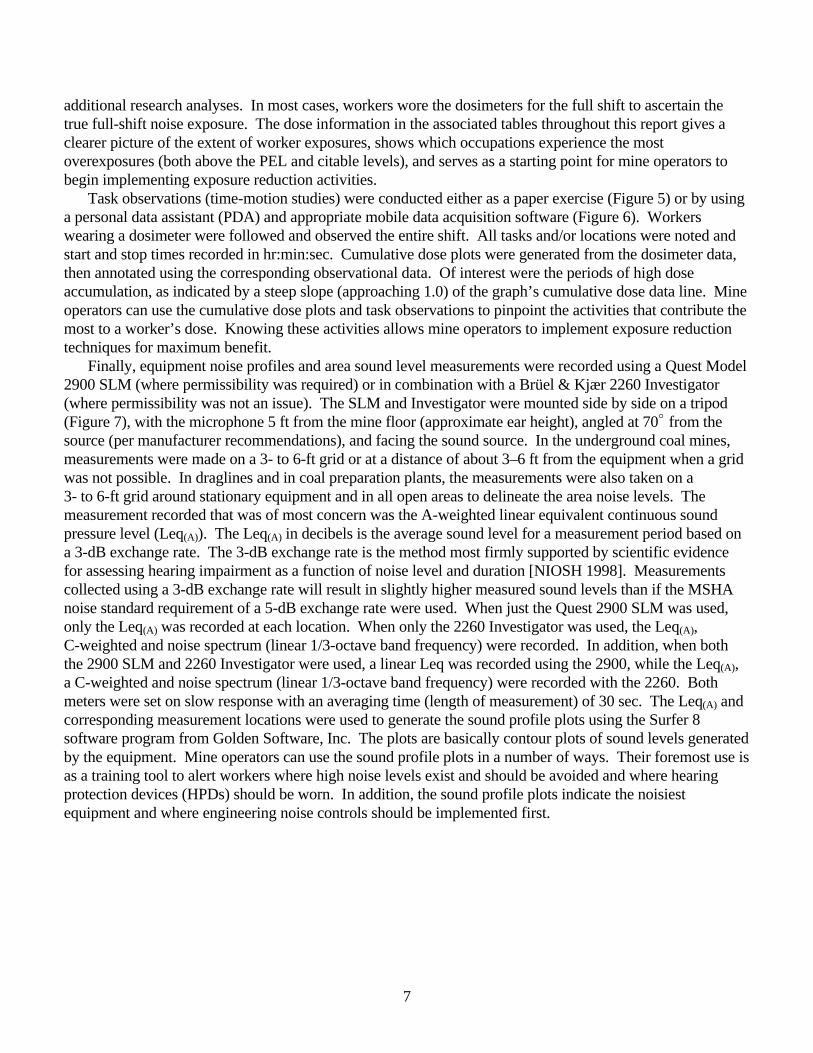
The instrumentation consisted of two basic sound monitoring instruments: personal dosimeters and sound-level meters (SLMs). Worker noise exposure was monitored using Quest Q–400 noise dosimeters (Figure 4). The microphone was located at the middle of the shoulder, per MSHA recommendations. This dosimeter is MSHA 2G permissible (tested for intrinsic safety in methane-air mixtures) and has two channels for monitoring dose using different parameters, referred to as dosimeter 1 and dosimeter 2. Dosimeter 1 was set to monitor the MSHA PEL, while dosimeter 2 was set to monitor all noise exposure (referred to as the wide range). The dosimeter settings are listed in Table 1.
Table 1.—Dosimeter settings
Dosimeter No.
Parameters and settings Designation Weighting Threshold Exchange Criterion Response level, dB rate, dB level, dB
Upper limit, dB
1...................... A 90 5 90 Slow 140 MSHA PEL. 2...................... A 40 3 85 Slow 140 Wide range.
The MSHA PEL dose was the measurement of interest because mine and plant operators wanted information on which workers were out of compliance with the noise standards. The wide range dose was collected simply because it may be needed in the future for
6
additional research analyses. In most cases, workers wore the dosimeters for the full shift to ascertain the true full-shift noise exposure. The dose information in the associated tables throughout this report gives a clearer picture of the extent of worker exposures, shows which occupations experience the most overexposures (both above the PEL and citable levels), and serves as a starting point for mine operators to begin implementing exposure reduction activities.
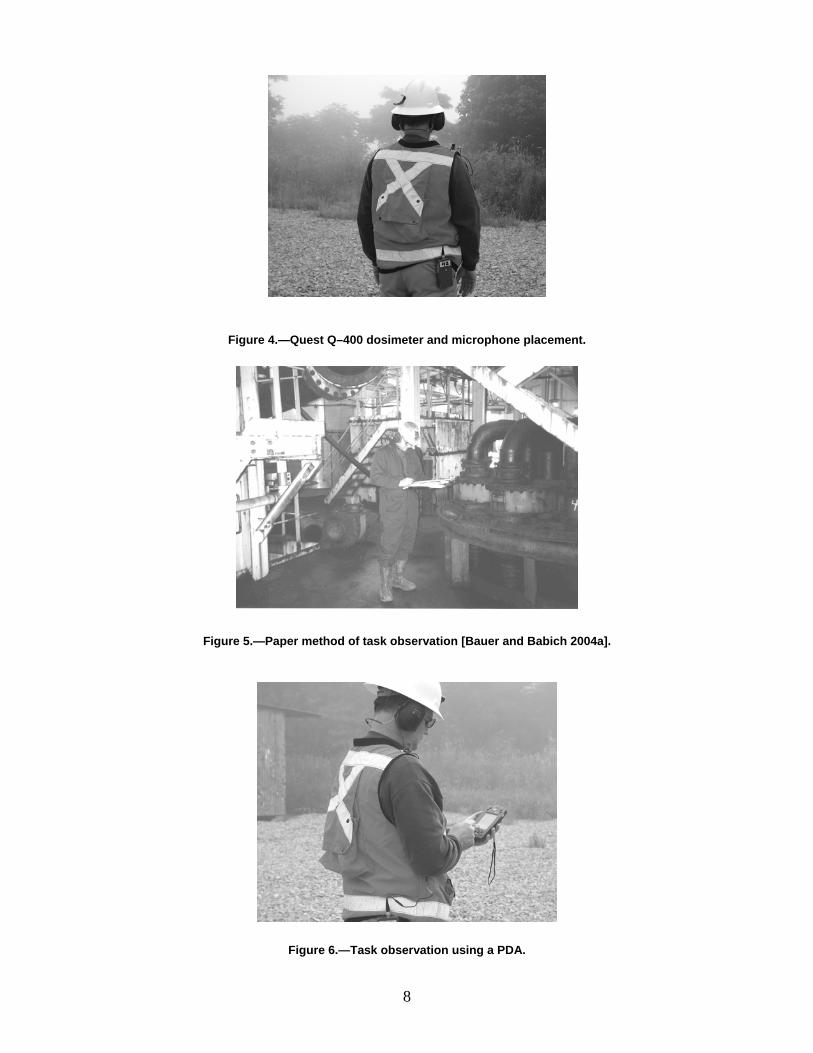
Task observations (time-motion studies) were conducted either as a paper exercise (Figure 5) or by using a personal data assistant (PDA) and appropriate mobile data acquisition software (Figure 6). Workers wearing a dosimeter were followed and observed the entire shift. All tasks and/or locations were noted and start and stop times recorded in hr:min:sec. Cumulative dose plots were generated from the dosimeter data, then annotated using the corresponding observational data. Of interest were the periods of high dose accumulation, as indicated by a steep slope (approaching 1.0) of the graph’s cumulative dose data line. Mine operators can use the cumulative dose plots and task observations to pinpoint the activities that contribute the most to a worker’s dose. Knowing these activities allows mine operators to implement exposure reduction techniques for maximum benefit.
Finally, equipment noise profiles and area sound level measurements were recorded using a Quest Model 2900 SLM (where permissibility was required) or in combination with a Brüel & Kjær 2260 Investigator (where permissibility was not an issue). The SLM and Investigator were mounted side by side on a tripod (Figure 7), with the microphone 5 ft from the mine floor (approximate ear height), angled at 70N from the source (per manufacturer recommendations), and facing the sound source. In the underground coal mines, measurements were made on a 3- to 6-ft grid or at a distance of about 3–6 ft from the equipment when a grid was not possible. In draglines and in coal preparation plants, the measurements were also taken on a 3- to 6-ft grid around stationary equipment and in all open areas to delineate the area noise levels. The measurement recorded that was of most concern was the A-weighted linear equivalent continuous sound pressure level (Leq(A)). The Leq(A) in decibels is the average sound level for a measurement period based on a 3-dB exchange rate. The 3-dB exchange rate is the method most firmly supported by scientific evidence for assessing hearing impairment as a function of noise level and duration [NIOSH 1998]. Measurements collected using a 3-dB exchange rate will result in slightly higher measured sound levels than if the MSHA noise standard requirement of a 5-dB exchange rate were used. When just the Quest 2900 SLM was used, only the Leq(A) was recorded at each location. When only the 2260 Investigator was used, the Leq(A), C-weighted and noise spectrum (linear 1/3-octave band frequency) were recorded. In addition, when both the 2900 SLM and 2260 Investigator were used, a linear Leq was recorded using the 2900, while the Leq(A), a C-weighted and noise spectrum (linear 1/3-octave band frequency) were recorded with the 2260. Both meters were set on slow response with an averaging time (length of measurement) of 30 sec. The Leq(A) and corresponding measurement locations were used to generate the sound profile plots using the Surfer 8 software program from Golden Software, Inc. The plots are basically contour plots of sound levels generated by the equipment. Mine operators can use the sound profile plots in a number of ways. Their foremost use is as a training tool to alert workers where high noise levels exist and should be avoided and where hearing protection devices (HPDs) should be worn. In addition, the sound profile plots indicate the noisiest equipment and where engineering noise controls should be implemented first.
7
Microphone
Dosimeter
Figure 4.—Quest Q–400 dosimeter and microphone placement.
Figure 5.—Paper method of task observation [Bauer and Babich 2004a].
8
Figure 6.—Task observation using a PDA.

Figure 7.—Mounted Quest 2900 SLM (left) and Brüel & Kjær 2260 Investigator (right).
RESULTS
The results are presented by the three main areas of study: underground coal mines, surface coal mines and coal preparation plants. The results presented include worker dose, task observations and cumulative dose plots, and sound profile plots of equipment and area noise levels. In each area of study, only a representative sample of worker exposure (cumulative dose plots) and equipment noise (sound profile plots) are presented. The majority of cumulative dose plots and equipment noise profiles are included in the appendices at the end of this report. Table 2 summarizes the worker noise exposure monitoring for all sites, while Table 3 summarizes the equipment/area sound level profiling for all sites. Comprehensive discussions of the results in Tables 2–3 are provided later in this report in the individual sections pertaining to each of the three study areas.
9
Table 2.—Summary of worker noise exposure
Mine type Total dose measurements
Number (percent) of doses > 100%1
Number (percent) of doses > 132%2
Underground coal ........................... 355 152 (43%) 98 (28%) Surface coal.................................... 63 14 (22%) 10 (16%) Coal preparation plants................... 45 25 (56%) 15 (33%) 1MSHA PEL.
2Citable (>132%) MSHA PEL.
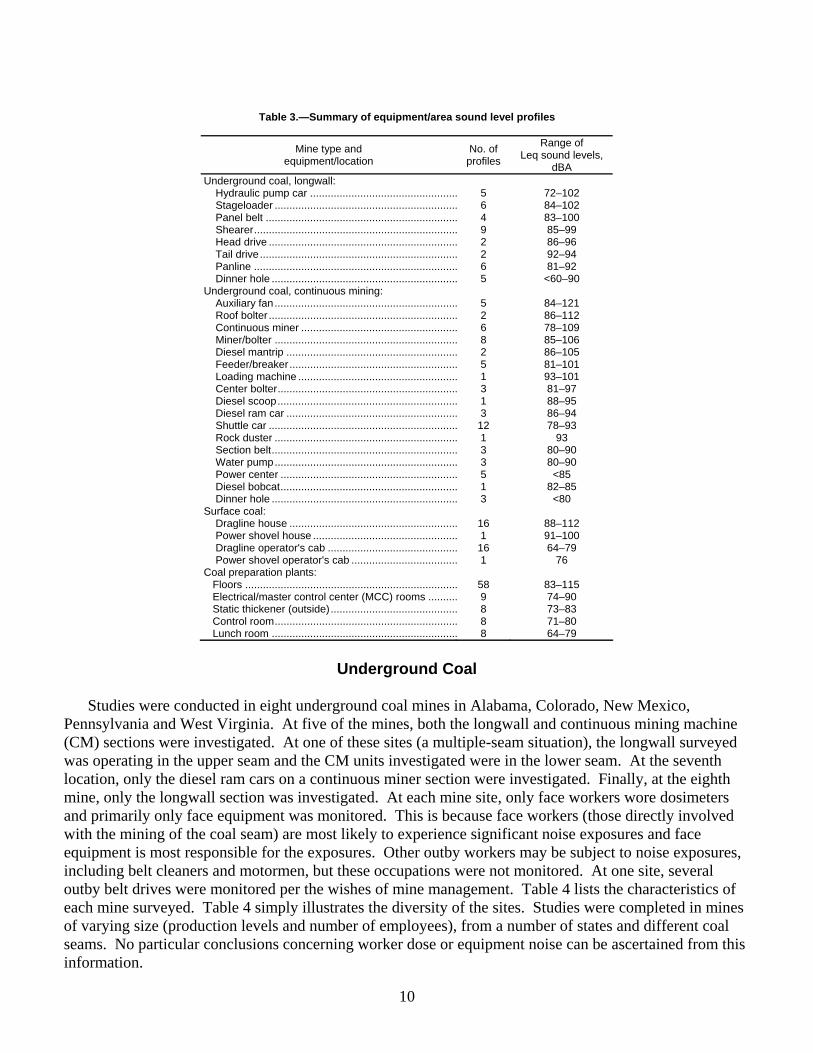
Table 3.—Summary of equipment/area sound level profiles
Mine type and equipment/location
No. of profiles
Range of Leq sound levels,
dBA Underground coal, longwall:
Hydraulic pump car .................................................. Stageloader .............................................................. Panel belt ................................................................. Shearer..................................................................... Head drive ................................................................ Tail drive................................................................... Panline ..................................................................... Dinner hole ...............................................................
Underground coal, continuous mining: Auxiliary fan.............................................................. Roof bolter ................................................................ Continuous miner ..................................................... Miner/bolter .............................................................. Diesel mantrip .......................................................... Feeder/breaker......................................................... Loading machine ...................................................... Center bolter............................................................. Diesel scoop............................................................. Diesel ram car .......................................................... Shuttle car ................................................................ Rock duster .............................................................. Section belt............................................................... Water pump.............................................................. Power center ............................................................ Diesel bobcat............................................................ Dinner hole ...............................................................
Surface coal: Dragline house ......................................................... Power shovel house ................................................. Dragline operator's cab ............................................ Power shovel operator's cab ....................................
Coal preparation plants: Floors ........................................................................ Electrical/master control center (MCC) rooms .......... Static thickener (outside)........................................... Control room.............................................................. Lunch room ...............................................................
5 6 4 9 2 2 6 5
5 2 6 8 2 5 1 3 1 3 12
1 3 3 5 1 3
16
1 16
1
58 9 8 8 8
72–102 84–102 83–100
85–99 86–96 92–94 81–92
<60–90
84–121 86–112 78–109 85–106 86–105 81–101 93–101
81–97 88–95 86–94 78–93
93 80–90 80–90
<85 82–85
<80
88–112 91–100
64–79 76
83–115
74–90 73–83 71–80 64–79
10
Underground Coal
Studies were conducted in eight underground coal mines in Alabama, Colorado, New Mexico, Pennsylvania and West Virginia. At five of the mines, both the longwall and continuous mining machine (CM) sections were investigated. At one of these sites (a multiple-seam situation), the longwall surveyed was operating in the upper seam and the CM units investigated were in the lower seam. At the seventh location, only the diesel ram cars on a continuous miner section were investigated. Finally, at the eighth mine, only the longwall section was investigated. At each mine site, only face workers wore dosimeters and primarily only face equipment was monitored. This is because face workers (those directly involved with the mining of the coal seam) are most likely to experience significant noise exposures and face equipment is most responsible for the exposures. Other outby workers may be subject to noise exposures, including belt cleaners and motormen, but these occupations were not monitored. At one site, several outby belt drives were monitored per the wishes of mine management. Table 4 lists the characteristics of each mine surveyed. Table 4 simply illustrates the diversity of the sites. Studies were completed in mines of varying size (production levels and number of employees), from a number of states and different coal seams. No particular conclusions concerning worker dose or equipment noise can be ascertained from this information.
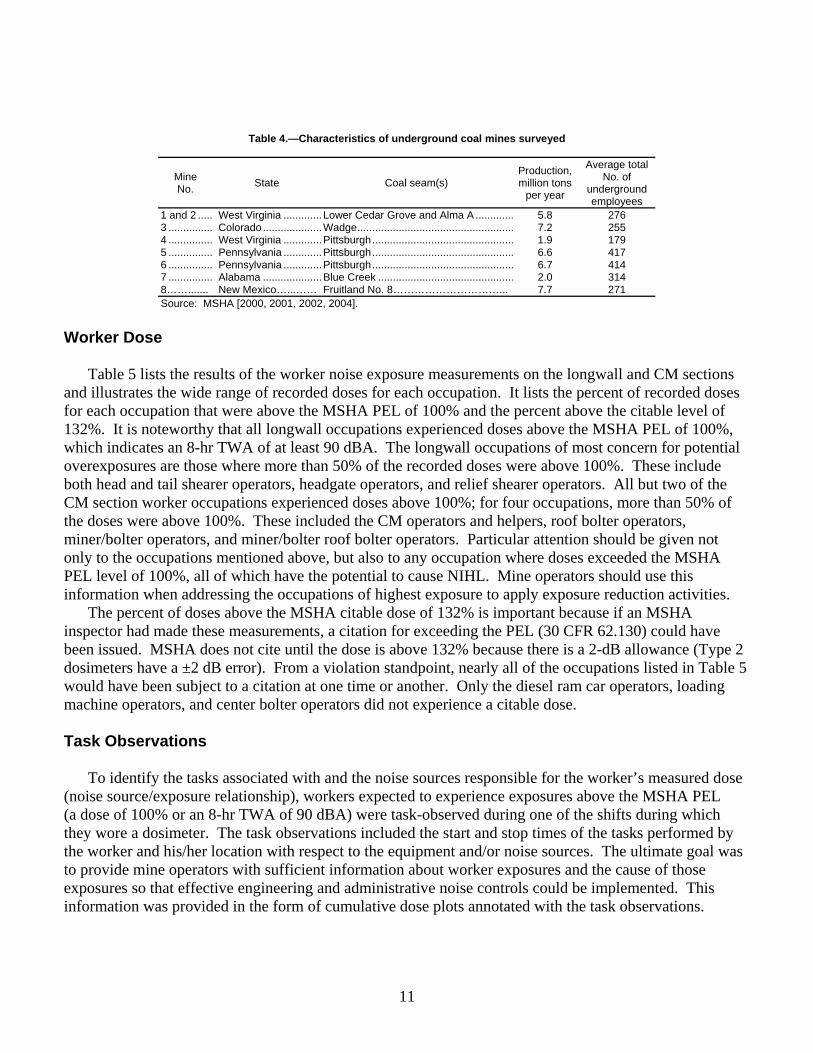
Table 4.—Characteristics of underground coal mines surveyed
Mine No. State Coal seam(s)
Production,million tons
per year
Average totalNo. of
underground employees
1 and 2 ..... West Virginia ............. Lower Cedar Grove and Alma A ............. 5.8 276 3 ............... Colorado....................Wadge..................................................... 7.2 255 4 ............... West Virginia .............Pittsburgh................................................ 1.9 179 5 ............... Pennsylvania .............Pittsburgh................................................ 6.6 417 6 ............... Pennsylvania .............Pittsburgh................................................ 6.7 414 7 ............... Alabama .................... Blue Creek .............................................. 2.0 314 8……....... New Mexico…...…… Fruitland No. 8…………………………... 7.7 271
Source: MSHA [2000, 2001, 2002, 2004].
Worker Dose
Table 5 lists the results of the worker noise exposure measurements on the longwall and CM sections and illustrates the wide range of recorded doses for each occupation. It lists the percent of recorded doses for each occupation that were above the MSHA PEL of 100% and the percent above the citable level of 132%. It is noteworthy that all longwall occupations experienced doses above the MSHA PEL of 100%, which indicates an 8-hr TWA of at least 90 dBA. The longwall occupations of most concern for potential overexposures are those where more than 50% of the recorded doses were above 100%. These include both head and tail shearer operators, headgate operators, and relief shearer operators. All but two of the CM section worker occupations experienced doses above 100%; for four occupations, more than 50% of the doses were above 100%. These included the CM operators and helpers, roof bolter operators, miner/bolter operators, and miner/bolter roof bolter operators. Particular attention should be given not only to the occupations mentioned above, but also to any occupation where doses exceeded the MSHA PEL level of 100%, all of which have the potential to cause NIHL. Mine operators should use this information when addressing the occupations of highest exposure to apply exposure reduction activities.
The percent of doses above the MSHA citable dose of 132% is important because if an MSHA inspector had made these measurements, a citation for exceeding the PEL (30 CFR 62.130) could have been issued. MSHA does not cite until the dose is above 132% because there is a 2-dB allowance (Type 2 dosimeters have a ±2 dB error). From a violation standpoint, nearly all of the occupations listed in Table 5 would have been subject to a citation at one time or another. Only the diesel ram car operators, loading machine operators, and center bolter operators did not experience a citable dose.
Task Observations
To identify the tasks associated with and the noise sources responsible for the worker’s measured dose (noise source/exposure relationship), workers expected to experience exposures above the MSHA PEL (a dose of 100% or an 8-hr TWA of 90 dBA) were task-observed during one of the shifts during which they wore a dosimeter. The task observations included the start and stop times of the tasks performed by the worker and his/her location with respect to the equipment and/or noise sources. The ultimate goal was to provide mine operators with sufficient information about worker exposures and the cause of those exposures so that effective engineering and administrative noise controls could be implemented. This information was provided in the form of cumulative dose plots annotated with the task observations.
11
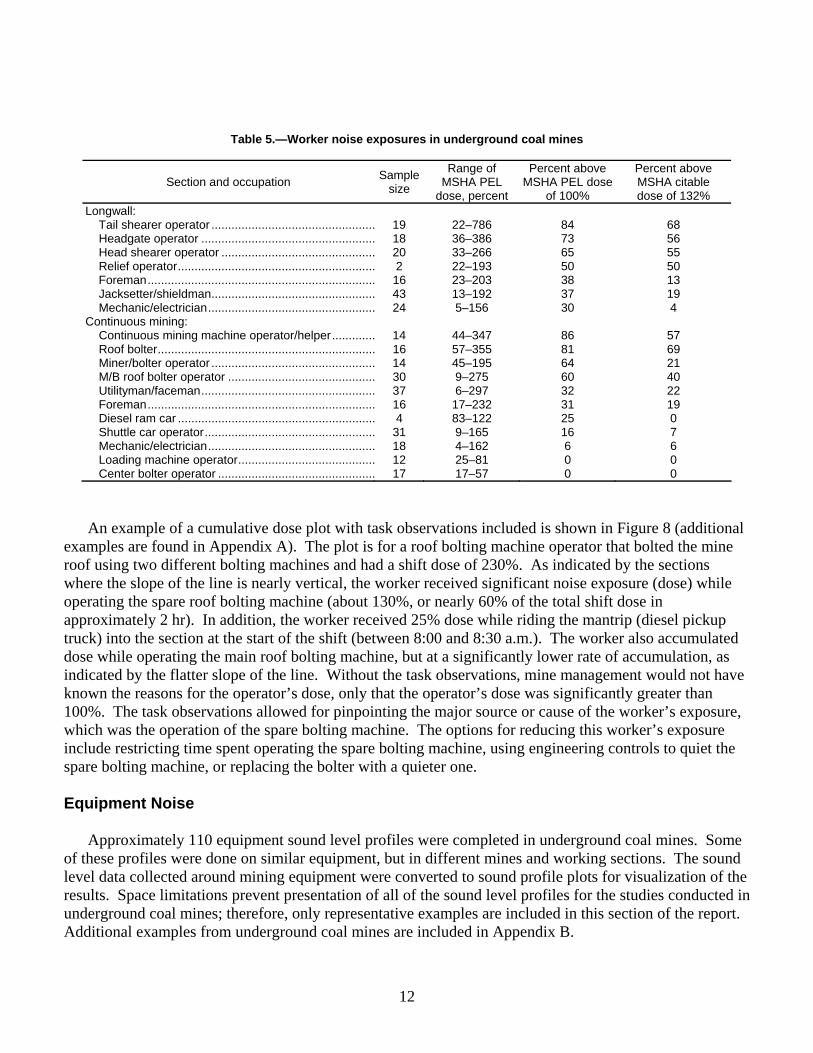
Table 5.—Worker noise exposures in underground coal mines
Section and occupation Sample size
Range of MSHA PEL
dose, percent
Percent above MSHA PEL dose
of 100%
Percent above MSHA citable
dose of 132% Longwall:
Tail shearer operator ................................................. Headgate operator .................................................... Head shearer operator .............................................. Relief operator........................................................... Foreman.................................................................... Jacksetter/shieldman................................................. Mechanic/electrician..................................................
Continuous mining: Continuous mining machine operator/helper............. Roof bolter................................................................. Miner/bolter operator ................................................. M/B roof bolter operator ............................................ Utilityman/faceman.................................................... Foreman.................................................................... Diesel ram car ........................................................... Shuttle car operator................................................... Mechanic/electrician.................................................. Loading machine operator......................................... Center bolter operator ...............................................
19 18 20
2 16 43 24
14 16 14 30 37 16
4 31
18 12 17
22–786 36–386
33–266 22–193 23–203 13–192
5–156
44–347 57–355 45–195
9–275 6–297 17–232 83–122
9–165 4–162 25–81 17–57
84 73 65 50 38 37 30
86
81 64 60 32 31 25 16
6 0 0
68 56 55 50 13 19
4
57 69 21 40 22 19
0 7 6 0 0
An example of a cumulative dose plot with task observations included is shown in Figure 8 (additional examples are found in Appendix A). The plot is for a roof bolting machine operator that bolted the mine roof using two different bolting machines and had a shift dose of 230%. As indicated by the sections where the slope of the line is nearly vertical, the worker received significant noise exposure (dose) while operating the spare roof bolting machine (about 130%, or nearly 60% of the total shift dose in approximately 2 hr). In addition, the worker received 25% dose while riding the mantrip (diesel pickup truck) into the section at the start of the shift (between 8:00 and 8:30 a.m.). The worker also accumulated dose while operating the main roof bolting machine, but at a significantly lower rate of accumulation, as indicated by the flatter slope of the line. Without the task observations, mine management would not have known the reasons for the operator’s dose, only that the operator’s dose was significantly greater than 100%. The task observations allowed for pinpointing the major source or cause of the worker’s exposure, which was the operation of the spare bolting machine. The options for reducing this worker’s exposure include restricting time spent operating the spare bolting machine, using engineering controls to quiet the spare bolting machine, or replacing the bolter with a quieter one.
Equipment Noise
Approximately 110 equipment sound level profiles were completed in underground coal mines. Some of these profiles were done on similar equipment, but in different mines and working sections. The sound level data collected around mining equipment were converted to sound profile plots for visualization of the results. Space limitations prevent presentation of all of the sound level profiles for the studies conducted in underground coal mines; therefore, only representative examples are included in this section of the report. Additional examples from underground coal mines are included in Appendix B.
12

250
Bolting with main RBM 200
nt
, p
erce Tramming RBM
C
UM
ULA
TIV
E D
OSE 150
100
Lunch High noise accumulation Percent 50 Bolting with spare RBM
exposure PEL-90dB
0 8:00 9:00 10:00 11:00 12:00 1:00 2:00 3:00 4:00 5:00
TIME OF SHIFT
Duration of exposure
Figure 8.—Cumulative dose plot for roof bolter operator, with task observations.
Figure 9 is a sound profile plot for a longwall shearer as it cuts from head to tail. In this cutting direction, the tail drum cuts most of the coal and trims the roof, while the head drum simply cleans up along the mine floor. This figure illustrates that if the head drum shearer operator remains positioned 10 ft or more outby (toward the head and stageloader) the head drum, the sound levels are less than 90 dBA; thus, for an 8-hr shift and if the head shearer operator has no other exposure sources, the dose would be less than the MSHA PEL of 100%. On the other hand, the tail drum shearer operator needs to be positioned as far toward the head as possible, or at least at the middle of the shearer, to minimize noise exposure. Even at the midpoint of the shearer, the noise levels are between 90 and 95 dBA; thus, the operator is likely to be overexposed there or wherever he/she is positioned along the shearer.
Figure 10 shows the sound levels recorded around a dual-boom roof bolting machine (Fletcher RRII– 15–B) being operated on a continuous miner section. As expected, the highest sound levels were recorded near the operator’s locations during the bolting cycle, which included drilling the hole, inserting the bolt, and spinning the bolt to mix the resin. Sound levels are highest here because of drilling noise, drill steel/metal strap contact squeal, and machine hydraulics. Sound levels dropped below 90 dBA about 12 ft outby the drill. Note that the sound level above 110 dBA in the upper left corner of the plot was not actually recorded, but is a result of the existing data point interpolation process within the software contouring package. The implications for exposure reduction are that the drilling end of the machine should be addressed first when implementing engineering noise controls because the more significant exposure sources are found there. This would result in greater exposure reduction for the operators than if the drill exhaust muffler noise were addressed first.
13
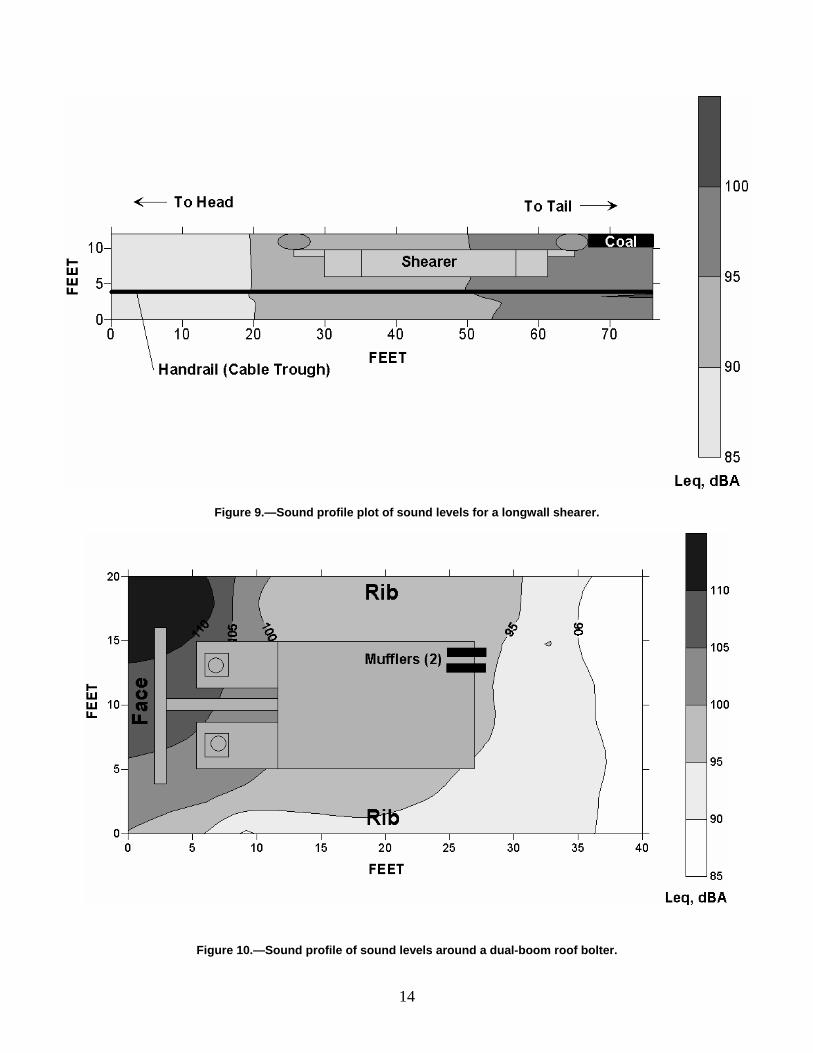
Figure 9.—Sound profile plot of sound levels for a longwall shearer.
Figure 10.—Sound profile of sound levels around a dual-boom roof bolter.
14

Finally, Figure 11 shows the noise levels measured around an auxiliary fan in a miner/bolter section.
Figure 11.—Leq(A) sound levels around a Schroeder Model 271 auxiliary fan.
This sound profile plot reveals that even in the main entry (listed as “No. 2 Entry” in Figure 11) where workers and equipment routinely travel, the sound level is still above 95 dBA. It is apparent that mine workers are subjected to unnecessary exposures when near the auxiliary fan; thus, standing, congregating, or working near the fan should be avoided.
Surface Coal
Studies were conducted in 10 surface coal mines in Arizona, New Mexico, North Dakota, Texas, Washington, and Wyoming. The mines used draglines for primary overburden removal and, in most cases, extracted several seams of varying thickness. The investigations at surface coal mines concentrated on the draglines, mostly because of company interest and the high exposure of dragline oilers; however, a power shovel, dozers and other surface mining equipment were investigated at some of the mines. Table 6 summarizes the characteristics of the mines surveyed.
15
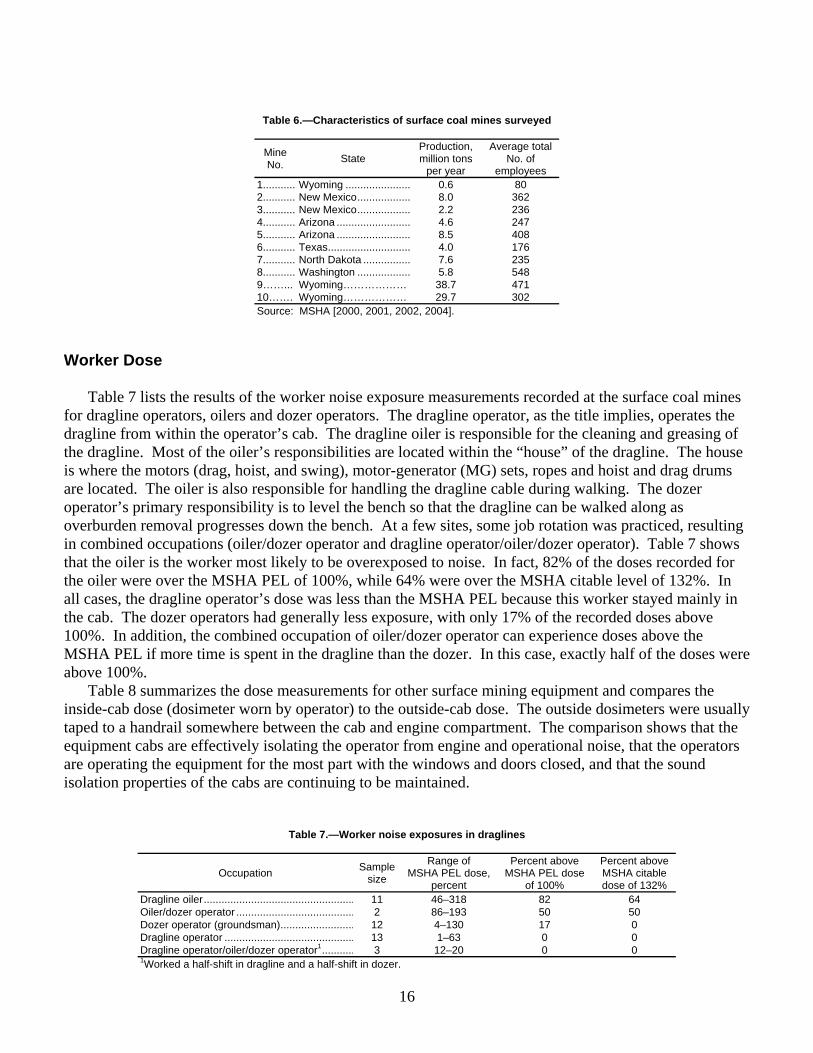
Table 6.—Characteristics of surface coal mines surveyed
Production, Average totalMine State million tons No. ofNo. per year employees 1............Wyoming ...................... 0.6 80 2............New Mexico.................. 8.0 362 3............New Mexico.................. 2.2 236 4............Arizona ......................... 4.6 247 5............Arizona ......................... 8.5 408 6............Texas............................ 4.0 176 7............North Dakota ................ 7.6 235 8............Washington .................. 5.8 548 9……... Wyoming……………… 38.7 471 10……. Wyoming……………… 29.7 302 Source: MSHA [2000, 2001, 2002, 2004].
Worker Dose Table 7 lists the results of the worker noise exposure measurements recorded at the surface coal mines for dragline operators, oilers and dozer operators.
Table 7.—Worker noise exposures in draglines
Occupation Sample size
Range of MSHA PEL dose,
percent
Percent above MSHA PEL dose
of 100%
Percent aboveMSHA citable
dose of 132% Dragline oiler................................................... 11 46–318 82 64 Oiler/dozer operator ........................................ 2 86–193 50 50 Dozer operator (groundsman)......................... 12 4–130 17 0 Dragline operator ............................................ 13 1–63 0 0 Dragline operator/oiler/dozer operator1 ........... 3 12–20 0 0 1Worked a half-shift in dragline and a half-shift in dozer.
The dragline operator, as the title implies, operates the dragline from within the operator’s cab. The dragline oiler is responsible for the cleaning and greasing of the dragline. Most of the oiler’s responsibilities are located within the “house” of the dragline. The house is where the motors (drag, hoist, and swing), motor-generator (MG) sets, ropes and hoist and drag drums are located. The oiler is also responsible for handling the dragline cable during walking. The dozer operator’s primary responsibility is to level the bench so that the dragline can be walked along as overburden removal progresses down the bench. At a few sites, some job rotation was practiced, resulting in combined occupations (oiler/dozer operator and dragline operator/oiler/dozer operator). Table 7 shows that the oiler is the worker most likely to be overexposed to noise. In fact, 82% of the doses recorded for the oiler were over the MSHA PEL of 100%, while 64% were over the MSHA citable level of 132%. In all cases, the dragline operator’s dose was less than the MSHA PEL because this worker stayed mainly in the cab. The dozer operators had generally less exposure, with only 17% of the recorded doses above 100%. In addition, the combined occupation of oiler/dozer operator can experience doses above the MSHA PEL if more time is spent in the dragline than the dozer. In this case, exactly half of the doses were above 100%.
Table 8 summarizes the dose measurements for other surface mining equipment and compares the inside-cab dose (dosimeter worn by operator) to the outside-cab dose. The outside dosimeters were usually taped to a handrail somewhere between the cab and engine compartment. The comparison shows that the equipment cabs are effectively isolating the operator from engine and operational noise, that the operators are operating the equipment for the most part with the windows and doors closed, and that the sound isolation properties of the cabs are continuing to be maintained.
16
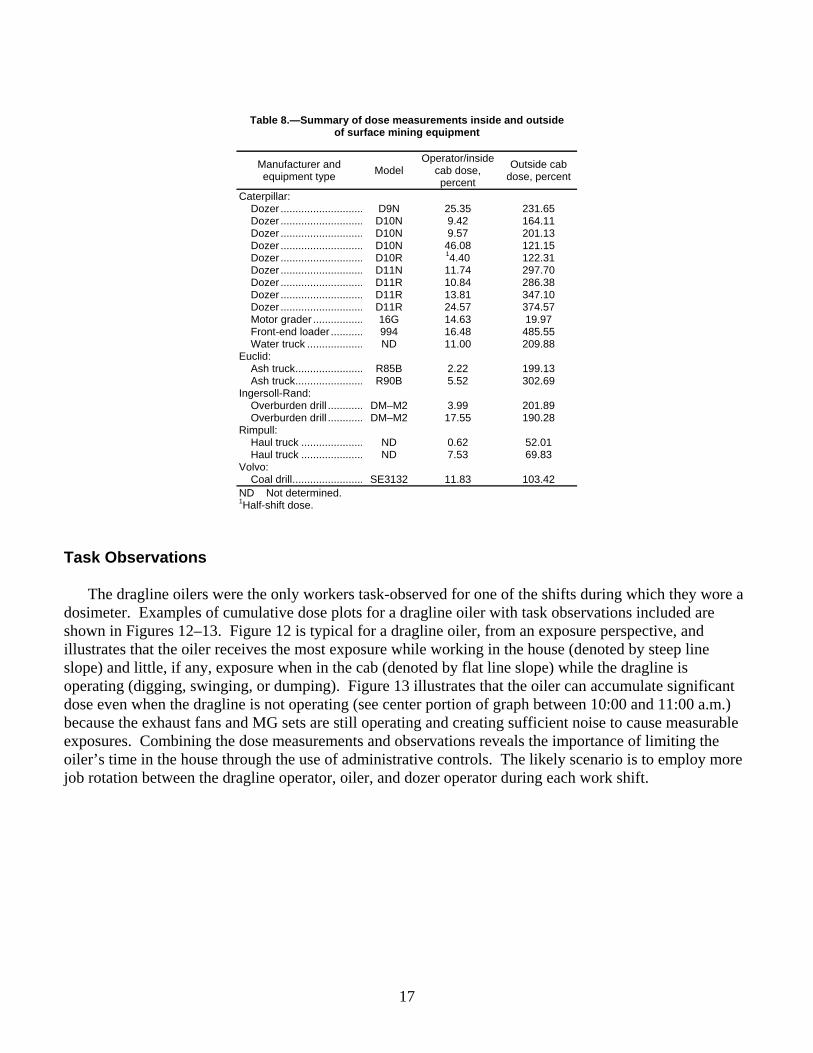
Table 8.—Summary of dose measurements inside and outside of surface mining equipment
Manufacturer and equipment type Model
Operator/inside cab dose, percent
Outside cab dose, percent
Caterpillar: Dozer ............................ Dozer ............................ Dozer ............................ Dozer ............................ Dozer ............................ Dozer ............................ Dozer ............................ Dozer ............................ Dozer ............................ Motor grader ................. Front-end loader ........... Water truck ...................
Euclid: Ash truck....................... Ash truck....................... Ingersoll-Rand: Overburden drill ............ Overburden drill ............
Rimpull: Haul truck ..................... Haul truck ..................... Volvo: Coal drill........................
D9N D10N D10N D10N D10R D11N D11R D11R D11R
16G 994
ND
R85B R90B
DM–M2 DM–M2
ND ND
SE3132
25.35 9.42 9.57 46.08 14.40 11.74 10.84 13.81 24.57 14.63 16.48 11.00
2.22 5.52
3.99 17.55
0.62 7.53
11.83
231.65
164.11 201.13
121.15 122.31 297.70 286.38 347.10 374.57
19.97 485.55 209.88
199.13 302.69
201.89 190.28
52.01 69.83
103.42
ND Not determined. 1Half-shift dose.
Task Observations
The dragline oilers were the only workers task-observed for one of the shifts during which they wore a dosimeter. Examples of cumulative dose plots for a dragline oiler with task observations included are shown in Figures 12–13. Figure 12 is typical for a dragline oiler, from an exposure perspective, and illustrates that the oiler receives the most exposure while working in the house (denoted by steep line slope) and little, if any, exposure when in the cab (denoted by flat line slope) while the dragline is operating (digging, swinging, or dumping). Figure 13 illustrates that the oiler can accumulate significant dose even when the dragline is not operating (see center portion of graph between 10:00 and 11:00 a.m.) because the exhaust fans and MG sets are still operating and creating sufficient noise to cause measurable exposures. Combining the dose measurements and observations reveals the importance of limiting the oiler’s time in the house through the use of administrative controls. The likely scenario is to employ more job rotation between the dragline operator, oiler, and dozer operator during each work shift.
17

CU
MU
LATI
VE D
OS
E, p
erce
nt
200
In house, sweeping, using comp. air In cab 150
In cab 100
Walking Cleaning mostly in rev. frame
50 In cab
Safety checks in house PEL-90dB 0
7:00 8:00 9:00 10:00 11:00 12:00 1:00 2:00 3:00 TIME OF SHIFT
Figure 12.–Cumulative dose plot for a dragline oiler, Marion 8750 dragline [Bauer and Babich 2003, 2004b].
180 No observations
160 In cab, lunch and operating dragline
140
CU
MU
LATI
VE
DO
SE
, per
cent
On cable tractor 120
In house and revolving frame
100 In house mopping while motor blowers down and dragline not working Outside cleaning steps
80
60
40 In cab In house and revolving frame
Off dragline in cable tractor 20 MSHA PEL, 90 dB In house In house and cab
0 7:00 8:00 9:00 10:00 11:00 12:00 1:00 2:00 3:00 4:00
TIME OF SHIFT
Figure 13.—Cumulative dose plot for oiler when dragline is not operating.
18
Dragline Noise
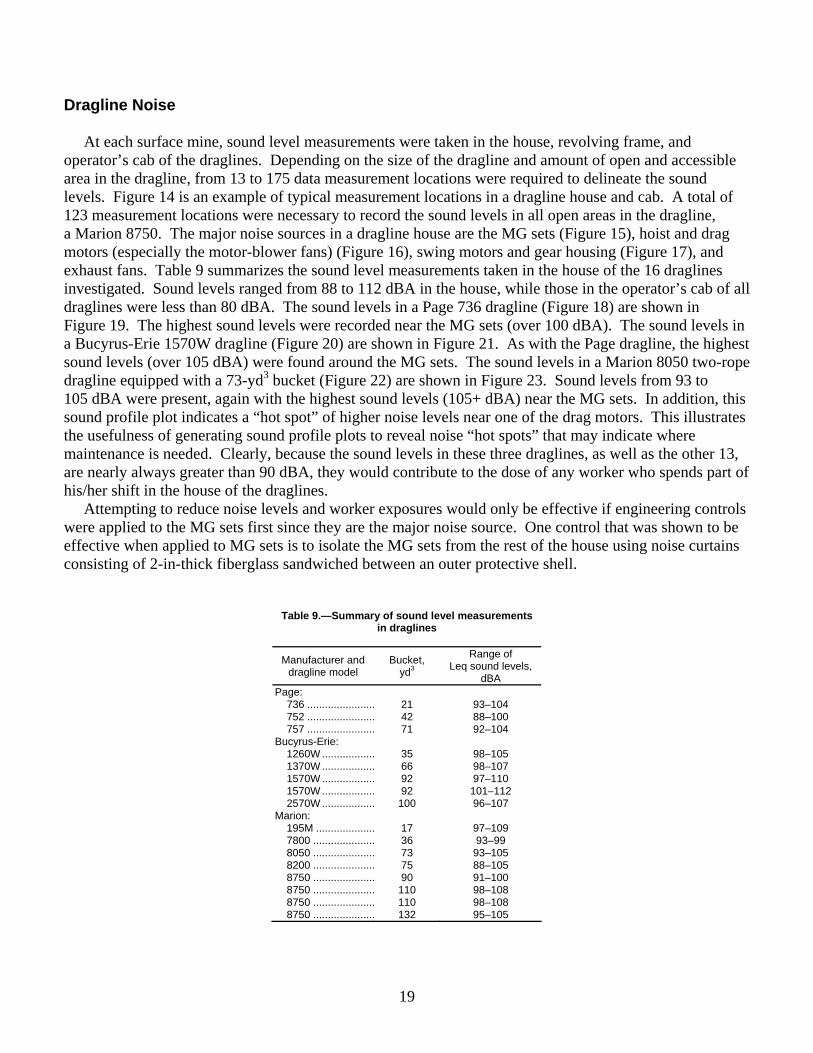
At each surface mine, sound level measurements were taken in the house, revolving frame, and operator’s cab of the draglines. Depending on the size of the dragline and amount of open and accessible area in the dragline, from 13 to 175 data measurement locations were required to delineate the sound levels. Figure 14 is an example of typical measurement locations in a dragline house and cab. A total of 123 measurement locations were necessary to record the sound levels in all open areas in the dragline, a Marion 8750. The major noise sources in a dragline house are the MG sets (Figure 15), hoist and drag motors (especially the motor-blower fans) (Figure 16), swing motors and gear housing (Figure 17), and exhaust fans. Table 9 summarizes the sound level measurements taken in the house of the 16 draglines investigated.
Table 9.—Summary of sound level measurements in draglines
Manufacturer and dragline model
Bucket, yd3
Range of Leq sound levels,
dBA Page:
736 ....................... 752 ....................... 757 .......................
Bucyrus-Erie: 1260W .................. 1370W .................. 1570W .................. 1570W .................. 2570W ..................
Marion: 195M .................... 7800 ..................... 8050 ..................... 8200 ..................... 8750 ..................... 8750 ..................... 8750 ..................... 8750 .....................
21 42 71
35 66 92 92 100
17 36 73 75 90 110 110 132
93–104 88–100 92–104
98–105 98–107 97–110
101–112 96–107
97–109 93–99 93–105 88–105 91–100 98–108 98–108 95–105
Sound levels ranged from 88 to 112 dBA in the house, while those in the operator’s cab of all draglines were less than 80 dBA. The sound levels in a Page 736 dragline (Figure 18) are shown in Figure 19. The highest sound levels were recorded near the MG sets (over 100 dBA). The sound levels in a Bucyrus-Erie 1570W dragline (Figure 20) are shown in Figure 21. As with the Page dragline, the highest sound levels (over 105 dBA) were found around the MG sets. The sound levels in a Marion 8050 two-rope dragline equipped with a 73-yd3 bucket (Figure 22) are shown in Figure 23. Sound levels from 93 to 105 dBA were present, again with the highest sound levels (105+ dBA) near the MG sets. In addition, this sound profile plot indicates a “hot spot” of higher noise levels near one of the drag motors. This illustrates the usefulness of generating sound profile plots to reveal noise “hot spots” that may indicate where maintenance is needed. Clearly, because the sound levels in these three draglines, as well as the other 13, are nearly always greater than 90 dBA, they would contribute to the dose of any worker who spends part of his/her shift in the house of the draglines.
Attempting to reduce noise levels and worker exposures would only be effective if engineering controls were applied to the MG sets first since they are the major noise source. One control that was shown to be effective when applied to MG sets is to isolate the MG sets from the rest of the house using noise curtains consisting of 2-in-thick fiberglass sandwiched between an outer protective shell.
19
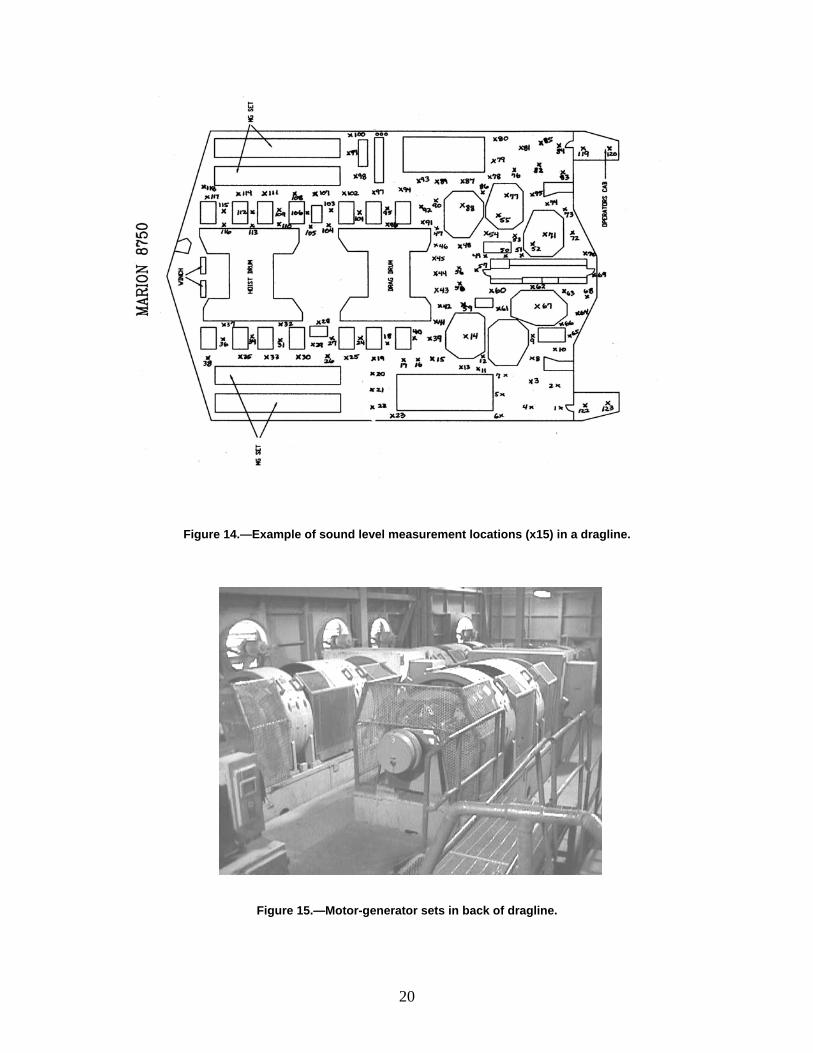
Figure 14.—Example of sound level measurement locations (x15) in a dragline.
20
Figure 15.—Motor-generator sets in back of dragline.

Figure 16.—Example of hoist and/or drag motors.
Figure 17.—Swing motor and gear.
Figure 18.—Page 736 dragline.
21
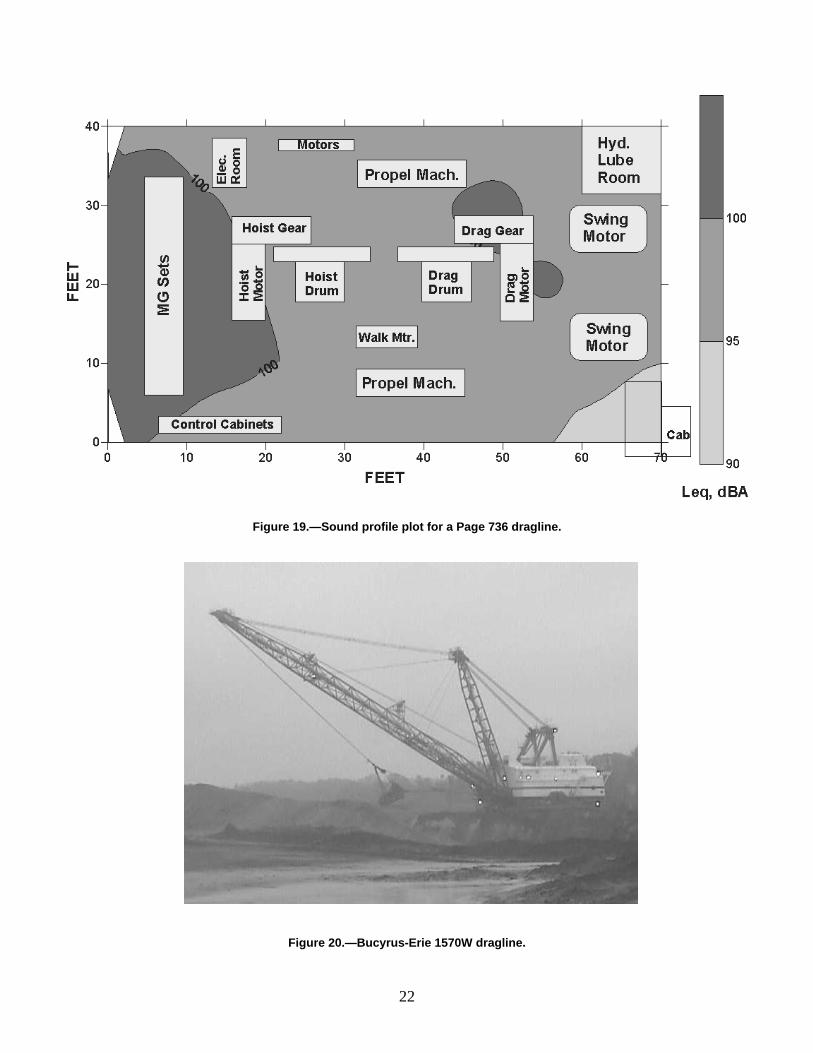
Figure 19.—Sound profile plot for a Page 736 dragline.
Figure 20.—Bucyrus-Erie 1570W dragline.
22
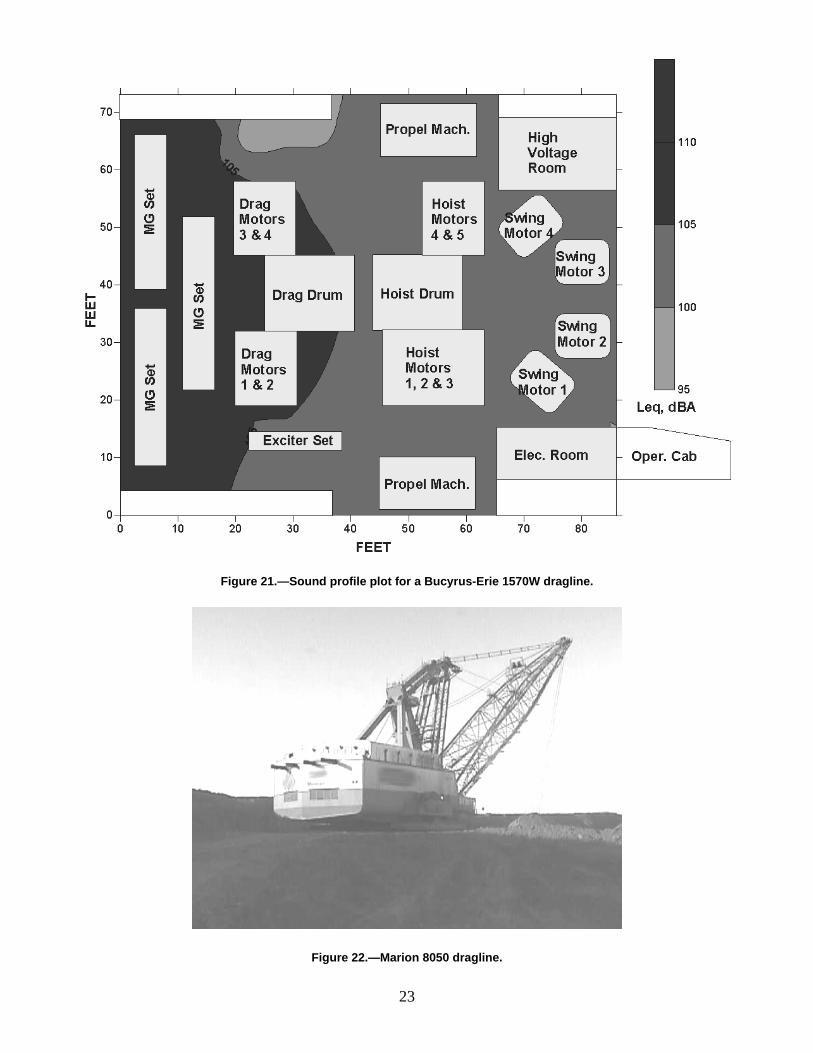
Figure 21.—Sound profile plot for a Bucyrus-Erie 1570W dragline.
Figure 22.—Marion 8050 dragline.
23
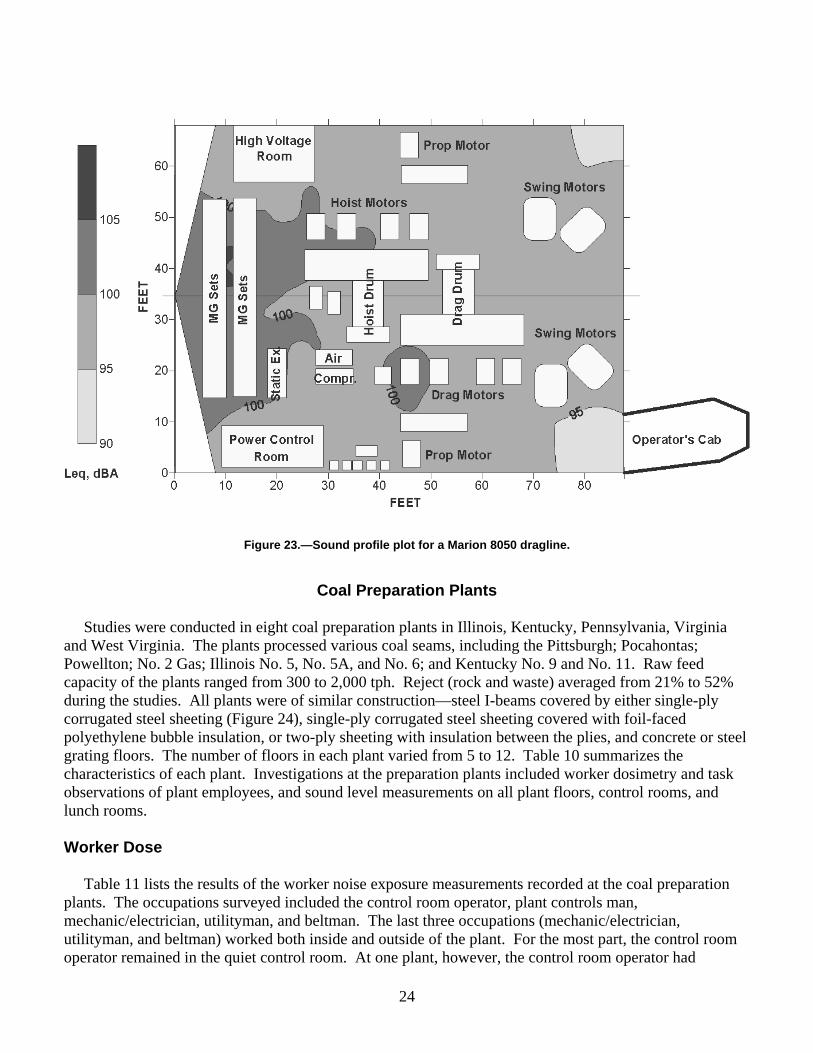
Figure 23.—Sound profile plot for a Marion 8050 dragline.
24
Coal Preparation Plants
Studies were conducted in eight coal preparation plants in Illinois, Kentucky, Pennsylvania, Virginia and West Virginia. The plants processed various coal seams, including the Pittsburgh; Pocahontas; Powellton; No. 2 Gas; Illinois No. 5, No. 5A, and No. 6; and Kentucky No. 9 and No. 11. Raw feed capacity of the plants ranged from 300 to 2,000 tph. Reject (rock and waste) averaged from 21% to 52% during the studies. All plants were of similar construction—steel I-beams covered by either single-ply corrugated steel sheeting (Figure 24), single-ply corrugated steel sheeting covered with foil-faced polyethylene bubble insulation, or two-ply sheeting with insulation between the plies, and concrete or steel grating floors. The number of floors in each plant varied from 5 to 12. Table 10 summarizes the characteristics of each plant. Investigations at the preparation plants included worker dosimetry and task observations of plant employees, and sound level measurements on all plant floors, control rooms, and lunch rooms.
Worker Dose
Table 11 lists the results of the worker noise exposure measurements recorded at the coal preparation plants. The occupations surveyed included the control room operator, plant controls man, mechanic/electrician, utilityman, and beltman. The last three occupations (mechanic/electrician, utilityman, and beltman) worked both inside and outside of the plant. For the most part, the control room operator remained in the quiet control room. At one plant, however, the control room operator had

responsibilities on the floor outside of the control room, resulting in a dose of almost 100%. The plant operator is a catch-all title for any number of job classifications that require the worker to spend a considerable portion of the shift in the plant conducting equipment and process checks, cleaning, and taking process/flow/mixture status measurements. The occupations included in the plant operator category were plant controls man, froth cell operator, stationary equipment operator, third floor operator, wet-plant attendant, sump floor operator, plant backup, and floor plant mechanic. The utilityman duties included assisting the plant operator and/or the mechanics/electricians and serving as fill-ins when plant operators and beltmen are absent from work. Table 11 illustrates that the workers of most concern are the plant operators and mechanics/electricians because their doses are routinely over the MSHA PEL of 100% (79% and 80%, respectively). These two occupations are the most likely to incur a violation of 30 CFR 62.130 for noise exposures exceeding the PEL (citable level of 132%) since they exceed that level by 50% and 60%, respectively.
25
Table 10.—Characteristics of coal preparation plants surveyed
Plant No. State Coal seam(s) Raw feed,
tph Reject, percent
No. of floors
Total floor area,
ft2 1 ....... Pennsylvania ........Pittsburgh ............................. 1,000 31 8 58,200 2 ....... West Virginia ........Powellton and No. 2 Gas...... 2,000 52 6 81,850 3 ....... Pennsylvania ........Pittsburgh ............................. 2,000 33 12 142,650 4 ....... Virginia..................Pocahontas .......................... 1,000 27 7 63,350 5 ....... Pennsylvania ........Pittsburgh ............................. 1,000 21 10 51,400 6 ....... Kentucky...............Kentucky No. 9 ..................... 300 38 5 15,505 7 ....... Kentucky...............Kentucky Nos. 9 and 11 ....... 2,000 51 5 75,084 8 ....... Illinois....................Nos. 5, 5A, and 6.................. 1,500 38 5 31,582
Table 11.—Worker noise exposures in coal preparation plants
Occupation Sample size
Range of MSHA PEL
dose, percent
Percent above MSHA PEL dose
of 100%
Percent above MSHA citable
dose of 132%
Mechanic/electrician.... 5 18–209 80 60 Plant operator.............. 24 38–221 79 50 Utilityman..................... 6 8–104 33 0 Control room operator . 9 0–100 0 0 Beltman ....................... 3 60– 72 0 0
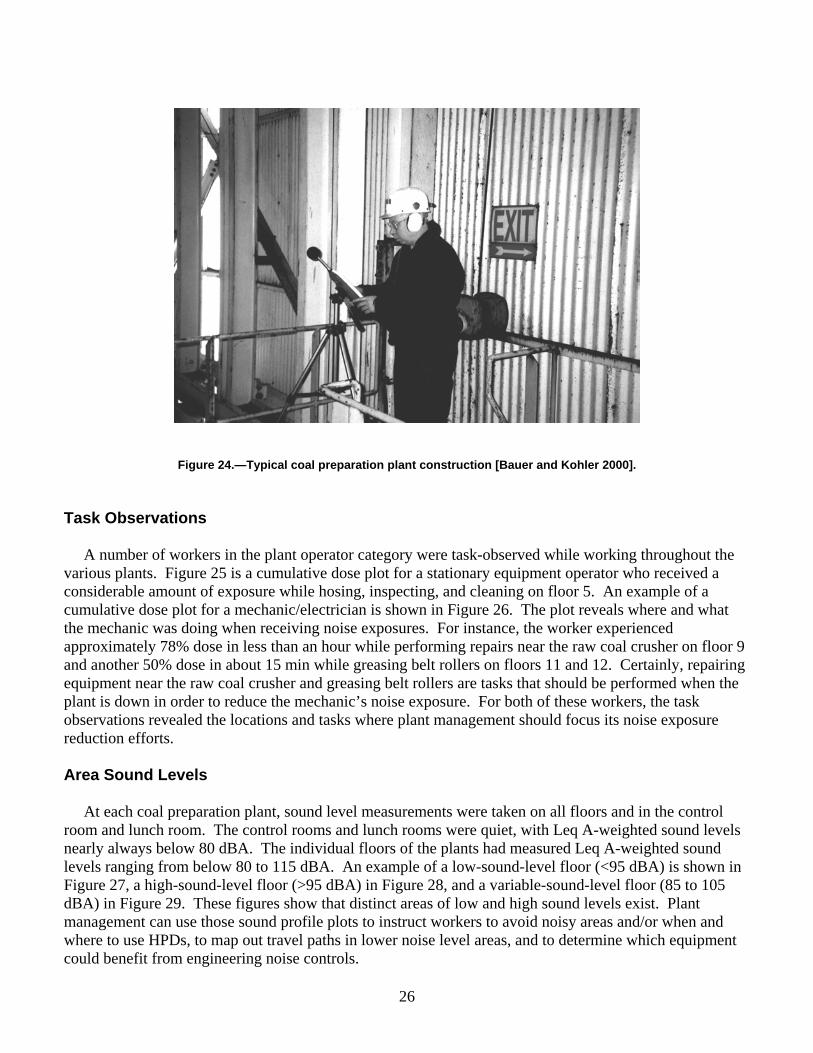
Figure 24.—Typical coal preparation plant construction [Bauer and Kohler 2000].
26
Task Observations
A number of workers in the plant operator category were task-observed while working throughout the various plants. Figure 25 is a cumulative dose plot for a stationary equipment operator who received a considerable amount of exposure while hosing, inspecting, and cleaning on floor 5. An example of a cumulative dose plot for a mechanic/electrician is shown in Figure 26. The plot reveals where and what the mechanic was doing when receiving noise exposures. For instance, the worker experienced approximately 78% dose in less than an hour while performing repairs near the raw coal crusher on floor 9 and another 50% dose in about 15 min while greasing belt rollers on floors 11 and 12. Certainly, repairing equipment near the raw coal crusher and greasing belt rollers are tasks that should be performed when the plant is down in order to reduce the mechanic’s noise exposure. For both of these workers, the task observations revealed the locations and tasks where plant management should focus its noise exposure reduction efforts.
Area Sound Levels
At each coal preparation plant, sound level measurements were taken on all floors and in the control room and lunch room. The control rooms and lunch rooms were quiet, with Leq A-weighted sound levels nearly always below 80 dBA. The individual floors of the plants had measured Leq A-weighted sound levels ranging from below 80 to 115 dBA. An example of a low-sound-level floor (<95 dBA) is shown in Figure 27, a high-sound-level floor (>95 dBA) in Figure 28, and a variable-sound-level floor (85 to 105 dBA) in Figure 29. These figures show that distinct areas of low and high sound levels exist. Plant management can use those sound profile plots to instruct workers to avoid noisy areas and/or when and where to use HPDs, to map out travel paths in lower noise level areas, and to determine which equipment could benefit from engineering noise controls.

110 Control room
100Hosing, Floor 5
90 Steps and checks, Floors 12-6
CU
MU
LATI
VE
DO
SE,
per
cent
80 Lunch room & outside
70
60 Hosing near screens, Floor 5 Floor 5 inspecting screens
50 Mostly Floors 1 & 2
40
30 Lunch room
20 Control room, lunch room and outside at static thickener
10 Equipment checks, all floors PEL-90dB
0 9:00 10:00 11:00 12:00 1:00 2:00 3:00
TIME OF SHIFT
Figure 25.—Cumulative dose plot for stationary equipment operator.
CU
MU
LATI
VE D
OS
E, p
erce
nt
200
180 1st Floor near lockers
160
Greasing belt rollers, Floors 11 & 12 140
Outside, Floor 1 120
6th Floor 100
Control room 80 9th Floor, raw coal crusher
60 Control room
40 Lunch room
20 Refuse pile welding bin
PEL-90dB 0
9:00 10:00 11:00 12:00 1:00 2:00 3:00 TIME OF SHIFT
Figure 26.—Cumulative dose plot for prep plant mechanic.
27
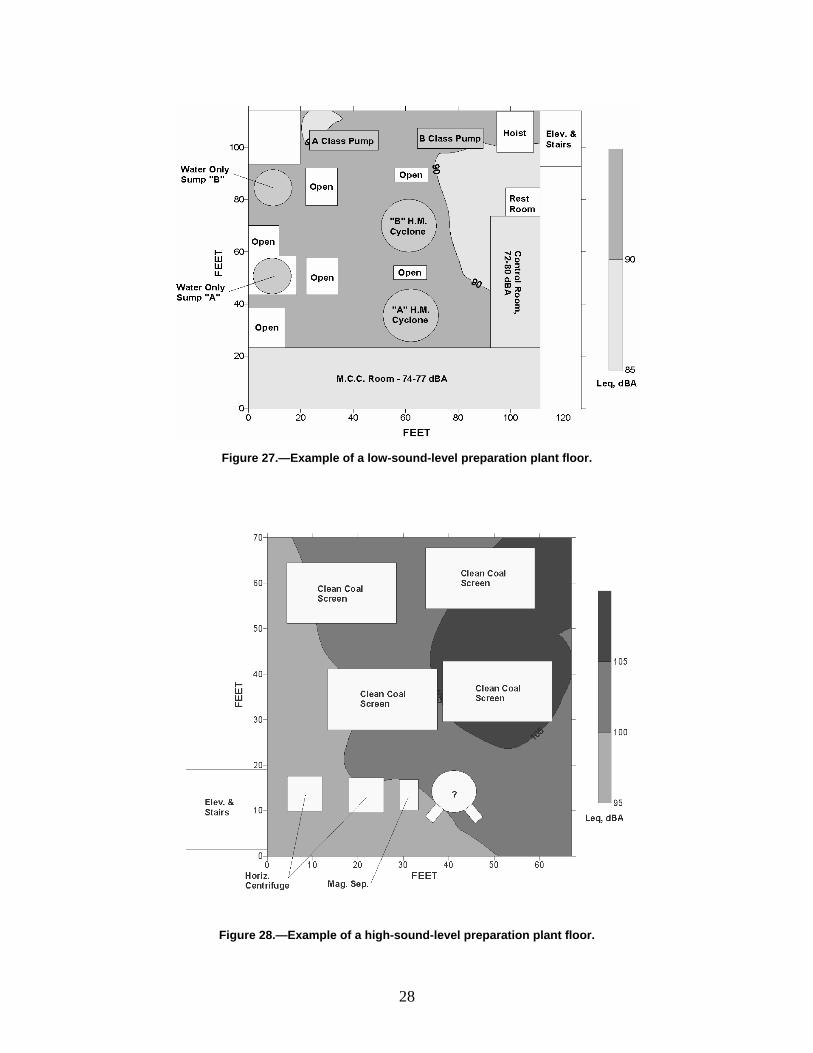
Figure 27.—Example of a low-sound-level preparation plant floor.
28
Figure 28.—Example of a high-sound-level preparation plant floor.
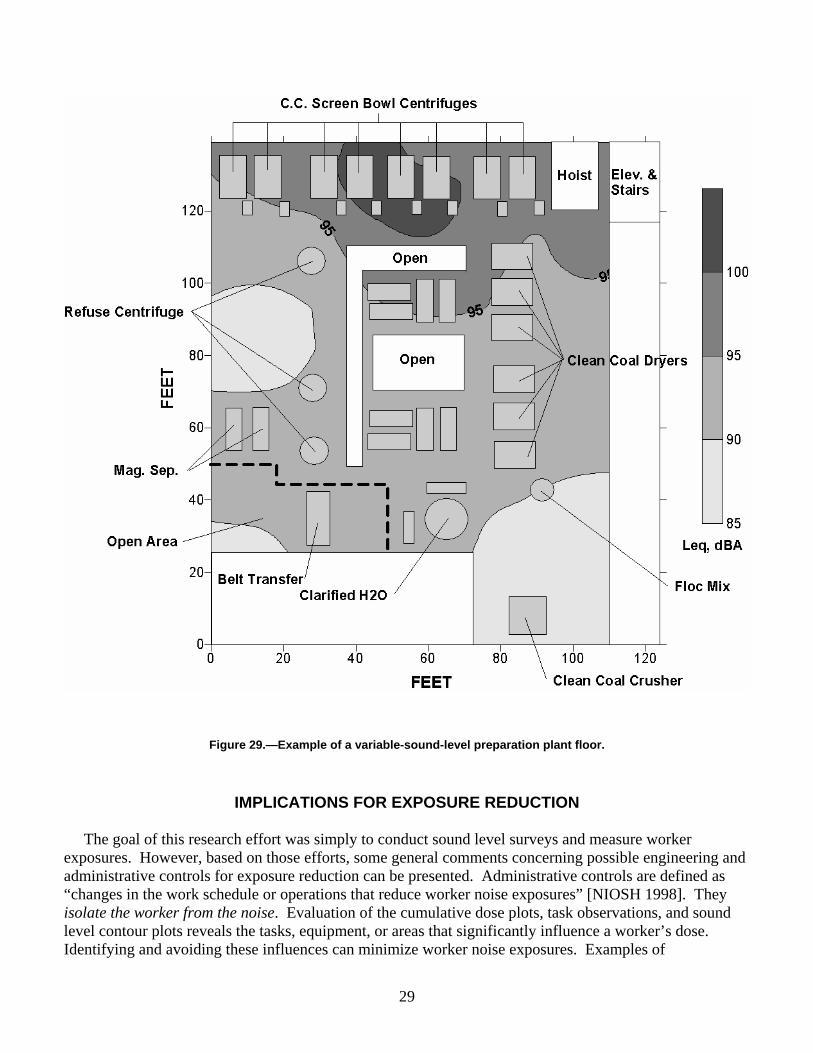
Figure 29.—Example of a variable-sound-level preparation plant floor.
29
IMPLICATIONS FOR EXPOSURE REDUCTION
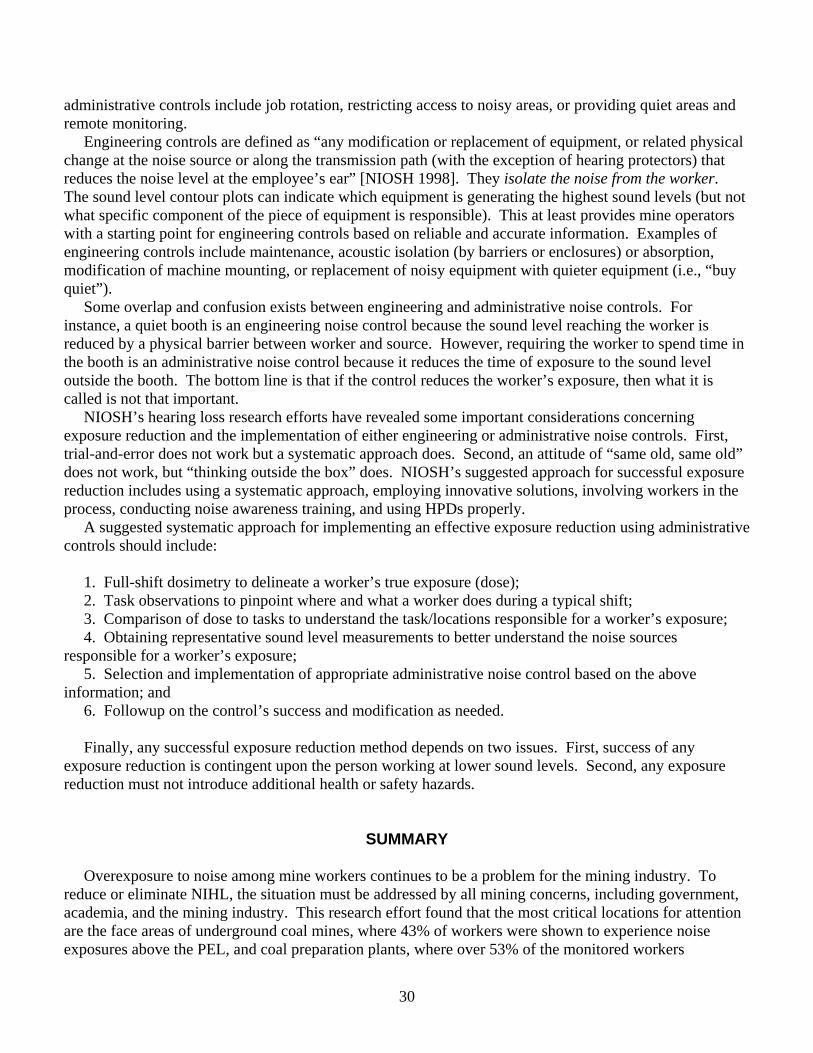
The goal of this research effort was simply to conduct sound level surveys and measure worker exposures. However, based on those efforts, some general comments concerning possible engineering and administrative controls for exposure reduction can be presented. Administrative controls are defined as “changes in the work schedule or operations that reduce worker noise exposures” [NIOSH 1998]. They isolate the worker from the noise. Evaluation of the cumulative dose plots, task observations, and sound level contour plots reveals the tasks, equipment, or areas that significantly influence a worker’s dose. Identifying and avoiding these influences can minimize worker noise exposures. Examples of
30
administrative controls include job rotation, restricting access to noisy areas, or providing quiet areas and remote monitoring.
Engineering controls are defined as “any modification or replacement of equipment, or related physical change at the noise source or along the transmission path (with the exception of hearing protectors) that reduces the noise level at the employee’s ear” [NIOSH 1998]. They isolate the noise from the worker. The sound level contour plots can indicate which equipment is generating the highest sound levels (but not what specific component of the piece of equipment is responsible). This at least provides mine operators with a starting point for engineering controls based on reliable and accurate information. Examples of engineering controls include maintenance, acoustic isolation (by barriers or enclosures) or absorption, modification of machine mounting, or replacement of noisy equipment with quieter equipment (i.e., “buy quiet”).
Some overlap and confusion exists between engineering and administrative noise controls. For instance, a quiet booth is an engineering noise control because the sound level reaching the worker is reduced by a physical barrier between worker and source. However, requiring the worker to spend time in the booth is an administrative noise control because it reduces the time of exposure to the sound level outside the booth. The bottom line is that if the control reduces the worker’s exposure, then what it is called is not that important.
NIOSH’s hearing loss research efforts have revealed some important considerations concerning exposure reduction and the implementation of either engineering or administrative noise controls. First, trial-and-error does not work but a systematic approach does. Second, an attitude of “same old, same old” does not work, but “thinking outside the box” does. NIOSH’s suggested approach for successful exposure reduction includes using a systematic approach, employing innovative solutions, involving workers in the process, conducting noise awareness training, and using HPDs properly.
A suggested systematic approach for implementing an effective exposure reduction using administrative controls should include:
1. Full-shift dosimetry to delineate a worker’s true exposure (dose); 2. Task observations to pinpoint where and what a worker does during a typical shift; 3. Comparison of dose to tasks to understand the task/locations responsible for a worker’s exposure; 4. Obtaining representative sound level measurements to better understand the noise sources
responsible for a worker’s exposure; 5. Selection and implementation of appropriate administrative noise control based on the above
information; and 6. Followup on the control’s success and modification as needed.
Finally, any successful exposure reduction method depends on two issues. First, success of any exposure reduction is contingent upon the person working at lower sound levels. Second, any exposure reduction must not introduce additional health or safety hazards.
SUMMARY
Overexposure to noise among mine workers continues to be a problem for the mining industry. To reduce or eliminate NIHL, the situation must be addressed by all mining concerns, including government, academia, and the mining industry. This research effort found that the most critical locations for attention are the face areas of underground coal mines, where 43% of workers were shown to experience noise exposures above the PEL, and coal preparation plants, where over 53% of the monitored workers
31
experienced noise doses above the MSHA PEL. At surface mines, equipment cabs were shown to isolate the operator from high noise exposures, while the dragline oiler working in the house of the dragline is most susceptible to overexposure (82% of the measured exposures were over the MSHA PEL).
The solutions to reducing mine worker noise exposure are many and difficult and will need to include a combination of engineering and administrative approaches. It is imperative that a systematic approach that employs innovative thinking be used to effectively implement noise controls. “Trial-and-error” and “same-old, same-old” approaches are destined for failure. The approaches should also include providing additional training and supervision to increase the worker’s awareness of high sound level areas and the benefits of moving out or away from those areas when possible. The cooperation of all parties (labor, management, regulatory, and research community) is necessary if NIHL among mine workers is to be reduced and/or eliminated.
ACKNOWLEDGMENTS
The authors recognize the assistance of Michael D. DiMartino, Thomas J. Ozanich, Gerald S. Morrow, Alexander D. Prokop, James P. Rider, and Ellsworth R. Spencer of the NIOSH Pittsburgh Research Laboratory, who participated in the data collection phase of this research.
REFERENCES
46 Fed. Reg. 42622 [1983]. Occupational Safety and Health Administration: occupational noise exposure; hearing conservation amendment; final rule. (Codified at 29 CFR 1910.95.)
61 Fed. Reg. 66347 [1996]. Mine Safety and Health Administration: health standards for occupational noise exposure in coal, metal, and nonmetal mines; proposed rule.
64 Fed. Reg. 49548 [1999]. Mine Safety and Health Administration: health standards for occupational noise exposure; final rule. (Codified at 30 CFR 56, 57, 62, 70, and 71.)
Bauer ER, Babich DR [2003]. Worker exposure and equipment noise in large surface coal mines. SME preprint 03–051. Littleton, CO: Society for Mining, Metallurgy, and Exploration, Inc., pp. 1–6.
Bauer ER, Babich DR [2004a]. Administrative controls for reducing worker noise exposures. SME preprint 04–09. Littleton, CO: Society for Mining, Metallurgy, and Exploration, Inc., pp. 1–9.
Bauer ER, Babich DR [2004b]. Worker exposure and equipment noise in large surface coal mines. Min Eng 56(4):49–54.
Bauer ER, Kohler JL [2000]. Cross-sectional survey of noise exposure in the mining industry. In: Bockosh GR, Karmis M, Langton J, McCarter MK, Rowe B, eds. Proceedings of the 31st Annual Institute of Mining Health, Safety and Research. Blacksburg, VA: Virginia Polytechnic Institute and State University, Department of Mining and Minerals Engineering, pp. 17–31.
Bauer ER, Podobinski DJ, Reeves ER [2001]. Noise exposure in longwall mining and engineering controls research. In: Proceedings of Longwall USA International Exhibition & Conference (Pittsburgh, PA, June 13–15, 2001). Overland Park, KS: Intertec Publishing Corp., pp. 51–69.
CFR. Code of federal regulations. Washington, DC: U.S. Government Printing Office, Office of the Federal Register.
Franks JR [1996]. Analysis of audiograms for a large cohort of noise-exposed miners. Cincinnati, OH, U.S. Department of Health and Human Services, Public Health Service, Centers for Disease Control and Prevention, National Institute for Occupational Safety and Health, Division of Biomedical and Behavioral Science. Unpublished.

Franks JR [1997]. Prevalence of hearing loss for noise-exposed metal/nonmetal miners. Cincinnati, OH, U.S. Department of Health and Human Services, Public Health Service, Centers for Disease Control and Prevention, National Institute for Occupational Safety and Health, Division of Biomedical and Behavioral Science. Unpublished. Franks JR, Stephenson MR, Merry CJ, eds. [1996]. Preventing occupational hearing loss: a practical guide. Cincinnati, OH: U.S. Department of Health and Human Services, Public Health Service, Centers for Disease Control and Prevention, National Institute for Occupational Safety and Health, DHHS (NIOSH) Publication No. 96–110. MSHA [2000]. Quarterly employment and coal production: accidents/injuries/illnesses reported to MSHA under 30 CFR 50. Denver, CO: U.S. Department of Labor, Mine Safety and Health Administration, Office of Injury and Employment Information. MSHA [2001]. Quarterly employment and coal production: accidents/injuries/illnesses reported to MSHA under 30 CFR 50. Denver, CO: U.S. Department of Labor, Mine Safety and Health Administration, Office of Injury and Employment Information. MSHA [2002]. Quarterly employment and coal production: accidents/injuries/illnesses reported to MSHA under 30 CFR 50. Denver, CO: U.S. Department of Labor, Mine Safety and Health Administration, Office of Injury and Employment Information.
MSHA [2004]. Quarterly employment and coal production: accidents/injuries/illnesses reported to MSHA under 30 CFR 50. Denver, CO: U.S. Department of Labor, Mine Safety and Health Administration, Office of Injury and Employment Information.
NIOSH [1976]. Survey of hearing loss in the coal mining industry. Cincinnati, OH: U.S. Department of Health, Education, and Welfare, Public Health Service, Center for Disease Control, National Institute for Occupational Safety and Health, DHEW (NIOSH) Publication No. 76–172. NIOSH [1998]. Criteria for a recommended standard: occupational noise exposure, revised criteria 1998. Cincinnati, OH: U.S. Department of Health and Human Services, Public Health Service, Centers for Disease Control and Prevention, National Institute for Occupational Safety and Health, DHHS (NIOSH) Publication No. 98–126. Seiler JP, Giardino DA [1994]. The effect of threshold on noise dosimeter measurements and interpretation of their results. Pittsburgh, PA: U.S. Department of Labor, Mine Safety and Health Administration, Pittsburgh Safety and Health Technology Center, Physical and Toxic Agents Division, Informational Report (IR) 1224. Seiler JP, Valoski MP, Crivaro MA [1994]. Noise exposure in U.S. coal mines. Pittsburgh, PA: U.S. Department of Labor, Mine Safety and Health Administration, Pittsburgh Safety and Health Technology Center, Physical and Toxic Agents Division, Informational Report (IR) 1214. Weeks JL [1995]. Policies and practices for preventing occupational hearing loss among miners are inadequate. In: Franks JR, Casali JG, eds. Proceedings of the Hearing Conservation Conference III/XX (Cincinnati, OH, March 22–25, 1995). Denver, CO: National Hearing Conservation Association, pp. 16–19.
32

APPENDIX A.—CUMULATIVE DOSE PLOTS: UNDERGROUND COAL
Appendix A includes a number of cumulative dose plots with annotated task observations for face workers in underground coal mines. As stated earlier in this report, these plots can be used to identify the tasks most responsible for a worker’s noise exposure and where noise controls should be implemented. A brief explanation of each plot follows. Figures A–1, A–2, and A–3 are for workers from the same miner/bolter machine and illustrate the difference in dose for the three workers, even though the general trend of exposure was similar. The right-side bolter operator, bolting on the auxiliary fan side, experienced a dose of 260% (Figure A–2), the left-side bolter operator (Figure A–3) 145%, and the miner/bolter operator (Figure A–1) 128%. Figures A–4, A–5, and A–6, although from different continuous mining machine sections, illustrate the exposure sources (tasks) for a CM operator, shuttle car operator, and CM helper, respectively. Figure A–7 is the cumulative dose plot for a center bolter operator on a miner/bolter section. The bulk of exposure resulted from installing center bolts and waiting near the auxiliary fan. Figures A–8 and A–9 are for the head and tail shearer operators, respectively. They illustrate that the rate of exposure accumulation was similar for both directions of cutting and that the tail shearer operator had the higher dose, as expected. Finally, Figure A–10 is the exposure for a stageloader operator and shows a uniform dose accumulation while positioned along the stageloader.
33
8:00 9:00 10:00 11:00 12:00 1:00 2:00 3:00 4:00 5:000
20
40
60
80
100
120
TIME OF SHIFT
CU
MU
LATI
VE D
OS
E, p
erce
nt
PEL-90dB
Lunch
Equipment idle
Mantrip in
No power
Cutting/bolting/hang tubing
Aux. fan off
8:00 9:00 10:00 11:00 12:00 1:00 2:00 3:00 4:00 5:000
20
40
60
80
100
120
140
TIME OF SHIFT
CU
MU
LATI
VE D
OS
E, p
erce
nt
PEL-90dB
Lunch
Equipment idle
Mantrip in
No power
Cutting/bolting/hang tubing
Aux. fan off
8:00 9:00 10:00 11:00 12:00 1:00 2:00 3:00 4:00 5:000
20
40
60
80
100
120
140
TIME OF SHIFT
CU
MU
LATI
VE D
OS
E, p
erce
nt
PEL-90dB
Lunch
Equipment idle
Mantrip in
No power
Cutting/bolting/hang tubing
Aux. fan off
Trimming corner, empty conveyor160
Figure A–1.—Cumulative dose plot for a miner/bolter operator.
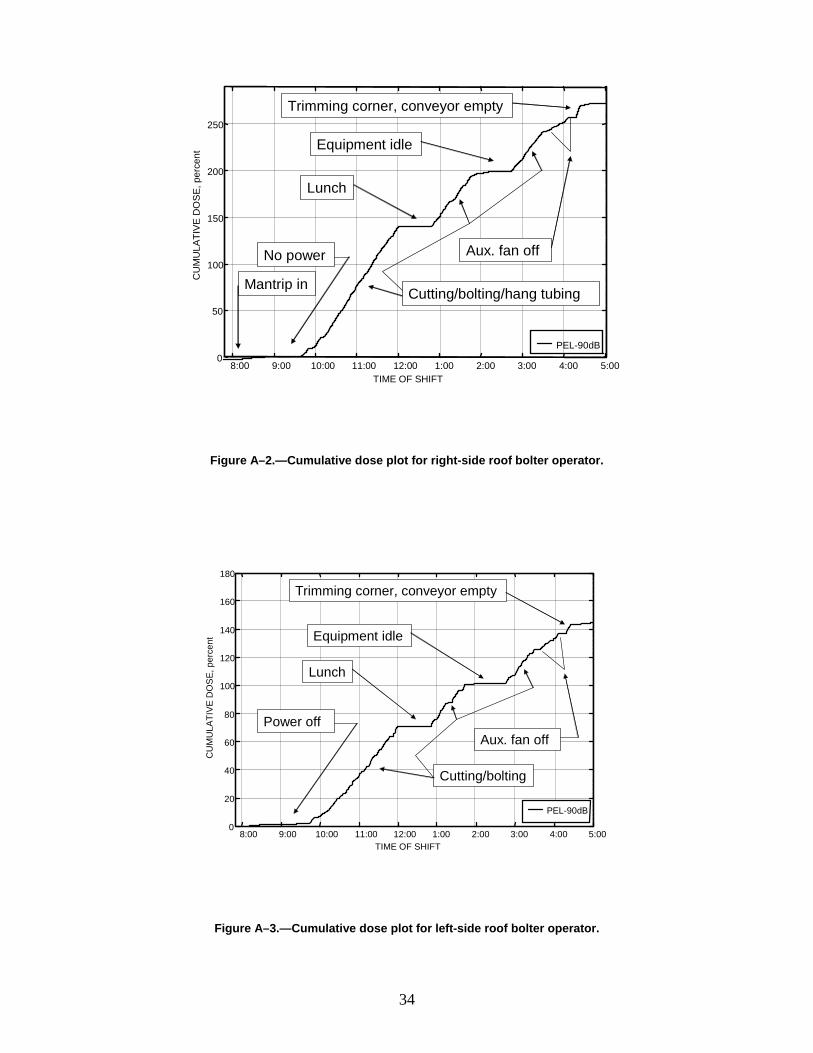
CU
MU
LATI
VE D
OS
E, p
erce
nt
Trimming corner, conveyor empty 250
Equipment idle
200
Lunch
150
100 No power Aux. fan off
Mantrip in Cutting/bolting/hang tubing
50
PEL-90dB 0
8:00 9:00 10:00 11:00 12:00 1:00 2:00 3:00 4:00 5:00 TIME OF SHIFT
Figure A–2.—Cumulative dose plot for right-side roof bolter operator.
180
Trimming corner, conveyor empty 160
140 Equipment idle
CU
MU
LATI
VE D
OS
E, p
erce
nt
120
Lunch 100
80 Power off60 Aux. fan off
40 Cutting/bolting 20
PEL-90dB
0 8:00 9:00 10:00 11:00 12:00 1:00 2:00 3:00 4:00 5:00
TIME OF SHIFT
Figure A–3.—Cumulative dose plot for left-side roof bolter operator.
34
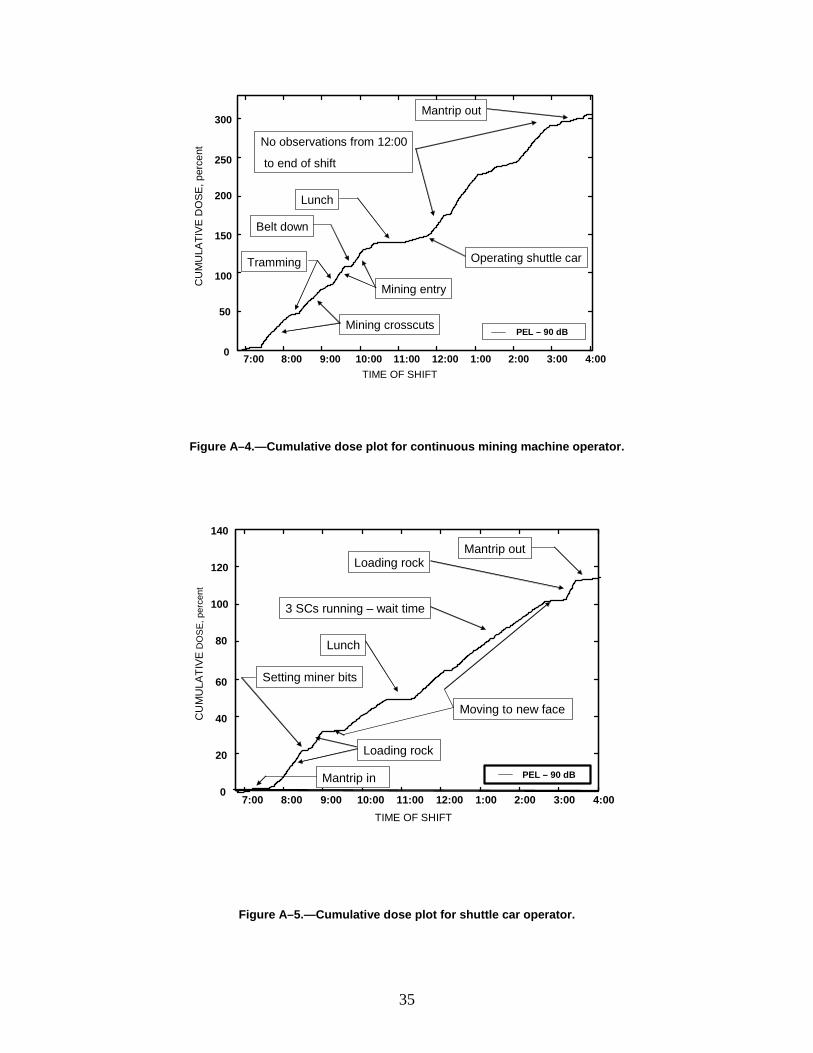
CU
MU
LATI
VE
DO
SE
, per
cent
Mantrip out 300
No observations from 12:00 250 to end of shift
200 Lunch
150 Belt down
Tramming Operating shuttle car 100
Mining entry
50 Mining crosscuts PEL – 90 dB
0 7:00 8:00 9:00 10:00 11:00 12:00 1:00 2:00 3:00 4:00 TIME OF SHIFT
Figure A–4.—Cumulative dose plot for continuous mining machine operator.
140
Mantrip out Loading rock 120
CU
MU
LATI
VE
DO
SE,
per
cent
100 3 SCs running – wait time
80 Lunch
60 Setting miner bits
40 Moving to new face
20
0 7:00 8:00
Loading rock
Mantrip in
9:00 10:00 11:00 12:00 TIME OF SHIFT
1:00
PEL – 90 dB
2:00 3:00 4:00
Figure A–5.—Cumulative dose plot for shuttle car operator.
35
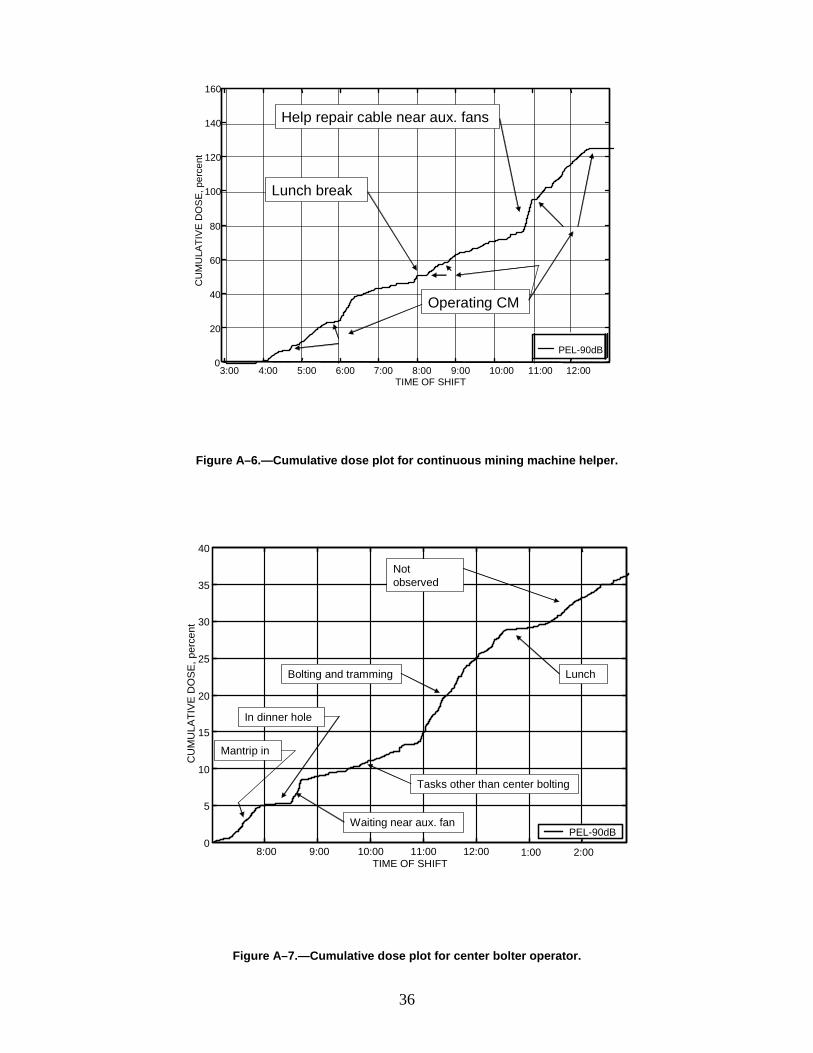
160
140
100
120
CU
MU
LATI
VE D
OS
E, p
erce
nt
PEL-90dB
Help repair cable near aux. fans
Lunch break
Operating CM
3:00 4:00 5:00 6:00 7:00 8:00 9:00 10:00 11:00 12:00
80
60
40
20
0
TIME OF SHIFT
Figure A–6.—Cumulative dose plot for continuous mining machine helper.
40
8:00 9:00 10:00 11:00 12:00 1:00 2:00
PEL-90dBWaiting near aux. fan
Tasks other than center bolting
Bolting and tramming Lunch
Mantrip in
In dinner hole
Not observed 35
30
25
20
15
10
5
0
TIME OF SHIFT
Figure A–7.—Cumulative dose plot for center bolter operator.
CU
MU
LATI
VE
DO
SE
, per
cent
36
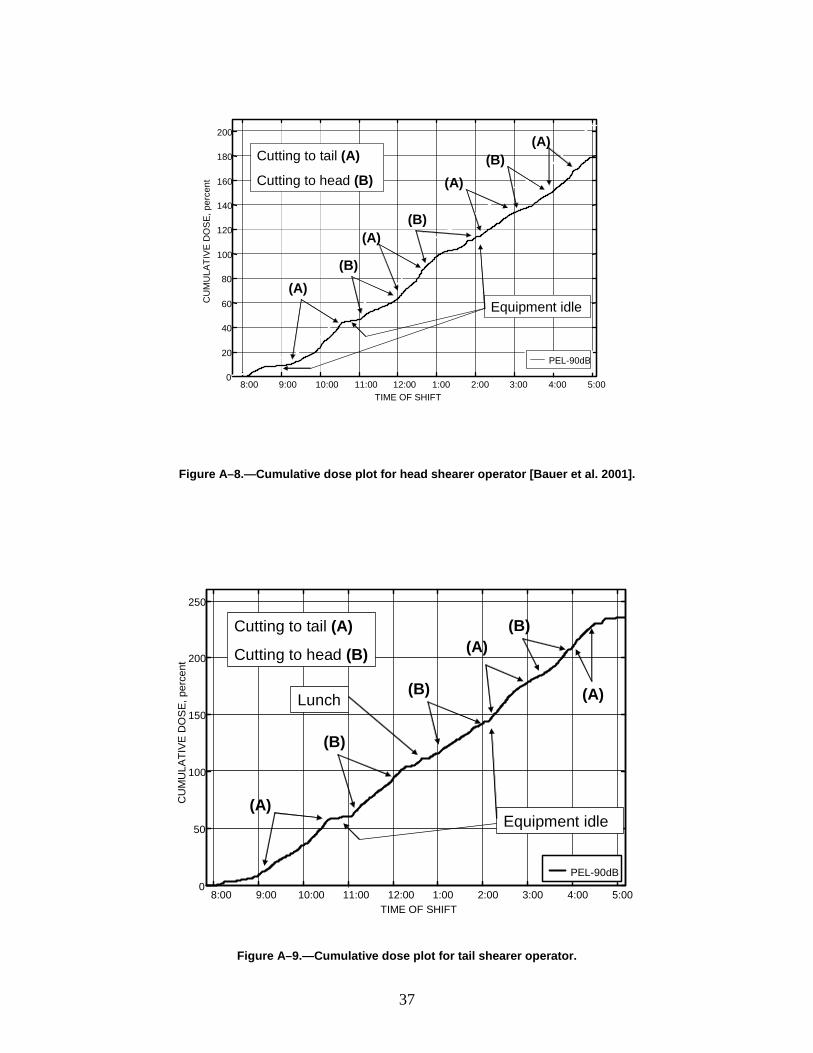
0
20
40
60
80
100
120
140
160
180
200
CU
MU
LATI
VE D
OS
E, p
erce
nt
PEL-90dB
Equipment idle
Cutting to tail (A)
Cutting to head (B)
(A) (B)
(A) (B)
(A) (B)
(A)
8:00 9:00 10:00 11:00 12:00 1:00 2:00 3:00 4:00 5:00 TIME OF SHIFT
Figure A–8.—Cumulative dose plot for head shearer operator [Bauer et al. 2001].
8:00 9:00 10:00 11:00 12:00 1:00 2:00 3:00 4:00 5:000
50
100
150
200
250
CU
MU
LATI
VE D
OS
E, p
erce
nt
PEL-90dB
Equipment idle
Cutting to tail (A)
Cutting to head (B)
(A)
(B)
(B)
(A) (B)
(A) Lunch
TIME OF SHIFT
Figure A–9.—Cumulative dose plot for tail shearer operator.
37

CU
MU
LATI
VE
DO
SE
, per
cent
200
150
100
50
0
TIME OF SHIFT
PEL-90dB
Mantrip in
Along belt
At controls
Along stageloader, various locations
Stageloader off
7:00 8:00 9:00 10:00 11:00 12:00 1:00 2:00 3:00 4:00
Figure A–10.—Cumulative dose plot for stageloader (headgate) operator.
38

APPENDIX B.—EQUIPMENT NOISE PROFILES: UNDERGROUND COAL
This appendix contains sound profile plots for underground coal mining equipment. Figures B–1 and B–2 are for a Joy miner/bolter, while Figures B–3 and B–4 are for an Alpine miner/bolter. For the Joy miner/bolter, the sound levels were slightly higher during mining, while for the Alpine miner/bolter the levels were higher during bolting.
Figure B–5 illustrates that the sound levels around a loading machine range from 90 to 100 dBA. These were recorded when the loading machine was near the miner/bolter and are higher than when the loading machine is back away from the miner/bolter.
Figure B–6 is the sound profile plot for a single-boom center bolter. The exposure of the operator is governed by the high noise levels located near the operator’s position.
Figures B–7 and B–8 show sound levels during coal conveyance for McLanahan and Stamler feeder-breakers, respectively. These plots reveal that the sound levels were slightly higher for the McLanahan feeder-breaker.
Figure B–9 illustrates that the sound levels for two auxiliary fans approach 120 dBA, which is greater than the maximum MSHA allowable sound level of 115 dBA.
The sound levels for a longwall shearer while cutting from tail to head are illustrated in Figure B–10. The sound levels are similar to those recorded when cutting the opposite direction (see Figure 9).
Figures B–11 and B–12 are from a longwall section and show the sound levels for the stageloader and longwall hydraulics, respectively. Sound levels along the stageloader were approximately 85–95 dBA, with the highest sound level near the discharge. For the longwall hydraulics, the highest levels were recorded adjacent to the hydraulic pump cars. Although levels approached 105 dBA, worker exposure is usually limited to just a few minutes each shift as the workers walk to and from the mantrip and longwall face.
39
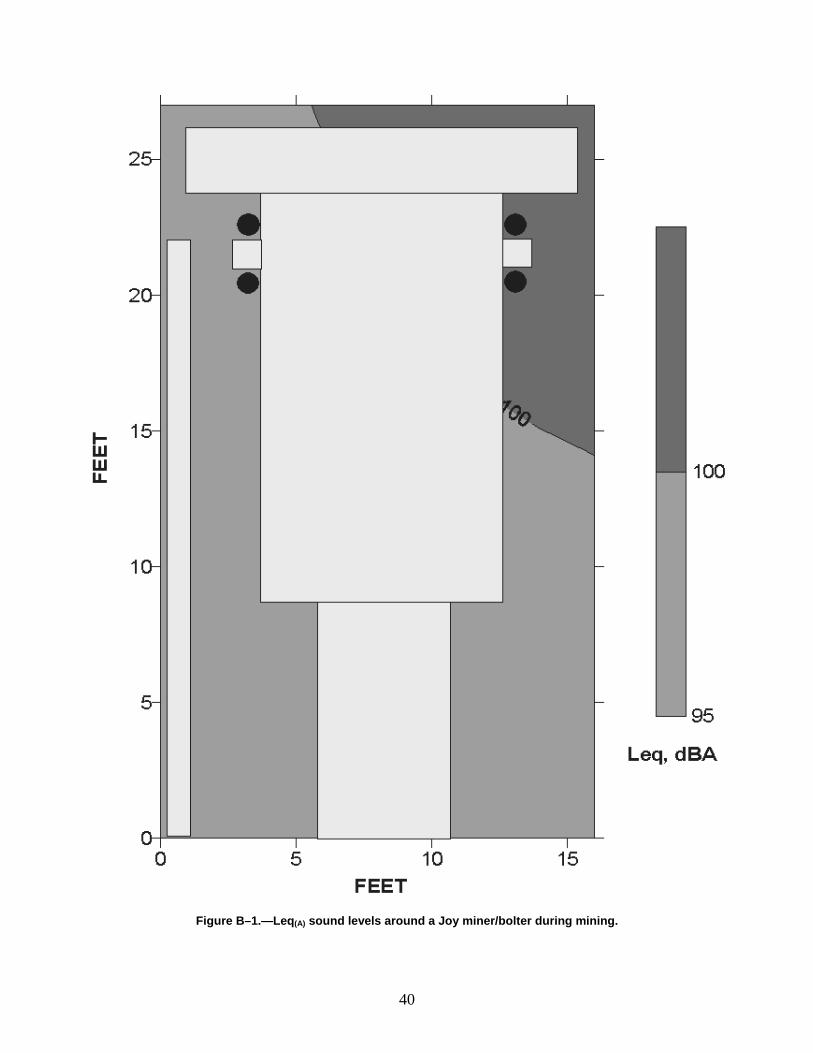
Figure B–1.—Leq(A) sound levels around a Joy miner/bolter during mining.
40

Figure B–2.—Leq(A) sound levels around a Joy miner/bolter during bolting cycle.
41

Figure B–3.—Leq(A) sound levels around an Alpine miner/bolter during mining only.
Figure B–4.—Leq(A) sound levels around an Alpine miner/bolter during mining and bolting.
42

Figure B–5.—Leq(A) sound levels around a Joy Model 14BU10 loading machine.
43
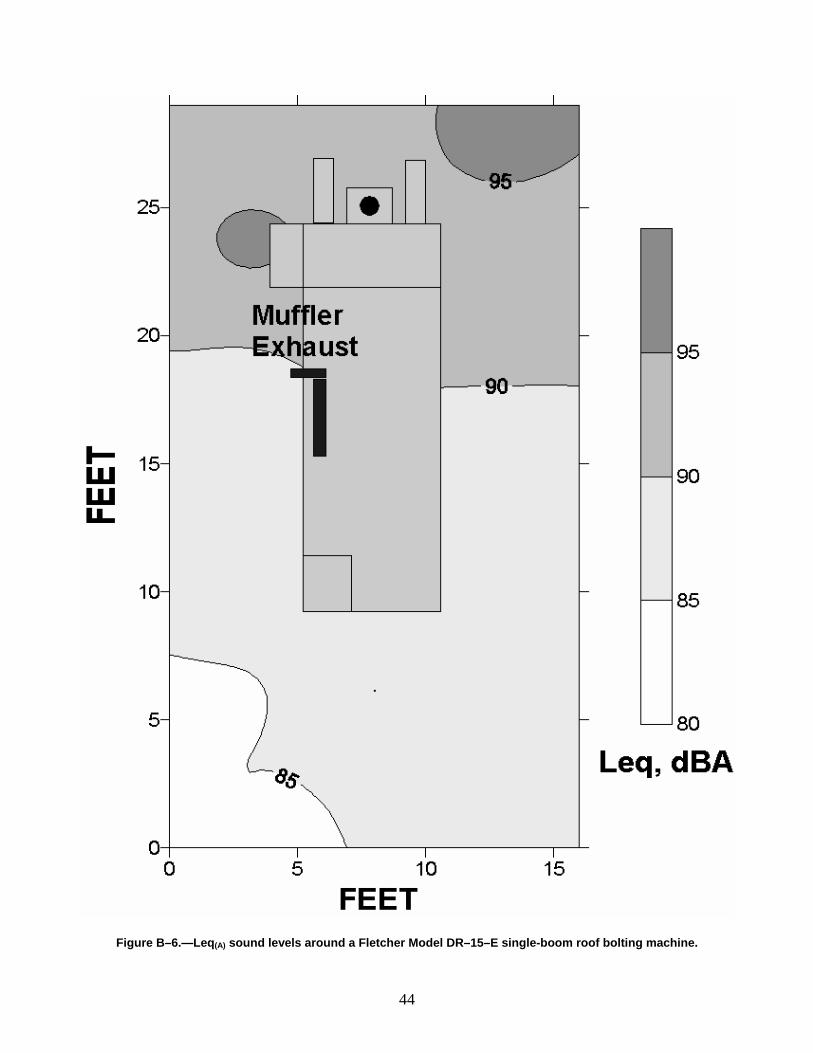
Figure B–6.—Leq(A) sound levels around a Fletcher Model DR–15–E single-boom roof bolting machine.
44

Figure B–7.—Leq(A) sound levels around a McLanahan HV–50 feeder-breaker.
Figure B–8.—Leq(A) sound levels around a Stamler Model BF–14A–1Z–530 feeder-breaker.
45
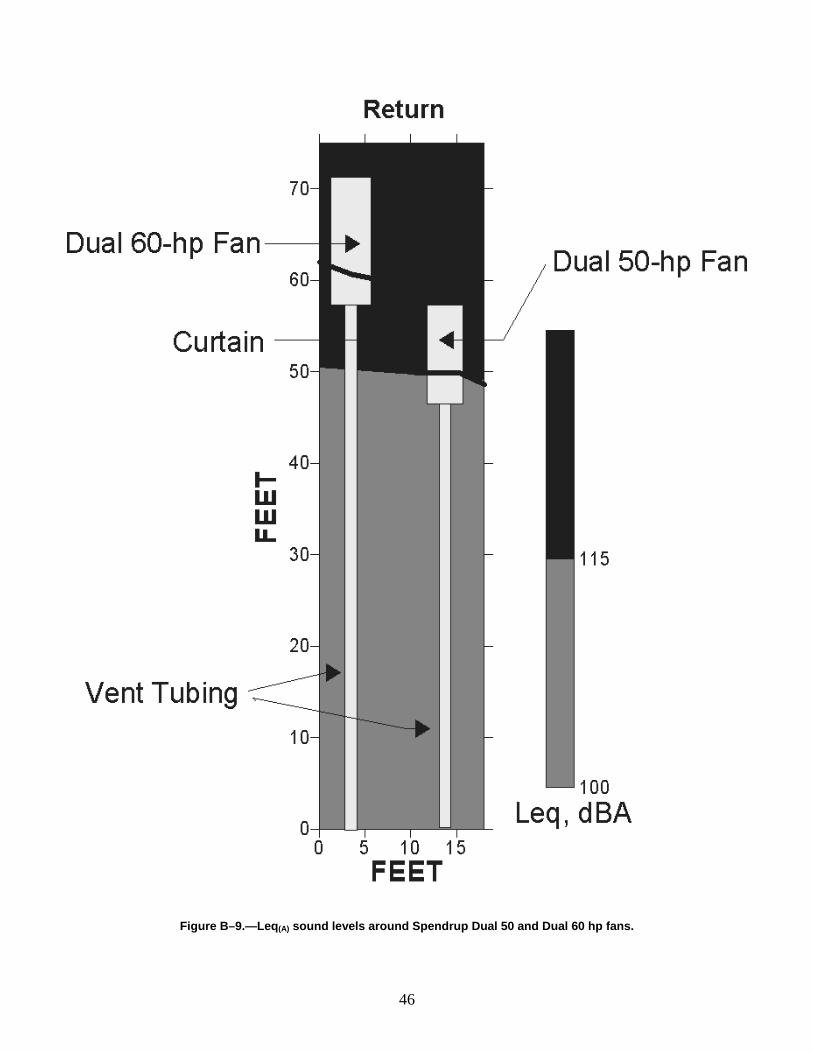
Figure B–9.—Leq(A) sound levels around Spendrup Dual 50 and Dual 60 hp fans.
46

Figure B–10.—Leq(A) sound levels near shearer while cutting from tail to head.
Figure B–11.—Leq(A) sound levels around a longwall stageloader.
47
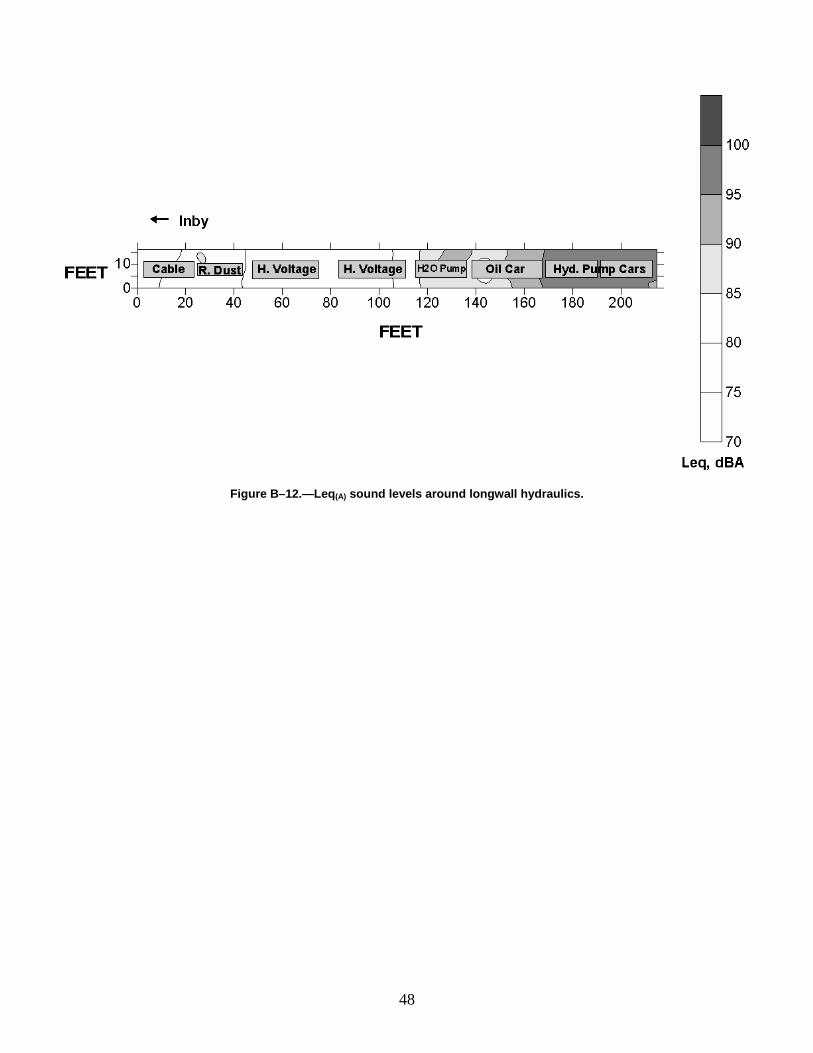
Figure B–12.—Leq(A) sound levels around longwall hydraulics.
48
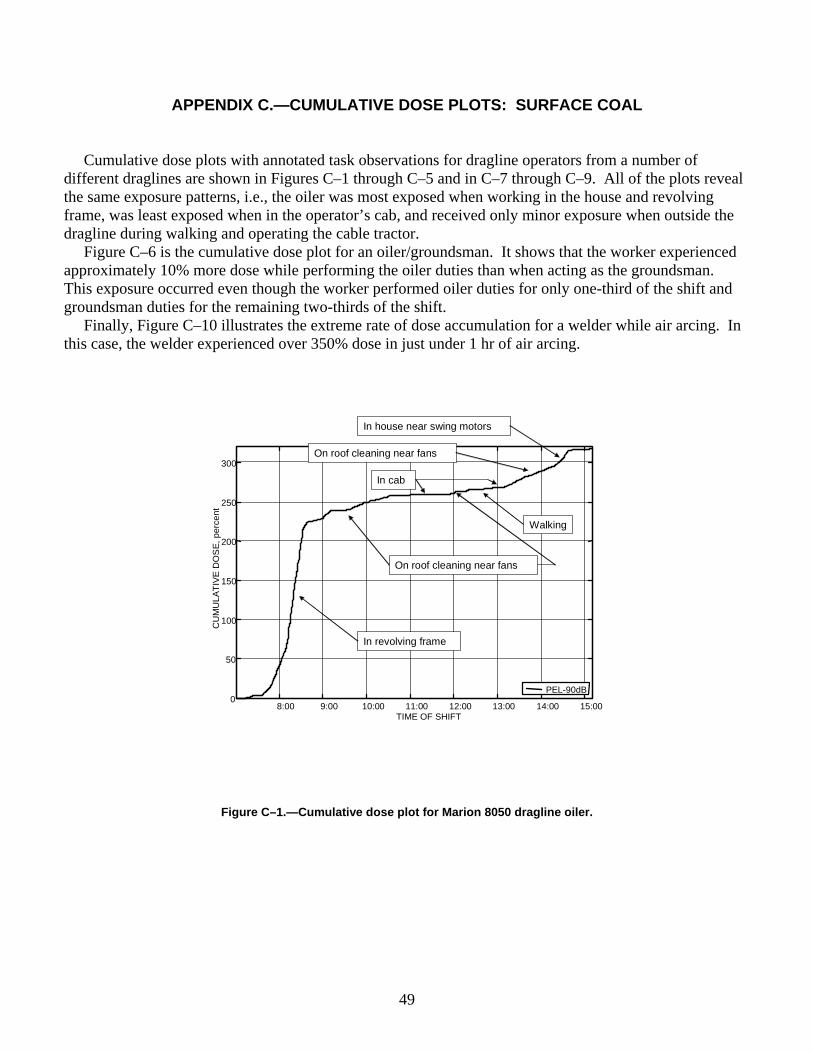
APPENDIX C.—CUMULATIVE DOSE PLOTS: SURFACE COAL
Cumulative dose plots with annotated task observations for dragline operators from a number of different draglines are shown in Figures C–1 through C–5 and in C–7 through C–9. All of the plots reveal the same exposure patterns, i.e., the oiler was most exposed when working in the house and revolving frame, was least exposed when in the operator’s cab, and received only minor exposure when outside the dragline during walking and operating the cable tractor.
Figure C–6 is the cumulative dose plot for an oiler/groundsman. It shows that the worker experienced approximately 10% more dose while performing the oiler duties than when acting as the groundsman. This exposure occurred even though the worker performed oiler duties for only one-third of the shift and groundsman duties for the remaining two-thirds of the shift.
Finally, Figure C–10 illustrates the extreme rate of dose accumulation for a welder while air arcing. In this case, the welder experienced over 350% dose in just under 1 hr of air arcing.
49
300
250
CU
MU
LATI
VE D
OS
E, p
erce
nt
100
150
200
PEL-90dB
In revolving frame
On roof cleaning near fans
In cab
Walking
On roof cleaning near fans
In house near swing motors
8:00 9:00 10:00 11:00 12:00 13:00 14:00 15:00
50
0
TIME OF SHIFT
Figure C–1.—Cumulative dose plot for Marion 8050 dragline oiler.
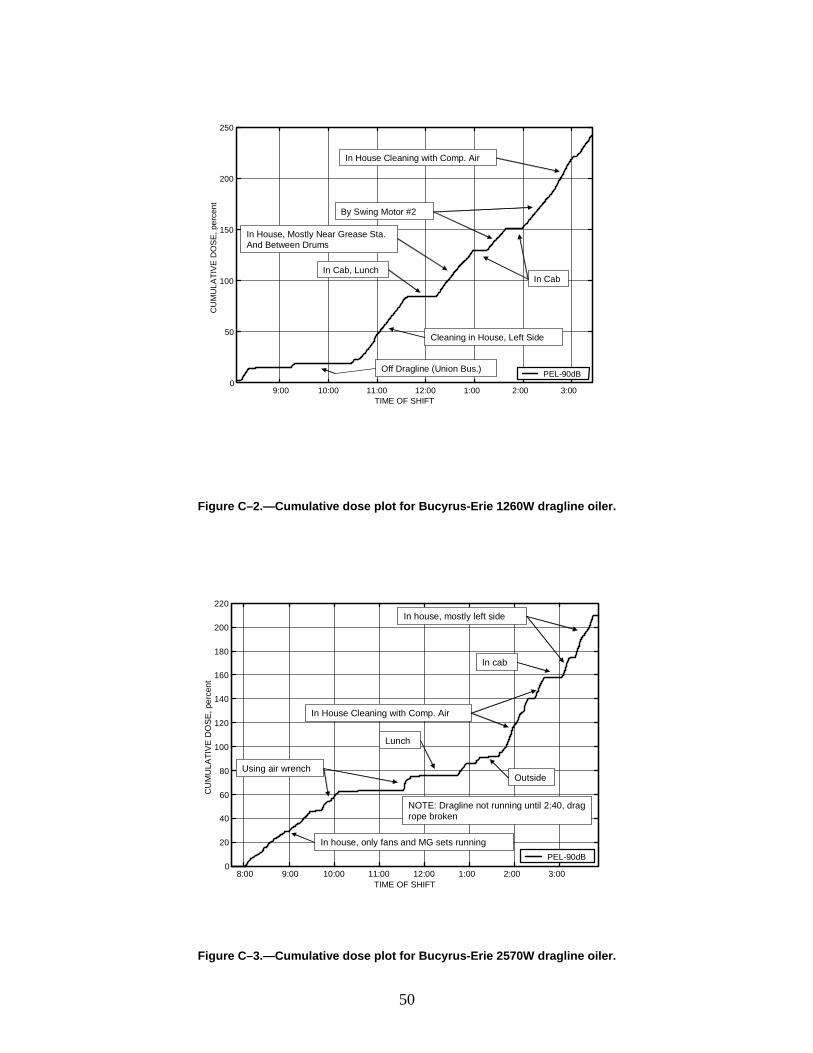
0
50
100
150
200
250
CU
MU
LATI
VE
DO
SE
, per
cent
PEL-90dB Off Dragline (Union Bus.)
Cleaning in House, Left Side
In Cab, Lunch
In House, Mostly Near Grease Sta. And Between Drums
In Cab
By Swing Motor #2
In House Cleaning with Comp. Air
9:00 10:00 11:00 12:00 1:00 2:00 3:00 TIME OF SHIFT
Figure C–2.—Cumulative dose plot for Bucyrus-Erie 1260W dragline oiler.
220
CU
MU
LATI
VE
DO
SE
, per
cent
200
180
160
140
120
100
80
60
40
20
0 8:00 9:00 10:00 11:00 12:00 1:00 2:00 3:00
PEL-90dB
In House Cleaning with Comp. Air
NOTE: Dragline not running until 2:40, drag rope broken
In cab
In house, mostly left side
In house, only fans and MG sets running
Using air wrench Outside
Lunch
TIME OF SHIFT
Figure C–3.—Cumulative dose plot for Bucyrus-Erie 2570W dragline oiler.
50
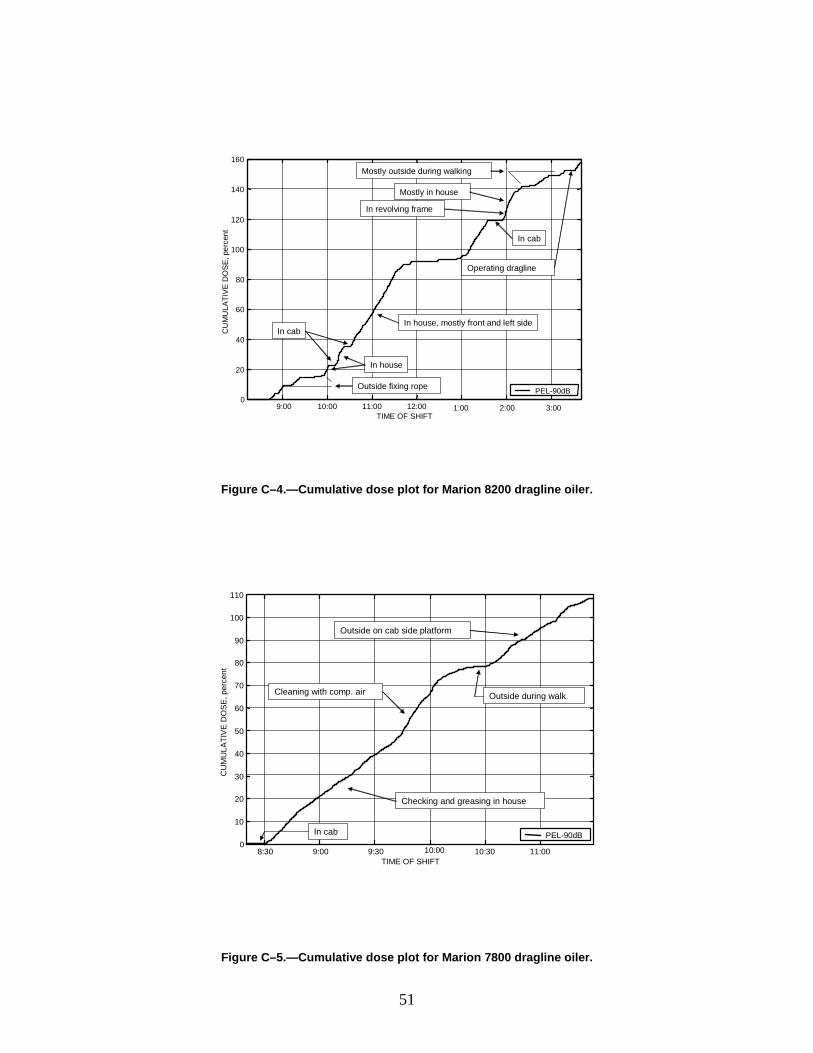
0
20
40
60
80
100
120
140
160
CU
MU
LATI
VE
DO
SE
, per
cent
PEL-90dB Outside fixing rope
In cab
In house
In house, mostly front and left side
In revolving frame
In cab
Mostly in house
Mostly outside during walking
Operating dragline
9:00 10:00 11:00 12:00 1:00 2:00 3:00 TIME OF SHIFT
Figure C–4.—Cumulative dose plot for Marion 8200 dragline oiler.
110
100
CU
MU
LATI
VE
DO
SE
, per
cent
90
80
70
60
50
40
30
20
10
0 PEL-90dB In cab
Outside during walk Cleaning with comp. air
Checking and greasing in house
Outside on cab side platform
8:30 9:00 9:30 10:00 10:30 11:00 TIME OF SHIFT
Figure C–5.—Cumulative dose plot for Marion 7800 dragline oiler.
51
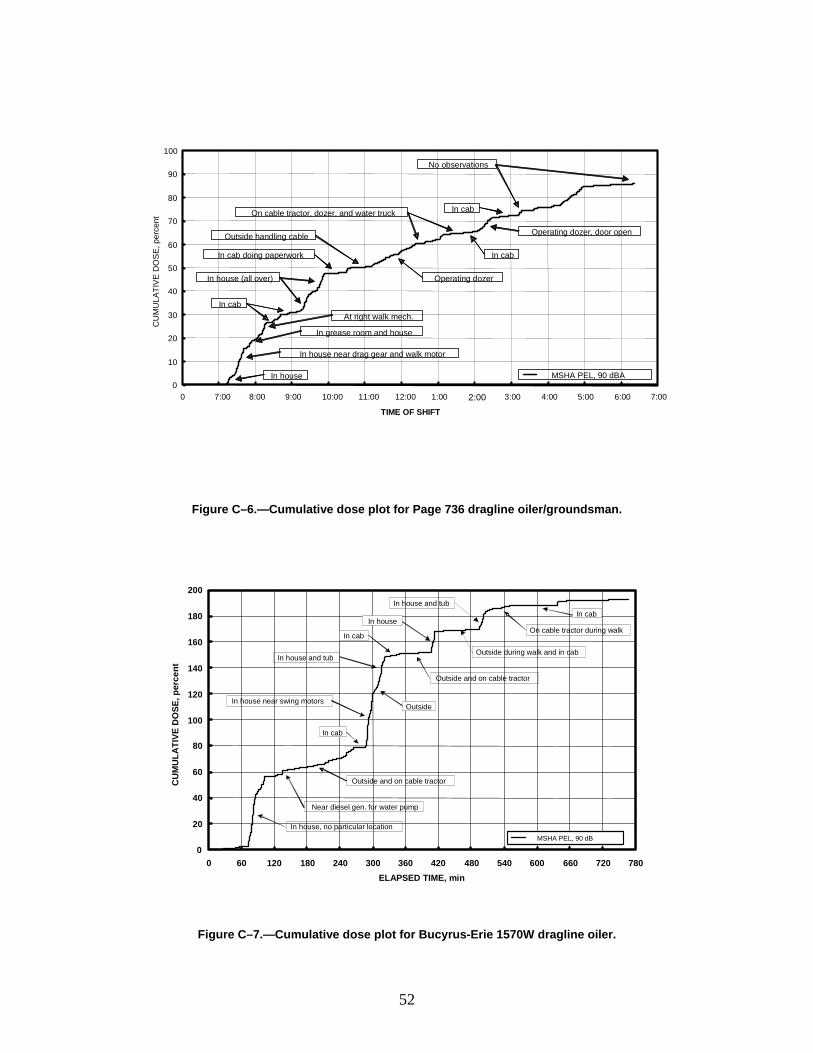
0
10
20
30
40
50
60
70
80
90
100 C
UM
ULA
TIV
E D
OS
E, p
erce
nt
MSHA PEL, 90 dBA In house
In house near drag gear and walk motor
In grease room and house
At right walk mech. In cab
In house (all over)
In cab doing paperwork
Outside handling cable
Operating dozer
On cable tractor, dozer, and water truck
Operating dozer, door open
In cab
No observations
In cab
0 7:00 8:00 9:00 10:00 11:00 12:00 1:00 2:00 3:00 4:00 5:00 6:00 7:00
TIME OF SHIFT
Figure C–6.—Cumulative dose plot for Page 736 dragline oiler/groundsman.
200
180
160
140
120
100
80
60
40
20
0 0 60 120 180 240 300 360 420 480 540 600 660 720 780
ELAPSED TIME, min
MSHA PEL, 90 dB In house, no particular location
Near diesel gen. for water pump
Outside and on cable tractor
In cab
In house near swing motors Outside
In house and tub
In cab
Outside and on cable tractor
In house
Outside during walk and in cab
In house and tub
On cable tractor during walk
In cab
Figure C–7.—Cumulative dose plot for Bucyrus-Erie 1570W dragline oiler.
CU
MU
LATI
VE D
OSE
, per
cent
52
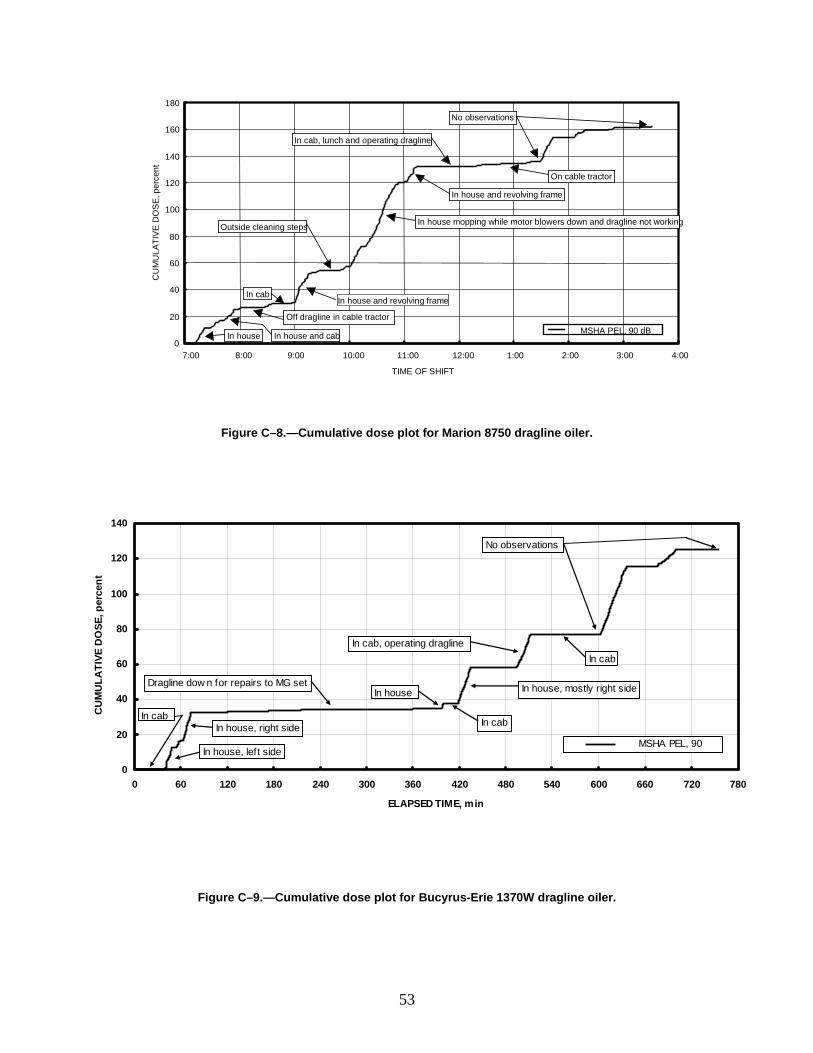
180
CU
MU
LATI
VE
DO
SE
, per
cent
No observations 160
In cab, lunch and operating dragline
140
On cable tractor 120
In house and revolving frame
100 In house mopping while motor blowers down and dragline not working Outside cleaning steps
80
60
40 In cab In house and revolving frame
20 Off dragline in cable tractor MSHA PEL, 90 dB In house In house and cab
0 7:00 8:00 9:00 10:00 11:00 12:00 1:00 2:00 3:00 4:00
TIME OF SHIFT
Figure C–8.—Cumulative dose plot for Marion 8750 dragline oiler.
53
140
120
100
80
60
40
20
0
No observations
In cab, operating dragline In cab
Dragline dow n for repairs to MG set In house In house, mostly right side
In cab In house, right side In cab
In house, left side MSHA PEL, 90
0 60 120 180 240 300 360 420 480 540 600 660 720 780
ELAPSED TIME, min
Figure C–9.—Cumulative dose plot for Bucyrus-Erie 1370W dragline oiler.
CU
MU
LATI
VE D
OSE
, per
cent
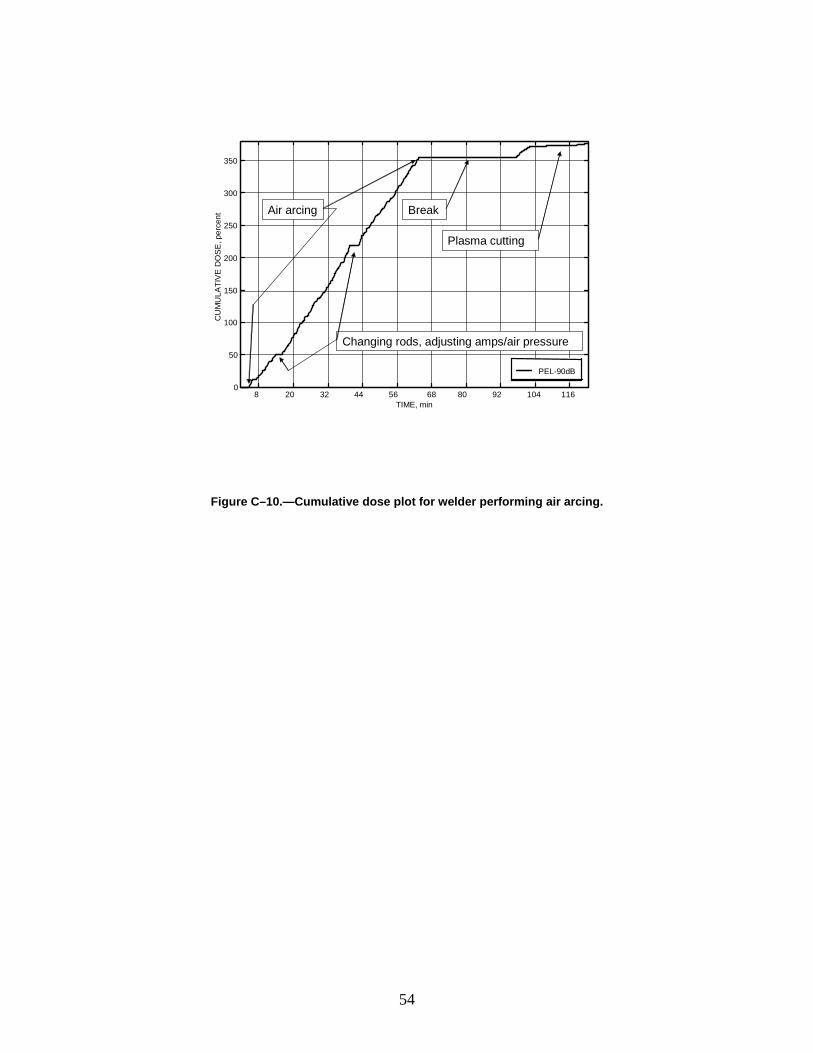
0
50
100
150
200
250
300
350
CU
MU
LATI
VE
DO
SE
, per
cent
PEL-90dB
Changing rods, adjusting amps/air pressure
Break
Plasma cutting
Air arcing
8 20 32 44 56 68 80 92 104 116 TIME, min
Figure C–10.—Cumulative dose plot for welder performing air arcing.
54
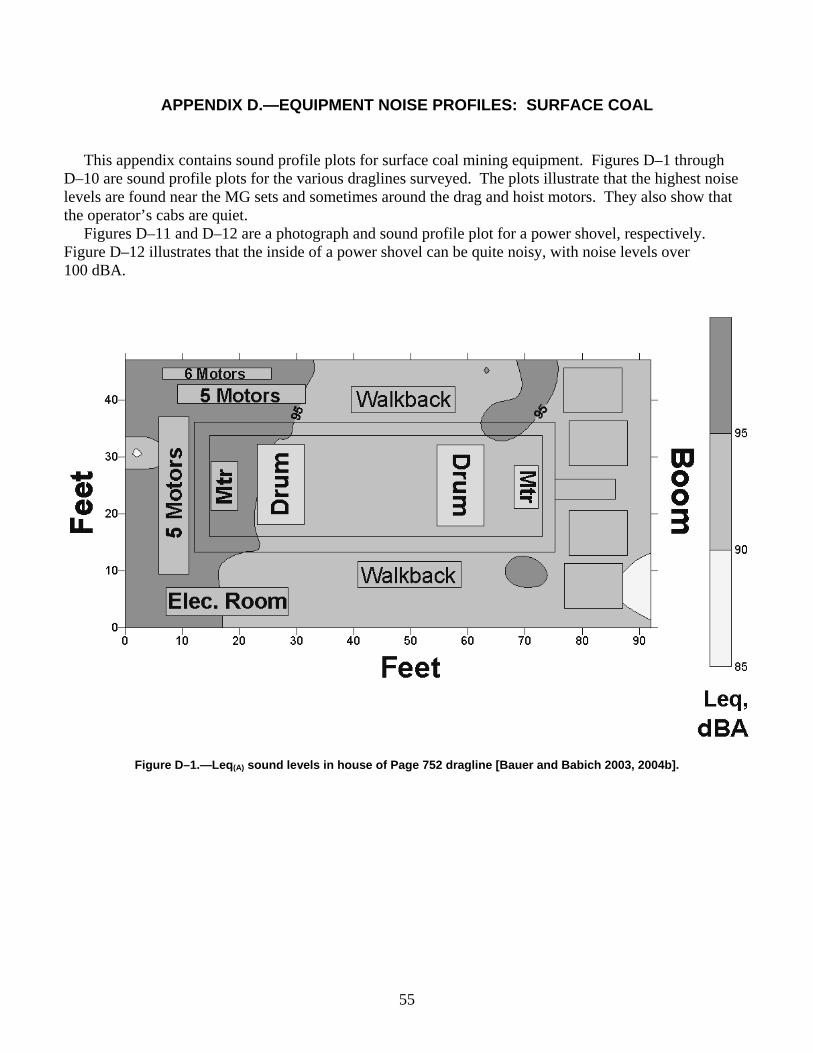
APPENDIX D.—EQUIPMENT NOISE PROFILES: SURFACE COAL
This appendix contains sound profile plots for surface coal mining equipment. Figures D–1 through D–10 are sound profile plots for the various draglines surveyed. The plots illustrate that the highest noise levels are found near the MG sets and sometimes around the drag and hoist motors. They also show that the operator’s cabs are quiet.
Figures D–11 and D–12 are a photograph and sound profile plot for a power shovel, respectively. Figure D–12 illustrates that the inside of a power shovel can be quite noisy, with noise levels over 100 dBA.
55
Figure D–1.—Leq(A) sound levels in house of Page 752 dragline [Bauer and Babich 2003, 2004b].
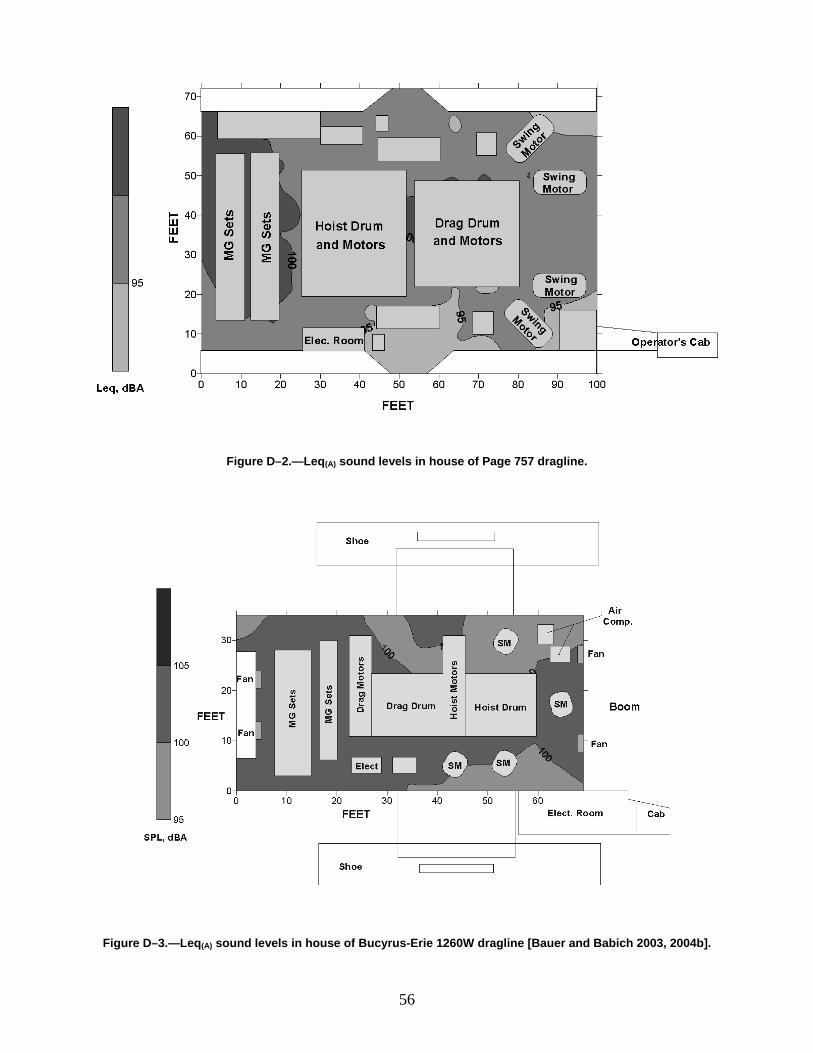
Figure D–2.—Leq(A) sound levels in house of Page 757 dragline.
Figure D–3.—Leq(A) sound levels in house of Bucyrus-Erie 1260W dragline [Bauer and Babich 2003, 2004b].
56
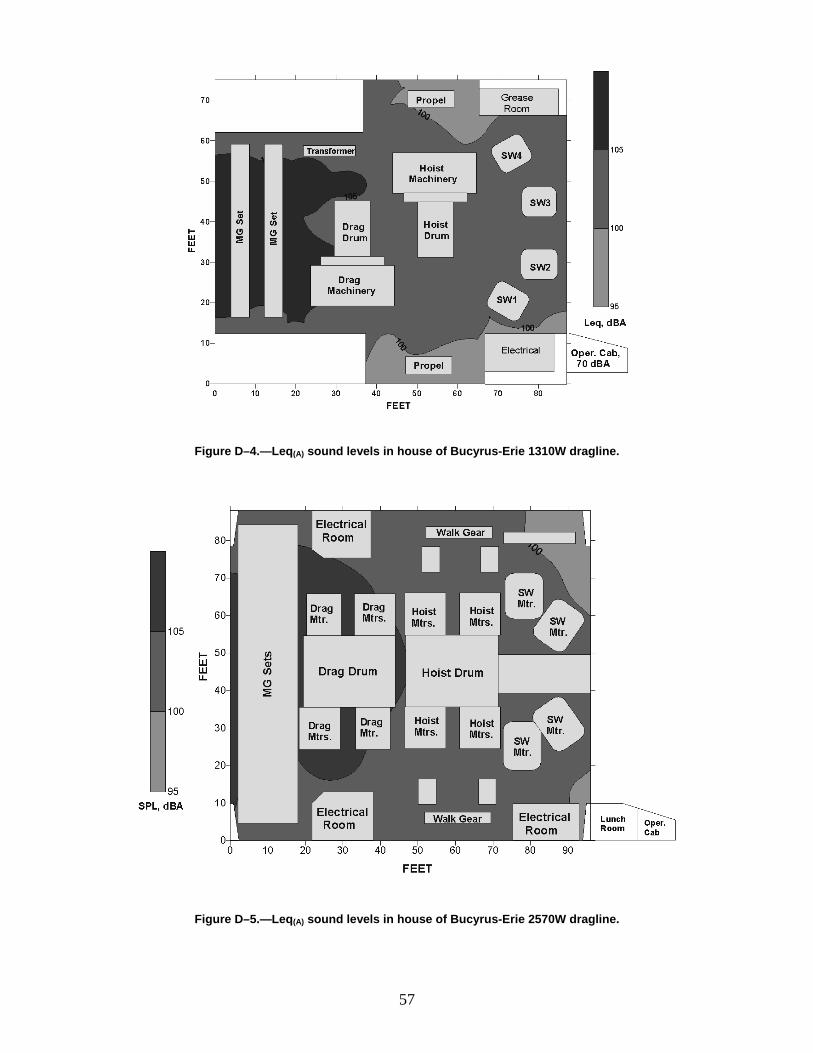
Figure D–4.—Leq(A) sound levels in house of Bucyrus-Erie 1310W dragline.
Figure D–5.—Leq(A) sound levels in house of Bucyrus-Erie 2570W dragline.
57
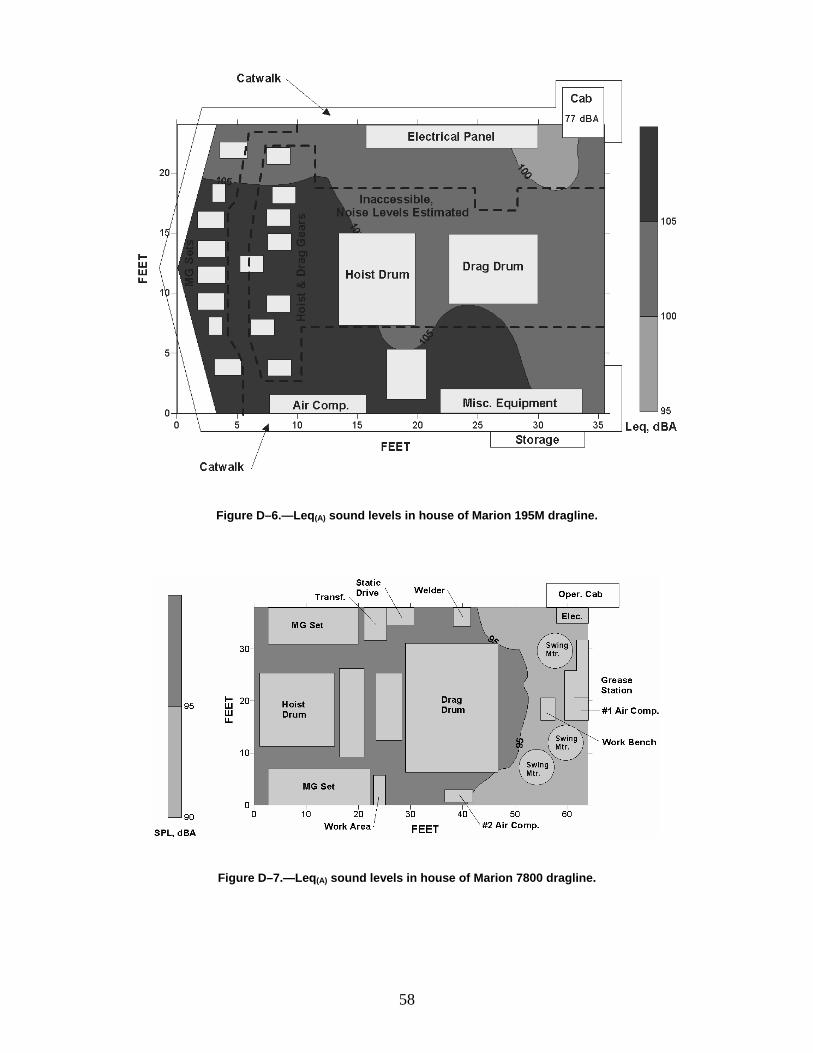
Figure D–6.—Leq(A) sound levels in house of Marion 195M dragline.
Figure D–7.—Leq(A) sound levels in house of Marion 7800 dragline.
58
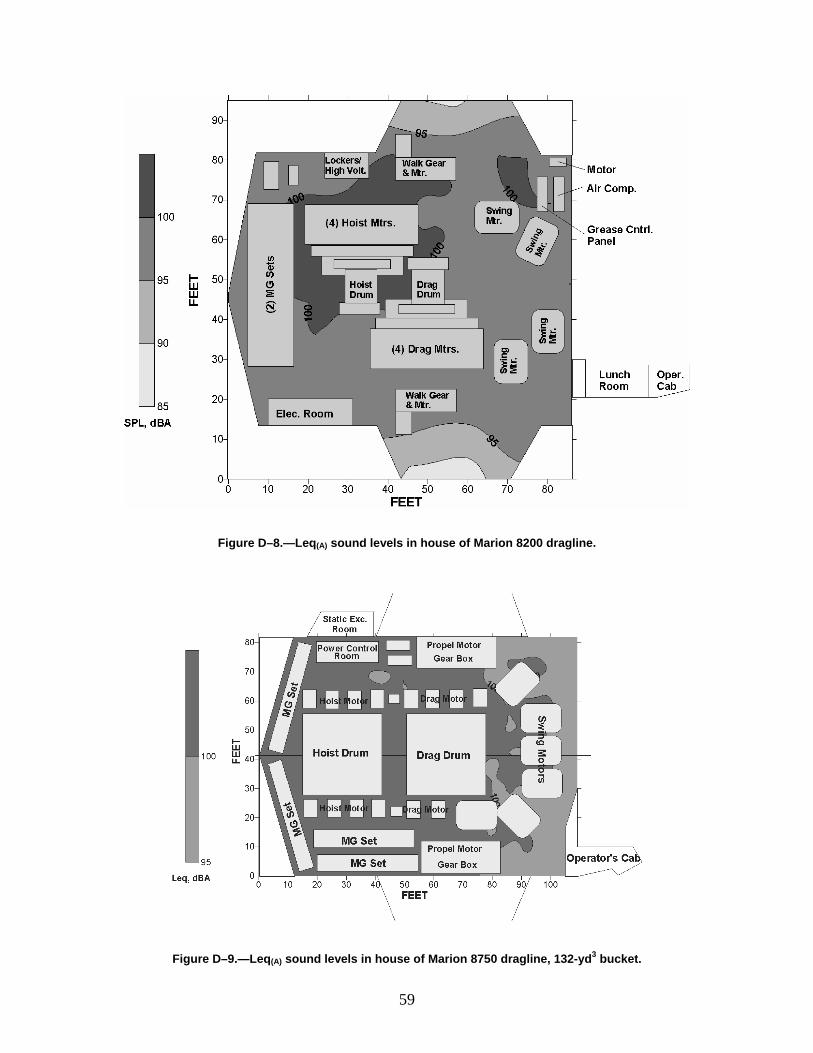
Figure D–8.—Leq(A) sound levels in house of Marion 8200 dragline.
Figure D–9.—Leq(A) sound levels in house of Marion 8750 dragline, 132-yd3 bucket.
59
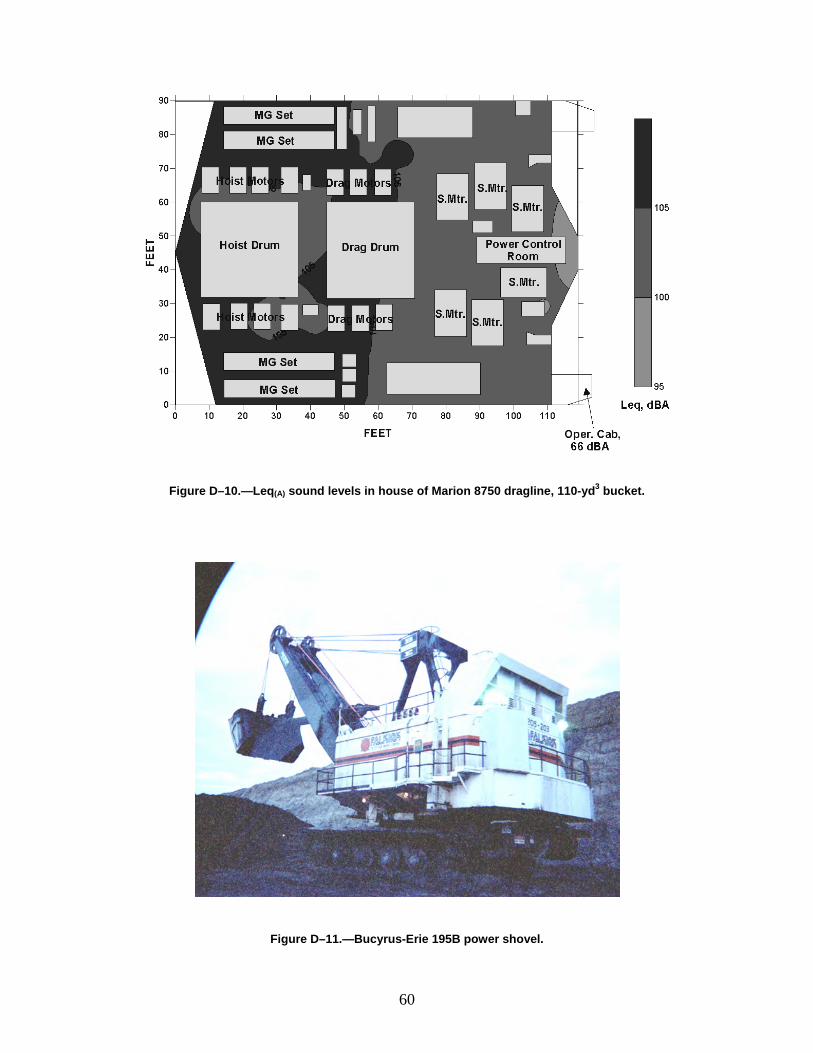
Figure D–10.—Leq(A) sound levels in house of Marion 8750 dragline, 110-yd3 bucket.
Figure D–11.—Bucyrus-Erie 195B power shovel.
60
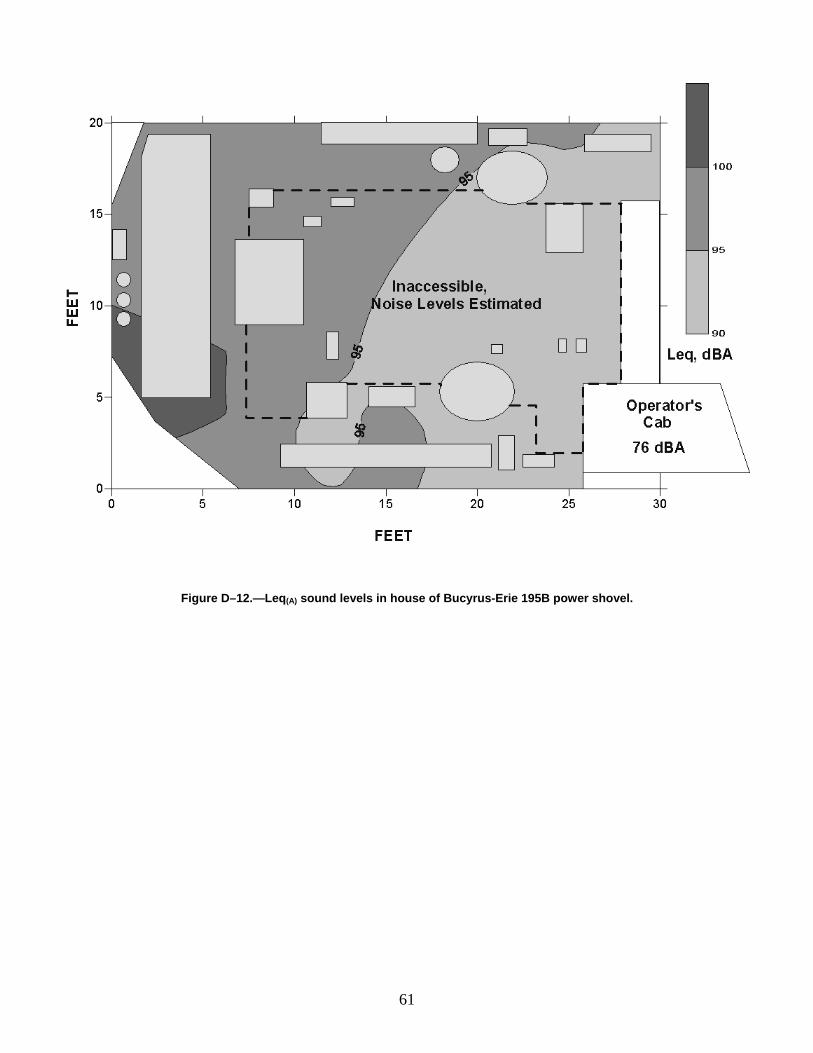
Figure D–12.—Leq(A) sound levels in house of Bucyrus-Erie 195B power shovel.
61
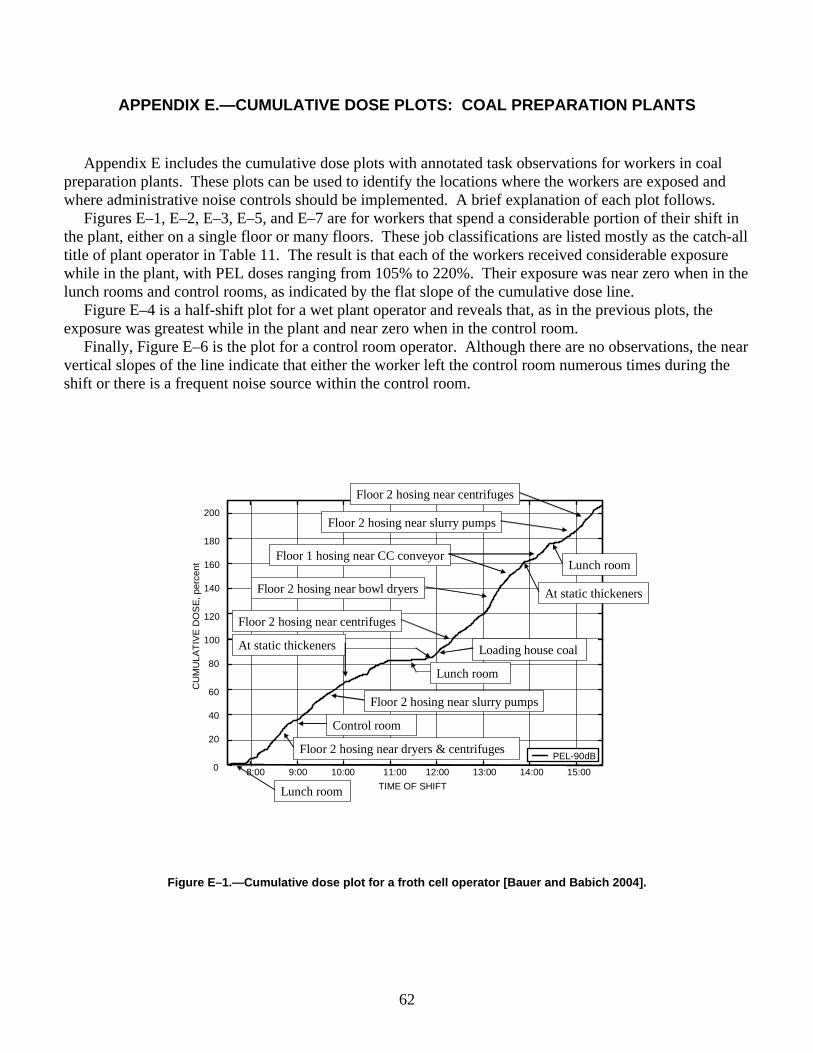
APPENDIX E.—CUMULATIVE DOSE PLOTS: COAL PREPARATION PLANTS
Appendix E includes the cumulative dose plots with annotated task observations for workers in coal preparation plants. These plots can be used to identify the locations where the workers are exposed and where administrative noise controls should be implemented. A brief explanation of each plot follows.
Figures E–1, E–2, E–3, E–5, and E–7 are for workers that spend a considerable portion of their shift in the plant, either on a single floor or many floors. These job classifications are listed mostly as the catch-all title of plant operator in Table 11. The result is that each of the workers received considerable exposure while in the plant, with PEL doses ranging from 105% to 220%. Their exposure was near zero when in the lunch rooms and control rooms, as indicated by the flat slope of the cumulative dose line.
Figure E–4 is a half-shift plot for a wet plant operator and reveals that, as in the previous plots, the exposure was greatest while in the plant and near zero when in the control room.
Finally, Figure E–6 is the plot for a control room operator. Although there are no observations, the near vertical slopes of the line indicate that either the worker left the control room numerous times during the shift or there is a frequent noise source within the control room.
62
8:00 9:00 10:00 11:00 12:00 13:00 14:00 15:00 0
20
40
60
80
100
120
140
160
180
200
TIME OF SHIFT
CU
MU
LATI
VE D
OS
E, p
erce
nt
PEL-90dB
Lunch room
Floor 2 hosing near dryers & centrifuges
Control room
Floor 2 hosing near slurry pumps
Lunch room
At static thickeners
Floor 2 hosing near centrifuges
Loading house coal
Floor 2 hosing near bowl dryers
Floor 1 hosing near CC conveyor
Floor 2 hosing near slurry pumps
Floor 2 hosing near centrifuges
Lunch room
At static thickeners
Figure E–1.—Cumulative dose plot for a froth cell operator [Bauer and Babich 2004].
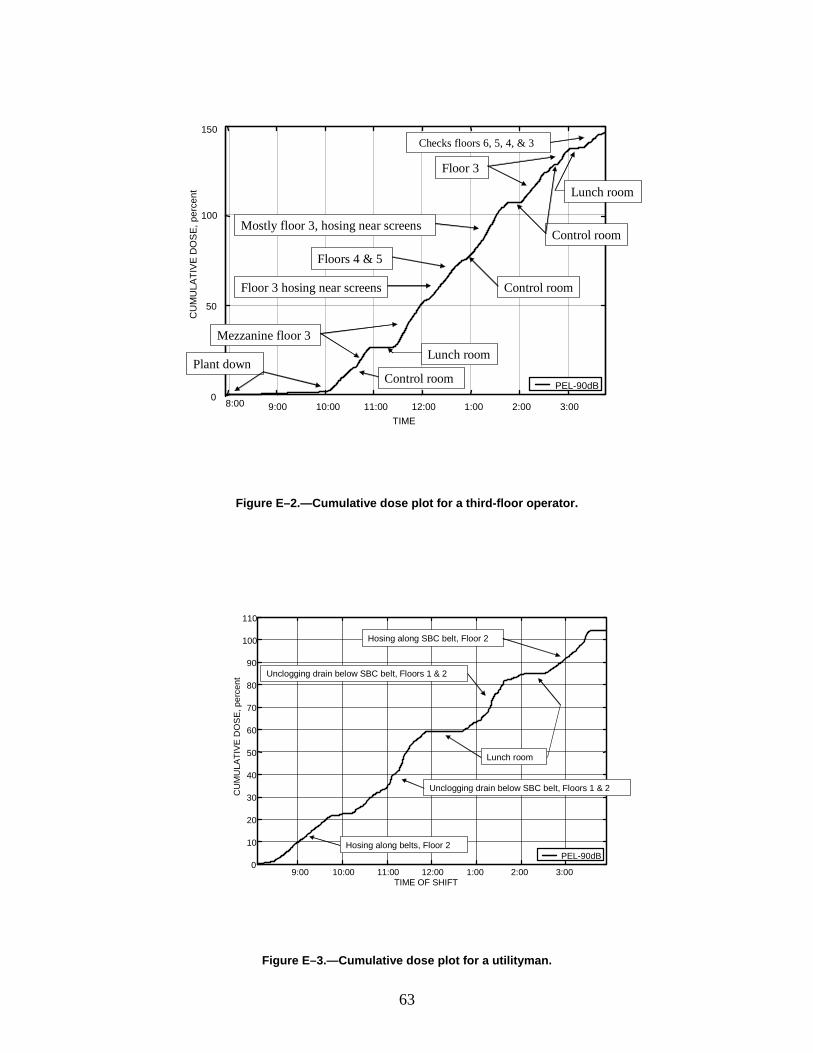
CU
MU
LATI
VE
DO
SE,
per
cent
150 Checks floors 6, 5, 4, & 3
Floor 3
Lunch room
100 Mostly floor 3, hosing near screens
Control room
Floors 4 & 5
Floor 3 hosing near screens Control room 50
Mezzanine floor 3 Lunch room
Plant down Control room PEL-90dB
0 8:00 9:00 10:00 11:00 12:00 1:00 2:00 3:00 TIME
Figure E–2.—Cumulative dose plot for a third-floor operator.
110
100 Hosing along SBC belt, Floor 2
90
CU
MU
LATI
VE D
OS
E, p
erce
nt Unclogging drain below SBC belt, Floors 1 & 2
80
70
60
50 Lunch room
40 Unclogging drain below SBC belt, Floors 1 & 2
30
20
10 Hosing along belts, Floor 2 PEL-90dB
0 9:00 10:00 11:00 12:00 1:00 2:00 3:00
TIME OF SHIFT
Figure E–3.—Cumulative dose plot for a utilityman.
63

CU
MU
LATI
VE D
OS
E, p
erce
nt
10
20
30
40
50
60
70
80
PEL-90dB
Control Room
Outside at static thickener
Checks, Floors 10 to 2
Checks, Floors 10 to 2
Outside at static thickener
Control Room
Working along main plant feed belt and drive, not running
0 7:30 8:00 8:30 9:00 9:30 10:00 10:30 11:00 11:30
TIME OF SHIFT
Figure E–4.—Half-shift cumulative dose plot for a wet-plant attendant.
64
0
50
100
150
200
250
6:00 7:00 8:00 9:00 10:00 11:00 12:00 1:00 2:00 3:00 4:00 5:00 6:00
TIME OF SHIFT
CU
MU
LATI
VE
DO
SE
, per
cent
MSHA PEL, 90 dB
Outside at static thickener
Mostly Floor 2 Floor 1
Control room
Floors 2, 3, and 4
Out of plant, to office
Floor 2
Lunch, control room
Floor 2, emptying decanter
Floor 2, by decanter and TEMA dryer
Floor 2, by decanter
Floor 1 hosing
Varies between outside and Floor 2
Figure E–5.—Cumulative dose plot for a sump floor operator.

0
5
10
15
20
25
30
35
40
45
CU
MU
LATI
VE
DO
SE
, per
cent
MSHA PEL, 90dB
6:00 7:00 8:00 9:00 10:00 11:00 12:00 1:00 2:00 3:00 4:00 5:00 6:00
TIME OF SHIFT
Figure E–6.—Cumulative dose plot for a control room operator.
160
140
120
100
80
60
40
20
0
8:00 9:00 10:00 11:00 12:00 1:00 2:00 3:00 4:00
TIME OF SHIFT
MSHA PEL, 90 dB
Control Room
Control Room Control Room
Control Room
Lunch Room
Floor 4 near screen repairs, B–2, #257
Floor 4 near screen repairs, B–2, #257
Floors 3, 3½, and 4
Floor 4, tightening bolts/belts on screens
Using air chisel, floor 4
Floor 4
Operating forklift outside and floor 1
Mostly floor 4
Figure E–7.—Cumulative dose plot for a floor 4 plant mechanic.
CU
MU
LATI
VE
DO
SE
, per
cent
65

APPENDIX F.—AREA NOISE PROFILES: COAL PREPARATION PLANTS
This appendix contains representative sound profile plots, also referred to as area noise profiles, for floors in coal preparation plants. The plots simply show the sound levels (ranging from 85 dBA to over 100 dBA) around typical coal processing equipment found in coal preparation plants. Mine operators can use these plots for noise awareness/avoidance training and to map out low-noise/reduced-exposure travelways throughout the plants. The plots also reveal equipment needing repair and where engineering noise controls are needed. These areas are indicated by localized high noise levels. For instance, Figure F–1 reveals a higher noise level at the second row of fine coal screens. This area should be investigated by mine management to determine the cause/source of the higher noise level, then dealt with appropriately.
66
Figure F–1.—Leq(A) sound levels on a floor with many (23) vibrating screens.
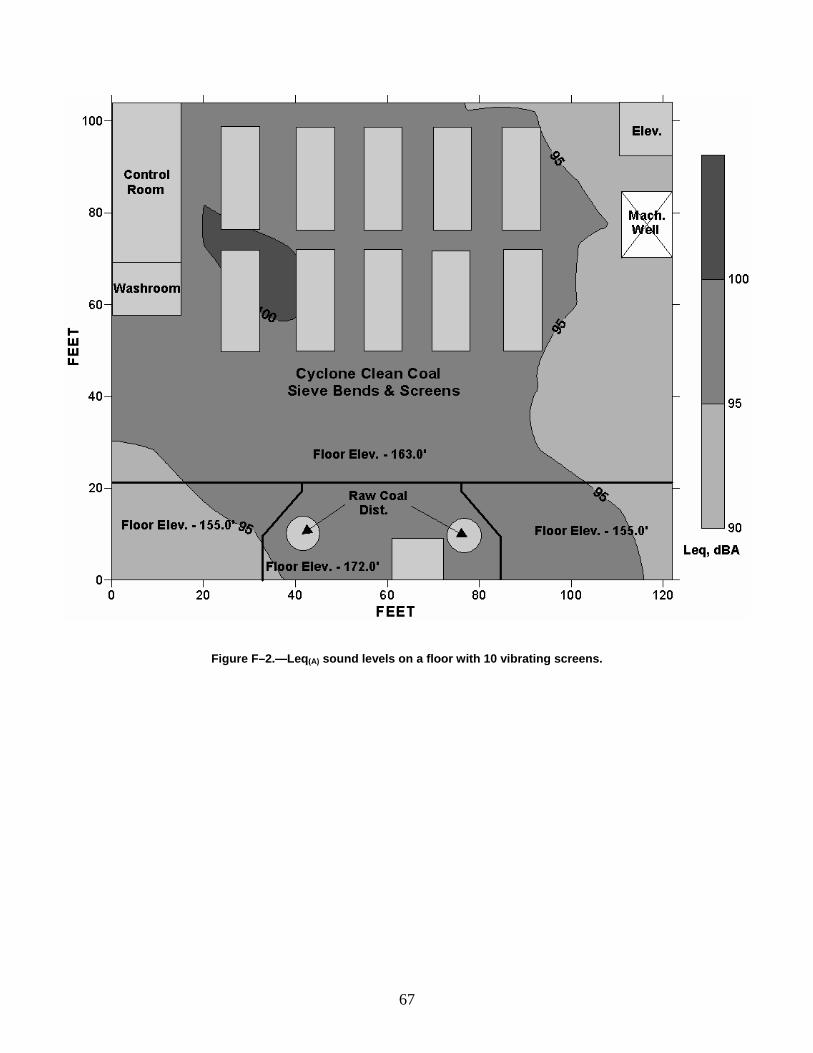
Figure F–2.—Leq(A) sound levels on a floor with 10 vibrating screens.
67
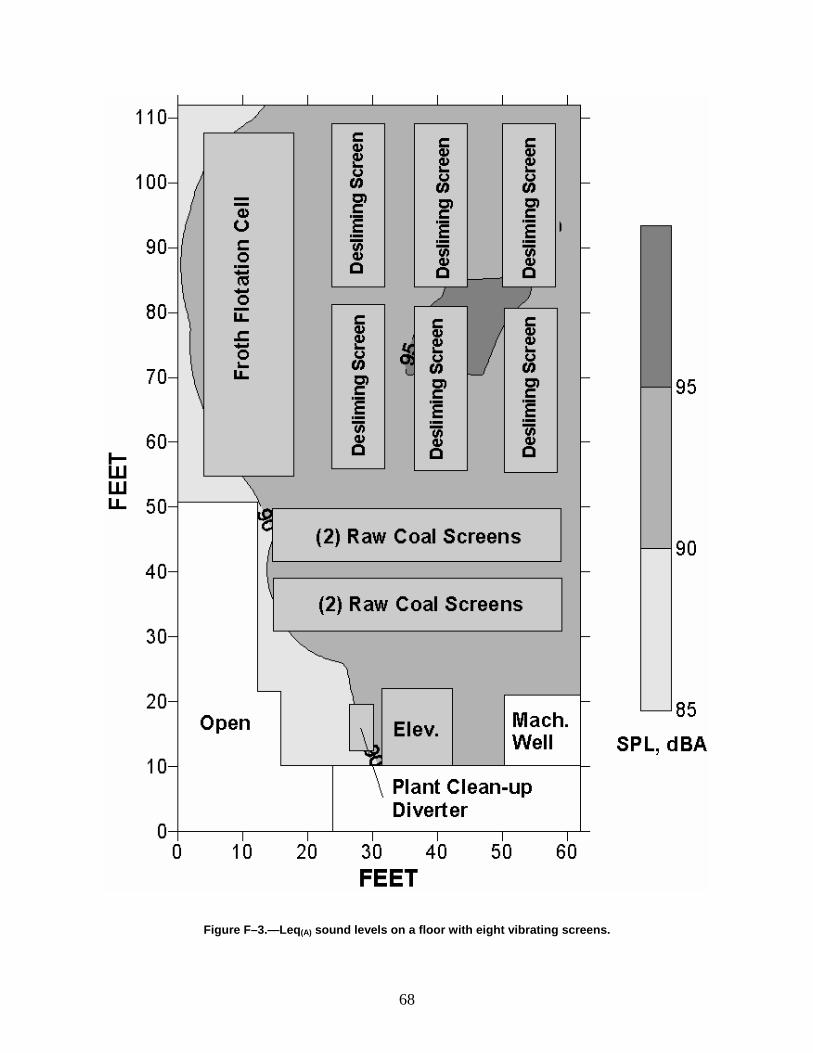
Figure F–3.—Leq(A) sound levels on a floor with eight vibrating screens.
68

Figure F–4.—Leq(A) sound levels on a floor with only two vibrating screens.
69
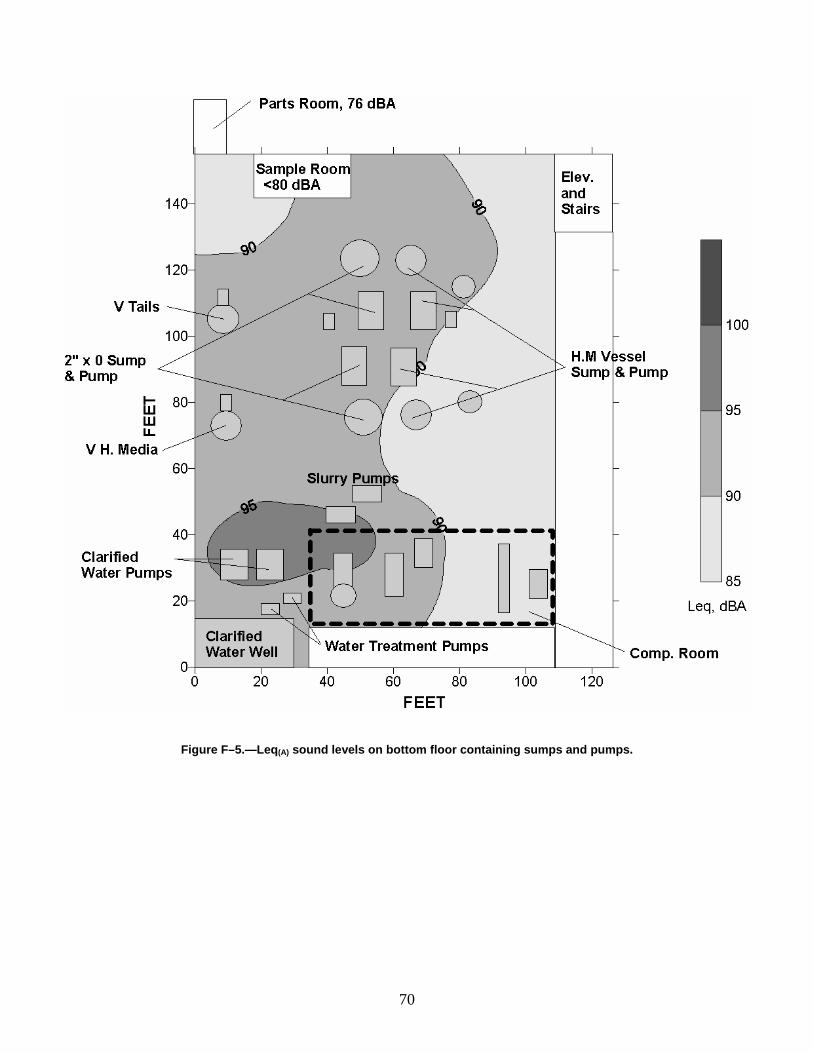
Figure F–5.—Leq(A) sound levels on bottom floor containing sumps and pumps.
70
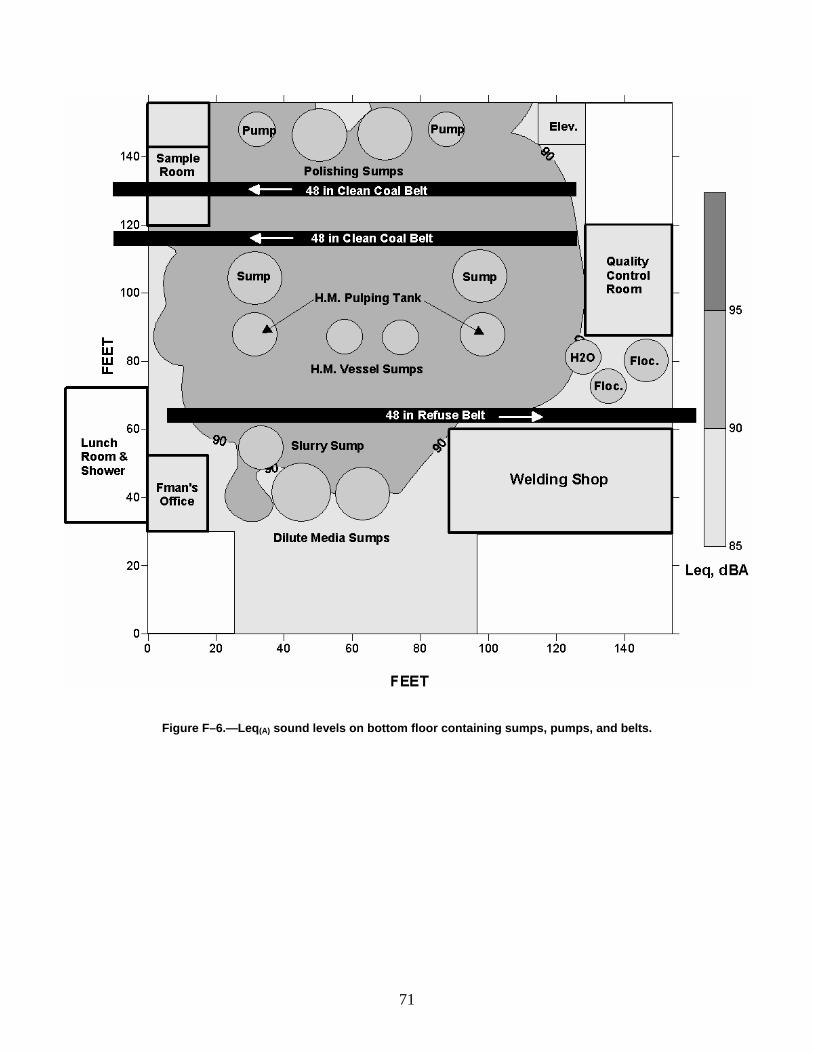
Figure F–6.—Leq(A) sound levels on bottom floor containing sumps, pumps, and belts.
71
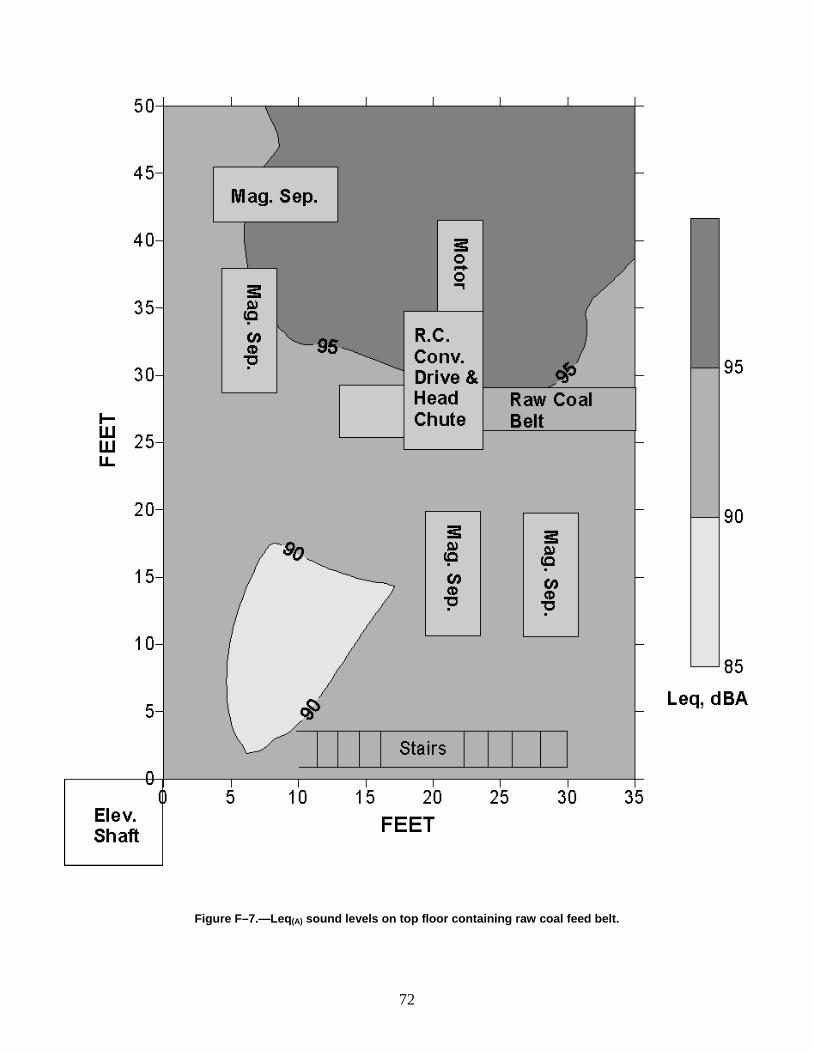
Figure F–7.—Leq(A) sound levels on top floor containing raw coal feed belt.
72
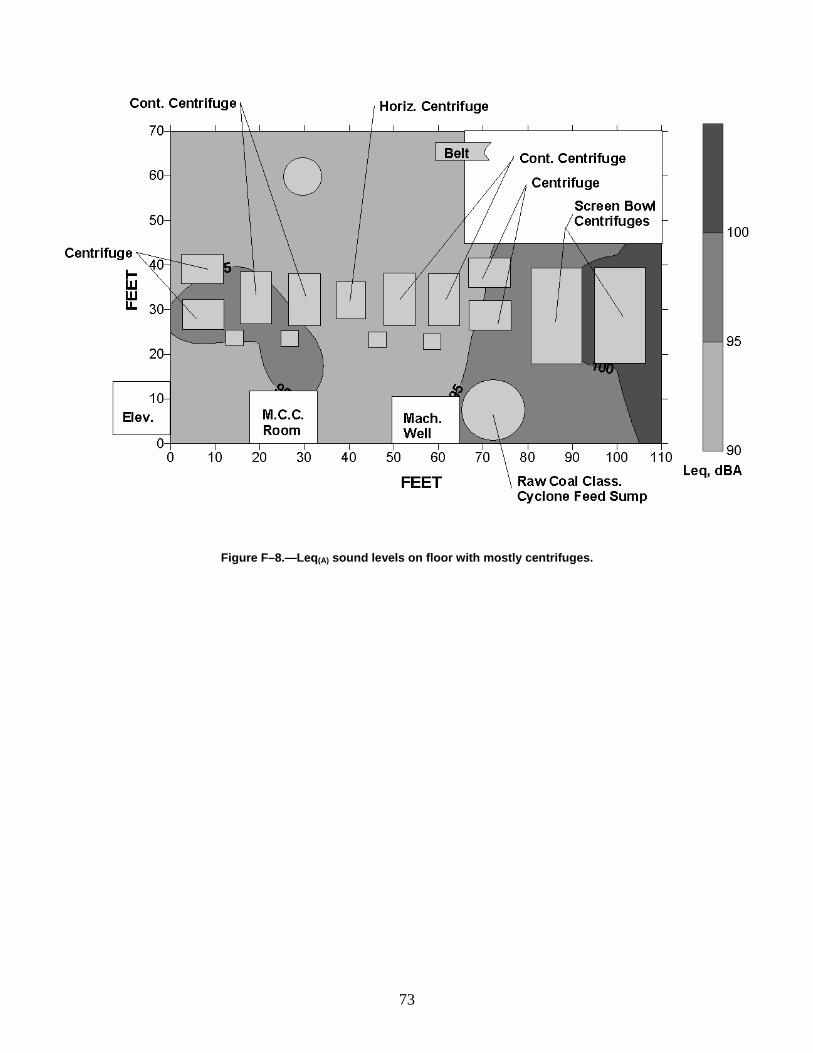
Figure F–8.—Leq(A) sound levels on floor with mostly centrifuges.
73

Figure F–9.—Leq(A) sound levels on floor with magnetic separators only.
74

Figure F–10.—Leq(A) sound levels around froth flotation cells.
75
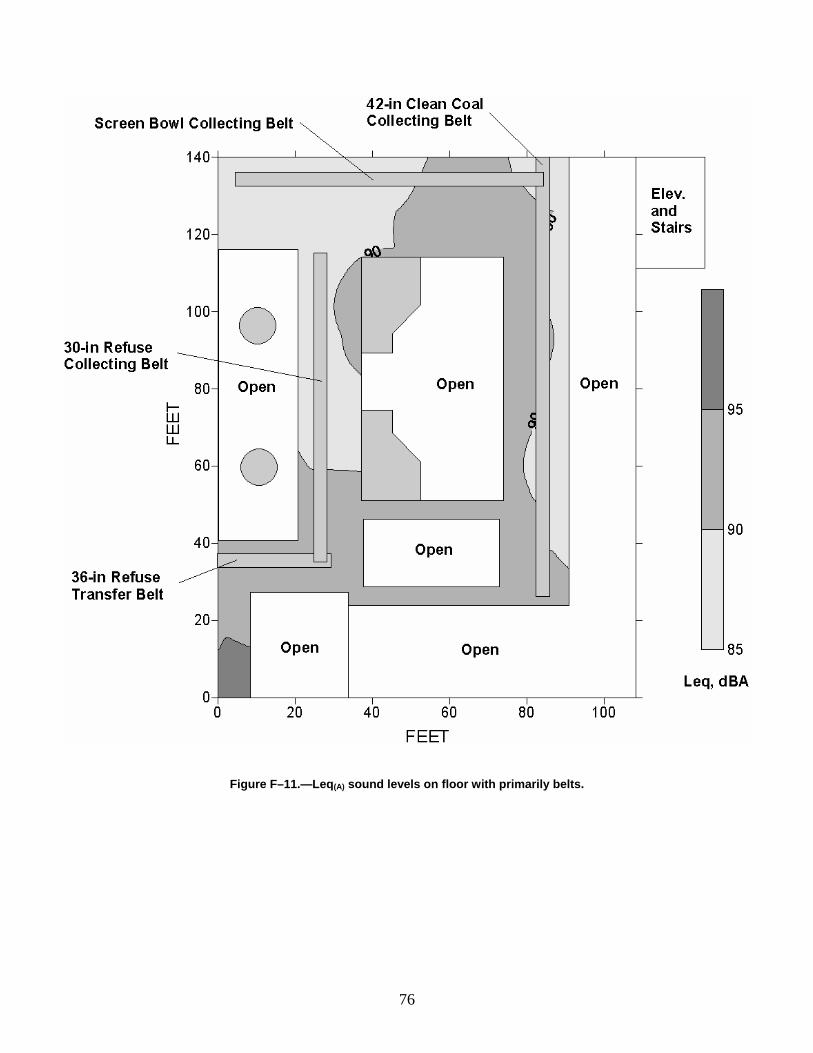
Figure F–11.—Leq(A) sound levels on floor with primarily belts.
76
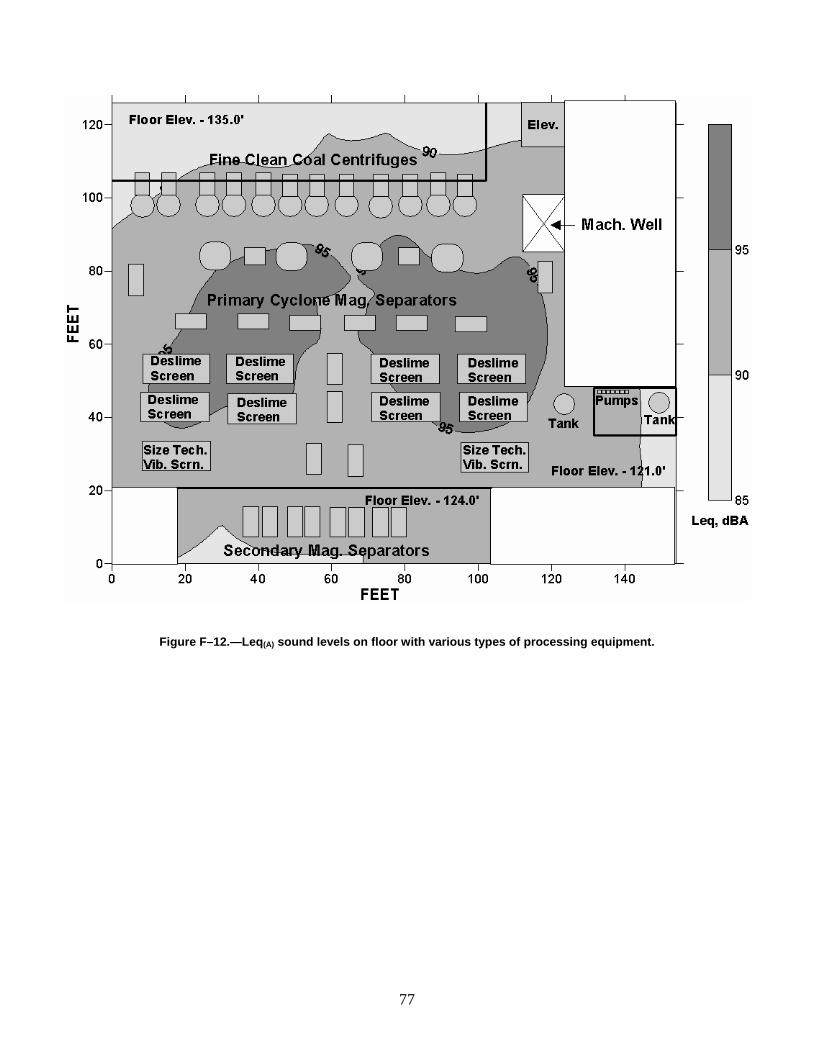
Figure F–12.—Leq(A) sound levels on floor with various types of processing equipment.
77

Delivering on the Nation’s promise:
Safety and health at work for all people through research and prevention
To receive documents or more information about occupational safety and health topics, contact NIOSH at
1 800 35 NIOSH (1 800 356 4674) – – – – – –
Fax: 513 533 8573 – –
E-mail: [email protected]
or visit the NIOSH Web site at www.cdc.gov/niosh
DHHS (NIOSH) Publication No. 2007 10– 5
SAFER ● HEALTHIER ● PEOPLE tm