equitable access to excellent educators · 2016-11-21 · equitable access to excellent educators....
TRANSCRIPT

Equitable Access to Excellent EducatorsAn Analysis of States’ Educator Equity Plans
Developed by Westat Equity Team

Equitable Access to Excellent EducatorsAn Analysis of States’ Educator Equity Plans
AuthorsWesley Williams, II, Richard Adrien, Carrie Murthy, Darcy Pietryka
Prepared for:U.S. Department of EducationOffice of Elementary and Secondary EducationWashington, DC
Prepared by:WestatAn Employee-Owned Research Corporation®1600 Research BoulevardRockville, Maryland 20850-3129301-251-1500

Equitable Access to Excellent Educators iii
Table of Contents
Introduction 1
Methodology 3
Report Overview 4
1: Analysis of Stakeholder Engagement and Identified Equity Gaps 5
Stakeholder Consultation 5
Stakeholder Groups Engaged 6
Stakeholders’ Roles in Developing Equity Plans 7
Methods of Stakeholder Engagement 7
In-person Meetings 8
Virtual Meetings 9
Focus Groups 9
Electronic Communications 10
Surveys 10
Examples of Stakeholder Feedback Used to Refine the Equity Plan 11
Definition of Key Terms 12
Defining Equitable Access to Excellent Educators 12
Equity Gaps 16
Metrics That States Used to Identify Equity Gaps 17
Summary of Equity Gaps 17
Equity Gaps by Other Teacher Variables 19
2: Analysis of Root Causes 20
Summary of Root Causes by Topic Area 20
Topic Areas Related to Conditions 21
Topic Areas Related to Educator Preparation 22
Topic Areas Related to Human Capital Management Systems 23

Equitable Access to Excellent Educators iv
3: Analysis of Strategies 26
Summary of Strategies by Topic Area 26
Topic Areas Related to Conditions 28
Topic Areas Related to Educator Preparation 28
Topic Areas Related to Human Capital Management Systems 30
4: Evaluating and Reporting Progress 35
Performance Measures to Monitor Progress 35
Public Reporting of Progress 35
Conclusion 38
Works Cited 39
APPENDIXES
A: Topic Definitions of Root Causes and Strategies A-1
B: Types of Stakeholders Engaged by State B-1
C: Methods of Stakeholder Engagement by State C-1
D: States’ Data Sources D-1
E: Equity Gaps by State E-1
F: Root Causes Identified by State F-1
G: Strategies Identified by State G-1
H: Methods of Public Reporting by State H-1
I:Top Additional Key Terms I-1
J: Summative Overview of States’ Definitions of Required Terms J-1
K: State Equity Profiles K-1
FIGURES AND TABLES
Table 1 Definitions of educator effectiveness in Educator Equity Plans that focused on effectiveness equity gaps 16
Table 2 Alignment samples of strategies and performance measures 36
Figure 1 Educator Equity Plan development and implementation 2
Figure 2 Methodology 3
Figure 3 Additional stakeholder groups engaged in State planning
(by number of States) 6
Figure 4 Methods of stakeholder engagement (by number of States) 8
Figure 5 Specific types of engagement activities conducted
with stakeholders (by number of States) 11
Figure 6 State definitions of “inexperienced teachers” (by number of States) 13

Equitable Access to Excellent Educators v
Figure 7 State definitions of “unqualified teachers” (by number of States) 13
Figure 8 State definitions of “out-of-field teachers” (by number of States) 14
Figure 9 Definitions of “low-income students” (by number of States) 14
Figure 10 Definitions of “minority students” (by number of States) 15
Figure 11 Metrics States used to identify equity gaps 17
Figure 12 Identified gaps in the rates at which low-income and minority
students are taught by inexperienced, out-of-field and unqualified
teachers (by number of States) 18
Figure 13 Root causes States most frequently identified, by topic area
(by number of States) 20
Figure 14 Strategies States most frequently identified, by topic area
(by number of states) 27
Figure 15 Planned frequency of State progress reporting to stakeholders
(by number of states) 37
Figure 16 Methods States will use to publicly report progress to stakeholders (by number of states) 37

Equitable Access to Excellent Educators 1
Introduction
In July 2014, the U.S. Department of Education (ED) launched the Excellent Educators for All Initiative as part of its efforts to ensure that all students have equitable access to a quality education. Equitable access to excellent educators is an important part of that commitment. This initiative is intended to help States and school districts increase access to excellent educators for the students who need them most, ensuring equitable access and opportunity for all students, no matter their race, ZIP Code, or family income.
As part of the Excellent Educators for All Initiative, ED required each State educational agency (SEA) to “submit a plan describing the steps it will take to ensure that poor and minority children are not taught at higher rates than other children by inexperienced, unqualified, or out-of-field teachers” as required by Elementary and Secondary Education Act of 1965, Section 1111 (b)(8)(c) (ESEA), as amended by the No Child Left Behind Act of 2001 (NCLB).1 On June 1, 2015, States2 submitted to ED Education Equity Plans to Ensure Equitable Access to Excellent Educators (Educator Equity Plans). These Educator Equity Plans describe how States will ensure that students—particularly students from low-income families and students who represent racial/ethnic
minorities—have equitable access to excellent educators and are not taught at disproportionate rates by teachers who are inexperienced, unqualified, or out-of-field. Each State’s plan conveys its commitment to achieving this goal.
The Educator Equity Plans included the following required components:
• Description and documentation of steps the SEA took to consult with local educational agencies (LEAs), teachers, principals, pupil services personnel, administrators, other staff and parents regarding the Educator Equity Plan
• Definitions of key terms3
• Identification of equity gaps4
• Explanation of the likely cause(s) of the identified equity gaps
• The SEA’s proposed steps to eliminate identified equity gaps
• Measures that the SEA will use to evaluate progress toward eliminating the identified equity gaps, including the method and timeline for the evaluation, for both (1) low-income students and (2) minority students
1 All references to the ESEA refer to the ESEA as amended by NCLB, unless otherwise indicated.
2 For the purposes of this analysis, “States” refer to the 50 States, the District of Columbia and Puerto Rico.
3 To analyze whether “inexperienced teachers,” “unqualified teachers,” and “out-of-field teachers” serve “low-income students” and “minority students” at dispropor-tionate rates, ED required States to define each of these key terms used in the statute and specify the data they used to calculate potential gaps in equitable access.
4 ED issued the following guidance in FAQs released in 2015: “The term ‘equity gap’ is used by the Department to refer to the difference between the rate at which students from low-income families or students of color are educated by excellent educators and the rate at which other students are educated by excellent educators. By statute, a State Plan must, at a minimum, address the difference between the rate at which students from low income families or students of color are taught by inexperienced, unqualified, or out-of-field teachers and the rate at which other students are taught by these teachers. An SEA has the discretion to use school- or student-level data to identify equity gaps” (U.S. Department of Education, State Plans to Ensure Equitable Access to Excellent Educators: Frequently Asked Questions, 2015, p. 8).
Equitable Access to Excellent Educators 2
• Description of how the SEA will publicly report on its progress in eliminating the identified gaps, including timelines for this reporting5
Before submission, ED provided the following supports to assist States in the development of their Educator Equity Plans:
• An Assistant Secretary letter to all Chief State School Officers on November 10, 2014
• A Frequently Asked Questions guidance document
• Data provided by ED in 2014, including data files and Educator Equity Profiles that bring together several public data sources and provide a summary of key publicly available data that States had the option to use in developing their plans
• A webinar series on State Plan to Ensure Equitable Access to Excellent Educators
– Webinar 1: State Plan to Ensure Equitable Access to Excellent Educators: November 17, 2014
– Webinar 2: Understanding Your Educator Equity Profile: December 1, 2014
– Webinar 3: Understanding Your Data: December 9, 2015
• Technical assistance support through the Equitable Access Support Network (https://easn.grads360.org), an ED-funded partnership among national and local experts, analysts, and practitioners, designed to help SEAs and districts develop and implement their State plans
ED’s guidance and support services equipped States with resources and technical assistance to engage in the process to submit Educator Equity Plans.
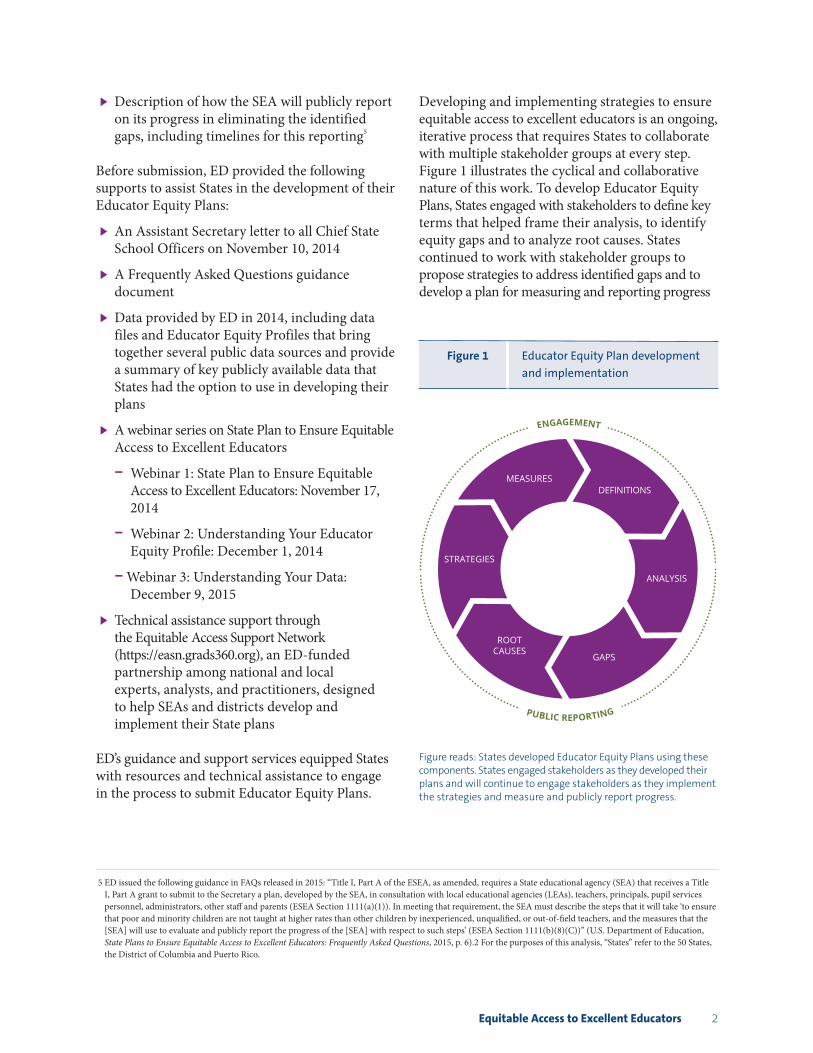
Developing and implementing strategies to ensure equitable access to excellent educators is an ongoing, iterative process that requires States to collaborate with multiple stakeholder groups at every step. Figure 1 illustrates the cyclical and collaborative nature of this work. To develop Educator Equity Plans, States engaged with stakeholders to define key terms that helped frame their analysis, to identify equity gaps and to analyze root causes. States continued to work with stakeholder groups to propose strategies to address identified gaps and to develop a plan for measuring and reporting progress
Figure 1 Educator Equity Plan development and implementation
ANALYSIS
GAPS
STRATEGIES
MEASURES
ROOTCAUSES
DEFINITIONS
ENGAGEMENT
PUBLIC REPORTING
Figure reads: States developed Educator Equity Plans using these components. States engaged stakeholders as they developed their plans and will continue to engage stakeholders as they implement the strategies and measure and publicly report progress.
5 ED issued the following guidance in FAQs released in 2015: “Title I, Part A of the ESEA, as amended, requires a State educational agency (SEA) that receives a Title I, Part A grant to submit to the Secretary a plan, developed by the SEA, in consultation with local educational agencies (LEAs), teachers, principals, pupil services personnel, administrators, other staff and parents (ESEA Section 1111(a)(1)). In meeting that requirement, the SEA must describe the steps that it will take ‘to ensure that poor and minority children are not taught at higher rates than other children by inexperienced, unqualified, or out-of-field teachers, and the measures that the [SEA] will use to evaluate and publicly report the progress of the [SEA] with respect to such steps’ (ESEA Section 1111(b)(8)(C))” (U.S. Department of Education, State Plans to Ensure Equitable Access to Excellent Educators: Frequently Asked Questions, 2015, p. 6).2 For the purposes of this analysis, “States” refer to the 50 States, the District of Columbia and Puerto Rico.

Equitable Access to Excellent Educators 3
on closing those gaps. As States implement their plans, they will regularly assess their progress and use stakeholder feedback and performance measure data to inform areas for future improve-ment and refinement.
As of December 2015, ED approved Educator Equity Plans for all 50 States, the District of Columbia and Puerto Rico. In addition, on December 10, 2015, ESEA was reauthorized by the Every Student Succeeds Act (ESSA).6 Educator equity remains a statutory requirement in Title I, Part A7 of ESSA, and ESSA includes updated components that States will need to address (Every Student Succeeds Act of 2015, P.L. 114-95, §129, Stat. 1802 (2015)).
METHODOLOGYThis report provides analysis of States’ approved Educator Equity Plans, examining all core components of the plans, including engaging stakeholders, defining key terms, identifying equity gaps, analyzing root causes, proposing equity strategies and measuring and reporting prog-ress. In reviewing the Educator Equity Plans and developing this report, the review team used a four-step process, described in Figure 2.
Figure 2 Methodology
STEP
1IDENTIFY AREAS FOR ANALYSISConducted an initial review of Educator Equity Plans to identify areas of analysis
STEP
2ORGANIZE DATACreated a review framework spreadsheet for extracting and grouping data from the Educator Equity Plans
STEP
3ANALYZE DATAIdentified cross-cutting themes, outliers and potential exemplars by areas of analysis
STEP
4SUMMARIZE DATAProduced a report to document the analysis results and summarize States’ Educator Equity Plans
6 ED sent a Dear Colleague letter to States on December 18, 2015, to confirm with States that they should continue implementing their plans. The Dear Colleague letter is available here: http://www2.ed.gov/policy/elsec/leg/essa/transition-dcl.pdf.
7 See Title I, Part A, §1111(g)(1)(B) of the ESSA for the statutory requirements related to educator equity.

Equitable Access to Excellent Educators 4
REPORT OVERVIEWThe report summarizes State Educator Equity Plans by identifying trends and commonalities and highlighting promising initiatives or practices. This report does not assess or rate the components of States’ plans, comment on their quality, or discuss the States’ progress implementing their prospective plans to date.8
Section 1 of the report summarizes how States engaged with stakeholders, provides an analysis of key terms States defined and examines the gaps States identified between the rates at which low-income and minority students are taught by inexperienced, unqualified and out-of-field teachers compared to rates at which other students are taught by these teachers.
Section 2 focuses on the State-identified likely causes (referred to in this report as “root causes”) for identified equity gaps and describes 11 topic areas9 into which the identified root causes fall (for defini-tions of topic areas, see Appendix A). Most of these root causes were related to three broad categories: conditions or challenges particular to working in high-need schools or communities, insufficient educator preparation and ineffective human capital management systems. Because there was a great deal of overlap in the root causes States identified for equity gaps, a root cause could be grouped into multiple topic areas. 10 Although some root causes were identified by many States, some States also identified root causes that were unique to their contexts and thus could not be captured in topic groupings. Appendix F provides additional information about the root causes identified by each State.
Once States explained root causes for identified equity gaps, they identified strategies to address these root causes and to close the identified gaps.
Section 3 highlights these strategies and notes that they generally fell into 15 topic areas (see Appendix A for a brief description of the 15 topic areas). This report uses those areas to analyze strategies identified by States.
Section 4 provides an analysis of Educator Equity Plans for measuring progress in eliminating iden-tified equity gaps and publicly reporting on that progress. All plans included general commitments to measure gap reduction over time; however, many plans lacked specific measurable performance targets and did not identify specific performance metrics to measure the reduction of equity gaps within a specified period of time. Additionally, many plans identified measures of strategy implementation and focused primarily on these measures to observe progress. Although many States did not identify specific performance measures, this section of the report highlights some promising examples of States’ performance measures that align with selected strategies and that have measurable targets with specific dates and timelines. States may require additional support in this area to enhance plans to measure progress and monitor States’ implementation and continuous improvement of their Educator Equity Plans.
8 All approved plans met minimum federal requirements for Educator Equity Plans.
9 Throughout this report, the term “topic areas” refers to the groups in which this analysis categorizes the State-identified root causes and proposed strategies.
10 For example, the following root cause from Alaska was grouped into two topic areas, High Educator Turnover and Inadequate Compensation/Incentives: “Stake-holders cited lack of incentives for teachers in remote rural schools to stay. Teaching in Alaska no longer represents a significant economic advantage for teachers, in that Alaska’s salaries and benefits no longer lead the nation. In addition to high teacher turnover, our data also shows high turnover of school leadership in the schools in the top quartiles of low-income and minority students” (Alaska Department of Education and Early Development, 2015, p. 20).

Equitable Access to Excellent Educators 5
1 Analysis of Stakeholder Engagement and Identified Equity Gaps
Each State’s first step in developing its Educator Equity Plan was to identify equity gaps in the rates at which low-income and minority students are taught by excellent educators compared to their peers. Obtaining meaningful stakeholder input and defining key terms were integral to ensuring a common understanding of the data elements being examined and the resulting equity gaps in the context of each State. This section provides discussion of how States consulted with stakeholders, including the stake-holder groups involved, the roles of stakeholders and the methods of stakeholder engagement.
This section also highlights commonalities and differences in how States chose to define the five terms they were required to examine to calculate gaps in equitable access: “inexperienced teacher,” “unqualified teacher,” “out-of-field teacher,” “low-income student,”11 and “minority student.” In addition to these five required terms, States had the option to define other key terms important to the analysis in their Educator Equity Plans (U.S. Department of Education, State Plans to Ensure Equitable Access to Excellent Educators: Frequently Asked Questions, 2015, p. 6). Several States chose to analyze additional terms describing characteristics of the teacher, student and school populations (see Appendix I for additional terms). The most commonly defined optional term was
“educator effectiveness.” This section presents additional analysis of State-identified terms related to educator effectiveness.12
This section describes the equity gaps States identified. Identifying these gaps was an essential part of the process to identify likely causes and select strategies to eliminate gaps and improve equitable access. States had to identify all existing gaps using the required terms. In addition, although States were only required to identify equity gaps for low-income and minority students, some States also examined gaps in how additional student populations are served. This analysis describes gaps in equitable access for both low-income and minority students and additional student populations that States identified in their analyses. Further, this section discusses the data sources and metrics States used to identify their equity gaps.
STAKEHOLDER CONSULTATIONBringing key stakeholders together was a vital part of States’ efforts to develop their Educator Equity Plans. ED required States to prepare and submit Educator Equity Plans that “describe and provide documentation of the steps the SEA took to consult with LEAs, teachers, principals, pupil services personnel, administrators, other staff, and parents”
11 Although the statute uses the term “poor” students, for the purposes of this analysis, the term “low-income” students will be used to refer to students who are economically disadvantaged. States used a variety of terms for these students in their plans. This report will use the States’ chosen terms only in direct quotations; otherwise, the term “low-income” students will be used.
12 “Educator effectiveness” is analyzed for two primary reasons: (1) the report provides this analysis of terms related to educator effectiveness because it was the additional term most often selected by States and (2) because the ESSA contains new requirements that States and districts ensure that low-income and minority students are not taught at greater rates than other students by “ineffective teachers.”

Equitable Access to Excellent Educators 6
(U.S. Department of Education, State Plans to Ensure Equitable Access to Excellent Educators: Frequently Asked Questions, 2015, p. 6). ED advised that it was vital for stakeholders to be engaged in all phases of developing and implementing Educator Equity Plans and for States to provide opportunities for meaningful stakeholder input and to ensure that stakeholders involved were representative of the whole State: “To help ensure that [an Educator Equity Plan] is comprehensive and likely to lead to significant progress in eliminating gaps, and to lay the foundation for successful implementation, an SEA should provide opportunities for meaningful input on the proposed plans” to not only the aforementioned stakeholders but also to “teachers’ representatives, non-profit teacher organizations, community-based organizations, civil rights organizations, organizations representing students with disabilities, organizations representing English learners, business organizations, Indian tribes, State and local boards of education, institutions of higher education (IHEs) and teacher preparation entities” (U.S. Department of Education, State Plans to Ensure Equitable Access to Excellent Educators: Frequently Asked Questions, 2015, pp. 9–10).
States used varying approaches to engage stake-holders in the development of Educator Equity Plans. Each plan includes information about the groups of stakeholders the State engaged, the roles stakeholders played in developing the Educator Equity Plan and the methods used to engage stakeholders; highlights are described below.
STAKEHOLDER GROUPS ENGAGEDIn developing their plans, States engaged with a range of stakeholders, including teachers, principals and other school leaders, unions, school boards, policymakers, community members, parents, civil rights groups, teacher preparation programs, IHEs, organizations representing specific student
subgroups,13 and business organizations. In addition to the stakeholder groups required for consultation,14 the stakeholders States most frequently consulted included unions/educator associations (42 States), community members (41 States), teacher preparation programs and IHEs (41 States), school board members (36 States), policymakers (27 States), civil rights groups (26 States) and business organizations (22 States). Figure 3 presents the number of States
Figure 3 Additional stakeholder groups engaged in State planning (by number of States)
Unions/Educator Associations
Community
Teacher Prep/ Higher Education
School Board
Policy-makers
Civil Rights Group
Business Groups
Organizations Representing Students with Disabilities/SPED
Organizations Representing English
Language learners
Student Groups
42
41
41
36
27
26
22
16
10
7
Source: U.S. Department of Education, Office of Elementary and Secondary Education (2015). State plans to ensure equitable access to excellent educators. Retrieved from http://www2.ed.gov/programs/titleiparta/resources.html
Figure reads: Forty-two States identified unions and education associations as additional stakeholder groups engaged in State planning.
13 Organizations representing specific student subgroups include organiza-tions representing students with disabilities and organizations representing English learners.
14 States were required to consult with LEAs, teachers, principals, pupil services personnel, administrators, other staff, and parents (U.S. Department of Education, State Plans to Ensure Equitable Access to Excellent Educators: Frequently Asked Questions, 2015, p. 7).

Equitable Access to Excellent Educators 7
that engaged each stakeholder group. Appendix B includes a full list of stakeholders cited in Education Equity Plans.
Several States described their efforts to ensure that stakeholders were representative of all their commu-nities. For example, Connecticut15 took attendance at its three initial stakeholder meetings to assess the diversity of participants. Connecticut then reviewed attendance at its stakeholder meetings, which showed that students, civil rights groups and school principals were not well represented during the face-to-face meetings. As a result, Connecticut held additional meetings with those under-represented stakeholder groups (Connecticut State Department of Education, 2015, p. 10). Oklahoma, which has a large Native American population and many rural districts, made efforts to ensure that representatives of these communities were included in the stakeholder engagement process (Oklahoma State Department of Education, 2015, p. 6). Oklahoma indicated that teachers and other stakeholders in the state expressed appreciation for having a seat at the table to identify gaps and potential strategies alongside other stakeholders. Oklahoma noted that in an atmosphere with multiple perceptions (positive and negative) about the field of teaching, including teachers in the development of the plans helped to recognize them and their specialized professional knowledge and expertise (Oklahoma State Department of Education, 2015, p. 10).
Many States also leveraged established stakeholder groups to discuss their Educator Equity Plans. For example, in Nebraska, members of the ESEA/No Child Left Behind (NCLB) Committee of Practitioners, which the State formed as part of the 2001 NCLB requirements, played an integral role in the State’s plan by identifying root causes and strategies (Nebraska Department of Education, 2015, p. 6).
STAKEHOLDERS’ ROLES IN DEVELOPING EQUITY PLANSStates worked with stakeholders to review data on equity gaps, analyze equity gaps and identify root causes and strategies for eliminating the gaps. The level of stakeholder engagement varied by State. Thirty-eight States reported that stakeholders helped identify possible root causes and strategies for the identified gaps. In five of those States, stakeholders categorized and prioritized root causes into themes and provided insights on proposed strategies. In nine States, stakeholders reviewed draft Educator Equity Plans and offered input for revisions. Some States involved internal stakeholders within the SEA in developing the initial content and drafting the Educator Equity Plans, which a larger group of external stakeholders then reviewed. For example, Minnesota established both a steering committee of stakeholders to design and guide the work of the plan and a stakeholder advisory committee to provide feedback and input on the plan (Minnesota Department of Education, 2015, p. 4).
METHODS OF STAKEHOLDER ENGAGEMENTEach State used a variety of methods to engage stakeholders, including in-person and virtual meetings, focus groups, electronic communication and surveys (see Figure 4). States reported that using multiple methods helped them reach diverse stakeholders. For instance, Michigan conducted a presentation of its Educator Equity Plan at the May 12, 2015, State Board of Education meeting. Michigan also video-streamed all State Board of Education meetings, so stakeholders and the general public, both in-person and virtually, had the opportunity to learn about the plan (Michi-gan Department of Education, 2015, p. 4). Rhode Island facilitated a webinar for school and LEA leaders that included an overview of its Educa-tor Equity Plan process and progress as a way to support those invited stakeholders who could not travel to in-person meetings but still wanted to provide feedback about the Educator Equity Plan (Rhode Island Department of Education, 2015, p. 11).
15 Throughout this report, specific State examples are called out in bold text.

Equitable Access to Excellent Educators 8
Figure 4 Methods of stakeholder engagement (by number of States)
In-person Meetings 48
Electronic Communications 16
Surveys 14
Virtual Meetings or Webinars 14
Focus Groups 7
Source: U.S. Department of Education, Office of Elementary and Secondary Education (2015). State plans to ensure equitable access to excellent educators. Retrieved from http://www2.ed.gov/programs/titleiparta/resources.html
Figure reads: Forty-eight States conducted in-person meetings to inform the development of their Educator Equity Plans.
To ensure broader stakeholder participation in the creation and implementation of their Educator Equity Plans, several States included discussions of their plans in scheduled meetings of established stakeholder groups. By using this approach, Utah, for example, “maximized the limited availability of staff and engaged a large number of interested parties” (Utah State Office of Education, 2015, p. 4).
States also attempted to ensure that the engagement process was accessible to all stakeholders. For example, New Jersey made available options for auxiliary aid and services16 at in-person stakeholder meetings so that all stakeholders, including those with disabilities, would have opportunities to engage in all phases of the strategic planning and interactive discussion process (New Jersey Department of Education, 2015, p. 10). Oregon and Wisconsin ensured that staff members with data analysis
expertise were available during stakeholder meetings to help participants accurately interpret data (Oregon Department of Education, 2015, p. 9; Wisconsin Department of Public Instruction, 2015, p. 5).
Some States described using tools and structured discussion protocols to help facilitate and guide stakeholder conversations about the Educator Equity Plans. States using this strategy reported that structured discussion protocols helped organize the conversation; they ensured the facilitator(s) covered main topics, provided participants multiple opportunities to give feedback and engaged participants in varied interactive activities to support a meaningful learning exchange among adult learners. For instance, Delaware used structured protocols to ensure that all groups present at in-person stakeholder meetings participated, which enabled stakeholders to provide input at each stage of the planning process (Delaware Department of Education, 2015, p. 22). Washington used a stake-holder focus group protocol “to lead stakeholders through a review of the Equity Data Profiles, identify root causes of equity gaps and collaborate on strategies targeted to the root causes. The focus group protocol was designed with simple step-by-step instructions, templates for feedback and a summary document to allow any stakeholder group to facilitate the focus group on their own” (Washington State Board of Education, 2015, p. 20).
In-person MeetingsAlmost all States reported that they held in-person meetings to engage stakeholders for the purpose of identifying equity gaps, conducting a root cause analysis and proposing strategies to eliminate identified equity gaps. States used meetings to propose and discuss components of the Educator Equity Plans. For example, Connecticut used in-person meetings with stakeholders to help identify and prioritize strategies for the State’s Education Equity Plan: “participants brainstormed strategies to address each root cause. Then the Equity Plan Stakeholder Group facilitator led the group in a merger method activity, which allowed similar strategies to merge
16 Auxiliary aid and services are devices or services that enable effective communication. Examples of auxiliary aid and services include computer-generated speech, interpreters, videotext displays, transcription services and closed and open captioning.

Equitable Access to Excellent Educators 9
under a common category. Once the merger method was completed, participants ranked the strategies by importance, feasibility and impact in reducing equity gaps” (Connecticut State Department of Education, 2015, p. 9). States sometimes met separately with select groups of stakeholders—such as human resources directors or stakeholders representing a target group of schools or districts—to gain their unique perspectives on likely causes for and potential strategies to address identified equitable access gaps. For instance, Arizona held meetings with the nine districts it identified in its plan and noted that it obtained valuable information from them on the challenges to ensure equitable access faced by those particular districts (Arizona Department of Education, 2015, p. 10).17
Several States conducted meetings in multiple geographical regions to increase the diversity of participants across the State. For instance, staff from the North Carolina SEA traveled to different regions of the state to ensure that the finished plan considered insights from human resources directors in all parts of the State (North Carolina Department of Public Instruction, 2015, p. 8). The District of Columbia ensured that at least one public meeting occurred in each ward of the city (District of Columbia Office of the State Superintendent of Education, 2015, p. 8). Similarly, Georgia held meetings in each region of the State through its regional education service agencies, which are strategically located throughout the State (Georgia Department of Education, 2015, p. 11). Other States that held meetings in specific geographical areas included Alabama, Arizona, Delaware, Kansas, South Carolina and Vermont.
Virtual MeetingsFourteen States conducted stakeholder meetings virtually via webinars and/or other web-based platforms. These virtual meetings had varying purposes. Most States used these virtual meetings to share their plans and acquire feedback from stakeholders. States often cited using virtual meetings to increase access for participants who could not attend in-person meetings. For example, the District of Columbia and other States used virtual presentations to repeat the same content covered in in-person meetings for those who were unable to attend (District of Columbia Office of the State Superintendent of Education, 2015, p. 9). Similarly, Rhode Island conducted a webinar to allow participants who were not able to travel to the meeting site to participate virtually, and Georgia, Pennsylvania and Vermont recorded their meetings through a webinar platform for later viewing.18 Other States used virtual meetings to follow up after initial in-person meetings; these virtual meetings allowed States to continue collaborating with stakeholders to develop their Educator Equity Plans. As previously mentioned, Michigan live-streamed its presentation at an in-person State Board of Education meeting; Oklahoma and Texas created virtual forums19 for stakeholders to continue to stay engaged; and Illinois sponsored a virtual review for stakeholders to examine a draft of its Educator Equity Plan.20
Focus GroupsSeven States reported that they conducted focus groups to review data on equity gaps and to identify potential root causes and strategies. Some States conducted focus groups with teachers and principals to gain an in-depth view of the challenges and benefits of working in schools identified as “high-need”
17 “ To get a closer view of the distribution of teachers and students across Arizona’s regions, ADE chose nine sample districts that are not only representative of their respective regions but also are districts that have worked closely with ADE in the past and, due to that relationship, are considered likely candidates for successful implementation of suggested strategies” (Arizona Department of Education, 2015, p. 18).
18 For multiple State references of three or more, the citations are included in a footnote: (Rhode Island Department of Education, 2015, p. 11; Georgia Department of Education, 2015, p. 10; Pennsylvania Department of Education 2015, p. 13; Vermont Agency of Education, 2015, p. 5).
19 Although Oklahoma and Texas did not include detailed descriptions of these virtual forums, Oklahoma described the virtual forum as a way for stakeholder groups to engage in the planning process: “The stakeholder groups will continue to stay engaged via the virtual forum. Feedback from this forum will be gathered and shared at TLE [Teacher & Leader Effectiveness] Commission monthly meetings as well as State Board of Education monthly meetings” (Oklahoma State Depart-ment of Education, 2015, p. 29).
20 Multiple State references: (Michigan Department of Education 2015, p. 4; Oklahoma State Department of Education, 2015, p. 9; Texas Education Agency, 2015, p. 5; Illinois State Board of Education, 2015, p. 13).

Equitable Access to Excellent Educators 10
by the State. For example, the District of Columbia conducted focus groups with teachers and leaders in its highest-need schools to discuss the root causes of inequities and to gauge the reasons why teachers remain in the school district or leave (District of Columbia Office of the State Superintendent of Education, 2015, p. 9). The District of Columbia held focus groups with teachers and leaders in the lowest-performing schools that serve the highest rates of high-need populations, which elicited information on potential equity issues related to working conditions (District of Columbia Office of the State Superintendent of Education, 2015, p. 9). In Missouri, the SEA conducted regional focus groups that consisted of stakeholders representing high-poverty schools, high-minority schools and rural areas21 (Missouri Department of Elementary & Secondary Education, 2015, p. 8). In Nebraska, participants in focus groups suggested that teachers should be appropriately endorsed and assigned, and they emphasized that new teachers should be supported through mentoring and professional development opportunities (Nebraska Department of Education, 2015, p. 6).
Electronic CommunicationsSixteen States reported using electronic communi-cations, such as emails, State websites and newsletters, to communicate and/or engage with their stakeholders. For example, Delaware, Kentucky, Utah and Wisconsin used email communication to solicit feedback from their stakeholders.22 Colorado, North Carolina and Puerto Rico communicated electronically23 with stakeholders to elicit information on possible root causes for inequitable access to experienced and effective educators and on possible strategies to decrease these gaps. Michigan created a website for its Educator Equity Plan to both share information and solicit input on the plan. The State used the website to post a draft of its plan for stake-holder feedback, share outcomes from meetings
with stakeholders and encourage feedback and comments, including a survey to garner feedback from stakeholders (Michigan Department of Education, 2015, p. 3). Similarly, Mississippi is using its Department of Education website to obtain feedback from the public and to provide updates on its plan (Mississippi Department of Education, 2015, p. 16).
Other States used electronic communications and platforms to provide ongoing updates to stakeholders on their progress in developing and implementing their plans. Illinois noted that, “in addition to continuing to meet regularly with stakeholders in order to keep them abreast of this work, data will be shared on the State website, through webinars and in the superintendent’s weekly message” (Illinois State Board of Education, 2015, p. 48).
SurveysFourteen States implemented or planned to implement surveys to engage their stakeholders in the development and refinement of their plans. For example, Louisiana surveyed teachers to obtain information on teacher recruitment, certification and preparation; it also surveyed LEA human resources staff to glean more insights on barriers to hiring certified and qualified staff (Louisiana Department of Education, 2015, p. 4). Ohio administered several surveys to its external stakeholders24 to obtain their feedback on many aspects of the plan, including definition of key terms and measures to include in the plan (Ohio Department of Education, 2015, p. 7). Oklahoma used interview data from teachers and administrators to develop surveys to identify the most frequent challenges faced by educators in closing the achievement gap. Oklahoma interviewed teachers and administrators working in a wide variety of settings to include schools with a high concentration of low-income and minority students; rural schools; urban schools; and elementary, middle and high
21 The Missouri focus groups were conducted regionally; however, that State’s plan did not clarify whether each focus group included representatives from high-pover-ty schools, high-minority schools and rural areas from each region or if the regional focus groups were separate focus groups for each of those stakeholder groups.
22 Multiple State references: (Delaware Department of Education, 2015, p. 23; Kentucky Department of Education, 2015, p. 52; Utah State Office of Education, 2015, p. 3; Wisconsin Department of Public Instruction, 2015, p. 5).
23 Although these States indicated using electronic communications as a method to collect stakeholder input, they did not specify how they did so.
24 For a complete list of Ohio’s external stakeholder groups, please reference Appendix B of Ohio’s 2015 Educator Equity Plan: http://www2.ed.gov/programs/titleiparta/equitable/ohequityplan060115.pdf.

Equitable Access to Excellent Educators 11
schools. “OSDE is interested in how factors such as professional development or school environment support—or fail to support—success and persistence in diverse classrooms. OSDE is also interested in understanding what its staff can do to better support and improve teacher experiences, satisfaction and persistence towards the ultimate goal of closing equity gaps and improving overall student success” (Oklahoma State Department of Education, 2015, p. 19). Illinois surveyed its IHEs to obtain data on their institutional partnerships with high-poverty and high-minority districts. The data gathered focused on the duration of the student teaching experience and the responsibilities candidates took on while in placement (Illinois State Board of Education, 2015, p. 4).
Some States used surveys to solicit input from stakeholders who may not have participated in in-person meetings. For example, Texas administered a questionnaire to stakeholders unable to attend meetings, so the State could frame subsequent meeting discussions and share their thoughts. In its Educator Equity Plan, Texas noted, “Prior to the initial meeting of Texas’ Policy Stakeholder Group,25 a questionnaire was sent to all invited stakeholders requesting their thoughts and opinions on a variety of questions26 related to equitable access to excellent educators. The questionnaire provided policy stakeholders with an opportunity to communicate in writing their perspective on teacher equity challenges currently facing Texas and served as a mechanism to capture input from those stakeholders unable to attend” (Texas Education Agency, 2015, p. 5). Similarly, Puerto Rico used a survey to enable a broader range of stakeholders27 to provide input to inform the State’s plan based on “their perceptions and opinions on what constitutes an excellent teacher, strategies and activities needed to guarantee equitable access to excellent teachers for all students, and suggestions on how to keep all stakeholders and the public informed on the progress of the Equity plan” (Puerto Rico Department of Education, 2015, p. 13).
EXAMPLES OF STAKEHOLDER FEEDBACK USED TO REFINE THE EQUITY PLANStates reported using input from stakeholders to inform the initial development of their plans and to refine their plans prior to submitting to ED. States varied in the ways in which they used stakeholder feedback in developing and refining their plans (see Figure 5). For example, following the advice of stakeholders, Kentucky added teacher retention as an additional equity measure and Oklahoma added data for English learners and students with disabilities to inform additional gap analyses for these student groups (Kentucky Department of Education, 2015, p. 4; Oklahoma State Department of Education, 2015, p. 7). In Connecticut, stakeholders requested that the State conduct additional analyses on teacher experience
Figure 5 Specific types of engagement activities conducted with stake-holders (by number of States)
Identified possible causes and strategies for
the identified gaps48
Shared data with stakeholders 41
Reviewed draft equity plans and offered
input for revision27
Categorized and prioritized root causes into themes
and provided insights on proposed strategies
18
Source: U.S. Department of Education, Office of Elementary and Secondary Education (2015). State plans to ensure equitable access to excellent educators. Retrieved from http://www2.ed.gov/programs/titleiparta/resources.html
Figure reads: Forty-eight States engaged stakeholders to identify possible root causes and strategies for the identified gaps.
25 Texas’ Policy Stakeholder Group is a consortium of state-level organizations representing the policy interests and concerns of teachers, campus and district adminis-trators, school board members, parents, school personnel administrators, small and rural community schools, counselors and civil rights advocacy groups.
26 Texas did not provide additional details on the specific questions included in the questionnaire.
27 “Stakeholders include teachers, school directors, paraprofessionals, parents, students, academic facilitators, district superintendents, teacher preparation programs, librarians, technology specialists, community and professional organizations. In addition, PRDE’s central-level office representatives for special education, limited Spanish proficiency, immigrants, human resources and program directors also were part of the participants completing the survey” (Puerto Rico Department of Education, 2015, p.13).

Equitable Access to Excellent Educators 12
and retention to inform further input on root causes of identified gaps. After examining the additional data, stakeholders ranked strategies to address each root cause by importance, feasibility and effect on reducing equity gaps (Connecticut State Department of Education, 2015, p. 7).
DEFINITION OF KEY TERMS
Defining Equitable Access to Excellent EducatorsTo analyze whether “inexperienced teachers,” “unqualified teachers,” and “out-of-field teachers” serve “low-income students” and “minority students” at disproportionate rates, ED required States to define each of these key terms used in the statute and specify the data they used to calculate potential gaps in equitable access. States identified and defined key terms for analysis to show the gaps that students face in equitable access to excellent educators across multiple dimensions. States then used the selected terms to calculate potential equity gaps and review and assess the severity of the equity gaps identified. In addition to these five required terms, some States also chose to define and use other key terms in their analyses of equity gaps to examine equitable access to excellent educators across additional variables; some States added additional teacher-focused terms, such as “effective teachers,” while others defined additional student- focused terms, such as “English learners.” Other States included school-focused terms, such as “rural school” or “high-/low-achieving school.”
This section provides a brief summary of common-alities and differences of States’ definitions of the five required terms as well as one additional term, “educator effectiveness,” which was the additional term most often defined by States in their Educator Equity Plans. State definitions of this additional term are notable because States will be required, consistent with section 1111(g)(1)(B) of ESEA as amended by ESSA, to ensure that low-income and minority students are not taught at greater rates than other students by “ineffective, out-of-field, or inexperienced teachers.” 28
Key TermsAlmost all States defined “inexperienced teachers” based on the number of years spent teaching, but differed on the specific number of years defined (see Figure 6). A few States chose to define “inexperienced teachers” using certification levels, rather than years teaching.
• Twenty-five States identified “inexperienced teachers” as those whose teaching experience totaled 1 year or fewer.
• Six States identified “inexperienced teachers” as having 2 or fewer years of teaching experience.
• Sixteen States identified “inexperienced teachers” as having 3 or fewer years of teaching experience.
• Connecticut and Florida29 identified “inexperienced teachers” as having 4 or fewer years of teaching experience, and Washington defined inexperienced teachers as having 5 or fewer years of teaching experience.
• Alabama defined “inexperienced teachers” as teachers “holding a valid Emergency Certificate, Alternative Baccalaureate-Level Certificate, Career and Technical Alternative Baccalaureate-Level Certificate, or a Special Alternative Certificate” (Alabama State Department of Education, 2015, p. 14).
• New Mexico defined “inexperienced teachers” as “Beginning teachers in the State, as articulated by teachers in the classroom with a Level I teacher license” (New Mexico Public Education Department, 2015, p. 10).
• Delaware examined data for the rates of first-year teachers and rates of early career teachers, using those as proxies for “inexperienced teachers” and noted that “Most teachers improve considerably during their first year of practice. The prevalence of first-year teachers is one indicator of equity…Generally, teachers continue to increase in their effectiveness for at least the first few years in the classroom” (Delaware Department of Education, 2015, p. 8).
28 This analysis includes a profile of each State’s Educator Equity Plan; a full listing of the additional terms that States defined and used to inform identification of their equity gaps is described in the Equity Gaps section of the State profile. In addition, Appendix I captures the top additional key terms (student, teacher and other terms) that States defined beyond the five required terms.
29 Whereas specific States are identified in bold text throughout other sections of this report to illustrate examples from Education Equity Plans, specific States are not bolded in this section as it contains a summary of definitions of terms across all States.

Equitable Access to Excellent Educators 13
Figure 6 State definitions of “inexperienced teachers” (by number of States)
1 year or less 25
2 years or less 6
3 years or less 16
4 years or less 2
2
5 years or less 1
Other requirements
Source: U.S. Department of Education, Office of Elementary and Secondary Education (2015). State plans to ensure equitable access to excellent educators. Retrieved from http://www2.ed.gov/programs/titleiparta/resources.html
Figure reads: Twenty-five States identified “inexperienced teacher” as those whose teaching experience totaled 1 year or less.
Most States identified teachers as unqualified if they did not hold the proper certification30 or endorsements to teach their assigned subject, or if the teachers did not meet requirements for Highly Qualified Teacher (HQT) status31 (see Figure 7). Fifteen States defined unqualified teachers as not meeting the HQT requirements specified in NCLB. Thirty-six States defined unqualified teachers as not having the certification or endorsement to teach in a core academic or subject area. Only one State, the District of Columbia, used neither certification nor HQT in its definition, instead defining “unqual-ified” teachers as those rated in the lowest tier of an approved teacher evaluation system.
Figure 7 State definitions of “unqualified teachers” (by number of States)
HQT definition 15
State certification requirements 36
Other requirements 1
Source: U.S. Department of Education, Office of Elementary and Secondary Education (2015). State plans to ensure equitable access to excellent educators. Retrieved from http://www2.ed.gov/programs/titleiparta/resources.html
Figure reads: Fifteen States defined “unqualified teacher” as not meeting the highly qualified teacher requirements specified in NCLB.
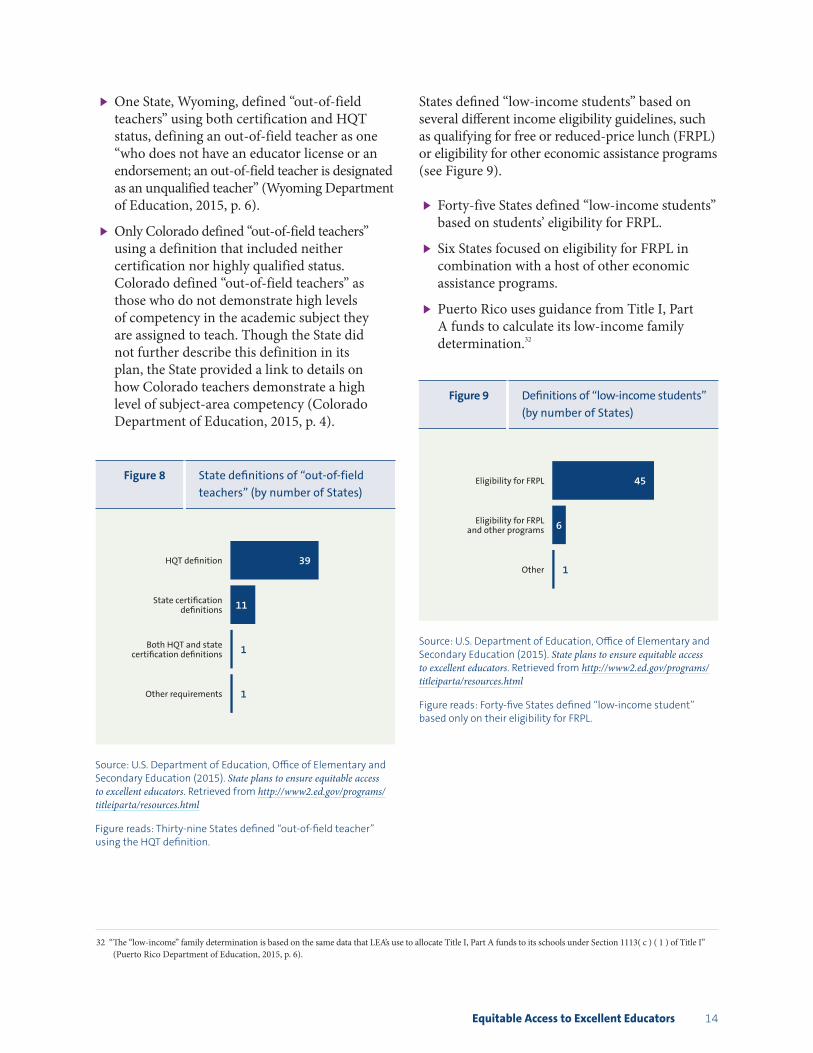
Many States’ definitions for “out-of-field teachers” included similar elements as those for unqualified teachers (see Figure 8). Both definitions tended to emphasize teachers’ certifications or endorsements and HQT status. As with States’ “unqualified teachers” definitions, some States’ definitions for “out-of-field teachers” included teachers with emergency or conditional certification. In some cases, States reported they did not have an official way to track “out of field,” and so used these definitions as proxies:
• Thirty-nine States defined “out-of-field teachers” as those who do not hold a valid certificate or are not properly endorsed to teach in their content areas or grade levels. Teachers classified as out of field under this definition may hold a valid certificate, but are teaching outside their area of certification in at least one subject.
• Eleven States defined “out-of-field teachers” as those who are not highly qualified in the content area in which they teach.
30 States vary in the terms they use to refer to the process of obtaining a teaching credential. Some States use the term “licensure,” some use the term “certification,” and others use “certification/licensure” or use the two interchangeably. Unless the term is in quoted material, this report uses the term “certification.”
31 As required by the ESEA, as amended by NCLB, to be deemed highly qualified, teachers must have: (1) a bachelor’s degree, (2) full state certification and (3) prove that they know each subject they teach (No Child Left Behind Act of 2001, P.L. 107-110, 115, 1959 Stat. (2002).
Equitable Access to Excellent Educators 14
• One State, Wyoming, defined “out-of-field teachers” using both certification and HQT status, defining an out-of-field teacher as one “who does not have an educator license or an endorsement; an out-of-field teacher is designated as an unqualified teacher” (Wyoming Department of Education, 2015, p. 6).
• Only Colorado defined “out-of-field teachers” using a definition that included neither certification nor highly qualified status. Colorado defined “out-of-field teachers” as those who do not demonstrate high levels of competency in the academic subject they are assigned to teach. Though the State did not further describe this definition in its plan, the State provided a link to details on how Colorado teachers demonstrate a high level of subject-area competency (Colorado Department of Education, 2015, p. 4).
Figure 8 State definitions of “out-of-field teachers” (by number of States)
HQT definition 39
State certification definitions 11
Both HQT and state certification definitions 1
Other requirements 1
Source: U.S. Department of Education, Office of Elementary and Secondary Education (2015). State plans to ensure equitable access to excellent educators. Retrieved from http://www2.ed.gov/programs/titleiparta/resources.html
Figure reads: Thirty-nine States defined “out-of-field teacher” using the HQT definition.
States defined “low-income students” based on several different income eligibility guidelines, such as qualifying for free or reduced-price lunch (FRPL) or eligibility for other economic assistance programs (see Figure 9).
• Forty-five States defined “low-income students” based on students’ eligibility for FRPL.
• Six States focused on eligibility for FRPL in combination with a host of other economic assistance programs.
• Puerto Rico uses guidance from Title I, Part A funds to calculate its low-income family determination.32
Figure 9 Definitions of “low-income students” (by number of States)
Eligibility for FRPL 45
Eligibility for FRPLand other programs 6
Other 1
Source: U.S. Department of Education, Office of Elementary and Secondary Education (2015). State plans to ensure equitable access to excellent educators. Retrieved from http://www2.ed.gov/programs/titleiparta/resources.html
Figure reads: Forty-five States defined “low-income student” based only on their eligibility for FRPL.
32 “ The “low-income” family determination is based on the same data that LEA’s use to allocate Title I, Part A funds to its schools under Section 1113( c ) ( 1 ) of Title I” (Puerto Rico Department of Education, 2015, p. 6).

Equitable Access to Excellent Educators 15
Almost all States defined “minority students” based on students’ self-identified racial and/or ethnic backgrounds (see Figure 10).
• Twenty-four States defined “minority students” as those not identifying as Caucasian.
• Twenty-three States defined “minority students” as students in a racial or ethnic group identified as a racial or ethnic minority in the State.33
• New Mexico defined “minority students” as those not identifying as either Caucasian or Asian.
• South Dakota chose to focus solely on Native American students as a minority group because these students are the largest minority group in the State.
• Tennessee focused on Black, Hispanic and Native American students as minority groups, because “these racial subgroups comprise the minority group because they are the subgroups currently performing below the state average” (Tennessee Department of Education, 2015, p. 12).
• Pennsylvania broadened its definition of “minority students” to include disability, gender and/or country of origin.
• Puerto Rico also broadened its definition of “minority students” to include students with disabilities and students with limited Spanish proficiency.
In addition to the required statutory terms, States were also permitted to define additional terms for the purpose of identifying equity gaps. The most common additional terms defined were related to educator effectiveness and educator excellence. This section provides a brief summary of commonalities and differences of States’ definitions of educator effectiveness because States will be required, under section 1111(g)(1)(B) of ESEA as amended by ESSA, to ensure that low-income and minority students are not taught at greater rates than other students by “ineffective, out-of-field, or inexperienced teachers.”
Figure 10 Definitions of “minority students” (by number of States)
Non-Caucasian 24
Native American
23
Non-Caucasian/Asian
Includes other subgroups
Racial or ethnic minority
1
1
2
Based on student performance 1
Source: U.S. Department of Education, Office of Elementary and Secondary Education (2015). State Plans to Ensure Equitable Access to Excellent Educators. Retrieved from http://www2.ed.gov/programs/titleiparta/resources.html
Figure reads: Twenty-four States defined “minority student” as those not identifying as Caucasian.
Twenty States chose to define “excellent educators” in their Educator Equity Plans, and of those, 12 also defined “excellent school leaders” (see Appendix I). Sixteen states chose to define “educator effectiveness” in their Educator Equity Plans by defining criteria for an “effective rating,” a “highly effective rating,” or both. Below are some examples of the variety of ways States defined “educator effectiveness”:
• Thirteen States defined “effective educators” as those receiving a summative educator evaluation rating of effective or higher in the State’s educator evaluation system.
• New York defined “effective educators” specifically as those who receive a rating of effective or higher on the student growth component of the educator evaluation system.
33 States did not necessarily specify which racial or ethnic groups are considered minority groups in their States. For example, Rhode Island defined minority students as “students identified as a member of a minority race or ethnicity” (Rhode Island Department of Education, 2015, p. 13).

Equitable Access to Excellent Educators 16
• New Hampshire defined “effective teachers” as “teachers that focus relentlessly on the achievements of their learners and are also deeply committed to the success of all learners” (New Hampshire Department of Education, 2015, p. 9).
Nine States used these definitions to perform additional analyses of gaps in equitable access to effective educators. Four of these States, Flori-da, Indiana, New Mexico and Tennessee, after conducting their gap analyses, decided to focus their entire plans around addressing gaps in teacher effectiveness. The definitions of effectiveness used by those four States are included in Table 1.
Although the four states in the table below also conducted their analysis using the required terms, they chose to focus their plans only on equity gaps in access to effective teachers.
Table 1 Definitions of educator effectiveness in Educator Equity Plans that focused on effectiveness equity gaps
FLORIDA
High-Impact Teacher: A highly effective teacher whose effect on student learning is positive when the statistical standard error is taken into account. Also defined as “high value-added” or “highly effective.” For the purpose of this plan, high impact is the allowable substitution for highly qualified (Florida Department of Education, 2015, p. 25).
INDIANA
Excellent Educator: A teacher who receives a summative effectiveness rating of highly effective or effective. Indiana began implementing annual staff performance evaluations for all certificated employees during the 2012–13 school year. Indiana will begin its fourth year of implementation during the 2015–16 school year, giving all certificated employees an evaluation as required in IC 20-28-11.5 with a final summative rating of highly effective, effective, needs improvement, or ineffective. Each year, the IDOE displays on its website the ratings of all certificated employees by school, LEA, years of experience and teacher preparation program. This transparent communication of effectiveness ratings has allowed rich discussion around the definition of an excellent educator. Through the rigorous requirements of IC 20-28-11.5, which uses student growth and achievement to significantly inform final summative ratings, we believe educators rated as highly effective or effective are excellent (Indiana Department of Education, Division of Educator Effectiveness, 2015, p. 9).
NEW MEXICO
Effective Teachers: Teachers with summative evaluation ratings of effective, highly effective, or exemplary (New Mexico Public Education Department, 2015, p. 10).
TENNESSEE
Highly Effective Teachers: Teachers who achieve a level four or five rating on the Tennessee Value-Added Assessment System (Tennessee Department of Education, 2015, p. 2).
Equity GapsStates calculated equity gaps for all required terms and for any additional terms they chose to define. Once States identified gaps, they identified likely causes for those identified gaps. Although States examined likely causes for all identified gaps, they could prioritize certain gaps within their plan and elect to concentrate on implementing strategies tied to their largest, most significant gaps, provided those strategies addressed the identified needs of both low-income and minority students.

Equitable Access to Excellent Educators 17
If States explicitly stated that they were concentrating on gaps tied to their largest and most significant gaps, those gaps, for the purposes of this report, are considered “selected gaps.” Twenty-three States decided to concentrate their selected strategies on correcting a subset of their identified gaps, and four of the 23 decided to focus only on gaps related to educator effectiveness (see Table 1). The other 29 States did not elect to concentrate on particular gaps, but instead identified strategies for all identified gaps.
Metrics That States Used to Identify Equity GapsStates used their most recently available data to identify equity gaps. States primarily relied on State data sources to conduct their analyses to identify equity gaps. States also had access to additional data sources, including the Educator Equity Profiles published by ED and the ED-provided accompanying State data file, which include data from the Civil Rights Data Collection (CRDC), “the district level per-pupil expenditures the SEA has submitted to the National Center for Education Statistics (NCES),” and HQT data from EDFacts (U.S. Department of Education, State Plans to Ensure Equitable Access to Excellent Educators: Frequently Asked Questions, 2015, p. 11). Appendix D provides information about the data sources States used to identify and calculate their equity gaps.
In addition to these ED-provided common data sources, States analyzed a variety of additional data sources to identify and calculate their equity gaps, often combining data from multiple data systems for their analysis. States reported using a combination of State, local and Federal data sources to identify educators’ certification status, HQT status, experience level and retention rates. For instance, California, Kansas, Kentucky, Nevada, Ohio, Pennsylvania and South Dakota used their longitudinal data systems, referencing such data as teacher and principal turnover rates, as a source of data for their Educator Equity Plans.34 Some States, such as the District of Columbia, also used data from their educator evaluation systems, such as “data to
identify the gap between the percentages of highly effective teachers serving low-income schools compared to other schools” to calculate their equity gaps (District of Columbia Office of State Superintendent of Education, 2015, p. 16). Figure 11 highlights the types of data sources States used in developing their plans and identifying equity gaps.
Figure 11 Metrics States used to identify equity gaps
Data sourcesidentifying students
with disabilities15
13
7
5
Data sources identifyinghigh-quality teacher status
9
9
Data sources identifyingEnglish learners
Data sources identifying educator licensure and cerfitication status for
districts or schools
Data sourcesidentifying educators’
years of experience
Data sources identifyingretention rates
Source: U.S. Department of Education, Office of Elementary and Secondary Education (2015). State plans to ensure equitable access to excellent educators. Retrieved from http://www2.ed.gov/programs/titleiparta/resources.html
Figure reads: Fifteen states used data sources to identify students with disabilities.
Summary of Equity GapsThis section summarizes the gaps States identified between how often low- and high-poverty and minority and nonminority students are taught by inexperienced, unqualified and out-of-field teachers (see Figure 12). As indicated in Figure 12, more States identified equity gaps affecting low-income
34 Multiple State references: (California State Department of Education, 2015, p. 9; Kansas State Department of Education, 2015, p. 4; Kentucky Department of Education, 2015, p. 14; Nevada Department of Education, 2015, p. 17; Ohio Department of Education, 2015, p. 11; Pennsylvania Department of Education, 2015, p. 22; South Dakota Department of Education, 2015, p.1).

Equitable Access to Excellent Educators 18
students than they did gaps affecting minority students, based on the State definitions of these terms. Some States also examined gaps in how additional student populations are served, or further analyzed gaps by district or in relation to students being served by effective administrators or support staff. This analysis describes the gaps in equitable access for both low-income and minority students, as well as these additional gaps identified by States in their analyses.
Although States conducted a gap analysis for all required terms, as well as for any additional terms the States chose to include, some States chose to concentrate only on implementing strategies tied
to their largest, most substantial gaps for the purpose of their Educator Equity Plan. Twenty-three States chose to focus only on selected gaps, while 29 States focused on all identified equity gaps. This analysis examines only the selected gaps for States that identified them; for States that did not select specific gaps, this analysis includes all of their identified equity gaps.
Figure 12 Identified gaps in the rates at which low-income and minority students are taught by inexperienced, out- of-field and unqualified teachers (by number of States)
Low-income studentstaught at higher rates
by inexperienced teachers38
33
Minority studentstaught at higher rates
by unqualified teachers
26
15
25
14
Minority studentstaught at higher rates
by inexperienced teachers
Low-income studentstaught at higher rates
by out-of-field teachers
Low-income studentstaught at higher rates
by unqualified teachers
Minority studentstaught at higher rates
by out-of-field teachers
Source: U.S. Department of Education, Office of Elementary and Secondary Education (2015). State plans to ensure equitable access to excellent educators. Retrieved from http://www2.ed.gov/programs/titleiparta/resources.html
Figure reads: Thirty-eight States identified equity gaps affecting low-income students who are taught at higher rates by inexperienced teachers.
Inequitable Access to Experienced TeachersForty States identified equity gaps resulting from inequitable access to experienced teachers for low-income and/or minority students. In 38 of those States, inexperienced teachers are more likely to teach low-income than higher-income students; in 33 States, inexperienced teachers are more likely than experienced teachers to teach minority stu-dents (see Figure 12).
Inequitable Access to Qualified TeachersTwenty-nine States identified gaps in the rates at which unqualified teachers teach low-income and/or minority students. In 26 of those States, unqualified teachers are more likely to teach high-poverty than low-poverty students; in 25 States, unqualified teachers are more likely to teach minority than nonminority students (see Figure 12). Two States simply identified access to qualified teachers as an equity gap without specifying whether the unqualified teachers are more likely to be found in schools serving low-income or minority students.
Inequitable Access to Teachers Teaching Out of FieldSixteen States identified equity gaps in the rates at which out-of-field teachers teach low-income and/or minority students. In 15 of those States, out-of-field teachers are more likely to teach high-poverty than low-poverty students; in 14 States, out-of-field teachers are more likely to teach minority than non minority students (see Figure 12).
As indicated in Figure 12, more States identified equity gaps affecting low-income students than they did gaps affecting minority students, based on the State definitions of these terms.

Equitable Access to Excellent Educators 19
Equity Gaps by Other Teacher VariablesSome States included additional teacher variables in their analysis of equity gaps, such as teacher turnover or attrition. Of these, nine States identified higher rates of teacher attrition in both high-minority and high-poverty schools.
Inequitable Access to Effective Administrators and Support StaffIn addition to identifying equity gaps pertaining to access to effective teachers, five States also focused on access to effective administrators. Rhode Island also focused on gaps in access to school support staff for students in high-poverty and high-minority schools (Rhode Island Department of Education, 2015, p. 1).
Equity Gaps by Student SubpopulationThirty-one States also identified gaps in the rates at which inexperienced and unqualified teachers serve students from relevant student groups other than low-income and minority students. Additional student groups examined in States’ analysis include students with limited English proficiency, students with special needs and/or disabilities, students in charter schools and students in rural schools. Puerto Rico focused on students with limited Spanish proficiency instead of students with limited English proficiency (Puerto Rico Department of Education, 2015, p. 6).
Equity Gaps by DistrictSix States focused their plans on a subset of districts due to the disproportionate rate of equity gaps experienced by those districts as compared to the rest of the State. For instance, Connecticut elected to focus on eight districts because they have higher than normal rates of teacher turnover and thus more inexperienced teachers (Connecticut State Department of Education, 2015, p. 23). New Jersey identified a subset of districts on which to focus because these districts had the highest rates of out-of-field teachers in the State (New Jersey Department of Education, 2015, p. 28). Mississippi and Wisconsin targeted specific districts because these districts account for the majority of the State’s equity gaps (Mississippi Department of Education, 2015, p. 21 and Wisconsin Department of Public Instruction, 2015, p. 16). Alaska also identified specific school districts that had the highest percentages of low- income and minority students as the focus of their Educator Equity Plans (Alaska Department of Education and Early Development, 2015, p. 19).

Equitable Access to Excellent Educators 20
2 Analysis of Root Causes
Once States identified equity gaps, they documented “the likely causes of the identified equity gaps” (U.S. Department of Education, State Plans to Ensure Equitable Access to Excellent Educators: Frequently Asked Questions, 2015, p. 7). To identify likely causes, States conducted root-cause analyses for the identified equity gaps and described the results of these analyses in their Educator Equity Plans. Often, States identified similar root causes for multiple identified gaps and, as a result, did not always establish a direct link between specific gaps and the root causes they identified. As a result, this analysis does not specify for which gaps the root causes were specifically identified.
SUMMARY OF ROOT CAUSES BY TOPIC AREAStates identified a multitude of root causes that may be driving equity gaps. Most of these likely causes were related to conditions, or challenges particular to working in high-need schools or communities (including working conditions, perceptions of teaching and geographic staffing challenges); insufficient educator preparation (how teachers are prepared before they enter the classroom and how they are supported while in the classroom to meet student needs); and ineffective human capital management systems (how schools and districts recruit, support, compensate and
Figure 13 Root causes States most frequently identified, by topic area (by number of States)
Adverse working conditions
Inadequate educator preparation
Insufficient educator support and professional
development
20 35 35
17
17 17
1716
15
14 19
Negative perceptionof teaching
Inadequate compensation/
incentives
Hard-to-staff geographic areas
Insufficient teacher pipeline
Ineffective recruitment and/or retention
strategies
Ineffective school leadership
Conditions Insufficient Educator Preparation Human Capital Management Systems
Ineffective inductionand mentoring
High teacher turnover
Source: U.S. Department of Education, Office of Elementary and Secondary Education (2015). State plans to ensure equitable access to excellent educators. Retrieved from http://www2.ed.gov/programs/titleiparta/resources.html
Figure reads: Twenty States identified root causes related to “adverse working conditions.”

Equitable Access to Excellent Educators 21
retain teachers). The root causes of equity gaps described in States’ Educator Equity Plans generally fell into 11 common topic areas (see Figure 13) within the three broad categories of conditions, educator preparation and human capital management systems. This section provides brief descriptors of the 11 topic areas and presents an analysis of the root causes that fall within each topic area. This section organizes the analysis by presenting the topic areas that fall under the conditions category, followed by the topic areas related to the educator preparation category, and finally, the topic areas in the human capital management system category. Appendix A provides additional information and definitions of each topic area. Appendix F indicates which States identified root causes in each topic area.
Topic Areas Related to Conditions
Adverse Working Conditions
Definition:
Conditions in schools not conducive to teachers to provide quality instruction to students and for students to experience optimal learning that leads to student achievement..
Twenty States identified adverse working conditions such as negative school climate and culture (see Figure 13) as a root cause of equity gaps. States further identified the challenging work environment in high-need schools (such as issues with student behavior, school safety and lack of parental involve-ment) as contributors to adverse working conditions and to equity gaps. For example, Connecticut mentioned that “Needs related to poverty (e.g., homelessness, chronic health issues, absenteeism) are more prevalent among students attending high-poverty, high-minority schools” and explained that poverty-related issues, such as student home-lessness, present persistent challenges for schools attempting to serve these students that can produce stressful working environments for teachers and principals and can lead to burnout (Connecticut State Department of Education, 2015, p. 25). Delaware mentioned adverse working conditions such as “dilapidated buildings” and schools that “lack state-of-the-art technology” as factors leading to equity gaps (Delaware Department of Education, 2015, p. 30).
Hard-to-Staff Geographic Areas
Definition:
Regions in States that have difficulty recruiting and retaining teachers.
Seventeen States identified a reduced ability to recruit and retain teachers in hard-to-staff geographic areas as a likely cause for gaps in the rates at which inexperienced, unqualified and out-of-field teachers teach low-income and/or minority students (see Figure 13). These States noted that recruitment and retention can be difficult in high-poverty and high-minority schools that are located in remote and rural areas or that are located in areas perceived to be unsafe. Many States noted that rural areas often lack the amenities, housing and resources to attract and retain teachers. For example, Alaska noted that the turnover rates in its remote, rural communities are among the highest in the nation and that “conditions in remote rural Alaska include shortage of adequate housing, high living costs, isolation, difficulties and cost of travel and limited access to medical care” (Alaska Department of Education and Early Development, 2015, p. 20).
Hard-to-staff geographic areas may also face specific challenges in attracting experienced, qualified teachers in certain hard-to-staff fields and subjects. As a result, schools in these geographic locations may not only have higher rates of inexperienced, unqualified teachers, but higher rates of teachers teaching out-of-field as well.
Ineffective Induction and Mentoring Strategies
Definition:
Lack of support of new and inexperienced teachers during their first years of teaching.
Twenty-one States identified ineffective induction, mentoring and/or retention strategies as a cause of equity gaps (see Figure 13). Many States noted that a lack of strong support and mentoring programs leads to increased teacher turnover among younger, less experienced teachers. States noted a dearth of effective induction and mentoring support to teachers in high-need schools. For example, Delaware noted

Equitable Access to Excellent Educators 22
that there is a lack of strategic pairing35 between mentor and mentees in its mentorship program, which could help mentees become more effective teachers and feel supported by more senior colleagues (Delaware Department of Education, 2015, p. 29).
Ineffective School Leadership
Definition:
School leaders who do not provide adequate leadership and support of school-based staff; this can include the lack of instructional, administrative or distributive leadership practices.
Fifteen States identified ineffective school leader-ship as a root cause of gaps in the rates at which inexperienced and unqualified teachers teach low-income and/or minority students (see Figure 13). These States noted that school leaders are often not provided with adequate support and leadership training, and they lack the capacity, resources and time to effectively lead and manage their schools. Further, States noted that ineffective school leadership in high-need schools negatively affects the school culture and teachers’ morale. Similar to other root causes identified, a negative school culture or low teacher morale may contribute to high turnover, thus leading to disproportionate rates of inexperienced and unqualified teachers in schools serving low-income and minority students.
Negative Perception of Teaching
Definition:
Unfavorable perception of the teaching profession in the school and community.
Sixteen States identified a negative perception of teaching in high-need schools as a root cause for equity gaps (see Figure 13). States posited that such
negative perceptions are a result of negative media coverage and of Federal and State policies on high-stakes testing, which may place high-need schools and students in an unfavorable light. Delaware, Michigan, Mississippi and Pennsylvania noted the negative perceptions of certain schools are a deterrent in attracting high-quality candidates to those schools.36 Pennsylvania stated that marketing and communication strategies in Philadelphia do not portray positive images of high-need schools (Pennsylvania Department of Education, 2015, p. 55). Several States focused on negative perceptions of high-need schools, yet it is important to note that some States also indicated that, generally speaking, the field of teaching is not as attractive as it once was—not only in high-need schools. A broadly cited negative perception of teaching, paired with a negative perception of teaching in high-need schools specifically, may contribute to high turn-over and overreliance on new teachers, unqualified teachers, or teachers teaching out-of-field—especially in schools serving low-income and minority students.
Topic Areas Related to Educator Preparation
Inadequate Educator Preparation
Definition:
Educator preparation that does not adequately prepare educators to successfully meet the demands of their current school assignment and roles.
As identified in Section I, inexperienced teachers in 40 States are disproportionately serving low-in-come and minority students. Thirty-five States identified inadequate educator preparation to meet student and school needs as a root cause of iden-tified equity gaps (see Figure 13). Without strong educator preparation that provides prospective teachers with content knowledge, strategies and clinical experiences for overcoming the unique challenges of teaching in high-need schools, novice
35 Delaware did not provide more detail about “strategic pairing” in its Educator Equity Plan.
36 Multiple State references: (Delaware Department of Education 2015, p. 30; Michigan Department of Education, 2015, pp. 35-36; Mississippi Department of Education, 2015, p. 24; Pennsylvania Department of Education, 2015, p. 58).

Equitable Access to Excellent Educators 23
teachers are less likely to have the practiced experience to successfully meet students’ needs. For example, States determined that teacher candidates were often not adequately prepared to teach effectively in high-need schools.37 States indicated that teacher candidates often lacked exposure to high-need schools in their training and preparation and did not have experience handling the realities and challenges of teaching in these schools. States also noted that novice teachers may not have sufficient knowledge or experience applying pedagogy, content and procedures. In addition to focusing on teachers, six States also identified inadequately prepared principals as a root cause for gaps. For example, Maine noted that “many principals are not adequately prepared for the demands of high-poverty, isolated small and high-risk schools settings” (Maine Department of Education, 2015, p. 23).
Insufficient Teacher Pipeline
Definition:
Teacher supply insufficient to fill vacancies in schools and districts; pipeline not producing enough teachers in specific content areas to meet needs.
Fourteen States identified inadequate teacher supply as a source of gaps in the rates at which inexperienced and unqualified teachers teach low-income and/or minority students (see Figure 13). Many States noted insufficient numbers of teacher candidates in preparation programs to meet specific vacancies in schools, especially in high-need schools. States noted that the problem is not that teacher preparation programs prepare insufficient numbers of teachers in the aggregate, but that they prepare insufficient numbers in subject areas or grade levels where need is greatest and who are also willing to teach in high-need settings. For example, Hawaii noted “the need to increase the pool of applicants that are qualified and prepared for the unique situations that exist in remote locations in the State” (Hawaii Department of Education, 2015, p. 38).
Topic Areas Related to Human Capital Management Systems
Inadequate Compensation/Incentives
Definition:
Insufficient monetary and nonmonetary incentives to attract and retain teachers.
Seventeen States identified inadequate compensation/ incentives as a root cause for equity gaps (see Figure 13). Many States noted that teachers are not sufficiently compensated for teaching in high- minority and high-poverty schools; such schools often lack incentives or differential pay that might be useful in attracting teachers to them. Further, low teacher salaries made it hard to attract strong candidates who could find more competitive compensation in other industries.
Inadequate compensation/incentives are likely root causes for gaps in the rates at which inexperienced and unqualified teachers teach low-income and/or minority students. As noted previously, schools serving low-income and minority students are disproportionately served by inexperienced teachers in 40 states and are disproportionately taught by unqualified teachers in 29 states. Without incentives or sufficient compensation, schools serving low- income and minority students struggle to attract experienced, qualified teachers.
High Teacher Turnover
Definition:
High rates of teachers who leave high-poverty or high-minority schools or districts annually, often leaving hard-to-staff vacancies to be filled.
States reported that high rates of teacher turnover in high-need schools often result in higher rates of inexperienced, unqualified, or out-of-field teachers
37 This report uses the term “high-need schools” to refer to schools serving high proportions of low-income and minority students. In addition, this report uses the terms “low-income schools” and “high-poverty schools” to refer to schools serving high proportions of low-income students and “high-minority schools” to refer to schools serving large proportions of minorities.

Equitable Access to Excellent Educators 24
in those schools. Seventeen States identified high teacher turnover in high-poverty and high-minority schools as a cause for gaps in the rates at which inexperienced and unqualified teachers teach low-income and/or minority students (see Figure 13).
States cited multiple potential reasons causing high rates of turnover. Delaware noted that principal turnover could create a negative school culture that leads to teacher turnover and high rates of inexperienced and unqualified teachers to fill the positions (Delaware Department of Education, 2015, p. 29). States noted several reasons for high teacher turnover, including lack of professional learning opportunities and inadequate compensation. Maryland and Minnesota noted that placing novice teachers in the highest-need schools without adequate support leads to increased turnover (Maryland State Department of Education, 2015, pp. 55–56; Minnesota Department of Education, 2015, p. 24). Maine mentioned that inexperienced teachers often seek their initial positions in isolated small and high-risk schools to gain experience and then leave their initial placements to seek employment in other schools (Maine Department of Education, 2015, p. 17). Hawaii, North Dakota and Puerto Rico noted that a high number of teachers are retiring in the coming years, creating vacancies that may be difficult to fill.38
Ineffective Recruitment and/or Retention Strategies
Definition:
Lack of recruitment and/or retention practices that lead to schools not meeting their staffing needs.
Sixteen States identified ineffective recruitment and/or retention strategies as a root cause for gaps in the rates at which inexperienced, unqualified and out-of-field teachers teach low-income and/or minority students (see Figure 13). States noted a lack of strategic initiatives to attract and retain
qualified talent and to fill specific needs in high-need schools contributes to ineffective hiring practices and, ultimately, less access to excellent teachers in the schools that need them most. Delaware mentioned that a late hiring timeline puts its LEAs at a disadvantage in recruiting (Delaware Department of Education, 2015 p. 49). Similarly, Florida and Oregon cited ineffective hiring policies as a hindrance to recruitment, although neither State provided specific details on the ineffective hiring practices in question (Florida Department of Education, 2015, p. 15; Oregon Department of Education, 2015, p. 44). Idaho identified “the inability of districts to recruit and retain educators” as a root cause and determined that “the rural remote nature of most Idaho school districts, the small size of many school districts and the fact that a majority of the school levies are not passing, are all factors which contribute to the recruitment and retention issue” (Idaho State Department of Education, 2015, p. 22).
Ineffective recruitment and/or retention strategies leave high-need schools struggling to attract and retain experienced, qualified teachers and may lead to difficulty in filling specific hard-to-staff fields and subjects with experienced, in-field and qualified candidates. Thus, ineffective recruitment and/or retention strategies may not only lead to higher rates of inexperienced, unqualified teachers in schools serving low-income and minority students, but higher rates of teachers teaching out-of-field in those schools as well.
Insufficient Educator Support and Professional Development
Definition:
Lack of professional development and/or support that helps teachers and principals at all stages of their careers to meet the specific needs of the students
Thirty-five States identified insufficient educator support and professional development as a root
38 Multiple State references: (Hawaii Department of Education, 2015, p. 38; North Dakota Department of Public Instruction, 2015, p. 15; Puerto Rico Department of Education, 2015, p. 27).

Equitable Access to Excellent Educators 25
cause for equity gaps (see Figure 13). These States noted that high-minority and high-poverty schools often lack high-quality mentoring and embedded professional development for all teachers at all stages of their careers. States additionally noted that these schools also often lack opportunities for teachers to collaborate in professional learning communities. Seven States noted that the lack of high-quality professional learning negatively affects teachers’ ability to meet students’ needs, particularly in high-need schools. For instance, Florida noted that there is a dearth of knowledge on what
constitutes skillful teaching and, as a result, teachers cannot improve their practice to affect student learning (Florida Department of Education, 2015, p. 15). Georgia, Missouri, Rhode Island and Wisconsin tied the lack of support and professional development opportunities to increased teacher turnover.39 Oklahoma and Rhode Island also identified insufficient educator support and professional development for principals (Oklahoma State Department of Education, 2015, p. 21; Rhode Island Department of Education, 2015, p. 40).
39 Multiple State references: (Georgia Department of Education, 2015, pp. 43-44; Rhode Island Department of Education, 2015, p. 50; Missouri Department of Ele-mentary and Secondary Education, 2015, pp. 43-45; Wisconsin Department of Public Instruction, 2015, p. 27).

Equitable Access to Excellent Educators 26
3 Analysis of Strategies
After identifying root causes for all identified equity gaps in their Educator Equity Plans, States described the strategies “they will implement to eliminate the identified equity gaps with respect to both (1) poor students and (2) minority students, including how they determined that these strategies will be effective” (U.S. Department of Education, State Plans to Ensure Equitable Access to Excellent Educators: Frequently Asked Questions, 2015, p. 7). States proposed strategies to address identified gaps; however, States often did not establish direct links between their identified gaps, root causes and strategies. This analysis does recognize alignment among identified gaps, root causes and strategies for the purpose of illuminating these linkages, even though the linkages were not explicit in all States’ plans. Many States also chose to prioritize specific gaps for State action and proposed a more limited set of strategies to address prioritized gaps. States also included a timeline for implementing the strategies and described how they would monitor their LEAs’ actions to address identified gaps. This section will discuss strategies proposed by States to eliminate the identified equity gaps.
SUMMARY OF STRATEGIES BY TOPIC AREAAs in the discussion of root causes in Section II, this section groups the State-identified strategies to address gaps by common topic areas and describes the strategies proposed within the 15 most cited areas (see Figure 14). Similar to the root causes, most of the proposed strategies were strategies to support teaching conditions, or mitigating challenges particular to working in high-need schools or communities (including working conditions, perceptions of teaching and geographic staffing challenges); strengthen educator preparation
(how teachers are prepared before they enter the classroom and how they are supported while in the classroom to meet student needs); and improve human capital management systems (how schools and districts recruit, support, compensate and retain teachers). In some cases, strategies fell into more than one of these three broad categories of conditions, educator preparation and human capital management systems. This section presents an analysis of each of the 15 topic areas and provides call-out boxes to describe each topic area. This section organizes the analysis by presenting the topic areas that fall under the conditions category, followed by the topic areas related to the educator preparation category, and finally, the topic areas in the human capital management system category. Appendix A provides additional information about and definitions for each common topic area. Although most States’ selected strategies fell into these 15 common topic areas, some strategies did not; however, this section does not discuss these additional strategies in detail. Appendix G lists all selected strategies by topic area and indicates which States identified strategies in each area.
States proposed a variety of broad, systemic changes, as well as specific and targeted initiatives, to address the root causes identified in their States. As described in Section II, the two most commonly cited root causes of gaps in equitable access to excellent educators were inadequate educator preparation and insufficient educator support and professional development, with 35 States citing each of those top root causes. States identified two common strategies that directly align with these root causes: 25 States propose improving educator preparation program evaluation and accountability to improve educator preparation, and 24 States propose

Equitable Access to Excellent Educators 27
aligning professional development with educators’ professional growth to better support educators (see Figure 14).
Because many root causes are intrinsically linked, some strategies may address multiple root causes. For example, a strategy to align professional development with educators’ professional growth would likely address an identified root cause of
insufficient educator support and professional development. Improving educator support could have a ripple effect of improving adverse working conditions and low teacher morale, thus leading to a decrease in teacher turnover—additional identified root causes. Below we discuss each of the 16 most cited topic areas and provide examples of State strategies within each.
Figure 14 Strategies States most frequently identified, by topic area (by number of states)
Improve induction/mentoring practices
Ensure educator preparation
accountability
Establish innovative recruitment, hiring,
placement, and retention strategies
24 25 42
13
13 25
20
24
16 35
Support LEAs Human Capital Management
structure
Improve working conditions
Establish educator preparation program
partnerships
Provide support to LEAs based on
LEA-specific needs
Align professional development and
support with educators’ professional growth
Conditions Educator Preparation Human Capital Management Systems
Establish Grow-your-own
programs
Improve use of data to inform human capital
decisions
Provide teacher leadership and career
pathway opportunities18
14
12
11
16
Streamline certification requirements/processes
Redesign and enhance educator
evaluation systems
Establish more equitable funding/resource
allocation
Increase or differentiate educator compensation/
incentives
NOTE: In this figure, “Align professional development and support with educator’s professional growth” and “Redesign and enhance educator evaluation systems” are identified as two distinct topic areas; however, these two topic areas have been combined into one “Redesign Educator Evaluation Systems and Align with Professional Development” topic area in the discussion below, as the strategies represent similar approaches and goals. Because these two topic areas have been combined into one for the purpose of the discussion, the 15 topic areas from this figure are represented in the 14 topic areas discussed below.
Source: U.S. Department of Education, Office of Elementary and Secondary Education (2015). State plans to ensure equitable access to excel-lent educators. Retrieved from http://www2.ed.gov/programs/titleiparta/resources.html
Figure reads: Twenty-four States identified strategies related to “improve induction/mentoring practices.”

Equitable Access to Excellent Educators 28
Topic Areas Related to Conditions
Improve Working Conditions
Definition:
Implement efforts to improve teaching conditions, student learning conditions, educator support and other elements of school climate to improve working conditions.
Thirteen States identified strategies to improve working conditions and school climate to foster high-quality instruction and student achievement (See Figure 14). States proposed these strategies to improve adverse working conditions in high-need schools, which 20 States identified as a root cause. Colorado, Delaware, Indiana, North Carolina, Rhode Island and Wisconsin planned to survey educators on school climate, specifically on student learning conditions, teaching conditions and edu-cator support.40 States and school districts planned to analyze the survey results to inform ways to improve school climate. Additionally, Rhode Island proposed to help its LEAs self-assess teaching and learning conditions in their buildings. The State identified a series of activities to provide targeted support to the districts “as needed and based upon results of a district needs assessment” (Rhode Island Department of Education, 2015, p. 51). As North Carolina stated in its plan, “focusing on teacher working conditions will help improve teacher retention. This in turn will result in more experienced teaching staff in our schools. The State can address the shortage, in part, by retaining more teachers in our schools” (North Carolina Department of Public Instruction, 2015, p. 38).
Improve Induction/Mentoring Practices
Definition:
Ensure that mentoring and induction programs provide high-quality support to new and inexperienced educators.
Twenty-four States identified strategies for improving induction/mentoring practices. These strategies directly addressed ineffective induction, mentoring and/or retention strategies (see Figure 14), which 21 States identified as a root cause of equity gaps. The strategies included providing additional training to mentors and ensuring mentors and mentees receive sufficient release time. Additionally, States proposed developing collaborative platforms and opportunities for mentoring and induction support through academies and mentoring groups. For example, Texas noted that it will analyze a pilot mentoring program and disseminate results on best practices, selection, assignment and compensation of mentors (Texas Education Agency, 2015, p. 36).
Topic Areas Related to Educator Preparation
Establish Educator Preparation Program Partnerships
Definition:
Establish efforts for States, districts, and colleges and universities to collaboratively inform and improve teacher preparation.
Sixteen States established educator preparation program partnerships with local school districts as a means of improving equitable access to excellent educators (see Figure 14), addressing the most commonly cited root cause of gaps in equitable access to excellent educators: insufficient educator preparation. States noted that not only will improved partnerships with preparation programs help districts and schools better recruit strong candidates, but these partnerships will improve the exposure of candidates in teacher preparation programs to high-need school settings with diverse student populations and better prepare aspiring teachers to teach in the communities where they are located. Additionally, States noted such partnerships allow for continuing conversations about teacher shortages and strategies to address them. For example, Pennsylvania noted that it will coordinate regular
40 Multiple State references: (Colorado Department of Education, 2015, p. 23; Delaware Department of Education, 2015, p. 54; Indiana Department of Education, 2015, p. 27; North Carolina Department of Public Instruction, 2015, p. 38; Rhode Island Department of Education, 2015, p. 51; Wisconsin Department of Public Instruction, 2015, p. 28).

Equitable Access to Excellent Educators 29
meetings between teacher preparation programs in the State and with State human resources staff to discuss areas of need (Pennsylvania Department of Education, 2015, p.69). Maryland noted that it will collaborate with alternative preparation programs “to assist in placing qualified teachers in hard-to-staff positions” (Maryland State Department of Education, 2015, pp. 59–60).
Establish Grow-Your-Own Programs
Definition:
Support efforts to encourage a stronger pipeline of teachers from within high-need local districts and geographic locations.
Thirteen States identified strategies to encourage students and professionals from local communities to consider pursuing a teaching career near the area where they are from or reside (See Figure 14). These strategies directly addressed the root cause of an insufficient teacher pipeline.
Colorado indicated it is “collaborating with the [Colorado Department of Higher Education] and institutions of higher education to target high school students who may display interest in teaching” and also planned to “provide outreach to key community organizations to support a stronger pipeline of teachers from within the state, including groups focused on ethnic diversity, non-traditional student populations and former military members” (Colorado Department of Education, 2015, p. 21). Colorado noted that this approach will help address the root cause of not providing an adequate supply of teacher candidates in specific subject areas.
Mississippi established a Grow Your Own Educators initiative, that seeks “1) to create a pipeline of highly effective teachers and 2) improve teacher retention in the focus school districts. It is a partnership of teacher/community organizations, institutions of higher education, school districts, and the Mississippi Department of Education that support parents, community members, and non-licensed school district personnel to become excellent teachers” (Mississippi Department of Education, 2015, p. 25.)
Washington proposed to create a paraprofessionals pipeline program to “assist rural and remote com-munities to grow their own teachers by providing financial incentives through an alternative route conditional loan scholarship for [paraprofessionals] to become teachers” (Washington State Board of Education, 2015, p. 149). Washington noted that a paraprofessional pipeline program will help increase the supply of diverse teachers, because paraprofessionals are diverse and often come from the communities they serve.
Ensure Educator Preparation Accountability
Definition:
Ensure that preparation programs are held accountable for meeting students’ learning and social–emotional needs.
Thirty-five States cited insufficient educator preparation as a root cause of gaps in equitable access to excellent educators. Accordingly, 25 States proposed improved analysis of the performance of educator preparation programs to hold programs more accountable for producing well-prepared educators (see Figure 14). Strategies in this category included analyzing the coursework and field experience requirements of preparation programs, reviewing policies and standards relating to admission into preparation programs and reviewing the approval process for preparation programs.
Missouri planned to establish a report that measures the performance of educator preparation programs (Missouri Department of Elementary & Secondary Education, 2015, p. 39). California planned to assess preparation programs based on data such as survey results from recent preparation program completers. In addition, California planned to have a data dashboard system that includes information on the quality of candidates produced by preparation programs (California State Department of Education, 2015, pp. 28–32). Maryland planned to use data from evaluations of first-year principals to provide technical assistance to principal preparation programs (Maryland State Department of Education, 2015, p. 62). Although these strategies may not

Equitable Access to Excellent Educators 30
immediately influence eliminating gaps, over time, States believed these strategies to improve preparation programs will provide districts with candidates who are better prepared to meet students’ learning and social–emotional needs, thus supporting the recruitment, retention and support components of a successful human capital management system.
Topic Areas Related to Human Capital Management Systems
Establish Innovative Recruitment, Hiring, Placement and Retention Practices
Definition:
Establish a comprehensive effort to implement innovative ways to recruit, hire, place and retain educators to meet the needs of schools and districts.
Forty-two States identified strategies for establishing innovative recruitment, hiring, placement and retention practices (see Figure 14). The strategies included offering incentives, such as loan forgiveness, to highly qualified teachers, as defined by NCLB, who teach in hard-to-staff schools; developing or enhancing web-based tools for recruitment; creating partnerships with organizations that recruit, place and support educators; and developing communica-tion strategies to help attract and retain teachers. For example, Oregon stated that it will work with districts and “will consider undertaking recruitment campaigns and incentives to attract and retain potential and current high-quality educators to high-need schools. Such campaigns will involve strategic recruitment events by hard-to-staff schools through local educator preparation programs. Recruitment incentives could include but are not limited to scholarships to work in targeted schools, loan forgiveness and recruitment bonuses in high-need locations” (Oregon Department of Education, 2015, pp. 44–45). Several States identified strategies to create a more diverse educator workforce through their recruitment and hiring efforts.
Provide Support to LEAs Based on LEA-specific Needs
Definition:
Offer high-quality technical assistance and support to school districts based on their differentiated needs.
Thirty-five States identified strategies designed to provide technical assistance/support to LEAs, including helping LEAs develop and implement their evaluation systems, providing data analysis support and providing professional development opportunities and tools for districts (see Figure 14). These strategies could directly address improving educator support and professional development, which 35 States identified as a root cause for equity gaps.
Alaska, Arkansas, the District of Columbia, Georgia, Idaho, New Jersey and Texas noted that they will provide professional learning services to LEAs through regional service centers and networks.41 For example, Texas planned to continue its partner-ship with the Texas Comprehensive Center to help districts use existing data to inform their local equity plans (Texas Education Agency, 2015, p. 24). Maine planned to provide high-poverty and isolated small schools with online access to excellent educators through distance learning opportunities (Maine Department of Education, 2015, p. 21).
Connecticut, Mississippi, New Jersey and Wisconsin have developed strategies for the specific districts they identified as the focus of their equity plans. For example, New Jersey planned to provide additional support to 10 districts with the highest rates of out-of-field teachers (New Jersey Department of Education, 2015, p.6).
41 Multiple State references: (Alaska State Department of Education, 2015, p. 23; Arkansas Department of Education, 2015, p. 42; District of Columbia Office of the State Superintendent of Education, 2015, p. 39; Georgia Department of Education, 2015, p. 36; Idaho State Department of Education, 2015, p. 26; New Jersey Department of Education, 2015, p. 34; Texas Education Agency, 2015, p. 24).

Equitable Access to Excellent Educators 31
Improve Use of Data to Inform Human Capital Decisions
Definition:
Apply a comprehensive data system to improve analysis and strategic decision-making to ensure equitable access to excellent teachers.
Twenty-five States identified strategies to help schools use data systems to inform equitable access initiatives (see Figure 14). Such strategies often involve helping schools use data to conduct analysis of equity gaps, identify teacher shortage areas and assess the ratings educators receive from teacher and principal evaluation systems. Some States noted that using data systems more productively will help schools make better strategic staffing decisions by providing targeted resources and support to high-need schools. For example, Arkansas was using its data system to develop a critical shortage model to predict teacher shortages by content area, grade level and geographic location (Arkansas Department of Education, 2015, p. 35). The State planned to then use those data to recruit and train teachers to meet identified needs. Georgia planned to ensure that data analyzed by the State to help inform equitable access to excellent educators is accessible and used to engage stakeholders at the district and school levels (Georgia Department of Education, 2015, p. 32).
Support LEAs’ Human Capital Management Structure
Definition:
Provide high-quality support to districts implementing components of their human capital management systems.
Twenty States identified strategies for supporting LEAs in enhancing segments of their human capital management structures as a means of addressing gaps in equitable access to excellent educators (see Figure 14). These strategies responded to root causes of ineffective recruitment, insufficient educator support and high teacher turnover. Although some of these strategies are similar to those identified in the “establishing innovative recruitment, hiring, retention, and placement practices” topic area, strategies in this topic area included supporting LEAs in their strategic staffing decisions and improving teacher and student assignment policies, in addition to recruiting, retaining and supporting educators.
Maryland planned to engage LEAs in ongoing dialogue about changing policies that place the least experienced teachers in the most high-need schools (Maryland State Department of Education, 2015, pp. 63-64). Alabama planned to conduct training for LEAs on “developing and implementing policies, procedures and practices for recruiting, hiring, and retaining excellent educators, particularly in LEAs identified as having hard to staff schools” (Alabama State Department of Education, 2015, p. 27). Similarly, Rhode Island planned to help local human resources directors “self-assess recruitment, hiring, staff management, and compensation policies and practices” (Rhode Island Department of Education, 2015, p. 46). Tennessee stated that “continuing to share human capital data and providing new and more frequent reports is a key strategy in the state’s plan to ensure equitable access to excellent educators,” recognizing that sharing human capital data enables LEAs to be more strategic about educator recruitment, placement and support (Tennessee Department of Education, 2015, p. 38).

Equitable Access to Excellent Educators 32
Redesign Educator Evaluation Systems and Align With Professional Development 42
Definition:
Establish and refine comprehensive educator evaluation systems that inform the profes-sional growth needs of educators; provide high-quality professional development that is informed by the specific professional growth needs of educators, as identified by educator evaluation systems.
Thirty-five States identified insufficient educator support and professional development as a root cause for equity gaps. Strategies identified that may address this gap fell into two topic areas: “align professional development and support with educators’ professional growth needs,” and “redesign and enhance educator evaluation and support systems to enhance this alignment.”
Twenty-four States proposed to align professional development and support with educators’ professional growth needs, as identified by the State or district educator evaluation (see Figure 14). Strategies grouped in this topic area include providing job-embedded and targeted professional development to educators based on the results of their evaluations.
Sixteen States planned to address equity gaps by developing strategies to redesign and enhance educator evaluation and support systems (see Figure 14). Such activities included training on the evaluation and support system and the structures of the system, as well as enhancing the system to promote professional growth to result in greater student achievement. For example, an enhance-ment to the evaluation and support system might improve the ability of the system to produce quality data and accurately identify areas for targeted improvement. Specifically, Kansas stated that “all districts’ evaluation [and support] systems will
guide professional learning and provide opportunities for personal and professional growth for educators” (Kansas State Department of Education, 2015, p. 43). Teachers in Kansas will receive targeted and ongoing professional learning based on their effectiveness ratings.
Provide Teacher Leadership and Career Pathway Opportunities
Definition:
Establish efforts for States, districts, and colleges and universities to collaboratively inform and improve teacher preparation.
Eighteen States proposed to enhance equitable access by providing teacher leadership and career pathway opportunities as a means to maximize the effect of and retain excellent teachers (see Figure 14). Kentucky, Maine, North Carolina and Oklahoma planned to create leadership opportunities for teachers in high-need schools to help support and retain them.43 Illinois planned to provide grants to LEAs to promote the use of teacher leaders as instructional leaders (Illinois State Board of Education, 2015, p. 5). Similarly, Florida planned to support a teacher leader program to improve instruction and student outcomes (Florida Department of Education, 2015, p. 23). Connecticut described its commitment to a statewide teacher leadership initiative as “one of two Learning Labs for teacher leadership in the country… to provide educators with increased leadership opportunities while still being able to remain in the classroom” (Connecticut State Department of Education, 2015, p. 29).
By implementing these strategies, schools and districts enabled teachers to progress in their field, providing a variety of career advancement opportunities and addressing the lack of career pathway opportunities (identified by nine States).
42 In Figure 14, “Align professional development and support with educator’s professional growth” and “Redesign and enhance educator evaluation systems” are identified as two distinct topic areas. However, these two topic areas have been combined into one “Redesign Educator Evaluation Systems and Align with Professional Development” topic area in this discussion, as the strategies represent similar approaches and goals. Thus, since these two topic areas have been combined into one for this discussion, the 15 topic areas from Figure 14 are represented in the 14 topic areas in this Section’s discussion.
43 Multiple State references: (Kentucky Department of Education, 2015, p. 32; Maine Department of Education, 2015, p. 18; North Carolina Department of Public Instruction, 2015, p. 40; Oklahoma State Department of Education, 2015, p. 26).

Equitable Access to Excellent Educators 33
In addition, career pathways recognize the unique knowledge and professional experience that excellent teachers have to offer; recognizing teachers through leadership opportunities can both increase morale (addressing adverse working conditions, a root cause identified by 20 States) and better retain teachers (addressing ineffective induction, mentoring and/or retention strategies, a root cause identified by 21 States). Further, teacher leaders may provide mentoring and professional development support to their peers, addressing insufficient educator support and/or professional development, a root cause identified by 35 States.
Increase or Differentiate Educator Compensation/Incentives
Definition:
Advocate for increasing educator salaries, providing incentives or bonuses to attract and retain effective educators, and/or differentiating educator compensation.
Fourteen States identified strategies to increase or differentiate educator compensation and incentives. States proposed strategies such as recommending and advocating to districts and legislatures for competitive salaries for educators in high-need schools (See Figure 14). These strategies addressed the root causes of ineffective retention strategies, ineffective recruitment strategies, inadequate compensation/incentives and high educator turn-over. North Dakota proposed to “create guidance and resources for school districts on ability to offer signing bonuses to attract highly qualified teachers” (North Dakota Department of Public Instruction, 2015, p. 17). North Dakota indicated this strategy will improve the beginning salaries for teachers in high-poverty schools, which will, in turn, address the root cause of ineffective re-cruitment strategies. Additionally, “Alabama advocates for increasing teacher/principal salaries so that salaries are competitive in high-needs schools.” Specifically, Alabama noted that it will pursue grant funding to increase educators’ compensation (Alabama State Department of Education, 2015, p. 28). Tennessee noted that
“hard-to-staff school stipends offer a way for districts to address access by incenting highly effective teachers to serve where they are most needed” (Tennessee Department of Education, 2015, p. 32). The State planned to provide technical assistance to help districts construct their compensation system to attract high-performing teachers in hard-to-staff schools or subjects.
Establish More Equitable Funding/Resource Allocation
Definition:
Ensure all schools receive equitable funding through strategic resource allocation.
Eleven States proposed strategies to establish more equitable funding and resource allocation to ensure that all schools receive equitable funding (See Figure 14). States proposed to strategically allocate more funding to high-need schools. For example, Minnesota stated that it will “study the distribution, impact and uses of state education funding for poor and minority students and that it will continue identifying investments that will decrease funding disparity among Minnesota’s highest and lowest revenue earning school districts.” Specifically, Minnesota stated that it “should study the distribution, impact and uses of Compensatory Revenue” which is funding “allocated to school sites based on the percentage of students eligible for free and reduced price lunch…and must be used to meet the educa-tional needs of high-needs students” (Minnesota Department of Education, 2015, pp. 49–50). Similarly, Alabama stated that it will “conduct a review of funding streams (e.g., Title I, Part A, School Improvement Grants; Individuals with Disabilities Education Act funds) to determine if the funds can be deployed more effectively in support of our teacher and leader equity goals. We will also seek to identify other funds that can be directed into teacher and leader equity-related professional learning such as a mentoring program for aspiring teacher leaders” (Alabama State Department of Education, 2015, pp. 27–28).

Equitable Access to Excellent Educators 34
Streamline Certification Requirements/Processes
Definition:
Ensure certification requirements and processes do not pose unnecessary barriers to entry into the teaching profession.
Twelve States proposed strategies to streamline certification requirements/processes and to ensure that certification policies and guidelines offer flexibility in certifying teachers and are not overly burdensome (See Figure 14). By removing potential barriers to entry into teaching, these strategies addressed the root cause of insufficient teacher pipeline. States proposed to remove barriers for teachers certified out of State to teach in their State. For example, the District of Columbia stated that “one of the most significant barriers to ensuring that all students have equitable access to excellent teachers is due to the requirements that teachers need to obtain a state-issued license to teach” (District of Columbia Office of the State Superintendent of Education, 2015, p. 37). The District of Columbia noted that this process can deny some teachers who demonstrated effectiveness in the classroom the opportunity to teach in the District of Columbia.
Thus, the District of Columbia aimed to streamline the process to “attract effective teachers who teach out of state and are not licensed in the DC, retaining effective teachers that entered the profession with temporary licensure, [and] obtain flexibility to hire professionals that can more effectively meet student needs” (District of Columbia Office of the State Superintendent of Education, 2015, p. 37). To recruit more teachers, Alaska planned to “identify and mitigate certification barriers that discourage teachers from out-of-state from relocating to Alaska to teach” (Alaska Department of Education, 2015, p. 23). Specifically, Alaska planned to “adopt additional out-of-state and national exams that teachers can utilize to satisfy the basic competency exam requirement” (Alaska Department of Education, 2015, p. 23). Rhode Island proposed to “provide certification support in highest poverty and highest minority schools” and “offer targeted support to human resources departments and building administrators in highest poverty and highest minority schools to help them recruit and retain qualified educators and ensure that all certificated professionals are fully certified or making progress toward certification” (Rhode Island Department of Education, 2015, p. 38).

Equitable Access to Excellent Educators 35
4 Evaluating and Reporting Progress
After identifying strategies to close gaps in equita-ble access, States described “the measures that the SEA will use to evaluate progress toward eliminat-ing the identified gaps for both (1) poor students and (2) minority students, including the method and timeline for the evaluation (e.g., by establish-ing an equity goal and annual targets for meeting that goal, or by reducing identified gaps by a mini-mum percentage every year)” (U.S. Department of Education, State Plans to Ensure Equitable Access to Excellent Educators: Frequently Asked Questions, 2015, p. 7). States set and described performance and/or implementation measures to evaluate and report on their progress in ensuring that they address the strategies they identified. This section provides an overview of both the measures and the plans to publicly report on progress.
PERFORMANCE MEASURES TO MONITOR PROGRESSAt a minimum, all States committed to measure and report on identified gaps annually. Many States also tended to identify metrics associated with measuring implementation of selected strategies. In many cases, States did not identify additional performance measures that would allow them to measure the degree to which they are making progress in eliminating their identified gaps as a result of strategies implemented. Because setting performance measures was an area in which the Educator Equity Plans were underdeveloped, States
will need to continue to work collaboratively with ED to establish meaningful performance measures, in addition to implementation measures, to more effectively measure the effectiveness of selected strategies to close identified gaps.
Although many States did not select specific performance measures to gauge gap closure, this report identifies a small number of States that developed exemplary performance measures with clear performance targets and specific timelines for implementation. The highlighted exemplary measures share the following characteristics of “SMART” goals and well-defined metrics, as identified in the Equitable Access Support Network’s Tips Sheets.44 SMART goals are Specific and Strategic; measurable; action-oriented; rigorous, realistic and results-focused; and timed and tracked. The metrics have clear alignment with the State-identified strategies, measurable targets with specific target dates or timelines that show elimination of gaps over time and a means of showing progress. Table 2 highlights promising examples of performance measures that are aligned to the States’ proposed strategies.
PUBLIC REPORTING OF PROGRESSStates will publicly report on their progress in eliminating their identified equity gaps, and in their plans, they will specify timelines for reporting progress. In their Educator Equity Plans, States indicated they would publicly report information
4 4 “State Plans to Ensure Equitable Access to Excellent Educators Implementation Tips Sheet #1: Setting Equity Goals” by the Equitable Access Support Network is available at: https://easn.grads360.org/#communities/pdc/documents/10067. “State Plans to Ensure Equitable Access to Excellent Educators Implementation Tips Sheet #2: Identifying Metrics to Track Progress” by the Equitable Access Support Network is available at: https://easn.grads360.org/#communities/pdc/docu-ments/10264.

Equitable Access to Excellent Educators 36
Table 2 Alignment samples of strategies and performance measures
State Strategy Performance measure
Colorado “ CDE is collaborating with the CDHE and Institutions of Higher Education (IHEs) on the following strategies for addressing the educator pipeline challenge:
• Targeting students in the late middle and early high school years who may have some interest or demonstrated ability in a career in education;
• Collaborating with rural and hard-to-staff district administrators and IHEs to expose teacher candidates to the benefits of teaching and living in rural communities throughout the State; and
• Providing outreach to key community organizations to support a stronger pipeline of educators from within the State, including groups focused on ethnic diversity, non-traditional student populations and former military members” (Colorado State Department of Education, 2015, p. 21).
• “ Statewide teacher turnover will decrease from 16.62 percent to 12 percent or less by 2017” (Colorado State Department of Education, 2015, p. 4).
• “ No student in Colorado will be taught by an ineffective teacher for more than 2 consecutive years” (Colorado State Department of Education, 2015, p. 4).
Connecticut “ Strengthen Preparation, Support, and Ongoing Development of Teachers” (Connecticut State Department of Education, 2015, p. 28).
“ Between 2017 and 2020, the percentage of teachers who stay 5 years or more in high-poverty, high-minority schools will increase by 5 percent each year” (Connecticut State Department of Education, 2015, p. 30).
District of Columbia
“ OSSE will propose regulations to reform the way in which the District of Columbia issues educator licenses. These proposed revisions will be anchored in the following two premises: 1. Removal of overly burdensome requirements that prevent candidates who have demonstrated effec-tiveness from obtaining DC teacher licensure. 2. Expanded pathways by which those who seek to teach in DC can obtain a license” (District of Columbia Office of the State Superin-tendent of Education, 2015, p. 36).
“ No highly effective teacher will be denied teaching in DCPS due to licensure regulations. Target Date: Spring 2016” (District of Columbia Office of the State Superintendent of Education, 2015, p. 42).
through various methods to ensure all stakeholders have access to the equity plans and opportunities to review progress and provide input on implemen-tation of the plans (U.S. Department of Education, State Plans to Ensure Equitable Access to Excellent Educators: Frequently Asked Questions, 2015, p. 7). The bullets below represent how often States plan to engage with stakeholders to publicly report progress (see Figure 15); they do not reflect how often States will engage with stakeholders to refine their Educator Equity Plans.
• Thirty-four States committed to reengage their stakeholders at least annually to report progress.
• Nine States did not specify a reporting timeline but agreed to report at some point.
• Eight States said they would engage their stakeholders at least biannually to report progress.
• One State said it will engage its stakeholders at least monthly to report progress.

Equitable Access to Excellent Educators 37
States plan to make their reports public using a variety of methods (see Figure 16), and most states (43) plan to use multiple methods to report progress. The bullets below indicate States’ multiple public reporting methods:
• Thirty-seven States will publicly report through their State websites.
• Twenty-three States will publicly report through annual reports.
• Seven States will report through public presentations to their stakeholders.
• Six States will report through webinars.
• Four States will report through social media.
• Other methods for reporting include using district dashboards (New York), electronic media (Arkansas) and an equity tab on school report cards (Kentucky).
Public reporting will remain an important way for States to communicate progress in eliminat-ing identified gaps in equitable access to excellent educators and to continue to engage stakeholders to refine and improve their approaches to ensuring equitable access.
Figure 15 Planned frequency of State progress reporting to stakeholders (by number of states)
Annually 34
Not specified 9
8Bi-annually
Monthly 1
Source: U.S. Department of Education, Office of Elementary and Secondary Education (2015). State plans to ensure equitable access to excellent educators. Retrieved from http://www2.ed.gov/programs/titleiparta/resources.html
Figure reads: Thirty-four States will annually report progress to stakeholders.
Figure 16 Methods States will use to publicly report progress to stakeholders (by number of states)
State website 37
Reports 23
7
6
4
Presentations
Webinars
Social media
Source: U.S. Department of Education, Office of Elementary and Secondary Education (2015). State plans to ensure equitable access to excellent educators. Retrieved from http://www2.ed.gov/programs/titleiparta/resources.html
Figure reads: Thirty-seven States will publicly report progress to stakeholders through their State websites.

Equitable Access to Excellent Educators 38
Conclusion
This thematic analysis provided a general overview of the core components of States’ Educator Equity Plans. The analysis examined each plan’s core components (i.e., definitions, gaps, root causes, strategies and measures) and summarized responses to each based on identified common themes. The analysis also highlighted trends among States as well as variance in approaches to addressing common root causes. This analysis will serve as a technical assistance document for ED to help guide States in
implementing and refining Educator Equity Plans to respond to new requirements under ESSA.45 Education Equity Plans will evolve to meet new requirements, yet equitable access to excellent educators remains an ongoing requirement and priority for States under the ESEA as amended by ESSA. Educator Equity Plans provide an important foundation to build on for future work to ensure that all students have access to excellent educators and, as a result, educational opportunities.
45 The new Title I requirements are detailed in this section: Elementary and Secondary Education Act of 1965, P.L. 89 10, §79, 45 Stat. (1965).

Equitable Access to Excellent Educators 39
Works Cited
Alabama State Department of Education. (2015). Alabama state plan to ensure equitable access to excellent educators. Retrieved from http://www2.ed.gov/programs/titleiparta/equitable/alequityplan92815.pdf
Alaska Department of Education and Early Development. (2015). Equitable access to excellent educators plan for Alaska. Retrieved from http://www2.ed.gov/programs/titleiparta/equitable/akequityplan100915.pdf
Arizona Department of Education. (2015). Ensuring equitable access to excellent educators in Arizona (revised). Retrieved from http://www2.ed.gov/programs/titleiparta/equitable/azequityplan100715.pdf
Arkansas Department of Education. (2015). Equitable access to excellent educators plan. Retrieved from http://www2.ed.gov/programs/titleiparta/equitable/arequityplan081315.pdf
California State Department of Education. (2015). California state plan to ensure equitable access to excellent educators. Retrieved from http://www2.ed.gov/programs/titleiparta/equitable/caequityplan092915.pdf
Colorado Department of Education. (2015). Colorado’s plan for ensuring equitable access to excellent educators. Retrieved from http://www2.ed.gov/programs/titleiparta/equitable/coequity-plan120315.pdf
Connecticut State Department of Education. (2015). Equitable access to excellent educators plan 2015. Retrieved from http://www2.ed.gov/programs/titleiparta/equitable/ctequity-plan081915.pdf
Delaware Department of Education. (2015). Plan to ensure equitable access to excellent educators for all students (2015-2025). Retrieved from http://www2.ed.gov/programs/titleiparta/equitable/deequityplan082515.pdf
District of Columbia Office of the State Superintendent of Education. (2015). District of Columbia plan to ensure equitable access to excellent educators. Retrieved from http://www2.ed.gov/programs/titleiparta/equitable/dcequitableplan100815.pdf
Florida Department of Education. (2015). Florida’s plan to ensure equitable access to excellent educators. Retrieved from http://www2.ed.gov/programs/titleiparta/equitable/flequity-plan121415.pdf
Georgia Department of Education. (2015). Equitable access to excellent educators. Retrieved from http://www2.ed.gov/programs/titleiparta/equitable/gaequityplan91415.pdf
Hawaii Department of Education. (2015). Equitable access to excellent educators. Retrieved from http://www2.ed.gov/programs/titleiparta/equitable/hiequityplan120715.pdf
Idaho State Department of Education. (2015). Idaho plan to ensure equitable access to excellent educators. Retrieved from http://www2.ed.gov/programs/titleiparta/equitable/idequity-plan11615.pdf
Illinois State Board of Education. (2015). 2015 Illinois equity plan. Retrieved from http://www2.ed.gov/programs/titleiparta/equitable/ilequityplan11615.pdf
Indiana Department of Education, Division of Educator Effectiveness. (2015). Ensuring equitable access to excellent educators. Retrieved from http://www2.ed.gov/programs/titleiparta/equitable/inequityplan081115.pdf
Iowa Department of Education. (2015). Iowa’s state plan to ensure equitable access to excellent educators. Retrieved May 16, 2016, from http://www2.ed.gov/programs/titleiparta/equitable/iaequityplan121715.pdf
Kansas State Department of Education. (2015). Kansas plan to ensure equitable access to excellent educators. Retrieved from http://www2.ed.gov/programs/titleiparta/equitable/ksequity-plan92515.pdf

Equitable Access to Excellent Educators 40
Kentucky Department of Education. (2015). Equitable access for excellent educators plan for Kentucky. Retrieved from http://www2.ed.gov/programs/titleiparta/equitable/kyequity-plan072415.pdf
Louisiana Department of Education. (2015). Louisiana’s plan for ensuring equitable access to excellent teachers for all students. Retrieved from http://www2.ed.gov/programs/titleiparta/equitable/laequityplan12315.pdf
Maine Department of Education. (2015). Maine’s plan to ensure equitable access to excellent teachers for all students. Retrieved from http://www2.ed.gov/programs/titleiparta/equitable/meequityplan0815.pdf
Maryland State Department of Education. (2015). Maryland state plan to ensure equitable access to excellent educators. Retrieved from http://www2.ed.gov/programs/titleiparta/equitable/mdequityplan101615.pdf
Massachusetts Department of Elementary and Secondary Education. (2015). Massachusetts state equity plan 2015-2019. Retrieved from http://www2.ed.gov/programs/titleiparta/equitable/maequityplan080715.pdf
Michigan Department of Education. (2015.) Michigan’s plan to ensure equitable access to excellent teachers. Retrieved from http://www2.ed.gov/programs/titleiparta/equitable/miequity-plan060115.pdf
Minnesota Department of Education. (2015). State plan to ensure poor and minority students have equitable access to experienced, qualified and in-field teachers. Retrieved from http://www2.ed.gov/programs/titleiparta/equitable/mnequity-plan060115.pdf
Mississippi Department of Education. (2015). Mississippi state plan to ensure equitable access to excellent educators. Retrieved from http://www2.ed.gov/programs/titleiparta/equitable/msequityplan102915.pdf
Missouri Department of Elementary & Secondary Education. (2015). Ensure equitable access to excellent educators. Retrieved from http://www2.ed.gov/programs/titleiparta/equitable/moequityplan073015.pdf
Montana Office of Public Instruction. (2015). 2015 Montana plan to ensure equitable access to excellent educators. Retrieved from http://www2.ed.gov/programs/titleiparta/equitable/mtequityplan102815.pdf
Nebraska Department of Education. (2015). Nebraska educator equity plan. Retrieved from http://www2.ed.gov/programs/titleiparta/equitable/neequityplan082515.pdf
Nevada Department of Education. (2015). Nevada plan to ensure equitable access to excellent educators. Retrieved from http://www2.ed.gov/programs/titleiparta/equitable/nvequity-plan060115.pdf
New Hampshire Department of Education. (2015). Ensuring equitable access for all students to excellent educators. Retrieved from http://www2.ed.gov/programs/titleiparta/equitable/nhequityplan91415.pdf
New Jersey Department of Education. (2015). Excellent educators for all initiative. Retrieved from http://www2.ed.gov/programs/titleiparta/equitable/njequityplan092415.pdf
New Mexico Public Education Department. (2015). New Mexico educator equity plan. Retrieved from http://www2.ed.gov/programs/titleiparta/equitable/nmequityplan11315.pdf
New York State Education Department. (2015). New York state’s plan to ensure equitable access to the most effective educators (2014-2015). Retrieved from http://www2.ed.gov/programs/titleiparta/equitable/nyequityplan072015.pdf
North Carolina Department of Public Instruction. (2015). North Carolina’s state plan to ensure equitable access to excellent educators. Retrieved from http://www2.ed.gov/programs/titleiparta/equitable/ncequityplan111215.pdf
North Dakota Department of Public Instruction. (2015). North Dakota state plan to ensure equitable access to excellent educators. Retrieved from http://www2.ed.gov/programs/titleiparta/equitable/ndequityplan82815.pdf
Ohio Department of Education. (2015). Ohio’s 2015 Plan to ensure equitable access to excellent educators. Retrieved from http://www2.ed.gov/programs/titleiparta/equitable/ohequity-plan060115.pdf
Oklahoma State Department of Education. (2015). Equitable access to excellent educators plan. Retrieved from http://www2.ed.gov/programs/titleiparta/equitable/okequityplan0815.pdf
Oregon Department of Education. (2015, November). Oregon’s equitable access to educator plan. Retrieved from http://www2.ed.gov/programs/titleiparta/equitable/orequity-plan113015.pdf
Pennsylvania Department of Education. (2015, August). Pennsylvania’s state plan for ensuring equitable access to excellent educators for all students. Retrieved from http://www2.ed.gov/programs/titleiparta/equitable/paequityplan081915.pdf
Puerto Rico Department of Education. (2015). Equitable access to excellent educators plan 2015-2016. Retrieved from http://www2.ed.gov/programs/titleiparta/equitable/prequity-plan122015.pdf

Equitable Access to Excellent Educators 41
Rhode Island Department of Education. (2015). Ensuring equitable access to excellent educators. Retrieved from http://www2.ed.gov/programs/titleiparta/equitable/riequityplan072015.pdf
South Carolina Department of Education. (2015). South Carolina State Plan for Equitable Access to Excellent Educators. Retrieved from http://www2.ed.gov/programs/titleiparta/equitable/scequityplan09012015.pdf
South Dakota Department of Education. (2015). South Dakota educator equity plan 2015. Retrieved from http://www2.ed.gov/programs/titleiparta/equitable/sdequityplan122015.pdf
Tennessee Department of Education. (2015). Equitable access to excellent educators. Retrieved from http://www2.ed.gov/programs/titleiparta/equitable/tnequityplan9115.pdf
Texas Education Agency. (2015). State plan to ensure equitable access to excellent educators. Retrieved from http://www2.ed.gov/programs/titleiparta/equitable/texasequityplan080715.pdf
The White House, Office of the Press Secretary. (2013). Inaugural address by President Barack Obama. Retrieved from https://www.whitehouse.gov/the-press-office/2013/01/21/inaugural-address-president-barack-obama
Utah State Office of Education. (2015). Utah plan to ensure equitable access to excellent educators. Retrieved from http://www2.ed.gov/programs/titleiparta/equitable/utequity-plan82715.pdf
Vermont Agency of Education. (2015). Teacher and leader equitable access plan. Retrieved from http://www2.ed.gov/pro-grams/titleiparta/equitable/vtequityplan92915.pdf
Virginia Department of Education. (2015). Virginia’s plan to ensure excellent educators for all students. Retrieved from http://www2.ed.gov/programs/titleiparta/equitable/vaequity-plan83115.pdf
Washington State Board of Education. (2015). Washington state equity plan: Ensuring equitable access to excellent educa-tors. Retrieved from http://www2.ed.gov/programs/titleiparta/equitable/waequityplan9415.pdf
West Virginia Department of Education. (2015). West Virginia educator equity plan. Retrieved from http://www2.ed.gov/programs/titleiparta/equitable/wvequityplan9315.pdf
Wisconsin Department of Public Instruction. (2015). Teacher equitable access plan for wisconsin. Retrieved from http://www2.ed.gov/programs/titleiparta/equitable/wiequity-plan082715.pdf
Wyoming Department of Education. (2015). Wyoming plan to ensure equitable access to excellent educators. Retrieved from http://www2.ed.gov/programs/titleiparta/equitable/wyequity-plan11515.pdf
U.S. Department of Education. (2015). State plans to ensure equitable access to excellent educators: frequently asked questions. Retrieved from http://www2.ed.gov/programs/titleiparta/equitable/eafaq2015.pdf

Equitable Access to Excellent Educators A-1
A Topic Definitions of Root Causes and Strategies
Appendix A Table 1 of 2 Root Causes
Root Causes: topic areas for groupings (descriptions)
Conditions: working conditions, perception, hard-to-staff areas [due to poor working conditions]
Educator Preparation: quality of teacher prep and in-service PD
Human Capital Management Systems: recruitment, retention, turnover, pipeline, compensation
Topic Area Description
Adverse working conditions (Conditions)Conditions in schools not conducive for teachers to provide quality instruction to students and for students to experience optimal learning that leads to student achievement
Hard-to-staff geographic areas (Conditions) Regions in States that have difficulty recruiting and retaining teachers
Ineffective induction and mentoring strategies (Conditions) Lack of support of new and inexperienced teachers during their first years of teaching
Ineffective school leadership (Conditions)
School leaders who do not provide adequate leadership and support to school-based staff; this can include the lack of instructional, administrative or distributive leadership practices
Negative perception of teaching (Conditions) Unfavorable perception of the teaching profession in the school and community
Lack of coherence between initiatives (Conditions) Little to no alignment or connection among a variety of educator initiatives
Inadequate educator preparation (Educator Preparation)
Educator preparation that does not adequately prepare educators to successfully meet the demands of their current school assignment and roles
Insufficient teacher pipeline (Educator Preparation)
Teacher supply insufficient to fill vacancies in schools and districts; pipeline not producing enough teachers in specific content areas to meet needs
Lack of strategic local school district, college/university partnerships (Educator Preparation)
Lack of collaborations between districts and colleges/universities
Inadequate compensation/incentives (Human Capital Management Systems) Insufficient monetary and nonmonetary incentives to attract and retain teachers
High teacher turnover (Human Capital Management Systems)
High rates of teachers who leave high-poverty or high-minority schools or districts annually, often leaving hard-to-staff vacancies to be filled

Equitable Access to Excellent Educators A-2
Topic Area Description
Ineffective recruitment and/or retention strategies (Human Capital Management Systems)
Lack of recruitment and/or retention practices that lead to schools not meeting their staffing needs
Insufficient educator support and professional development (Human Capital Management Systems)
Lack of professional development and/or support that help teachers and principals at all stages of their careers to meet the specific needs of the students
Ineffective hiring practices (Human Capital Management Systems)
Ineffective school hiring practices such as late hiring, not promoting the posi-tive aspects of the school/district and lack of business, school and community partnerships to attract the desired educator supply
Educator workforce supply and demand issues (Human Capital Management Systems)
Too few educators to meet the vacancy needs of schools and districts
Ineffective certification policies (Human Capital Management Systems)
Certification policies and guidelines that hinder flexibility in certifying educators (e.g., the absence of tiered certification programs, alternate routes, residency programs)
Inequitable funding and resource allocation (Human Capital Management Systems)
School and district systems that do not ensure equitable funding and resources based on the specific and differentiated needs of schools
Lack of career pathway opportunities (Human Capital Management Systems)
Few to no teacher leadership opportunities within the classroom, school, or district to offer growth and differentiated pathways through the trajectory of the teaching profes-sion
Lack of diversity of teacher candidates and teaching staff in schools (Human Capital Management Systems)
Educators do not reflect the diversity of the student body in schools and districts
Lack of equitable funding allocations (Human Capital Management Systems)
Insufficient funds allocated to high-poverty, high-minority districts
Appendix A Table 2 of 2 Strategies
Strategies: topic areas for groupings (descriptions)
Conditions: working conditions, perception, hard-to-staff areas [due to poor working conditions]
Educator Preparation: quality of teacher prep and in-service PD
Human Capital Management Systems: recruitment, retention, turnover, pipeline, compensation
Topic Area Description
Improve working conditions (Conditions) Implement efforts to improve teaching conditions, student learning conditions, educator support and other elements of school climate to improve working conditions
Improve induction/mentoring practices (Conditions)
Ensure that mentoring and induction programs provide high-quality support to new and inexperienced educators
Establish educator preparation program partnerships (Educator Preparation)
Establish efforts for States, districts, and colleges and universities to collaboratively inform and improve teacher preparation
Establish Grow-Your-Own programs (Educator Preparation)
Support efforts to encourage a stronger pipeline of teachers from within high-need local districts and geographic locations

Equitable Access to Excellent Educators A-3
Topic Area Description
Ensure educator preparation accountability (Educator Preparation)
Ensure that preparation programs are held accountable for meeting students’ learning and social–emotional needs
Establish innovative recruitment, hiring, placement and retention strategies (Human Capital Management Systems)
Establish a comprehensive effort to implement innovative ways to recruit, hire, place and retain educators to meet the needs of schools and districts
Provide support to LEAs based on LEA-specific needs (Human Capital Management Systems)
Offer high-quality technical assistance and support to school districts based on their differentiated needs
Improve use of data to inform human capital decisions (Human Capital Management Systems)
Apply a comprehensive data system to improve analysis and strategic decision-making to ensure equitable access to excellent teachers
Support LEAs’ human capital management structure (Human Capital Management Systems)
Provide high-quality support to districts in implementing components of their human capital management systems
Redesign educator evaluation systems and align with professional development (Human Capital Management Systems)
Establish and refine comprehensive educator evaluation systems that inform the professional growth needs of educators; provide high quality professional development that is informed by the specific professional growth needs of educators, as identified by educator evaluation systems
Provide teacher leadership and career pathway opportunities (Conditions, Human Capital Management Systems)
Establish efforts for States, districts, and colleges and universities to collaboratively inform and improve teacher preparation
Increase or differentiate educator compensation/incentives (Human Capital Management Systems)
Advocate for increasing educator salaries, providing incentives or bonuses to attract and retain effective educators, and/or differentiating education compensation
Establish more equitable funding/ resource allocation (Human Capital Management Systems)
Ensure that all schools receive equitable funding according to their differentiated needs
Streamline certification requirements/processes (Human Capital Management Systems)
Ensure certification requirements and processes do not pose unnecessary barriers to entry into the teaching profession
Align professional development and support with educators’ professional growth (Human Capital Management Systems)
Provide high-quality professional development that is informed by the specific professional growth needs of the educators
Expand professional development opportunities (Human Capital Management Systems)
Offer more high-quality professional development to educators to meet their needs
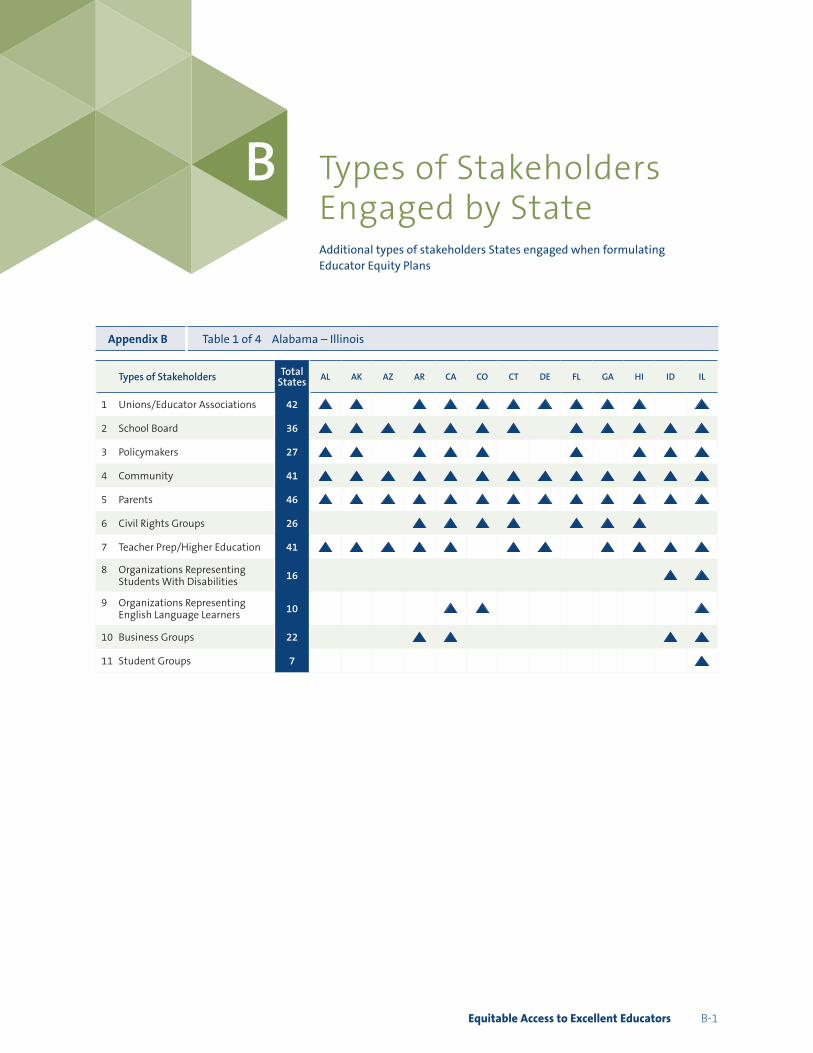
Equitable Access to Excellent Educators B-1
B Types of StakeholdersEngaged by StateAdditional types of stakeholders States engaged when formulating Educator Equity Plans
AppendixB Table 1 of 4 Alabama – Illinois
Types of Stakeholders Total States AL AK AZ AR CA CO CT DE FL GA HI ID IL
1 Unions/EducatorAssociations 42 Yes.Yes. No.
Yes.Yes.
Yes.Yes.
Yes.Yes.
Yes.Yes. No.
Yes.
2 SchoolBoard 36 Yes.Yes.
Yes.Yes.
Yes.Yes.
Yes. No.
Yes.Yes.
Yes.Yes.
Yes.
3 Policymakers 27 Yes.Yes. No.
Yes.Yes.
Yes. No. No.
Yes. No.
Yes.Yes.
Yes.
4 Community 41 Yes.Yes.
Yes.Yes.
Yes.Yes.
Yes.Yes.
Yes.Yes.
Yes.Yes.
Yes.
5 Parents 46 Yes.Yes.
Yes.Yes.
Yes.Yes.
Yes.Yes.
Yes.Yes.
Yes.Yes.
Yes.
6 CivilRightsGroups 26 No. No. No.
Yes.Yes.
Yes.Yes. No.
Yes.Yes.
Yes. No. No.
7 TeacherPrep/HigherEducation 41 Yes.Yes.
Yes.Yes.
Yes. No.
Yes.Yes. No.
Yes.Yes.
Yes.Yes.
8 OrganizationsRepresentingStudentsWithDisabilities 16 No. No. No. No. No. No. No. No. No. No. No.
Yes.Yes.
9 OrganizationsRepresentingEnglishLanguageLearners 10 No. No. No. No.
Yes.Yes. No. No. No. No. No. No.
Yes.
10 BusinessGroups 22 No. No. No.
Yes.Yes. No. No. No. No. No. No.
Yes.Yes.
11 StudentGroups 7 No. No. No. No. No. No. No. No. No. No. No. No.
Yes.

Equitable Access to Excellent Educators B-2
AppendixB Table 2 of 4 Indiana – Montana
Types of Stakeholders Total States IN IA KS KY LA ME MD MA MI MN MS MO MT
1 Unions/EducatorAssociations 42 Yes.Yes. No.
Yes. No.
Yes.Yes.
Yes.Yes.
Yes. No.
Yes.Yes.
2 SchoolBoard 36 Yes.Yes.
Yes.Yes.
Yes.Yes. No.
Yes.Yes.
Yes. No.
Yes.Yes.
3 Policymakers 27 Yes.Yes. No. No.
Yes.Yes. No. No. No.
Yes.Yes.
Yes. No.
4 Community 41 Yes.Yes.
Yes. No.
Yes.Yes. No.
Yes.Yes.
Yes.Yes. No.
Yes.
5 Parents 46 No.
Yes.Yes.
Yes.Yes.
Yes.Yes.
Yes.Yes.
Yes.Yes.
Yes. No.
6 CivilRightsGroups 26 No.
Yes.Yes.
Yes.Yes. No.
Yes.Yes.
Yes.Yes. No. No. No.
7 TeacherPrep/HigherEducation 41 Yes.Yes.
Yes. No. No.
Yes. No.
Yes.Yes.
Yes.Yes. No. No.
8 OrganizationsRepresentingStudentsWithDisabilities 16 No. No.
Yes.Yes. No.
Yes.Yes.
Yes.Yes. No. No. No. No.
9 OrganizationsRepresentingEnglishLanguageLearners 10 No. No. No. No. No. No.
Yes.Yes. No. No. No. No. No.
10 BusinessGroups 22 No. No. No.
Yes. No.
Yes. No.
Yes.Yes.
Yes.Yes. No. No.
11 StudentGroups 7 No. No. No. No. No. No. No. No.
Yes. No. No. No. No.
AppendixB Table 3 of 4 Nebraska – Rhode Island
Types of Stakeholders Total States NE NV NH NJ NM NY NC ND OH OK OR PA RI
1 Unions/EducatorAssociations 42 Yes. No. No. No.
Yes.Yes.
Yes.Yes.
Yes. No.
Yes.Yes.
Yes.
2 SchoolBoard 36 Yes. No. No.
Yes.Yes. No.
Yes. No. No. No.
Yes. No. No.
3 Policymakers 27 No. No. No. No.
Yes.Yes. No.
Yes. No. No.
Yes. No. No.
4 Community 41 Yes.Yes. No.
Yes.Yes.
Yes.Yes. No. No.
Yes.Yes.
Yes.Yes.
5 Parents 46 Yes.Yes. No.
Yes.Yes.
Yes.Yes. No. No.
Yes.Yes.
Yes.Yes.
6 CivilRightsGroups 26 Yes.Yes. No.
Yes. No. No. No. No. No. No.
Yes.Yes. No.
7 TeacherPrep/HigherEducation 41 Yes.Yes. No.
Yes.Yes.
Yes.Yes.
Yes. No.
Yes.Yes.
Yes.Yes.
8 OrganizationsRepresentingStudentsWithDisabilities 16 No. No. No.
Yes. No. No. No. No. No.
Yes. No. No.
Yes.
9 OrganizationsRepresentingEnglishLanguageLearners 10 No. No. No. No.
Yes. No. No.
Yes. No. No. No. No. No.
10 BusinessGroups 22 No.
Yes. No.
Yes.Yes. No. No. No. No.
Yes. No.
Yes. No.
11 StudentGroups 7 Yes. No. No. No. No. No. No. No. No.
Yes. No. No. No.

Equitable Access to Excellent Educators B-3
AppendixB Table 4 of 4 South Carolina – Wyoming | District of Columbia, Puerto Rico
Types of Stakeholders Total States SC SD TN TX UT VT VA WA WV WI WY DC PR
1 Unions/EducatorAssociations 42 Yes. No.
Yes.Yes.
Yes.Yes.
Yes.Yes.
Yes.Yes.
Yes.Yes.
Yes.
2 SchoolBoard 36 Yes. No.
Yes.Yes. No.
Yes. No. No.
Yes. No.
Yes.Yes.
Yes.
3 Policymakers 27 Yes. No. No. No.
Yes.Yes. No.
Yes.Yes.
Yes. No.
Yes. No.
4 Community 41 Yes. No. No.
Yes. No.
Yes. No.
Yes.Yes. No.
Yes.Yes.
Yes.
5 Parents 46 Yes.Yes.
Yes.Yes.
Yes.Yes.
Yes.Yes. No.
Yes.Yes.
Yes.Yes.
6 CivilRightsGroups 26 No. No. No.
Yes. No. No. No.
Yes.Yes.
Yes. No.
Yes.Yes.
7 TeacherPrep/HigherEducation 41 Yes.Yes.
Yes.Yes. No.
Yes.Yes.
Yes.Yes.
Yes.Yes. No.
Yes.
8 OrganizationsRepresentingStudentsWithDisabilities 16 No. No. No. No.
Yes. No.
Yes.Yes. No.
Yes.Yes. No. No.
9 OrganizationsRepresentingEnglishLanguageLearners 10 No. No. No. No.
Yes. No.
Yes.Yes. No. No. No. No. No.
10 BusinessGroups 22 Yes. No.
Yes.Yes. No. No. No. No.
Yes.Yes. No.
Yes.Yes.
11 StudentGroups 7 No. No. No. No. No.
Yes. No. No. No. No. No.
Yes.Yes.

Equitable Access to Excellent Educators C-1
C Methods of Stakeholder Engagement by State
Appendix C Table 1 of 4 Alabama – Illinois
Methods of Stakeholder Engagement
Total States AL AK AZ AR CA CO CT DE FL GA HI ID IL
1 In-Person Meetings 48 Yes.Yes.
Yes.Yes.
Yes.Yes.
Yes.Yes.
Yes.Yes.
Yes.Yes.
Yes.
2 Virtual Meetings or Webinars 14 No. No. No. No. No. No. No. No. No.
Yes.Yes.
Yes.Yes.
3 Focus Groups 7 No. No. No. No. No. No. No. No. No. No. No. No. No.
4 Electronic Communication 16 Yes.Yes. No. No. No.
Yes. No.
Yes.Yes. No. No. No. No.
5 Surveys 14 No.
Yes. No. No. No. No. No. No. No. No. No.
Yes.Yes.
Appendix C Table 2 of 4 Indiana – Montana
Methods of Stakeholder Engagement
Total States IN IA KS KY LA ME MD MA MI MN MS MO MT
1 In-Person Meetings 48 Yes.Yes.
Yes. No.
Yes.Yes.
Yes.Yes.
Yes.Yes.
Yes.Yes.
Yes.
2 Virtual Meetings or Webinars 14 Yes. No. No.
Yes. No. No. No. No.
Yes. No. No. No. No.
3 Focus Groups 7 No. No. No. No.
Yes.Yes. No. No. No. No. No.
Yes. No.
4 Electronic Communication 16 No. No. No.
Yes. No. No. No. No.
Yes. No.
Yes. No.
Yes.
5 Surveys 14 No. No. No. No.
Yes. No. No. No.
Yes. No. No. No. No.

Equitable Access to Excellent Educators C-2
Appendix C Table 3 of 4 Nebraska – Rhode Island
Methods of Stakeholder Engagement
Total States NE NV NH NJ NM NY NC ND OH OK OR PA RI
1 In-Person Meetings 48 Yes.Yes.
Yes.Yes.
Yes.Yes.
Yes.Yes.
Yes.Yes.
Yes. No.
Yes.
2 Virtual Meetings or Webinars 14 No. No. No. No. No. No. No. No. No.
Yes. No.
Yes.Yes.
3 Focus Groups 7 Yes. No. No. No. No. No. No. No. No.
Yes. No. No. No.
4 Electronic Communication 16 No. No. No. No. No. No.
Yes. No. No. No. No. No. No.
5 Surveys 14 No.
Yes. No. No. No. No. No. No. No.
Yes.Yes. No. No.
Appendix C Table 4 of 4 South Carolina – Wyoming | District of Columbia, Puerto Rico
Methods of Stakeholder Engagement
Total States SC SD TN TX UT VT VA WA WV WI WY DC PR
1 Poor Students Taught by Inexperienced Teachers 48 Yes.
Yes.Yes.
Yes.Yes.
Yes.Yes.
Yes. No.
Yes. No.
Yes.Yes.
2 Minority Students Taught by Inexperienced Teachers 14 No. No. No.
Yes.Yes. No. No. No. No. No.
Yes.Yes. No.
3 Poor Students Taught by Unqualified Teachers 7 No. No. No. No. No. No. No.
Yes. No. No. No.
Yes. No.
4 Minority Students Taught by Unqualified Teachers 16 No. No. No. No.
Yes.Yes. No. No.
Yes.Yes.
Yes. No.
Yes.
5 Surveys 14 No. No. No.
Yes. No.
Yes. No.
Yes. No.
Yes.Yes. No.
Yes.

Equitable Access to Excellent Educators D-1
D States’ Data SourcesTypes of Data States used to identify and calculate their equity gaps
AppendixD Table 1
Types of Data State
Data identifying students with disabilities
Delaware, Georgia, Iowa, Kentucky, Massachusetts, Michigan, Nevada, New Jersey, New York, Puerto Rico, Texas, Utah, Virginia, Washington, Wisconsin
Data identifying English Learners Arkansas, Delaware, Iowa, Kentucky, Massachusetts, Michigan Missouri, Nevada, New Jersey, New York, Texas, Virginia, Washington
Data identifying educators’ years of experience
Arkansas, Georgia, Kansas, Mississippi, Missouri, Nebraska, North Carolina, South Dakota, Utah
Data identifying high-quality teacher status
Alaska, Arkansas, Montana, Oregon, South Dakota, Tennessee, Virginia, West Virginia, Wyoming
Data identifying educator certification status for districts or schools
Alaska, Florida, Kentucky, Minnesota, Nevada, North Carolina, Pennsylvania
Data identifying retention rates Connecticut, Indiana, Missouri, Oregon, Pennsylvania

Equitable Access to Excellent Educators E-1
E Equity Gaps by StateIdentified equity gaps by State in the rates at which low-income and minority students are taught by inexperienced, unqualified, out-of-field and ineffective teachers46
AppendixE Table 1 of 4 Alabama – Illinois
Equity Gaps Total States AL AK AZ AR CA CO CT DE FL GA HI ID IL
1 Poor Students Taught by Inexperienced Teachers 38 Yes.
Yes.Yes.
Yes.Yes.
Yes.Yes.
Yes. No.
Yes.Yes.
Yes.Yes.
2 Minority Students Taught by Inexperienced Teachers 33 No.
Yes.Yes.
Yes.Yes.
Yes.Yes.
Yes. No.
Yes.Yes.
Yes.Yes.
3 Poor Students Taught by Unqualified Teachers 26 Yes.
Yes.Yes. No. No.
Yes. No.
Yes. No.
Yes.Yes. No.
Yes.
4 Minority Students Taught by Unqualified Teachers 25 Yes.
Yes.Yes. No. No.
Yes. No.
Yes. No.
Yes.Yes. No.
Yes.
5 Poor Students Taught by Out-of-Field Teachers 15 No. No.
Yes.Yes. No. No. No. No. No.
Yes.Yes. No.
Yes.
6 Minority Students Taught by Out-of-Field Teachers 14 No. No.
Yes. No. No. No. No. No. No.
Yes.Yes. No.
Yes.
7 Poor Students Taught by Ineffective Teachers 13 No. No.
Yes. No. No. No. No.
Yes.Yes. No. No. No. No.
8 Minority Students Taught by Ineffective Teachers 11 No. No.
Yes. No. No. No. No.
Yes.Yes. No. No. No. No.
46 States were required to calculate gaps for each of the required terms, per ED’s guidance; however, States also could elect to identify additional terms and gaps and could concentrate on implementing strategies tied to their largest, most significant gaps. This chart includes only those identified gaps that States selected to focus on in their Educator Equity Plans. All gaps are included for States that chose to focus on all identified gaps.
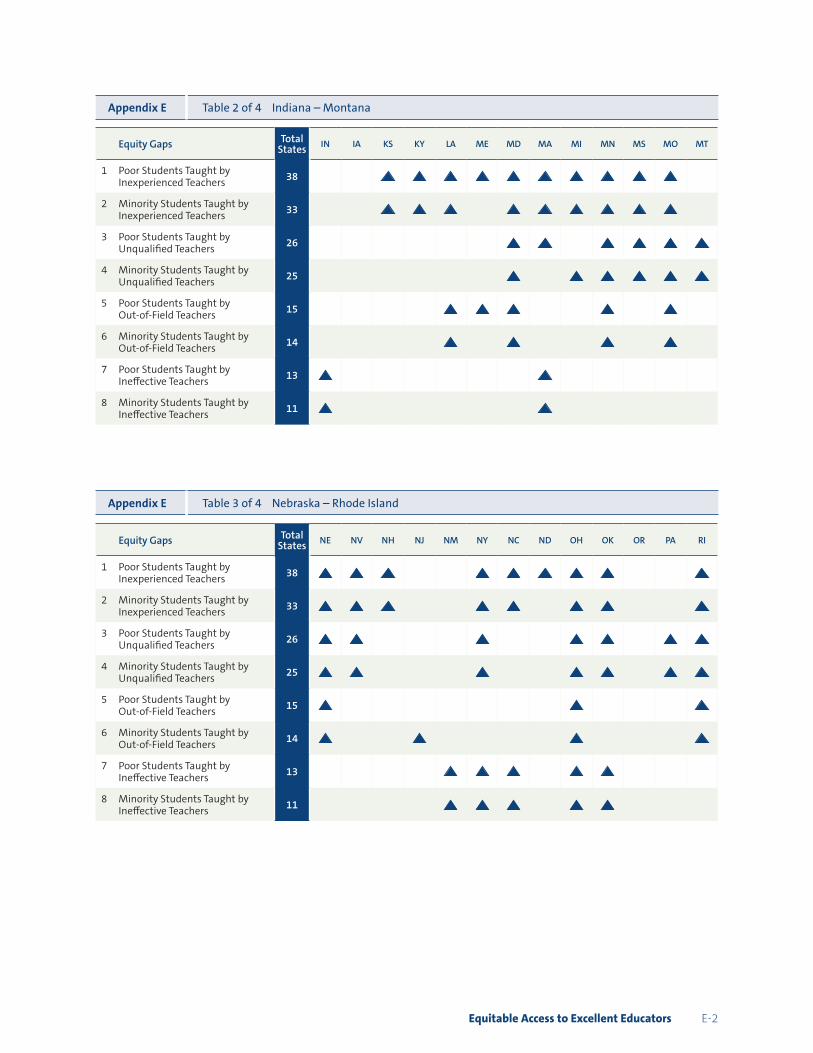
Equitable Access to Excellent Educators E-2
AppendixE Table 2 of 4 Indiana – Montana
Equity Gaps Total States IN IA KS KY LA ME MD MA MI MN MS MO MT
1 Poor Students Taught by Inexperienced Teachers 38 No. No.
Yes.Yes.
Yes.Yes.
Yes.Yes.
Yes.Yes.
Yes.Yes. No.
2 Minority Students Taught by Inexperienced Teachers 33 No. No.
Yes.Yes.
Yes. No.
Yes.Yes.
Yes.Yes.
Yes.Yes. No.
3 Poor Students Taught by Unqualified Teachers 26 No. No. No. No. No. No.
Yes.Yes. No.
Yes.Yes.
Yes.Yes.
4 Minority Students Taught by Unqualified Teachers 25 No. No. No. No. No. No.
Yes. No.
Yes.Yes.
Yes.Yes.
Yes.
5 Poor Students Taught by Out-of-Field Teachers 15 No. No. No. No.
Yes.Yes.
Yes. No. No.
Yes. No.
Yes. No.
6 Minority Students Taught by Out-of-Field Teachers 14 No. No. No. No.
Yes. No.
Yes. No. No.
Yes. No.
Yes. No.
7 Poor Students Taught by Ineffective Teachers 13 Yes. No. No. No. No. No. No.
Yes. No. No. No. No. No.
8 Minority Students Taught by Ineffective Teachers 11 Yes. No. No. No. No. No. No.
Yes. No. No. No. No. No.
AppendixE Table 3 of 4 Nebraska – Rhode Island
Equity Gaps Total States NE NV NH NJ NM NY NC ND OH OK OR PA RI
1 Poor Students Taught by Inexperienced Teachers 38 Yes.
Yes.Yes. No. No.
Yes.Yes.
Yes.Yes.
Yes. No. No.
Yes.
2 Minority Students Taught by Inexperienced Teachers 33 Yes.
Yes.Yes. No. No.
Yes.Yes. No.
Yes.Yes. No. No.
Yes.
3 Poor Students Taught by Unqualified Teachers 26 Yes.
Yes. No. No. No.
Yes. No. No.
Yes.Yes. No.
Yes.Yes.
4 Minority Students Taught by Unqualified Teachers 25 Yes.
Yes. No. No. No.
Yes. No. No.
Yes.Yes. No.
Yes.Yes.
5 Poor Students Taught by Out-of-Field Teachers 15 Yes. No. No. No. No. No. No. No.
Yes. No. No. No.
Yes.
6 Minority Students Taught by Out-of-Field Teachers 14 Yes. No. No.
Yes. No. No. No. No.
Yes. No. No. No.
Yes.
7 Poor Students Taught by Ineffective Teachers 13 No. No. No. No.
Yes.Yes.
Yes. No.
Yes.Yes. No. No. No.
8 Minority Students Taught by Ineffective Teachers 11 No. No. No. No.
Yes.Yes.
Yes. No.
Yes.Yes. No. No. No.
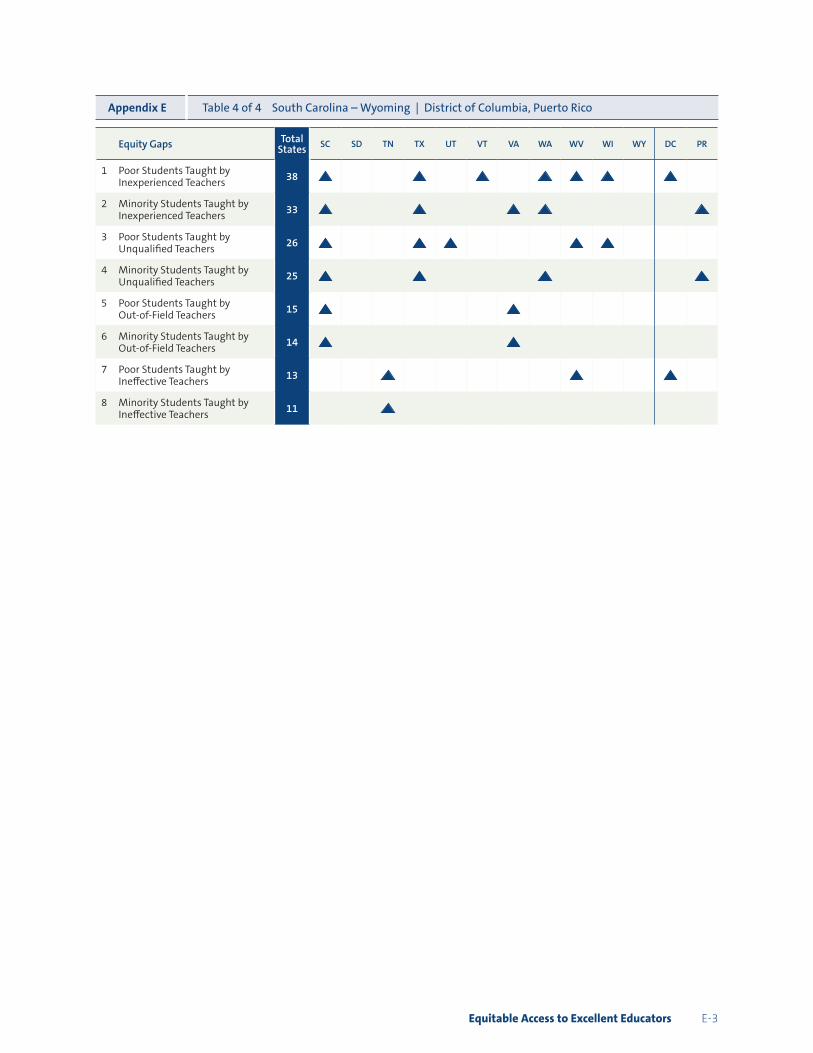
Equitable Access to Excellent Educators E-3
AppendixE Table 4 of 4 South Carolina – Wyoming | District of Columbia, Puerto Rico
Equity Gaps Total States SC SD TN TX UT VT VA WA WV WI WY DC PR
1 Poor Students Taught by Inexperienced Teachers 38 Yes. No. No.
Yes. No.
Yes. No.
Yes.Yes.
Yes. No.
Yes. No.
2 Minority Students Taught by Inexperienced Teachers 33 Yes. No. No.
Yes. No. No.
Yes.Yes. No. No. No. No.
Yes.
3 Poor Students Taught by Unqualified Teachers 26 Yes. No. No.
Yes.Yes. No. No. No.
Yes.Yes. No. No. No.
4 Minority Students Taught by Unqualified Teachers 25 Yes. No. No.
Yes. No. No. No.
Yes. No. No. No. No.
Yes.
5 Poor Students Taught by Out-of-Field Teachers 15 Yes. No. No. No. No. No.
Yes. No. No. No. No. No. No.
6 Minority Students Taught by Out-of-Field Teachers 14 Yes. No. No. No. No. No.
Yes. No. No. No. No. No. No.
7 Poor Students Taught by Ineffective Teachers 13 No. No.
Yes. No. No. No. No. No.
Yes. No. No.
Yes. No.
8 Minority Students Taught by Ineffective Teachers 11 No. No.
Yes. No. No. No. No. No. No. No. No. No. No.

Equitable Access to Excellent Educators F-1
F Root Causes Identified by State
AppendixF Table 1 of 4 Alabama – Illinois
Root Cause Total States AL AK AZ AR CA CO CT DE FL GA HI ID IL
1 Inadequate Educator Preparation 35 Yes. No. No.
Yes.Yes.
Yes.Yes.
Yes. No. No. No. No. No.
2 Insufficient Educator Support and Professional Development 35 Yes. No.
Yes.Yes.
Yes. No.
Yes.Yes.
Yes.Yes. No. No. No.
3 Adverse Working Conditions 20 Yes. No.
Yes.Yes.
Yes. No.
Yes.Yes. No. No. No. No. No.
4 Ineffective Recruitment and/or Retention Strategies 19 Yes. No. No. No. No. No.
Yes.Yes.
Yes. No.
Yes.Yes.
Yes.
5 Hard-to-Staff Geographic Areas 17 Yes.Yes.
Yes.Yes. No. No. No. No. No. No.
Yes.Yes. No.
6 High Teacher Turnover 17 No.
Yes. No.
Yes. No. No.
Yes.Yes. No.
Yes.Yes. No. No.
7 Inadequate Compensation/Incentives 17 Yes.
Yes.Yes. No. No. No. No.
Yes. No. No.
Yes. No. No.
8 Ineffective Induction and Mentoring 17 No. No. No. No. No.
Yes. No.
Yes. No. No.
Yes. No. No.
9 Negative Perception of Teaching 16 No. No.
Yes. No. No. No.
Yes.Yes. No. No. No. No. No.
10 Ineffective School Leadership 15 No. No.
Yes.Yes. No. No. No.
Yes. No.
Yes. No. No. No.
11 Insufficient Teacher Pipeline 14 Yes. No.
Yes. No. No.
Yes. No. No. No. No.
Yes. No. No.
12 Educator Workforce Supply and Demand Issues 10 Yes. No. No. No. No. No.
Yes. No. No. No. No. No. No.
13 Ineffective Hiring Practices 10 No. No. No. No. No. No. No. No. No. No. No. No. No.
14 Inequitable Funding and Resource Allocation 10 No. No.
Yes. No. No. No.
Yes.Yes. No. No. No. No.
Yes.
15 Lack of Career Pathway Opportunities 9 No. No.
Yes. No. No. No.
Yes.Yes. No. No. No. No. No.
16 Lack of Diversity of Teacher Candidates and Teaching Staff in Schools
8 No. No. No. No. No. No.
Yes. No. No. No. No. No. No.
17 Ineffective Licensure Policies 7 No. No. No. No. No. No. No. No. No. No. No. No. No.
18 Lack of Equitable Funding Allocation 7 No. No. No. No. No. No. No.
Yes. No.
Yes. No. No. No.
19 Lack of Strategic Local School District, College/University Partnerships
5 No. No. No. No. No. No. No.
Yes. No. No. No. No. No.
20 Lack of Coherence Between Initiatives 4 No. No. No. No. No. No. No. No.
Yes. No. No. No. No.

Equitable Access to Excellent Educators F-2
AppendixF Table 2 of 4 Indiana – Montana
Root Cause Total States IN IA KS KY LA ME MD MA MI MN MS MO MT
1 Inadequate Educator Preparation 35 Yes.
Yes.Yes.
Yes. No.
Yes.Yes.
Yes.Yes. No.
Yes.Yes. No.
2 Insufficient Educator Support and Professional Development 35 Yes.
Yes.Yes.
Yes. No. No. No.
Yes. No.
Yes.Yes.
Yes. No.
3 Adverse Working Conditions 20 Yes. No. No.
Yes. No. No.
Yes.Yes. No. No.
Yes. No. No.
4 Ineffective Recruitment and/or Retention Strategies 19 Yes. No. No.
Yes. No. No. No.
Yes. No. No. No.
Yes. No.
5 Hard-to-Staff Geographic Areas 17 No. No.
Yes. No. No.
Yes.Yes. No. No. No. No.
Yes.Yes.
6 High Teacher Turnover 17 No. No.
Yes.Yes. No.
Yes.Yes.
Yes. No.
Yes. No. No. No.
7 Inadequate Compensation/Incentives 17 No. No.
Yes. No. No.
Yes.Yes. No.
Yes. No. No. No. No.
8 Ineffective Induction and Mentoring 17 No. No.
Yes.Yes.
Yes.Yes. No.
Yes. No.
Yes. No. No. No.
9 Negative Perception of Teaching 16 Yes. No. No. No. No. No. No. No.
Yes. No.
Yes. No. No.
10 Ineffective School Leadership 15 Yes. No. No. No. No. No.
Yes.Yes.
Yes. No. No. No. No.
11 Insufficient Teacher Pipeline 14 No. No.
Yes. No. No. No.
Yes. No. No. No. No. No. No.
12 Educator Workforce Supply and Demand Issues 10 No. No. No. No.
Yes. No.
Yes. No. No. No. No.
Yes. No.
13 Ineffective Hiring Practices 10 No. No. No.
Yes.Yes. No. No.
Yes. No. No. No. No. No.
14 Inequitable Funding and Resource Allocation 10 No. No. No. No. No. No. No.
Yes.Yes.
Yes. No. No. No.
15 Lack of Career Pathway Opportunities 9 No. No. No.
Yes. No. No. No. No. No. No. No. No. No.
16 Lack of Diversity of Teacher Candidates and Teaching Staff in Schools
8 No. No. No. No. No. No. No.
Yes. No. No.
Yes. No. No.
17 Ineffective Licensure Policies 7 No. No. No. No.
Yes. No. No.
Yes. No.
Yes. No. No. No.
18 Lack of Equitable Funding Allocation 7 No. No. No. No. No. No. No.
Yes. No. No. No. No. No.
19 Lack of Strategic Local School District, College/University Partnerships
5 No. No. No. No.
Yes. No. No. No. No. No. No. No. No.
20 Lack of Coherence Between Initiatives 4 No. No. No. No. No. No. No. No.
Yes. No. No. No. No.
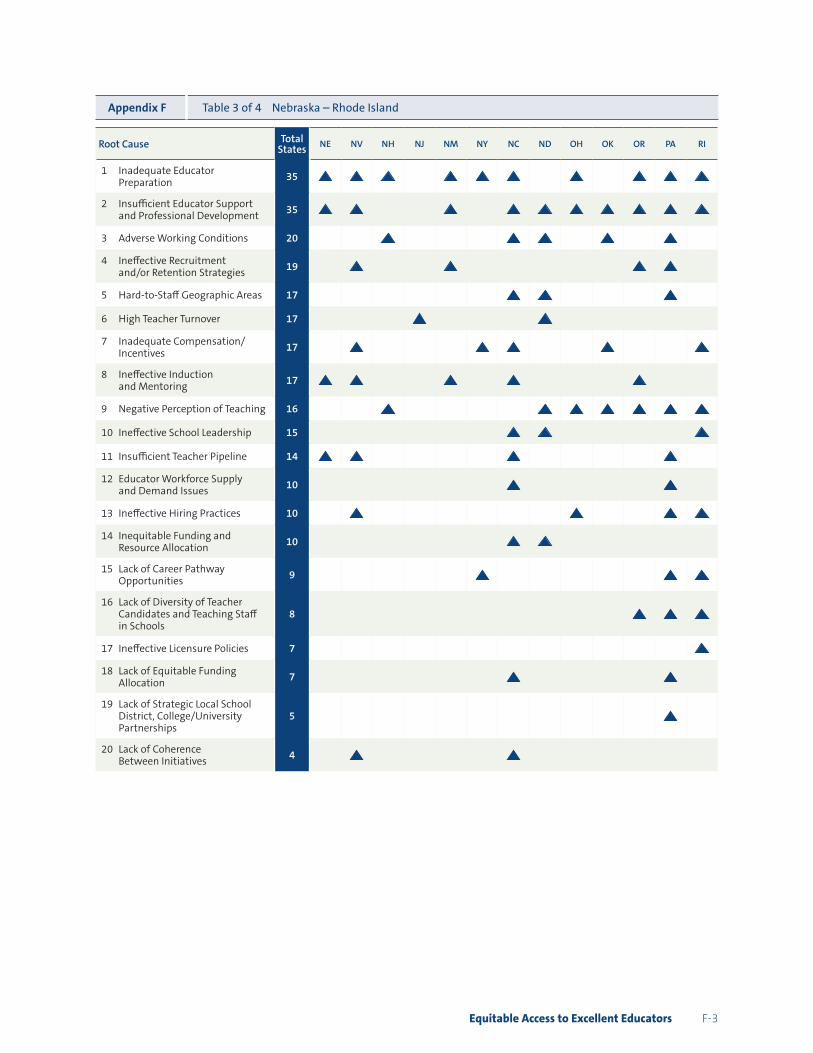
Equitable Access to Excellent Educators F-3
AppendixF Table 3 of 4 Nebraska – Rhode Island
Root Cause Total States NE NV NH NJ NM NY NC ND OH OK OR PA RI
1 Inadequate Educator Preparation 35 Yes.
Yes.Yes. No.
Yes.Yes.
Yes. No.
Yes. No.
Yes.Yes.
Yes.
2 Insufficient Educator Support and Professional Development 35 Yes.
Yes. No. No.
Yes. No.
Yes.Yes.
Yes.Yes.
Yes.Yes.
Yes.
3 Adverse Working Conditions 20 No. No.
Yes. No. No. No.
Yes.Yes. No.
Yes. No.
Yes. No.
4 Ineffective Recruitment and/or Retention Strategies 19 No.
Yes. No. No.
Yes. No. No. No. No. No.
Yes.Yes. No.
5 Hard-to-Staff Geographic Areas 17 No. No. No. No. No. No.
Yes.Yes. No. No. No.
Yes. No.
6 High Teacher Turnover 17 No. No. No.
Yes. No. No. No.
Yes. No. No. No. No. No.
7 Inadequate Compensation/Incentives 17 No.
Yes. No. No. No.
Yes.Yes. No. No.
Yes. No. No.
Yes.
8 Ineffective Induction and Mentoring 17 Yes.
Yes. No. No.
Yes. No.
Yes. No. No. No.
Yes. No. No.
9 Negative Perception of Teaching 16 No. No.
Yes. No. No. No. No.
Yes.Yes.
Yes.Yes.
Yes.Yes.
10 Ineffective School Leadership 15 No. No. No. No. No. No.
Yes.Yes. No. No. No. No.
Yes.
11 Insufficient Teacher Pipeline 14 Yes.Yes. No. No. No. No.
Yes. No. No. No. No.
Yes. No.
12 Educator Workforce Supply and Demand Issues 10 No. No. No. No. No. No.
Yes. No. No. No. No.
Yes. No.
13 Ineffective Hiring Practices 10 No.
Yes. No. No. No. No. No. No.
Yes. No. No.
Yes.Yes.
14 Inequitable Funding and Resource Allocation 10 No. No. No. No. No. No.
Yes.Yes. No. No. No. No. No.
15 Lack of Career Pathway Opportunities 9 No. No. No. No. No.
Yes. No. No. No. No. No.
Yes.Yes.
16 Lack of Diversity of Teacher Candidates and Teaching Staff in Schools
8 No. No. No. No. No. No. No. No. No. No.
Yes.Yes.
Yes.
17 Ineffective Licensure Policies 7 No. No. No. No. No. No. No. No. No. No. No. No.
Yes.
18 Lack of Equitable Funding Allocation 7 No. No. No. No. No. No.
Yes. No. No. No. No.
Yes. No.
19 Lack of Strategic Local School District, College/University Partnerships
5 No. No. No. No. No. No. No. No. No. No. No.
Yes. No.
20 Lack of Coherence Between Initiatives 4 No.
Yes. No. No. No. No.
Yes. No. No. No. No. No. No.
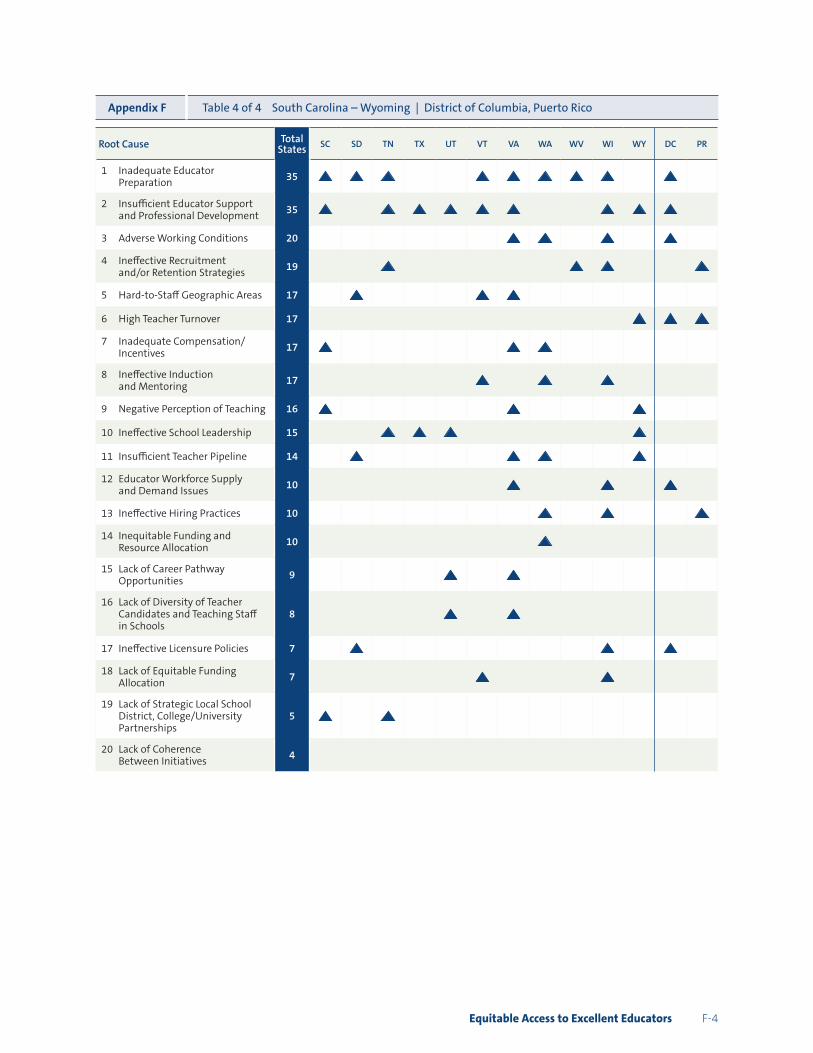
Equitable Access to Excellent Educators F-4
AppendixF Table 4 of 4 South Carolina – Wyoming | District of Columbia, Puerto Rico
Root Cause Total States SC SD TN TX UT VT VA WA WV WI WY DC PR
1 Inadequate Educator Preparation 35 Yes.
Yes.Yes. No. No.
Yes.Yes.
Yes.Yes.
Yes. No.
Yes. No.
2 Insufficient Educator Support and Professional Development 35 Yes. No.
Yes.Yes.
Yes.Yes.
Yes. No. No.
Yes.Yes.
Yes. No.
3 Adverse Working Conditions 20 No. No. No. No. No. No.
Yes.Yes. No.
Yes. No.
Yes. No.
4 Ineffective Recruitment and/or Retention Strategies 19 No. No.
Yes. No. No. No. No. No.
Yes.Yes. No. No.
Yes.
5 Hard-to-Staff Geographic Areas 17 No.
Yes. No. No. No.
Yes.Yes. No. No. No. No. No. No.
6 High Teacher Turnover 17 No. No. No. No. No. No. No. No. No. No.
Yes.Yes.
Yes.
7 Inadequate Compensation/Incentives 17 Yes. No. No. No. No. No.
Yes.Yes. No. No. No. No. No.
8 Ineffective Induction and Mentoring 17 No. No. No. No. No.
Yes. No.
Yes. No.
Yes. No. No. No.
9 Negative Perception of Teaching 16 Yes. No. No. No. No. No.
Yes. No. No. No.
Yes. No. No.
10 Ineffective School Leadership 15 No. No.
Yes.Yes.
Yes. No. No. No. No. No.
Yes. No. No.
11 Insufficient Teacher Pipeline 14 No.
Yes. No. No. No. No.
Yes.Yes. No. No.
Yes. No. No.
12 Educator Workforce Supply and Demand Issues 10 No. No. No. No. No. No.
Yes. No. No.
Yes. No.
Yes. No.
13 Ineffective Hiring Practices 10 No. No. No. No. No. No. No.
Yes. No.
Yes. No. No.
Yes.
14 Inequitable Funding and Resource Allocation 10 No. No. No. No. No. No. No.
Yes. No. No. No. No. No.
15 Lack of Career Pathway Opportunities 9 No. No. No. No.
Yes. No.
Yes. No. No. No. No. No. No.
16 Lack of Diversity of Teacher Candidates and Teaching Staff in Schools
8 No. No. No. No.
Yes. No.
Yes. No. No. No. No. No. No.
17 Ineffective Licensure Policies 7 No.
Yes. No. No. No. No. No. No. No.
Yes. No.
Yes. No.
18 Lack of Equitable Funding Allocation 7 No. No. No. No. No.
Yes. No. No. No.
Yes. No. No. No.
19 Lack of Strategic Local School District, College/University Partnerships
5 Yes. No.
Yes. No. No. No. No. No. No. No. No. No. No.
20 Lack of Coherence Between Initiatives 4 No. No. No. No. No. No. No. No. No. No. No. No. No.

Equitable Access to Excellent Educators G-1
G Strategies Identified by State
AppendixG Table 1 of 4 Alabama – Illinois
Strategies Total States AL AK AZ AR CA CO CT DE FL GA HI ID IL
1 EstablishInnovativeRecruitment,Hiring,Placement,andRetentionStrategies
42 Yes.Yes.
Yes.Yes. No.
Yes.Yes.
Yes. No.
Yes.Yes.
Yes.Yes.
2 ProvideTechnicalAssistance/SupporttoLEAs 35 Yes.
Yes. No.
Yes.Yes.
Yes.Yes. No. No.
Yes. No.
Yes. No.
3 EducatorPreparationProgramAccountability 25 No. No. No. No.
Yes.Yes.
Yes.Yes.
Yes.Yes. No. No. No.
4 UtilizeDataSystemstoInformEquitableAccessInitiatives 25 Yes.
Yes. No.
Yes. No.
Yes. No. No.
Yes.Yes. No. No. No.
5 UtilizeDataSystemstoInformEquitableAccessInitiatives 24 No. No.
Yes.Yes.
Yes.Yes.
Yes.Yes.
Yes.Yes.
Yes. No. No.
6 ImproveInduction/MentoringPractices 24 Yes. No.
Yes. No.
Yes.Yes. No.
Yes. No.
Yes.Yes. No. No.
7 ExpandProfessionalDevelopmentOpportunities 20 Yes. No. No. No.
Yes. No. No.
Yes.Yes.
Yes. No. No. No.
8 SupportLEA’sHumanCapitalManagementStructure 20 Yes. No. No.
Yes.Yes.
Yes. No. No. No. No. No. No.
Yes.
9 ProvideTeacherLeadershipandCareerPathwayOpportunities 18 Yes. No. No. No. No.
Yes.Yes.
Yes.Yes. No. No.
Yes.Yes.
10 EstablishEducatorPreparationProgramPartnerships 16 Yes.
Yes. No. No. No. No. No. No. No. No.
Yes. No.
Yes.
11 RedesignandEnhanceEducatorEvaluationSystems 16 No.
Yes.Yes.
Yes. No.
Yes. No. No. No.
Yes. No. No. No.
12 IncreaseorDifferentiateEducatorCompensation/Incentives
14 Yes. No. No. No. No. No. No.
Yes. No. No.
Yes. No. No.
13 Establish“Grow-Your-Own”Programs 13 No.
Yes. No.
Yes. No.
Yes. No. No.
Yes. No.
Yes. No. No.
14 ImproveWorkingConditions/SchoolClimate 13 No. No. No. No. No.
Yes.Yes.
Yes. No.
Yes. No. No. No.
15 StreamlineCertificationRequirements/Processes 12 No.
Yes. No. No. No. No. No. No. No.
Yes. No. No. No.
16 EstablishMoreEquitableFunding/ResourceAllocation 11 Yes. No. No. No. No. No.
Yes. No.
Yes. No. No. No. No.

Equitable Access to Excellent Educators G-2
AppendixG Table 2 of 4 Indiana – Montana
Strategies Total States IN IA KS KY LA ME MD MA MI MN MS MO MT
1 EstablishInnovativeRecruitment,Hiring,Placement,andRetentionStrategies
42 No. No. No.
Yes.Yes.
Yes.Yes.
Yes.Yes.
Yes.Yes.
Yes.Yes.
2 ProvideTechnicalAssistance/SupporttoLEAs 35 Yes.
Yes.Yes. No. No.
Yes.Yes.
Yes.Yes.
Yes.Yes.
Yes.Yes.
3 EducatorPreparationProgramAccountability 25 No. No. No.
Yes. No.
Yes.Yes.
Yes. No. No. No.
Yes. No.
4 UtilizeDataSystemstoInformEquitableAccessInitiatives 25 No. No.
Yes. No. No.
Yes.Yes.
Yes.Yes.
Yes. No. No.
Yes.
5 UtilizeDataSystemstoInformEquitableAccessInitiatives 24 No. No. No.
Yes. No. No.
Yes. No. No. No. No. No.
Yes.
6 ImproveInduction/MentoringPractices 24 No. No.
Yes.Yes. No.
Yes. No. No. No.
Yes.Yes. No.
Yes.
7 ExpandProfessionalDevelopmentOpportunities 20 No.
Yes. No. No. No. No. No. No. No. No.
Yes. No. No.
8 SupportLEA’sHumanCapitalManagementStructure 20 Yes.
Yes. No.
Yes. No. No.
Yes. No. No. No. No.
Yes.Yes.
9 ProvideTeacherLeadershipandCareerPathwayOpportunities 18 Yes.
Yes. No.
Yes. No.
Yes. No. No.
Yes. No. No. No. No.
10 EstablishEducatorPreparationProgramPartnerships 16 No. No.
Yes. No.
Yes. No.
Yes. No. No. No. No.
Yes. No.
11 RedesignandEnhanceEducatorEvaluationSystems 16 No.
Yes.Yes. No. No. No. No.
Yes. No. No. No. No. No.
12 IncreaseorDifferentiateEducatorCompensation/Incentives
14 No. No. No. No. No. No.
Yes. No.
Yes. No. No. No. No.
13 Establish“Grow-Your-Own”Programs 13 No. No. No. No.
Yes. No. No. No. No. No.
Yes. No. No.
14 ImproveWorkingConditions/SchoolClimate 13 Yes. No. No. No. No. No.
Yes. No. No. No. No.
Yes.Yes.
15 StreamlineCertificationRequirements/Processes 12 No. No. No. No. No.
Yes. No. No. No.
Yes. No. No. No.
16 EstablishMoreEquitableFunding/ResourceAllocation 11 No. No. No. No. No.
Yes. No. No. No.
Yes. No. No. No.

Equitable Access to Excellent Educators G-3
AppendixG Table 3 of 4 Nebraska – Rhode Island
Strategies Total States NE NV NH NJ NM NY NC ND OH OK OR PA RI
1 EstablishInnovativeRecruitment,Hiring,Placement,andRetentionStrategies
42 Yes.Yes. No.
Yes.Yes. No.
Yes.Yes.
Yes.Yes.
Yes.Yes.
Yes.
2 ProvideTechnicalAssistance/SupporttoLEAs 35 No.
Yes.Yes.
Yes. No.
Yes.Yes. No. No.
Yes. No. No. No.
3 EducatorPreparationProgramAccountability 25 No.
Yes. No. No.
Yes.Yes.
Yes. No.
Yes. No. No. No.
Yes.
4 UtilizeDataSystemstoInformEquitableAccessInitiatives 25 Yes.
Yes. No.
Yes. No.
Yes.Yes. No.
Yes. No. No. No.
Yes.
5 UtilizeDataSystemstoInformEquitableAccessInitiatives 24 No.
Yes. No. No. No. No. No.
Yes.Yes.
Yes. No.
Yes.Yes.
6 ImproveInduction/MentoringPractices 24 No. No. No.
Yes. No. No.
Yes.Yes. No.
Yes.Yes. No.
Yes.
7 ExpandProfessionalDevelopmentOpportunities 20 Yes.
Yes. No. No.
Yes. No.
Yes.Yes. No.
Yes. No. No. No.
8 SupportLEA’sHumanCapitalManagementStructure 20 Yes.
Yes. No. No. No. No.
Yes.Yes. No. No.
Yes. No.
Yes.
9 ProvideTeacherLeadershipandCareerPathwayOpportunities 18 No. No. No. No. No.
Yes.Yes. No. No.
Yes. No. No. No.
10 EstablishEducatorPreparationProgramPartnerships 16 No. No.
Yes. No.
Yes. No. No. No.
Yes. No.
Yes.Yes.
Yes.
11 RedesignandEnhanceEducatorEvaluationSystems 16 Yes.
Yes. No.
Yes.Yes.
Yes.Yes. No. No. No. No. No.
Yes.
12 IncreaseorDifferentiateEducatorCompensation/Incentives
14 No.
Yes. No. No.
Yes. No.
Yes.Yes. No. No. No. No. No.
13 Establish“Grow-Your-Own”Programs 13 No.
Yes. No. No.
Yes. No. No.
Yes. No.
Yes. No. No. No.
14 ImproveWorkingConditions/SchoolClimate 13 No. No. No. No. No. No.
Yes. No.
Yes. No. No. No.
Yes.
15 StreamlineCertificationRequirements/Processes 12 No.
Yes. No.
Yes.Yes. No. No. No. No. No.
Yes.Yes.
Yes.
16 EstablishMoreEquitableFunding/ResourceAllocation 11 No.
Yes. No. No. No. No. No. No. No.
Yes.Yes.
Yes.Yes.

Equitable Access to Excellent Educators G-4
AppendixG Table 4 of 4 South Carolina – Wyoming | District of Columbia, Puerto Rico
Strategies Total States SC SD TN TX UT VT VA WA WV WI WY DC PR
1 EstablishInnovativeRecruitment,Hiring,Placement,andRetentionStrategies
42 Yes. No.
Yes.Yes.
Yes.Yes.
Yes.Yes. No. No.
Yes.Yes.
Yes.
2 ProvideTechnicalAssistance/SupporttoLEAs 35 No. No.
Yes.Yes.
Yes. No.
Yes.Yes.
Yes.Yes.
Yes.Yes.
Yes.
3 EducatorPreparationProgramAccountability 25 No. No.
Yes.Yes.
Yes. No.
Yes.Yes.
Yes.Yes. No.
Yes. No.
4 UtilizeDataSystemstoInformEquitableAccessInitiatives 25 No.
Yes.Yes. No.
Yes.Yes. No.
Yes. No. No. No. No. No.
5 UtilizeDataSystemstoInformEquitableAccessInitiatives 24 Yes. No.
Yes.Yes. No. No.
Yes. No.
Yes.Yes. No. No. No.
6 ImproveInduction/MentoringPractices 24 No. No. No.v
Yes.Yes.
Yes. No.
Yes. No. No. No. No.
Yes.
7 ExpandProfessionalDevelopmentOpportunities 20 No.
Yes. No.
Yes.Yes.
Yes.Yes.
Yes.Yes. No. No. No. No.
8 SupportLEA’sHumanCapitalManagementStructure 20 No. No.
Yes.Yes. No. No. No. No. No. No. No.
Yes. No.
9 ProvideTeacherLeadershipandCareerPathwayOpportunities 18 No. No. No.
Yes. No. No. No. No. No. No.
Yes.Yes. No.
10 EstablishEducatorPreparationProgramPartnerships 16 Yes. No. No. No. No. No.
Yes. No. No. No. No. No. No.
11 RedesignandEnhanceEducatorEvaluationSystems 16 No. No.
Yes. No. No. No. No. No. No. No. No. No. No.
12 IncreaseorDifferentiateEducatorCompensation/Incentives
14 Yes. No.
Yes.Yes. No. No. No.
Yes. No.
Yes. No. No. No.
13 Establish“Grow-Your-Own”Programs 13 No. No. No. No. No. No.
Yes.Yes. No. No. No. No. No.
14 ImproveWorkingConditions/SchoolClimate 13 No. No. No. No. No. No.
Yes. No. No.
Yes. No. No. No.
15 StreamlineCertificationRequirements/Processes 12 No. No. No. No. No. No.
Yes. No. No. No. No.
Yes. No.
16 EstablishMoreEquitableFunding/ResourceAllocation 11 No. No. No. No. No. No. No.
Yes. No. No. No. No. No.

Equitable Access to Excellent Educators H-1
H Methods of Public Reporting by StateMethods of public reporting identified by each State in its Educator Equity Plan47
AppendixH Table 1 of 4 Alabama – Illinois
Methods of Public Reporting Total States AL AK AZ AR CA CO CT DE FL GA HI ID IL
1 Social Media 4 Yes. No. No. No. No. No. No. No. No. No. No. No. No.
2 State Website 37 Yes.Yes.
Yes.Yes. No. No.
Yes.Yes. No.
Yes.Yes.
Yes.Yes.
3 Presentations 7 No.
Yes. No.
Yes.Yes. No. No. No. No. No. No. No. No.
4 Webinars 6 No.
Yes.Yes. No. No. No. No. No. No. No. No. No.
Yes.
5 Reports 24 No.
Yes. No.
Yes.Yes. No. No.
Yes.Yes.
Yes.Yes. No. No.
AppendixH Table 2 of 4 Indiana – Montana
Methods of Public Reporting Total States IN IA KS KY LA ME MD MA MI MN MS MO MT
1 Social Media 4 No. No. No. No. No. No. No. No. No. No. No. No. No.
2 State Website 37 Yes.Yes.
Yes. No.
Yes.Yes. No.
Yes.Yes.
Yes.Yes. No.
Yes.
3 Presentations 7 No. No. No. No. No.
Yes. No. No.
Yes. No. No. No. No.
4 Webinars 6 No. No. No. No. No. No. No. No.
Yes. No. No. No. No.
5 Reports 24 Yes.Yes. No. No.
Yes.Yes.
Yes.Yes.
Yes. No.
Yes.Yes.
Yes.
47 Unspecified means that these States will publicly report progress; however, the method of reporting is not specified.

Equitable Access to Excellent Educators H-2
AppendixH Table 3 of 4 Nebraska – Rhode Island
Methods of Public Reporting Total States NE NV NH NJ NM NY NC ND OH OK OR PA RI
1 Social Media 4 No. No. No. No. No. No. No. No. No.
Yes. No.
Yes. No.
2 State Website 37 No. No.
Yes.Yes.
Yes. No.
Yes.Yes.
Yes. No.
Yes.Yes. No.
3 Presentations 7 No. No. No. No. No. No. No. No. No. No. No. No.
Yes.
4 Webinars 6 No. No. No. No. No. No. No. No. No. No. No. No. No.
5 Reports 24 Yes.Yes. No.
Yes. No. No. No. No. No. No. No.
Yes. No.
AppendixH Table 4 of 4 South Carolina – Wyoming | District of Columbia, Puerto Rico
Methods of Public Reporting Total States SC SD TN TX UT VT VA WA WV WI WY DC PR
1 Social Media 4 No. No. No. No.
Yes. No. No. No. No. No. No. No. No.
2 State Website 37 No. No. No.
Yes.Yes.
Yes.Yes.
Yes.Yes.
Yes.Yes. No.
Yes.
3 Presentations 7 No. No. No. No. No. No.
Yes. No. No. No. No. No. No.
4 Webinars 6 No. No. No. No. No. No.
Yes. No. No. No. No. No.
Yes.
5 Reports 24 No. No. No. No. No. No. No. No. No.
Yes. No.
Yes.Yes.

Equitable Access to Excellent Educators I-1
I Top Additional Key Terms
AppendixI Table 1 Top additional key terms defined in Education Equity Plans (by Number of States)
In addition to defining the required terms, States also defined and used additional key terms in their analyses of equity gaps. Due to the variance in terms used, this analysis coded the key terms used by the States into common groups (see Table below for definitions of common groups). For example, terms such as “beginning teacher” and “novice teacher,” used to describe new teachers, were coded “new teacher.” The table below lists the most commonly defined additional key terms. The table represents all of the key terms defined by States in their plans, including both terms that States used in analyzing their equity gaps and terms that States simply defined and did not use in their analyses. The term in the table labeled teacher is only used to represent teachers, and the term school leader is only used to represent administrators. Educators represent both teachers and administrators.
Coded Terms Definitions State Total States
Teacher Terms
Excellent Teacher States defined an excellent teacher as having one or more of the following characteristics:
• Demonstrates strong instructional practice• Makes significant contribution to student learning.• Holds valid certification in the content area(s) taught• Rated effective or highly effective by the evaluation system
20 AL, AZ, CT, DE, ID, IN, KS, MD, MA, MS, ND, NV, NJ, OR, PA, RI, TX, WA, WI, WV
Highly Qualified Teacher States defined a highly qualified teacher as having one or more of the following characteristics:
• Holds a bachelor’s degree• Holds full state certification• Demonstrates subject matter competence
14 AL, IA, MD, MA, MS, MT, NC, NH, PR, SD, TN, WA, WV, WY
Effective Rating A teacher and/or principal rated effective and above by an evaluation system
13 AZ, CO, IL, IA, KY, LA, MD, NC, NH, NM, NY, OK, VA
Excellent School Leader
States defined an excellent leader as having one or more of the following characteristics:
• Prepared to lead instructionally and administratively• Demonstrates strong leadership practices• Contributes to growth in student learning• Rated effective or highly effective by the evaluation system
12 AL, CT, DE, ID, IN, KS, NV, OR, PA, RI, WA, WV
Ineffective Rating A teacher and/or principal who receives the lowest rating in an evaluation system
11 AZ, CO, DC, IN, MD, MA, NC, NM, OH, RI, WV

Equitable Access to Excellent Educators I-2
Coded Terms Definitions State Total States
New Teacher A beginning teacher and/or teacher new to a state, district, or grade level
11 GA, IA, KY, NC, NE, NJ, NV, OK, PR, RI, WV
Highly Effective Rating A teacher and/or principal who receives the highest rating in an evaluation system
10 AZ, DC, FL, IA, IL, LA, MD, NY, NC, PA
Student Terms
English Learner Students whose first language is not English and who need assistance to perform classroom work in English
7 DE, KY, MA, MI, NJ, NV, NY
Students with Disabilities
Students identified as eligible to receive services for students with disabilities, under the provisions of the Individuals with Disabilities Education Act or Americans with Disabilities Act.
6 DE, MI, NV, NJ, NY, UT
Additional Terms
Equity Gap The higher rate at which low-income students and/or students of color or other student groups, such as English learners, are taught by inexperienced, unqualified, or out-of-field teachers than non-low-income students and non-students of color.
12 CT, HA, IN, MN, ND, NJ, NM, NV, OH, PA, SD, TN
Turnover The rate of teachers and/or principals who leave a school or district
10 AL, AR, GA, ID, KY, ME, NE, NY, OR, WY
Absenteeism The rate of teacher and/or principal absence 8 AZ, GA, ID, MA, MO, RI, TX, WY
Rural A school or district identified by the state as rural 7 CO, ME, MO, MT, NE, OK, VT

Equitable Access to Excellent Educators J-1
J Summative Overview of States’ Definitions of Required Terms
AppendixJ Table 1
State Inexperienced teacher (years)
Unqualified teacher (criteria)
Out-of-field teacher (criteria)
Poor student (criteria)
Minority student (subgroup)
Alabama Other State certification requirements
Certificate or licens-ing requirements FRL Not Caucasian
Alaska 1 year or less HQT HQT FRL Racial or Ethnic Minority
Arizona 2 or fewer years State certification requirements
Certificate or licens-ing requirements FRL Racial or Ethnic
Minority
Arkansas 1 year or less State certification requirements
Certificate or licens-ing requirements FRL Not Caucasian
California 2 or fewer years State certification requirements
Certificate or licens-ing requirements FRL Racial or Ethnic
Minority
Colorado 3 or fewer years State certification requirements Other FRL Not Caucasian
Connecticut 4 or fewer years State certification requirements
Certificate or licens-ing requirements FRL Not Caucasian
Delaware 2 or fewer years HQT HQT FRL and other Not Caucasian
District of Columbia 1 year or less Other HQT FRL and other Racial or Ethnic Minority
Florida 4 or fewer years HQT HQT FRL Not Caucasian
Georgia 1 year or less State certification requirements HQT FRL Racial or Ethnic
Minority
Hawaii 1 year or less State certification requirements HQT FRL Racial or Ethnic
Minority
Idaho 1 year or less HQT Certificate or licens-ing requirements FRL Racial or Ethnic
Minority
Illinois 1 year or less State certification requirements
Certificate or licens-ing requirements FRL Not Caucasian
Indiana 1 year or less HQT Certificate or licens-ing requirements FRL Racial or Ethnic
Minority
Iowa 2 or fewer years State certification requirements
Certificate or licens-ing requirements FRL Racial or Ethnic
Minority

Equitable Access to Excellent Educators J-2
State Inexperienced teacher (years)
Unqualified teacher (criteria)
Out-of-field teacher (criteria)
Poor student (criteria)
Minority student (subgroup)
Kansas 3 or fewer years State certification requirements
Certificate or licens-ing requirements FRL Not Caucasian
Kentucky 1 year or less State certification requirements
Certificate or licens-ing requirements FRL Racial or Ethnic
Minority
Louisiana 1 year or less State certification requirements
Certificate or licens-ing requirements FRL and other Racial or Ethnic
Minority
Maine 3 or fewer years State certification requirements
Certificate or licens-ing requirements FRL Not Caucasian
Maryland 3 or fewer years State certification requirements
Certificate or licens-ing requirements FRL Not Caucasian
Massachusetts 1 year or less State certification requirements HQT FRL Racial or Ethnic
Minority
Michigan 3 or fewer years State certification requirements
Certificate or licens-ing requirements FRL and other Racial or Ethnic
Minority
Minnesota 3 or fewer years State certification requirements
Certificate or licens-ing requirements FRL Racial or Ethnic
Minority
Mississippi 3 or fewer years State certification requirements
Certificate or licens-ing requirements FRL Racial or Ethnic
Minority
Missouri 1 year or less State certification requirements
Certificate or licens-ing requirements FRL Not Caucasian
Montana 1 year or less State certification requirements
Certificate or licens-ing requirements FRL Not Caucasian
Nebraska 1 year or less State certification requirements
Certificate or licens-ing requirements FRL Not Caucasian
Nevada 1 year or less State certification requirements
Certificate or licens-ing requirements FRL Not Caucasian
New Hampshire 3 or fewer years State certification requirements HQT FRL Not Caucasian
New Jersey 1 year or less HQT Certificate or licens-ing requirements FRL Racial or Ethnic
Minority
New Mexico Other State certification requirements
Certificate or licens-ing requirements FRL Includes other sub-
groups
New York 1 year or less HQT Certificate or licens-ing requirements FRL and other Not Caucasian
North Carolina 1 year or less HQT HQT FRL Racial or Ethnic Minority
North Dakota 3 or fewer years State certification requirements HQT FRL Racial or Ethnic
Minority
Ohio 2 or fewer years HQT Certificate or licens-ing requirements FRL Racial or Ethnic
Minority
Oklahoma 3 or fewer years State certification requirements HQT FRL Not Caucasian
Oregon 1 year or less State certification requirements
Certificate or licens-ing requirements FRL Racial or Ethnic
Minority

Equitable Access to Excellent Educators J-3
State Inexperienced teacher (years)
Unqualified teacher (criteria)
Out-of-field teacher (criteria)
Poor student (criteria)
Minority student (subgroup)
Pennsylvania 1 year or less State certification requirements
Certificate or licens-ing requirements FRL Includes other sub-
groups
Puerto Rico 1 year or less HQT Certificate or licens-ing requirements Other Includes other sub-
groups
Rhode Island 2 or fewer years State certification requirements
Certificate or licens-ing requirements FRL Racial or Ethnic
Minority
South Carolina 3 or fewer years State certification requirements
Certificate or licens-ing requirements FRL and other Not Caucasian
South Dakota 3 or fewer years HQT Certificate or licens-ing requirements FRL Includes other sub-
groups
Tennessee 3 or fewer years State certification requirements
Certificate or licens-ing requirements FRL Includes other sub-
groups
Texas 1 year or less HQT Certificate or licens-ing requirements FRL Not Caucasian
Utah 1 year or less State certification requirements
Certificate or licens-ing requirements FRL Not Caucasian
Vermont 1 year or less HQT Certificate or licens-ing requirements FRL Not Caucasian
Virginia 1 year or less HQT Certificate or licens-ing requirements FRL Not Caucasian
Washington 5 or fewer years State certification requirements
Certificate or licens-ing requirements FRL Not Caucasian
West Virginia 3 or fewer years HQT Certificate or licens-ing requirements FRL Racial or Ethnic
Minority
Wisconsin 3 or fewer years State certification requirements
Certificate or licens-ing requirements FRL Racial or Ethnic
Minority
Wyoming 3 or fewer years State certification requirements Other FRL Not Caucasian

Equitable Access to Excellent Educators K-1
K State Equity Profiles
The State profiles provide a brief overview of each State’s Educator Equity Plan. The profiles serve as a resource that displays a quick, at-a-glance view of each State’s approach to eliminating the identified equity gaps. Using language directly from each State plan, the profiles convey the State’s equity goals or theory of action. Although there are often not direct links among States’ equity gaps, root causes, strategies, and implementation or performance measures, key points extracted from the plans are used in the profiles to show alignment among these sections where possible. Because States used definitions of key terms to inform identification of their equity gaps, this analysis provides a list of the additional key terms States defined beyond the required terms.
The profiles highlight States’ implementation or performance measures as well as the ways they will publicly report progress. Additionally, the profiles describe how States engaged stakeholders throughout the development, implementation and ongoing process of achieving equitable access to excellent educators.
It is important to note that the profiles convey just a snapshot of each State’s equity story; by clicking on the link in the “More Information” section of each profile, readers can view the full details of each State’s Educator Equity Plan.

EQUITY PLAN OVERVIEW
ALABAMA
ANALYSIS
GAPS
STRATEGIES
MEASURES
ROOTCAUSES
DEFINITIONS
ENGAGEMENT
PUBLIC REPORTING
“Alabama is committed to improving the student outcomes for all
students; therefore, this plan’s purpose is to improve access to
excellent educators that are highly qualified for Alabama’s most
disadvantaged youth without decreasing our focus on the need for
high-quality educators for all local education agencies (LEAs), schools,
and classrooms. It is our aim to narrow and ultimately eliminate the
gap between the number and percentage of highly qualified teachers
in the State’s high-poverty and low-poverty schools” (Alabama State
Department of Education, 2015, p. 2).
STAKEHOLDER ENGAGEMENT
• “The ALSDE has involved stakeholders from the beginning and will continue to do so through a statewide Educator Equity Coalition of key stakeholder groups that will oversee the long-term implementation of and improvement of this plan” (p. 3).
• “The statewide committee supported the planning of three public stakeholder meetings in each of the three regions in Alabama: southern, central and northern” (p. 5).
• “The purpose of the meetings was to accomplish the following:
− Review data and serve as advisors on interpreting the data and root causes behind Alabama’s equity gaps using the Center on Great Teachers and Leaders resource titled Resource 7: Engaging Stakeholders in a Root Cause Analysis (http://www.gtlcenter.org/learning-hub/equitable-access-toolkit/stakeholder-engagement-guide)
− Identify and prioritize the root cause of inequities in access to excellent teachers and leaders
− Review and provide feedback on the draft plan” (p. 5).
Equity Plan Overview ALABAMA K-2
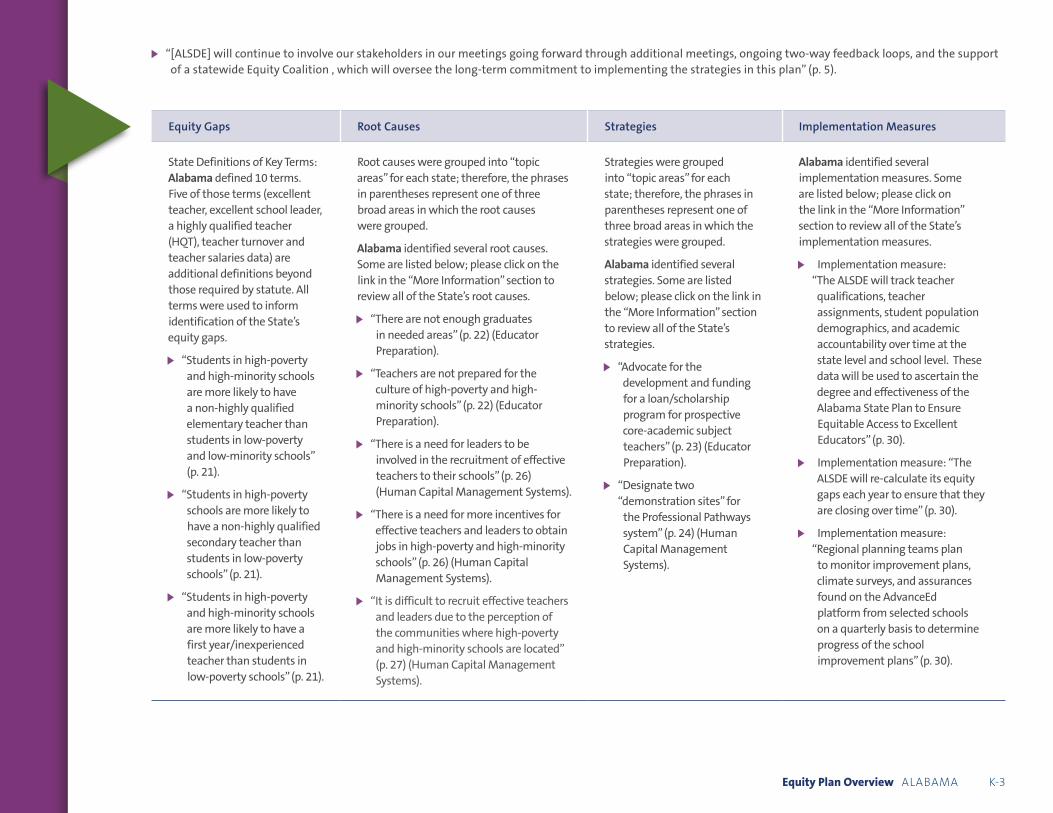
• “[ALSDE] will continue to involve our stakeholders in our meetings going forward through additional meetings, ongoing two-way feedback loops, and the supportof a statewide Equity Coalition , which will oversee the long-term commitment to implementing the strategies in this plan” (p. 5).
Equity Plan Overview ALABAMA K-3
Equity Gaps
State Definitions of Key Terms: Alabama defined 10 terms. Five of those terms (excellent teacher, excellent school leader, a highly qualified teacher (HQT), teacher turnover and teacher salaries data) are additional definitions beyond those required by statute. All terms were used to inform identification of the State’s equity gaps.
• “Students in high-povertyand high-minority schools are more likely to have a non-highly qualified elementary teacher than students in low-poverty and low-minority schools” (p. 21).
• “Students in high-povertyschools are more likely to have a non-highly qualified secondary teacher than students in low-poverty schools” (p. 21).
• “Students in high-povertyand high-minority schools are more likely to have a first year/inexperienced teacher than students in low-poverty schools” (p. 21).
Root Causes
Root causes were grouped into “topic areas” for each state; therefore, the phrases in parentheses represent one of three broad areas in which the root causes were grouped.
Alabama identified several root causes. Some are listed below; please click on the link in the “More Information” section to review all of the State’s root causes.
• “There are not enough graduatesin needed areas” (p. 22) (Educator Preparation).
• “Teachers are not prepared for the culture of high-poverty and high-minority schools” (p. 22) (Educator Preparation).
• “There is a need for leaders to be involved in the recruitment of effective teachers to their schools” (p. 26) (Human Capital Management Systems).
• “There is a need for more incentives foreffective teachers and leaders to obtain jobs in high-poverty and high-minority schools” (p. 26) (Human Capital Management Systems).
• “It is difficult to recruit effective teachers and leaders due to the perception of the communities where high-poverty and high-minority schools are located” (p. 27) (Human Capital Management Systems).
Strategies
Strategies were grouped into “topic areas” for each state; therefore, the phrases in parentheses represent one of three broad areas in which the strategies were grouped.
Alabama identified several strategies. Some are listed below; please click on the link in the “More Information” section to review all of the State’s strategies.
• “Advocate for the development and funding for a loan/scholarship program for prospective core-academic subject teachers” (p. 23) (Educator Preparation).
• “Designate two “demonstration sites” for
the Professional Pathways system” (p. 24) (Human Capital Management Systems).
Implementation Measures
Alabama identified several implementation measures. Some are listed below; please click on the link in the “More Information” section to review all of the State’s implementation measures.
• Implementation measure:“The ALSDE will track teacher qualifications, teacher assignments, student population demographics, and academic accountability over time at the state level and school level. These data will be used to ascertain the degree and effectiveness of the Alabama State Plan to Ensure Equitable Access to Excellent Educators” (p. 30).
• Implementation measure: “The ALSDE will re-calculate its equity gaps each year to ensure that theyare closing over time” (p. 30).
• Implementation measure:“Regional planning teams plan
to monitor improvement plans, climate surveys, and assurances found on the AdvanceEd platform from selected schools on a quarterly basis to determine progress of the school improvement plans” (p. 30).

Equity Plan Overview ALABAMA K-4
Equity Gaps Root Causes
• “It is difficult to retain effective teachers due to the student behavior issues” (p. 27) (Conditions).
• “There are not enough effective teachers and leaders located in high-poverty and high-minority areas” (p. 29) (Human Capital Management Systems).
• “There are not enough effective teachers and leaders in certain content areas such as math and science” (p. 29) (Human Capital Management Systems).
• “There is a need for more professional learning for inexperienced teachers who are not prepared to teach students in high-poverty and high-minority schools” (p. 30) (Human Capital Management Systems).
• “There is not enough preparation for teachers for students who are not on grade level” (p. 30) (Educator Preparation).
• “There is not enough preparation for teachers with students who have special needs” (p. 30) (Educator Preparation).
Strategies
• “Improve and expand the induction and mentoring program” (p. 26) (Human Capital Management Systems).
• “Assist LEA staff in developing community partnerships that will provide community-based incentives to highly qualified core academic subjects teachers who agree to work in hard to staff schools and live in the schools’ communities” (p. 27) (Human Capital Management Systems).
• “Advocate for critically reviewing alternate funding streams…” (p. 28) (Human Capital Management Systems).
Implementation Measures
• Implementation measure: “Quarterly reports of teacher qualifications and assignments by LEA, grade range, and core academic subject will be generated and disseminated to designated ALSDE staff” (p. 30)

Equity Plan Overview ALABAMA K-5
PUBLIC REPORTING OF PROGRESS
“ Alabama commits to some form of annual public reporting on progress toward addressing root causes to eliminate equity gaps that will include posting a progress report on the ALSDE Web site, sending the link to all LEAs and stakeholders, and informing the public through statewide media. Alabama will formally update this plan every three years based on new data, new analyses of root causes, and new strategies. Public reporting will occur annually and will provide information regarding the progress in eliminating the equity gaps. The report on the measures will indicate whether or not the equity gaps are closing” (p. 31).
More InformationFor more information, download the Alabama Equity plan.
Source: Alabama State Department of Education. (2015). Alabama state plan to ensure equitable access to excellent educators. Retrieved from http://www2.ed.gov/programs/titleiparta/equitable/alequityplan92815.pdf

EQUITY PLAN OVERVIEW
ALASKA
ANALYSIS
GAPS
STRATEGIES
MEASURES
ROOTCAUSES
DEFINITIONS
ENGAGEMENT
PUBLIC REPORTING
“In addition, the plan provides the measures that the EED will use to
evaluate and publicly report on the progress of the State’s Educator
Equity Plan with respect to such steps. EED plans to continually
improve the Equity Plan in collaboration with education stakeholders”
(Alaska Department of Education & Early Development, 2015, p. 2).
“In contrast, the current Alaska Equity Plan focuses on ensuring that
all classrooms are taught by excellent teachers, recognizing that
there are multiple important dimensions of educator excellence
(e.g., qualifications, expertise, performance, and effectiveness in
improving academic achievement). As more data become available,
our plan could develop over time from being input focused
(qualifications and expertise) to outcome focused (performance
and improving student achievement)” (p. 4).
STAKEHOLDER ENGAGEMENT
• “EED itself often serves as a stakeholder in other Alaska organizations efforts around Educator Quality. This plan considers the extensive input gathered from Alaskans by these other organizations. EED leverage these reports and surveys to avoid unnecessary duplication of efforts in the state” (p. 6).
• “EED has also engaged in some preliminary stakeholder engagement in the design of this plan. The stakeholders include internal state agency members of the Teaching and Learning Support staff, existing stakeholder groups with scheduled spring 2015 meetings, and specialized stakeholder groups (as described below)” (p. 6).
Equity Plan Overview ALASKA K-6

• “Alaska recognizes the need for more comprehensive stakeholder engagement in the further development of this plan. More comprehensive external stakeholder engagement using scheduled fall 2015 meetings will be a focus during Phase One – Awareness” (p. 6).
• “EED leveraged an existing stakeholder group containing representations of parents, teachers, principals, human resource personnel and district administrators (e.g. The Title I Committee of Practitioners). Next, we reached
out to existing stakeholder groups with district representation that would be directly instrumental in the implementation of efforts to increase the equitable distribution of educators” (p. 6).
• “EED will continue to engage stakeholders in our activities going forward. We will provide all identified stakeholders with regular updates on our progress and opportunities to comment, which will inform our long-term commitment to implementing the strategies in this plan” (p. 8).
Equity Plan Overview ALASKA K-7
Equity Gaps
State Definitions of Key Terms: Alaska defined 6 terms. One of those terms (teacher new to the district) is an additional definition beyond those required by statute. All terms were used to inform identification of the State’s equity gaps.
• “Low-income students were 1.8 times more likely to be placed with first-year teachers than students in the quartile of schools with the lowest percentage of low-income students” (p. 11).
• “Low-income students were 2.3 times more likely to be placed with teachers new to the district than students in the quartile of schools with the lowest percentage of low-income students” (p. 11).
Root Causes
Root causes were grouped into “topic areas” for each state; therefore, the phrases in parentheses represent one of three broad areas in which root causes were grouped.
• “Stakeholders cited lack of incentives for teachers in remote rural schools to stay” (p. 20) (Human Capital Management Systems).
• “The conditions in remote rural Alaska include a shortage of adequate housing, high living costs, isolation, difficulties and cost of travel, and limited access to medical care” (p. 20) (Conditions).
Strategies
Strategies were grouped into “topic areas” for each state; therefore, the phrases in parentheses represent one of three broad areas in which strategies were grouped.
• “Awareness of Access to Excellent Teachers” (p. 22) (Human Capital Management Systems).
• “Preparation of Teachers” (p. 22) (Educator Preparation).
Implementation Measures
Alaska identified several implementation measures. Some are listed below; please click on the link in the “More Information” section to review all of the State’s implementation measures.
• “The timelines and milestones for implementing the strategies and closing the equity gaps will be developed in collaboration with our stakeholders during phase one of our plan” (p. 24).
• “During the summer of 2015, a plan to support the targeted school will be developed to minimize duplication of district planning efforts” (p. 26).

Equity Plan Overview ALASKA K-8
Equity Gaps
• “Minority students were 2 times more likely to be placed with first-year teachers than students in the quartile of schools with the lowest percentage of minority students” (p. 11).
• “Minority students were 3.3 times more likely to be placed with teachers new to the district than students in the quartile of schools with the lowest percentage of minority students” (p. 11).
• “Low-income students were 1.7 times more likely to be taught a core content course by a teacher who was not highly qualified than students in the quartile of schools with the lowest percentage of minority students” (p. 12).
• “Minority students were 1.7 times more likely to be taught a core content course by a teacher who was not highly qualified than students in the quartile of schools with the lowest percentage of minority students” (p. 12).
Root Causes
• “Stakeholders frequently mentioned the need for more qualified applicants that are prepared for the unique teaching situations inherent in Alaska’s remote schools. Teaching positions in these locations require teachers who are able to teach multi-grade classrooms in elementary settings and subjects beyond what they have been trained to teach in secondary settings. Finding teachers with that skill set, experience, and disposition to meet the need of Alaska’s rural remote schools is a challenge for our human resource managers” (p. 20) (Human Capital Management Systems).
Strategies
• “Recruitment of Teachers” (p. 23) (Human Capital Management Systems).
• “Support of Teachers and Leaders (Retention)” (p. 23) (Human Capital Management Systems).
Implementation Measures
• “EED will meet with our 12 targeted districts annually prior to hiring season. The annual meeting will provide the targeted districts the opportunity to review their equity profile, identify intra-district equity gaps, and explore possible strategies around retention and recruitment. The annual meeting will also be open to other interested districts” (p. 26).
• “During summer of 2016, a TLS internal team will create an annual report on the equity plan progress. The report will review ESEA monitoring results, update implementation timeline for Year Two, and changes needed for the annual Certified Staff Accounting Data Collection” (p. 26).

Equity Plan Overview ALASKA K-9
PUBLIC REPORTING OF PROGRESS
• “EED will initially focus on existing communication strategies, including our website, newsletters, committee meetings, and presentations at educational conferences and meetings” (p. 29).
• “Using the same data sources described on page 10, the department will recalculate the state-wide information in Table 3 annually. The updated
information will be used to report to stakeholders, assist in ongoing gap analysis, and provide insight as to the efficacy of the State’s and districts’ strategies to address root causes” (p. 29).
• “Districts will be encouraged to use the annual data to monitor and report progress within their district” (p. 29).
More InformationFor more information, download the Alaska Equity plan.
Source: Alaska Department of Education and Early Development. (2015). Equitable access to excellent educators plan for Alaska. Retrieved from http://www2.ed.gov/programs/titleiparta/equitable/akequityplan100915.pdf

EQUITY PLAN OVERVIEW
ARIZONA
ANALYSIS
GAPS
STRATEGIES
MEASURES
ROOTCAUSES
DEFINITIONS
ENGAGEMENT
PUBLIC REPORTING
“ADE recognizes that Arizona’s educators are the most important
school-related component of success for Arizona’s students and is
committed to the goal that students of color, students in
economically disadvantaged areas and students with special needs
are not taught by inexperienced or ineffective educators at higher
rates than students outside those demographics. ADE further
recognizes that leadership is an equally important component of a
quality education and also seeks to meet a goal that schools with
students in the previously mentioned underserved populations are
not led by unqualified or ineffective administrators” (Arizona
Department of Education, 2015, p. 3).
STAKEHOLDER ENGAGEMENT
• “ADE assembled a team within its Highly Effective Teacher and Leaders Division charged with researching and examining the impact of this issue. The team attended webinars and national conferences, researched state and national data, and then organized a series of Town Hall meetings in spring 2015 to examine root causes, discuss potential strategies and continually gather feedback. The team was also able to be on the agenda of a variety of community, business, and government policy groups to present and gather feedback on the issue” (p. 7).
• “Additional stakeholder involvement will take the form of biannual conference calls or interactive webinars during which stakeholders are updated on the plan’s progress as well as the latest equity gap data. ADE could also use this forum to solicit feedback on how to continue to address equitable access to experienced & effective teachers in the nine profiled districts as well as across the state” (p. 10).
Equity Plan Overview ARIZONA K-10

Equity Plan Overview ARIZONA K-11
Equity Gaps
State Definitions of Key Terms: Arizona defined 13 terms. Eight of those terms (teacher, veteran or experienced, absenteeism, excellent, highly effective, effective, developing and ineffective) are additional definitions beyond those required by statute. All terms were used to inform identification of the State’s equity gaps.
For additional information about Arizona’s other gaps, please click on the link in the “More Information” section.
• In the quartile of schools with the highest percentage of economically disadvantage students, 27.2 percent of teachers were inexperienced, compared to 16.6 percent of teachers in the quartile of schools with the lowest percentage of economically disadvantage students (p. 17).
• In the quartile of schools with the highest percentage of students of color, 27.9 percent of teachers were inexperienced, compared to 16.1 percent of teachers in the quartile of schools with the lowest percentage of students of color (p. 17).
• In the quartile of schools with the highest percentage of economically disadvantage students, 14.4 percent of teachers were developing/ineffective, compared to 7 percent of teachers in the quartile of schools with the lowest percentage of economically disadvantage students (p. 17).
• In the quartile of schools with the highest percentage of students of color, 13.3 percent of teachers were developing/ineffective, compared to 7 percent of teachers in the quartile of schools with the lowest percentage of students of color (p. 17).
Root Causes
Root causes were grouped into “topic areas” for each state; therefore, the phrases in parentheses represent one of the three broad areas in which root causes were grouped.
Arizona identified several root causes. Some are listed below; please click on the link in the “More Information” section to review all of the State’s root causes.
• “Insufficient Support” (p. 46) (Human Capital Management Systems).
• “Leadership pathways” (p. 46) (Human Capital Management Systems).
• “Limited content training or knowledge of evaluators” (p. 44) (Human Capital Management Systems).
• “Lower Performing Schools Rate Teachers Mostly Effective and Highly Effective” (p. 44) (Human Capital Management Systems).
• “Overall perception of the field” (p. 47) (Conditions).
• “Reduced pipeline of new teacher candidates” (p. 46) (Educator Preparation).
• “Salary increases in neighboring states, competition with neighboring districts and charter schools” (p. 46) (Human Capital Management Systems).
Strategies
Strategies were grouped into “topic areas” for each state; therefore, the phrases in parentheses represent one of three broad areas in which strategies were grouped.
Arizona identified several strategies. Some are listed below; please click on the link in the “More Information” section to review all of the State’s strategies.
• “Ongoing professional training for admin-istrators and evaluators” (p. 44) (Human Capital Management Systems).
• “Human Capital Management Systems for Teacher Retention and Recruitment” (p. 46) (Human Capital Management Systems).
• “Change the perception of the profession” (p. 48) (Conditions).
Performance Measures
Arizona identified several performance measures. Some are listed below; please click on the link in the “More Information” section to review all of the State’s performance measures.
• “By June 30, 2017, twenty-five percent (25%) of Arizona LEAs will have conducted district-level Human Capital Management Systems (HCMS) policy scans and gap analyses to gauge the comprehensiveness and alignment of their educator effectiveness policies, with the assistance of an ADE team if needed” (p. 45).
• “By June 30, 2016, ADE Certification Unit will have online application services available for all new certification and re-certification applicants” (p. 47).
• “By June 30, 2017, ADE will collaborate with Arizona higher education institutions, parent associations and community organizations to develop plans and incentives for promoting the profession and increasing the number of candidates seeking certification” (p. 47).

Equity Gaps
• In the quartile of schools with the highest percentage of economically disadvantage students, 10.3 percent of teachers were out-of-field, compared to 11 percent of teachers in the quartile of schools with the lowest percentage of economically disadvantage students (p.17).
• In the quartile of schools with the highest percentage of students of color, 12.5 percent of teachers were out-of-field, compared to 9 percent of teachers in the quartile of schools with the lowest percentage of students of color (p. 17).
Root Causes
• “Varying use of instruments” (p. 44).
• “Working conditions” (p. 46) (Conditions).
Strategies
Performance Measures
• “By June 30, 2016, ADE will investigate ways to increase the positive perception of the education profession by working with parent groups, state business leaders, education groups, and other interested parties to create a marketing plan highlighting the positive characteristics of teaching and education in general in Arizona targeted toward high school students and the general public through social media” (p. 49).
• “By July 1, 2017, ADE and institutes of higher education will develop a research-based teacher leadership program” (p. 49).
Equity Plan Overview ARIZONA K-12

PUBLIC REPORTING OF PROGRESS
• “Public reporting of this project will consist initially of information posted on the agency’s website” (p. 51).
• “The ADE team meets regularly with various Communities of Practice who are made up of various community leaders, experts, and practitioners. The
small group structure of these communities allows for quick dissemination of information and interactive opportunities to respond to questions and concerns. The team will continue to use these communities to update district leaders and the community on its progress” (p. 51).
Equity Plan Overview ARIZONA K-13
More InformationFor more information, download the Arizona Equity plan.
Source: Arizona Department of Education. (2015). Ensuring equitable access to excellent educators in Arizona (revised). Retrieved from http://www2.ed.gov/programs/titleiparta/equitable/azequityplan100715.pdf

EQUITY PLAN OVERVIEW
ARKANSAS
ANALYSIS
GAPS
STRATEGIES
MEASURES
ROOTCAUSES
DEFINITIONS
ENGAGEMENT
PUBLIC REPORTING
“In communicating the strategies and efforts detailed in this plan,
we have been asked, “What makes this different from things that
we have tried in the past?’’ The Arkansas Department of Education
will focus its efforts to transform our educator workforce by
focusing on attracting, preparing, supporting, developing, and
retaining the most effective educators to serve the students of
Arkansas. None of the strategies in this plan involve a new program
or a one-shot fix to education. Instead, this plan focuses on
identified existing strategies that:
• (1) should be continued because they are already preventing
equity gaps from increasing,
• (2) could reduce equity gaps if improved, enhanced, or
expanded; or
• (3) with additional research, will show evidenced-based
strategies that are likely to reduce equity gaps by addressing
the root causes previously identified” (Arkansas Department of
Education, 2015, p. 2).
STAKEHOLDER ENGAGEMENT
• “This document is a summary of Arkansas’s Equitable Access plan. All of the work for this plan has been done in collaboration with multiple stakeholder groups. The plan will serve as a roadmap or guide to ongoing efforts to provide excellent educators for all of Arkansas’s students” (p. 2).
Equity Plan Overview ARKANSAS K-14
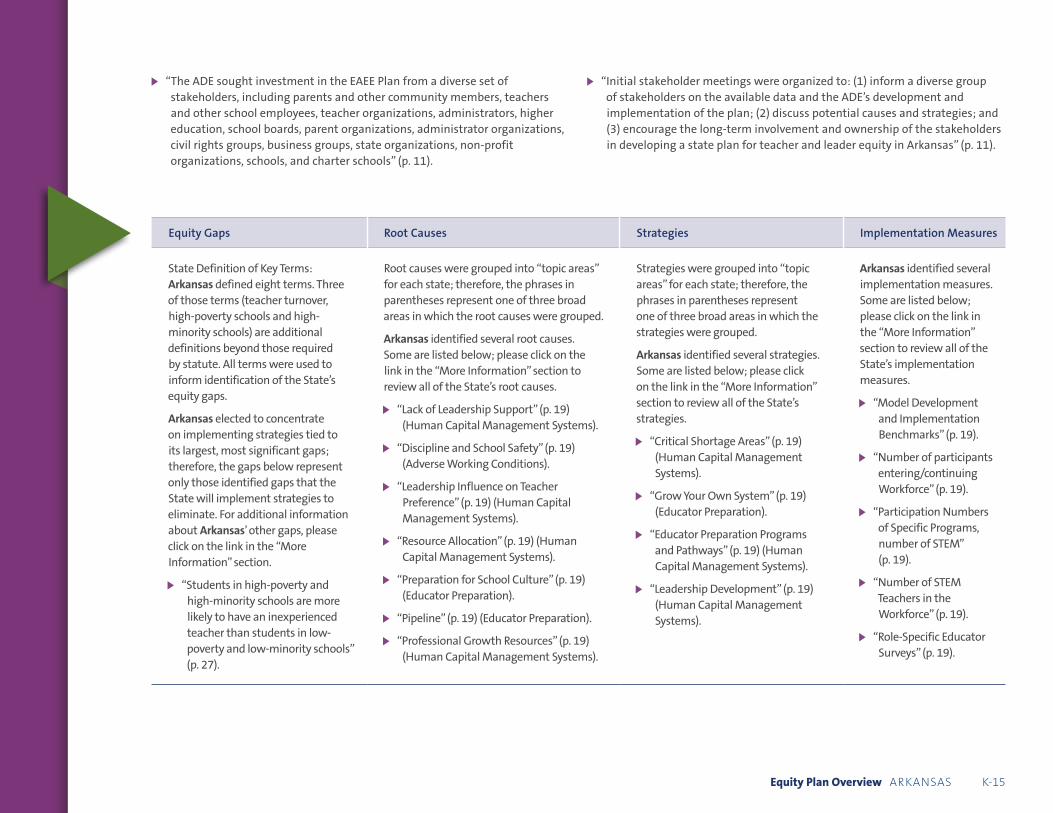
• “The ADE sought investment in the EAEE Plan from a diverse set of stakeholders, including parents and other community members, teachers and other school employees, teacher organizations, administrators, higher education, school boards, parent organizations, administrator organizations, civil rights groups, business groups, state organizations, non-profit organizations, schools, and charter schools” (p. 11).
• “Initial stakeholder meetings were organized to: (1) inform a diverse group of stakeholders on the available data and the ADE’s development and implementation of the plan; (2) discuss potential causes and strategies; and (3) encourage the long-term involvement and ownership of the stakeholders in developing a state plan for teacher and leader equity in Arkansas” (p. 11).
Equity Plan Overview ARKANSAS K-15
Equity Gaps
State Definition of Key Terms: Arkansas defined eight terms. Three of those terms (teacher turnover, high-poverty schools and high-minority schools) are additional definitions beyond those required by statute. All terms were used to inform identification of the State’s equity gaps.
Arkansas elected to concentrate on implementing strategies tied to its largest, most significant gaps; therefore, the gaps below represent only those identified gaps that the State will implement strategies to eliminate. For additional information about Arkansas’ other gaps, please click on the link in the “More Information” section.
• “Students in high-poverty and high-minority schools are more likely to have an inexperienced teacher than students in low-poverty and low-minority schools” (p. 27).
Root Causes
Root causes were grouped into “topic areas” for each state; therefore, the phrases in parentheses represent one of three broad areas in which the root causes were grouped.
Arkansas identified several root causes. Some are listed below; please click on the link in the “More Information” section to review all of the State’s root causes.
• “Lack of Leadership Support” (p. 19) (Human Capital Management Systems).
• “Discipline and School Safety” (p. 19) (Adverse Working Conditions).
• “Leadership Influence on Teacher Preference” (p. 19) (Human Capital Management Systems).
• “Resource Allocation” (p. 19) (Human Capital Management Systems).
• “Preparation for School Culture” (p. 19) (Educator Preparation).
• “Pipeline” (p. 19) (Educator Preparation).
• “Professional Growth Resources” (p. 19) (Human Capital Management Systems).
Strategies
Strategies were grouped into “topic areas” for each state; therefore, the phrases in parentheses represent one of three broad areas in which the strategies were grouped.
Arkansas identified several strategies. Some are listed below; please click on the link in the “More Information” section to review all of the State’s strategies.
• “Critical Shortage Areas” (p. 19) (Human Capital Management Systems).
• “Grow Your Own System” (p. 19) (Educator Preparation).
• “Educator Preparation Programs and Pathways” (p. 19) (Human Capital Management Systems).
• “Leadership Development” (p. 19) (Human Capital Management Systems).
Implementation Measures
Arkansas identified several implementation measures. Some are listed below; please click on the link in the “More Information” section to review all of the State’s implementation measures.
• “Model Development and Implementation Benchmarks” (p. 19).
• “Number of participants entering/continuing Workforce” (p. 19).
• “Participation Numbers of Specific Programs, number of STEM” (p. 19).
• “Number of STEM Teachers in the Workforce” (p. 19).
• “Role-Specific Educator Surveys” (p. 19).

Equity Gaps Root Causes Strategies Implementation Measures
• “Students in high-poverty schools are more likely to have an out-of-field teacher than students in low-poverty schools” (p. 27).
• “There is a higher rate of teacher turnover in high-minority schools based on data for the last five years for average number of new teachers per school per year” (p. 27).
• “Community Resources” (p. 19) (Human Capital Management Systems).
• “Excellent Leadership Retention” (p. 19) (Human Capital Management Systems).
• “Geographic Isolation” (p. 19) (Human Capital Management Systems).
• “Recruitment Incentives” (p. 19) (Conditions).
• “Teacher Leadership” (p. 19) (Human Capital Management Systems).
• “Awareness and Communication” (p. 19) (Human Capital Management Systems).
• “Data-Driven Decision Making” (p. 19) (Human Capital Management Systems).
• “Data Reports and Visualizations” (p. 19).
• “BloomBoard Reports” (p. 19).
PUBLIC REPORTING OF PROGRESS
• “Annual public reporting on progress toward addressing root causes to eliminate equity gaps will include posting a progress report on the ADE website, sending the link to all LEAs and stakeholders, and scheduling a conversation with major news media” (p. 50).
• “Every two years ADE will formally update this plan based on new data, new analyses of root causes, and new strategies” (p. 50).
More InformationFor more information, download the Arkansas Equity plan.
Source: Arkansas Department of Education. (2015). Equitable access to excellent educators plan. Retrieved from http://www2.ed.gov/programs/titleiparta/equitable/arequityplan081315.pdf
Equity Plan Overview ARKANSAS K-16

EQUITY PLAN OVERVIEW
CALIFORNIA
ANALYSIS
GAPS
STRATEGIES
MEASURES
ROOTCAUSES
DEFINITIONS
ENGAGEMENT
PUBLIC REPORTING
“California has long been committed to working with diverse
stakeholders to provide a high quality education to all students
regardless of socioeconomic status or background. Educational equity
has been a thoughtfully and deliberatively discussed priority for many
years. The State is already implementing a number of ambitious and
proactive research-based strategies and initiatives designed to achieve
the objectives described in the ESEA, but more need to be done. We
plan to leverage and expand upon this work to recruit, prepare, and
maintain a highly skilled educator workforce for the benefit of all
students and to promote equitable access to an excellent education
for students from historically underserved communities, in particular”
(California Department of Education, 2015, p. 3).
STAKEHOLDER ENGAGEMENT
• “CDE, SBE [State Board of Education], and the California Commission on Teacher Credentialing (CTC) staff had the opportunity to engage with stakeholders regarding equitable access to excellent educators on three separate occasions prior to the submission of this plan” (p. 13).
• “The CDE will convene an annual Educator Equity meeting to ensure that the plan is implemented well and to leverage the expertise of California’s diverse stakeholders in improving equitable access to excellent educators as new opportunities and challenges emerge. At this annual meeting, stakeholders will review new data regarding equitable access to excellent educators and make adjustments to the strategies contained in this plan as appropriate” (p. 15).
• “The CDE will convene stakeholders annually to review this data, examine equity gaps, and identify opportunities to improve upon strategies. Using this information, the CDE will prepare a report on the progress of the California State Plan to Ensure Equitable Access to Excellent Educators, present it to the SBE on an annual basis, and post the plan on its Web pages” (p. 50).
Equity Plan Overview CALIFORNIA K-17

Equity Plan Overview CALIFORNIA K-18
Equity Gaps
State Definitions of Key Terms: California defined 6 terms. One of those terms (intern teacher) is an additional definition beyond those required by statute. All terms were used to inform identification of the State’s equity gaps.
California elected to concentrate on implementing strategies tied to its largest, most significant gaps; therefore, the gaps below represent only those identified gaps that the State will implement strategies to eliminate. For additional information about California’s other gaps, please click on the link in the “More Information” section.
• “Equity Gap #1: Inexperienced teachers serve SED [socioeconomically disadvantaged] students at higher rates than students with higher socioeconomic status” (p. 17).
Root Causes
Root causes were grouped into “topic areas” for each state; therefore, the phrases in parentheses represent one of three broad areas in which root causes were grouped.
California identified several root causes. Some are listed below; please click on the link in the “More Information” section to review all of the State’s root causes.
• “Uneven teacher preparation and induction” (p. 27) (Educator Preparation).
• “Uneven administrator preparation and induction” (p. 27) (Educator Preparation).
• “Inadequate support for educator professional learning” (p. 27) (Human Capital Management Systems).
• “Challenging working conditions in high-need schools” (p. 27) (Conditions).
Strategies
Strategies were grouped into “topic areas” for each state; therefore, the phrases in parentheses represent one of three broad areas in which strategies were grouped.
California identified several strategies. Some are listed below; please click on the link in the “More Information” section to review all of the State’s strategies.
• “Implement Teaching Performance Assessments (TPA)” (p. 28) (Other).
• “Strengthen and Streamline Accreditation” (p. 29) (Educator Preparation).
• “Increase Support for Teacher Induction” (p. 30) (Conditions).
• “Refresh the California Professional Standards for Education Leaders (CPSEL) and Descriptions of Practice (DOP)” (p. 31) (Other).
• “Disseminate and Promote Integrated Professional Learning System Work” (p. 38) (Human Capital Management Systems).
Implementation Measures
California identified several implementation measures. Some are listed below; please click on the link in the “More Information” section to review all of the State’s implementation measures.
• Implementation measures for the Implement Teaching Performance Assessments (TPA) Strategy: 2014–15: Adopt revised assessment design standards and secure funding; 2015–16: Begin updating the state TPA model; 2016–17: Prepare to implement revised TPAs in 2017–18 (p. 51).
• Implementation measures for the Increase Support for Teacher Induction Strategy: 2014–15: Convene workgroup to propose revised induction standards and requirements; 2015–16: Integrate work group recommendations into policies; 2016–17: Full implementation of new policies re: new teacher induction (p. 51).
• Implementation measures for the Update the California Professional Standards for Education Leaders (CPSEL) and Descriptions of Practice (DOP) Strategy: 2014–15: Convene expert panel to craft new structures and language for the DOP to reflect the refreshed CPSEL; 2015–16: Publication and dissemination of the refreshed CPSEL DOP (p. 52).

Equity Plan Overview CALIFORNIA K-19
Equity Gaps Root Causes Strategies Implementation Measures
• “Equity Gap #2: Inexperiencedteachers serve students in minority communities at higher rates than students in predominantly white communities” (p. 17).
• “Need to enhance parent and community engagement in high-need schools” (p. 27) (Other).
• “Diverse local rootcauses” (p. 27) (Other).
• “Promote ResourcesDesigned to Assist Schools to Effectively Engage Parents” (p. 44) (Other).
• Implementation measures for the Disseminateand Promote Integrated Professional Learning System Work Strategy: 2014–15: Monitor implementation of grants; 2015–16: Promote the Teacher-Based Reform Grant Pilot Projects (T-BARs) prototypes and products on Web pages; 2016–17: Promote online tools and materials including observation protocols, calibration materials, and effective feedback materials (p. 52).
• Implementation measures to promote and disseminate parent resources: 2014–15: Continue to build collection of resources to support parent engagement; 2015–16: Explore creation of dissemination strategy; 2016–17: Assess effectiveness of strategy and adapt and expand as necessary (p. 53).
PUBLIC REPORTING OF PROGRESS
• “To measure the success of these efforts, the CDE will develop an annual data profile that provides information regarding the rates at which poor children are taught by inexperienced, unqualified, out-of-field, and intern teachers compared to the rates at which other children are taught by these teachers and the rates at which minority children are taught by inexperienced, unqualified, out-of-field, or intern teachers compared to the rates at which other children are taught by these teachers” (p. 50).
• “The CDE will convene stakeholders annually to review this data, examine equity gaps, and identify opportunities to improve upon strategies. Using this information, the CDE will prepare a report on the progress of the California State Plan to Ensure Equitable Access to Excellent Educators, present it to the SBE on an annual basis, and post the plan on its Web pages” (p. 50).
More InformationFor more information, download the California Equity plan.
Source: California State Department of Education. (2015). California state plan to ensure equitable access to excellent educators. Retrieved from http://www2.ed.gov/programs/titleiparta/equitable/caequityplan092915.pdf

EQUITY PLAN OVERVIEW
COLORADO
ANALYSIS
GAPS
STRATEGIES
MEASURES
ROOTCAUSES
DEFINITIONS
ENGAGEMENT
PUBLIC REPORTING
“CDE [Colorado Department of Education] recognizes that improving
the way equity gaps are measured, identified, and communicated to
stakeholders is critical to closing these gaps. Therefore, this plan
includes strategies that aim to improve measurement and public
reporting of equity gaps in addition to the strategies aimed at
building the capacity of stakeholders to meaningfully engage in the
work of closing these gaps. Inherent in this focus on improving
measurement and public reporting is recognition that the current
methods and data sources for identifying equity gaps are imperfect.
Therefore, it may appear that there is not always a direct link between
the identified gaps, root causes, and strategies throughout this plan.
This is something that CDE has chosen to improve over time through
meaningful efforts to improve how data is used to ensure that all
students have equitable access to excellent educators” (Colorado
Department of Education, 2015, p. 4).
“By implementing this plan, we also aim to gain a deeper
understanding of root causes and how they differ by region, size of
district, capacity of district, proximity to provider, and other variable
factors” (p. 4).
Equity Plan Overview COLORADO K-20

STAKEHOLDER ENGAGEMENT
• “CDE solicited and received input from teachers, district human resources officers, district federal programs coordinators, higher education staff and faculty, superintendents, school board leaders, English Learner [Learners] (EL) instruction and policy practitioners, instructional technology leaders, family and community engagement leaders, and educator effectiveness practitioners and leaders. Many of the initiatives in this plan also are included in Colorado’s ESEA Flexibility Waiver – the creation of which relied heavily on stakeholder input” (p. 6).
• “In addition to having face-to-face meetings, CDE wanted to gain broader engagement by administering a stakeholder engagement protocol through these existing groups to elicit more authentic input due to the ongoing nature of the feedback loops with the groups identified. Representatives from the above units at CDE collected input through a variety of meetings and electronic communications” (p. 8).
• “CDE has an ongoing commitment to stakeholder engagement and will continue to reach out to [previously contacted stakeholders] . . . and others to inform the execution and improvement of our plan moving forward” (p. 8).
• “Reporting on the implementation and progress of this plan will be included on the regularly scheduled agendas of the ESEA Committee of Practitioners (CoP) and the Colorado Association of School Personnel Administrators (CASPA) Additionally, the Unit of Federal Programs Administration has convened a cross-program work group whose work will include meeting the following objectives:
− Identify the core team, key advisors, and feedback network for implementing the educator equity plan.
− Utilize each of the above groups to monitor and guide implementation of the plan.
− Develop and implement a communication protocol that leverages these three groups” (p. 8).
Equity Plan Overview COLORADO K-21
Equity Gaps
State Definitions of Key Terms: Colorado defined 10 terms. Five of those terms (non-highly qualified teacher, effective educator, ineffective educator, rural and small rural) are additional definitions beyond those required by statute. All terms were used to inform identification of the State’s equity gaps.
Root Causes
Root causes were grouped into “topic areas” for each state; therefore, the phrases in parentheses represent one of three broad areas in which root causes were grouped.
• “Teachers have inconsistent access to induction programs that include coaching and mentoring, strategies for working with struggling learners, and strategies for instructing on the Colorado Academic Standards” (p. 16) (Conditions).
Strategies
Strategies were grouped into “topic areas” for each state; therefore, the phrases in parentheses represent one of three broad areas in which the strategies were grouped.
Colorado identified several strategies. Some are listed below; please click on the link in the “for more information” section to review all of the State’s strategies.
Performance Measures
• “Statewide teacher turnover will decrease from 16.62 percent to 12 percent or less by 2017” (p. 34).
• “Students catching up to proficiency will increase to 39 percent by 2017” (p. 34).
• “Number of districts with identified gaps will decrease from 31 to 25 by the end of the 2017-18 school year” (p. 34).

Equity Plan Overview COLORADO K-22
Equity Gaps Root Causes Strategies Performance Measures
Colorado elected to concentrate on implementing strategies tied to its largest, most significant gaps; therefore, the gaps below represent only those identified gaps that the State will implement strategies to eliminate. For additional information about Colorado’s other gaps, please click on the link in the “More Information” section.
• “Higher Rates of Inexperienced Teachers Teaching in Schools with High Poverty, High Minority and High English Learner Populations” (p. 10).
• “Higher Rates of Unlicensed or Uncertified Teachers in High Poverty and High Minority Schools” (p. 11).
• “Colorado’s educator pipeline is not providing an adequate supply of teacher candidates in specific subject areas, and inexperienced educators often lack the skills needed to meet the needs of struggling learners” (p. 16) (Educator Preparation).
• “School leaders are not consistently prepared with the necessary skills to serve as instructional leaders and retain their best teachers in the current educational environment, contributing to the turnover rates. This includes lack of access to meaningful evaluation data to inform strategic staffing decisions” (p. 17) (Educator Preparation).
• “To address coaching and mentoring, CDE has developed a State Model Evaluation System for evaluating Colorado educators. The State Model Evaluation System enables evaluators to identify the strengths and weaknesses within an educator’s practice” (p. 19) (Human Capital Management Systems).
• “CDE provides Colorado educators access to the TELL Colorado perception survey” (p. 19) (Conditions).
• “CDE recognizes the need for ELs to have equitable access to effective instruction. Our approach to measuring this is a systems-based approach because we know that developing teachers’ capacity to provide effective instruction to these students is reliant on a highly functioning system of English Language Development (ELD) programming” (p. 20) (Human Capital Management Systems).
• “CDE has worked with educators at every grade level and content area across Colorado to develop sample curriculum units that embody the instructional shifts required for the 21st Century” (p. 22) (Human Capital Management Systems).
• “No student in Colorado will be taught by an ineffective teacher for more than two consecutive years” (p. 34).

Equity Plan Overview COLORADO K-23
PUBLIC REPORTING OF PROGRESS
• “. . . CDE will conduct annual comprehensive data analyses of more than 75 educator effectiveness metrics to assess equity gaps for each district. The results of many of these metrics will be available for the public (in aggregate) in SchoolView in 2016-17. The results of these analyses will be used to identify districts that may need assistance or be struggling with equity gaps as well as identify “like” districts that do not have gaps in order to learn about the strategies that they may be implementing to address the issue” (p. 33).
• “Beginning in the fall of 2016, CDE will post an annual progress report on our website that will outline progress toward the goals, metrics, and targets detailed in this plan. This report will also include any amendments to the plan that are made as a result of lessons learned. Highlights of this report will be shared at major stakeholder meetings, including but not limited to the annual Excellence and Equity conference, regional meetings, one CASPA [Colorado Association of School Personnel Administrators] meeting per year, and one CoP [ESEA Committee of Practitioners] meeting per year” (p. 33).
More InformationFor more information, download the Colorado Equity plan.
Source: Colorado Department of Education. (2015). Colorado’s plan for ensuring equitable access to excellent educators. Retrieved from http://www2.ed.gov/programs/titleiparta/equitable/coequityplan120315.pdf

EQUITY PLAN OVERVIEW
CONNECTICUT
ANALYSIS
GAPS
STRATEGIES
MEASURES
ROOTCAUSES
DEFINITIONS
ENGAGEMENT
PUBLIC REPORTING
“The 2015 Connecticut Equity Plan will focus efforts in selected
high-poverty/high-minority districts to increase the percentage of
experienced teachers and principals, increase retention of teachers
and administrators, and increase the number of candidates who are
fully prepared, certified to teach and accept positions in Connecticut’s
designated shortage areas” (Connecticut State Department of
Education, 2015, p.2).
STAKEHOLDER ENGAGEMENT
• “To ensure that diverse points of view were included in the plan’s development, the CSDE identified stakeholder organizations and extended an invitation for two representatives per organization to attend an initial series of three meetings” (p. 7).
• “On March 30, 2015, 28 attendees, representing 17 organizations, participated in introductory activities including a welcoming exercise, a comprehensive overview of the Equity Plan’s requirements and the process the state would follow to create the plan” (p. 7).
• “Participants discussed the metrics, asked clarifying questions, and requested that the Performance Office conduct additional data analysis for further review and consideration” (p. 7).
Equity Plan Overview CONNECTICUT K-24

Equity Plan Overview CONNECTICUT K-25
Equity Gaps
State Definitions of Key Terms: Connecticut defined 12 terms. Seven of those terms (excellent teacher, excellent principal, teacher and principal retention, shortage area vacancies, full-time equivalent, poverty and minority quartiles, equity gap) are additional definitions beyond those required by statute. All terms were used to inform identification of the State’s equity gaps.
Connecticut elected to concentrate on implementing strategies tied to its largest, most significant gaps; therefore, the gaps below represent only those identified gaps that the State will implement strategies to eliminate. For additional information about Connecticut’s other gaps, please click on the link in the “More Information” section.
• “Based on the data, students attending high-poverty/high-minority schools are more likely to be taught by inexperienced teachers and led by inexperienced principals than students in low-poverty and low-minority schools” (p. 22).
• “Retention was examined at the five-year mark, and results showed larger gaps of 18.8 percent for high-poverty versus low-poverty schools and 18.0 percent for high-minority versus low-minority schools. Principal retention was examined at the five-year mark and showed gaps of 7.1 percent for high-poverty versus low-poverty schools and 7.2 percent for high-minority versus low-minority schools” (p. 22).
Root Causes
Root causes were grouped into “topic areas” for each state; therefore, the phrases in parentheses represent one of three broad areas in which the root causes were grouped.
Connecticut identified several root causes. Some are listed below; please click on the link in the “More Information” section to review all of the State’s root causes.
• “Principals in high-poverty and high-minority schools have to manage many non-instructional tasks, leaving less and less time to act as instructional leaders and implement professional learning” (p. 25) (Conditions).
• “Teachers at high-poverty and high-minority schools must manage a greater number of nonacademic student needs” (p. 28) (Conditions).
• “Teachers at high-poverty and high-minority schools often lack preservice experience serving in similar settings” (p. 28) (Educator Preparation).
• “Teaching and learning are impacted by cultural disconnects between educators, students, and families” (p. 30) (Conditions).
Strategies
Strategies were grouped into “topic areas” for each state; therefore, the phrases in parentheses represent one of three broad areas in which the strategies were grouped.
• Address Gaps in Educators’ Cultural Consciousness and Competence (p. 25) (Conditions).
• Examine Effective Use of Per Pupil Expenditures (p. 25) (Human Capital Management Systems).
• Improve Working Conditions for Teachers and Support from School Leaders (p. 25) (Conditions).
• Increase Supply of Candidates in Order to Eliminate Existing Designated Shortage Areas (p. 25) (Human Capital ManagementSystems).
• Strengthen Preparation,Support, and Ongoing Development of Principals (p. 25) (Educator Preparation).
Performance Measures
Connecticut identified several performance measures. Some are listed below; please click on the link in the “More Information” section to review all of the State’s performance measures.
• “By 2017, a random sample of teachers surveyed in the targeted LEAs will report having positive relationships with diverse students and families. By 2020, a second random sample of teachers surveyed in the targeted LEAs will report having positive relationships” (p. 27).
• “Between 2017 and 2020, the percentage of beginning teachers who report that their pre-service field placement prepared them well for their job will increase by 5% each year” (p. 30).
• “Between 2017 and 2020, the percentage of teachers who stay 5 years or more in high-poverty, high-minority schools will increase by 5% each year” (p. 30).
• “The number of teachers who report having positive relationships with diverse students and families will increase by 5% each year through 2020” (p. 31).

Equity Gaps Root Causes Strategies Performance Measures
• “In studying five of Connecticut’s designated shortage areas, Mathematics 7-12 and Science 7-12 were found to have larger gaps, while there was a very slight gap of under 1 percent for Comprehensive Special Education” (p. 23).
• “The educator workforce does not reflect the racial, cultural, ethnic, and/or linguistic composition of the student population” (p. 30) (Human Capital Management Systems).
• Strengthen Preparation, Support, and Ongoing Development of Teachers (p. 25) (Educator Preparations).
• “The number of parents who indicate through the biennial school climate survey that they are made to feel welcome, valued and respected at their children’s school will increase by 5% each year through 2020” (p. 31).
• “By 2017, the CT Shortage Area Task Force will employ strategies to reduce vacancies in designated shortage areas for high-poverty and high-minority schools by 10% in the 2020-2021 school year” (p. 36).
PUBLIC REPORTING OF PROGRESS
• “Connecticut is committed to ensuring the long-term success of this initiative. To this end, Connecticut will convene an Equity Plan Advisory Group on a biannual basis to review progress toward eliminating equity gaps identified in this plan” (p. 37).
• “In addition, the CSDE will convene additional meetings of the Equity Plan Advisory Group as needs arise. Furthermore, as all of the LEAs identified in the Equity Plan are Connecticut Alliance Districts, the state will use the
Alliance District support structure to address and eliminate equity gaps. Alliance District annual applications will be revised to report each district’s data toward reducing and eliminating the gaps identified in the 2015 CT Equity Plan” (p. 37).
• “Finally, Connecticut will publicly report its progress toward eliminating equity gaps on its website and will update progress on a biannual basis” (p. 37).
More InformationFor more information, download the Connecticut Equity plan.
Source: Connecticut State Department of Education. (2015). Equitable access to excellent educators plan 2015. Retrieved from http://www2.ed.gov/programs/titleiparta/equitable/ctequityplan081915.pdf
Equity Plan Overview CONNECTICUT K-26
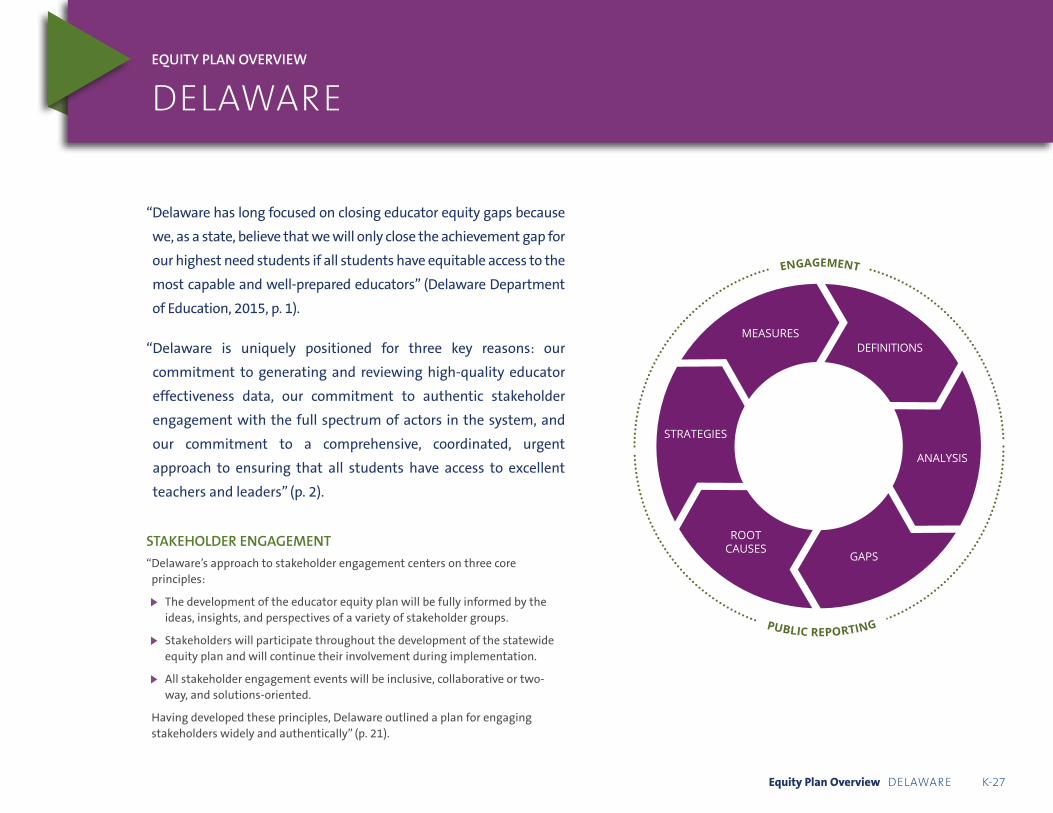
EQUITY PLAN OVERVIEW
DELAWARE
ANALYSIS
GAPS
STRATEGIES
MEASURES
ROOTCAUSES
DEFINITIONS
ENGAGEMENT
PUBLIC REPORTING
“ Delaware has long focused on closing educator equity gaps because
we, as a state, believe that we will only close the achievement gap for
our highest need students if all students have equitable access to the
most capable and well-prepared educators” (Delaware Department
of Education, 2015, p. 1).
“ Delaware is uniquely positioned for three key reasons: our
commitment to generating and reviewing high-quality educator
effectiveness data, our commitment to authentic stakeholder
engagement with the full spectrum of actors in the system, and
our commitment to a comprehensive, coordinated, urgent
approach to ensuring that all students have access to excellent
teachers and leaders” (p. 2).
STAKEHOLDER ENGAGEMENT
“ Delaware’s approach to stakeholder engagement centers on three core principles:
• The development of the educator equity plan will be fully informed by the ideas, insights, and perspectives of a variety of stakeholder groups.
• Stakeholders will participate throughout the development of the statewide equity plan and will continue their involvement during implementation.
• All stakeholder engagement events will be inclusive, collaborative or two-way, and solutions-oriented.
Having developed these principles, Delaware outlined a plan for engaging stakeholders widely and authentically” (p. 21).
Equity Plan Overview DELAWARE K-27

Equity Plan Overview DELAWARE K-28
Equity Gaps
State Definitions of Key Terms: Delaware defined 12 terms. Seven of those terms (excellent teacher, excellent school leader, ELLs, students with a disability, urban students, students from Wilmington, and students from a high need school) are additional definitions beyond those required by statute. All terms were used to inform identification of the State’s equity gaps.
Delaware elected to concentrate on implementing strategies tied to its largest, most significant gaps; therefore, the gaps below represent only those identified gaps that the State will implement strategies to eliminate. For additional information about Delaware’s other gaps, please click on the link in the “More Information” section.
• “Students from high-need schools (and students of color and students from low-income families in general) are more likely to be taught by inexperienced teachers than other students (rates of early career educators across need status)” (p. 14).
• “Students from high-need schools (and students of color and students from low-income families in general) are more likely to experience higher rates of teacher turnover than are other students” (p. 15).
• “Students from high-need schools (and students of color and students from low-income families in general) have less access to effective teachers than other students” (p. 17).
• “Students of color and students from low-income families are slightly less likely to have access to “highly qualified educators (unqualified and out-of-field)” (p. 20).
Root Causes
Root causes were grouped into “topic areas” for each state; therefore, the phrases in parentheses represent one of three broad areas in which the root causes were grouped.
Delaware identified several root causes. Some are listed below; please click on the link in the “More Information” section to review all of the State’s root causes.
• “Poor leadership skills create negative school culture and lack of buy-in and empowerment among staff” (p. 39) (Conditions).
• “Principal turnover creates instability and a negative school culture (p. 40) (Conditions).
• “Internships and student teaching opportunities do not give candidates or schools enough exposure to assess whether there is a mutual fit in a high-need environment” (p. 43) (Educator Preparation).
• “Lack of collaboration between districts and IHEs” (p. 46) (Human Capital Management Systems).
• “Inequitable access to IHEs throughout state” (p. 46) (Human Capital Management Systems).
Strategies
Strategies were grouped into “topic areas” for each state; therefore, the phrases in parentheses represent one of three broad areas in which the strategies were grouped.
Delaware identified several strategies. Some are listed below; please click on the link in the
“More Information” section to review all of the State’s strategies.
• Improving School Leadership and Retaining Our Best Leaders (p. 36) (Human Capital Management Systems).
• Strengthen Educator Preparation for Urban and rural schools (p. 42) (Educator Preparation).
• Enhance Recruitment, Selection, and Staff Management of Excellent Educators (p. 47) (Human Capital Management Systems).
• Improve Induction and Mentoring (p. 55) (Human Capital Management Systems).
• Rethinking Compensation and Creating Career Pathways Designed to Keep Effective Educators in the Classroom (p. 61) (Human Capital Management Systems).
Performance Measures
Delaware identified several performance measures. Some are listed below; please click on the link in the “More Information” section to review all of the State’s performance measures.
• “Percentage of students in the bottom quartile of State assessment performance taught by inexperienced educators (compared with students in other quartiles)” (p. 71).
• “Percentage of educators earning highly effective summative ratings in high-need versus non-high-need schools” (p. 72).
• “Total rate of turnover of educators (pooled over five years) in high-need versus non-high-need schools” (p. 72).
• “Rate of turnover of highly effective educators in high-need versus non-high-need schools” (p. 72).
• “Total rate of turnover of school leaders in high-need versus non-high-need schools” (p. 72).
• “Percentage of educators reporting their school is a
“good place to work and learn” in high-need versus non-high-need schools” (p. 72).

Equity Plan Overview DELAWARE K-29
PUBLIC REPORTING OF PROGRESS
• “State website will be a point of contact for a broad range of stakeholders on the progress of the plan, opportunities for involvement and for us to gather feedback. Delaware will post updates to various websites (including Equity Plan specific pages) and invite further dialogue on posted plans and potential revisions” (p. 26).
• “Beginning in summer 2016, the Delaware Department of Education plans to publicly release biannual Educator Equity Quotient (EEQ) reports that track state, district, and school-level progress in relation to educator equity gaps and other educator effectiveness metrics noted in the state’s equity plan” (p. 71).
More InformationFor more information, download the Delaware Equity plan.
Source: Delaware Department of Education. (2015). Plan to ensure equitable access to excellent educators for all students (2015–2025). Retrieved from http://www2.ed.gov/programs/titleiparta/equitable/deequityplan082515.pdf

EQUITY PLAN OVERVIEW
DISTRICT OF COLUMBIA
ANALYSIS
GAPS
STRATEGIES
MEASURES
ROOTCAUSES
DEFINITIONS
ENGAGEMENT
PUBLIC REPORTING
“This plan aims to ensure that students from low-income families, students
of color, and students with special needs are not taught by inexperienced,
unqualified, or out-of-field teachers at higher rates than other children.
This proposal also provides the measures that the agency will use to
evaluate the plan to monitor the plan’s progress, identify and address
potential obstacles, and share successes worthy of replication” (District of
Columbia Office of the State Superintendent of Education, 2015, p. 5).
“The plan focuses on two main questions: the first is how can we [DC]
prepare, supply, recruit, and place the District’s best teachers in the schools
that need them most? This question focuses on creating excellent educator
pipelines. The second question is how can we [DC] get our best teachers to
stay at schools that need them most? Retaining our best teachers at
schools where there may be challenges, and ensuring that these teachers
are able to contribute to school turnaround efforts, is critical to long-term
equitable access in the District” (p. 5).
“To create this plan, OSSE convened an internal team of staff members who
work in data, policy, teaching and learning, and teacher effectiveness. The
team engaged in the development of the plan through six steps: (1)
Development of a stakeholder engagement process; (2) Internal root
cause discussion; (3) Review of current promising practices; (4) Review of
available data; (5) Facilitation of stakeholder engagement process; and (6)
Design of researched-based strategies and measurable targets” (pp. 6–7).
Equity Plan Overview DISTRICT OF COLUMBIA K-30
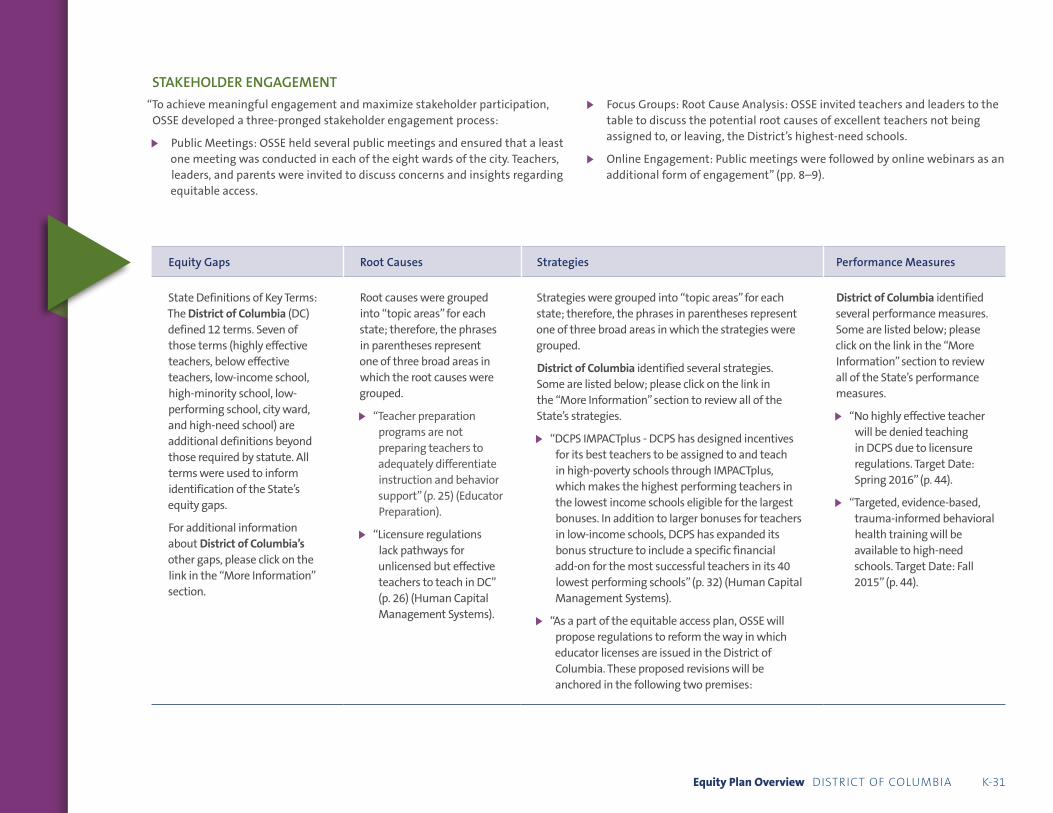
STAKEHOLDER ENGAGEMENT
“To achieve meaningful engagement and maximize stakeholder participation, OSSE developed a three-pronged stakeholder engagement process:
• Public Meetings: OSSE held several public meetings and ensured that a least one meeting was conducted in each of the eight wards of the city. Teachers, leaders, and parents were invited to discuss concerns and insights regarding equitable access.
• Focus Groups: Root Cause Analysis: OSSE invited teachers and leaders to the table to discuss the potential root causes of excellent teachers not being assigned to, or leaving, the District’s highest-need schools.
• Online Engagement: Public meetings were followed by online webinars as an additional form of engagement” (pp. 8–9).
Equity Plan Overview DISTRICT OF COLUMBIA K-31
Equity Gaps
State Definitions of Key Terms: The District of Columbia (DC) defined 12 terms. Seven of those terms (highly effective teachers, below effective teachers, low-income school, high-minority school, low-performing school, city ward, and high-need school) are additional definitions beyond those required by statute. All terms were used to inform identification of the State’s equity gaps.
For additional information about District of Columbia’s other gaps, please click on the link in the “More Information” section.
Root Causes
Root causes were grouped into “topic areas” for each state; therefore, the phrases in parentheses represent one of three broad areas in which the root causes were grouped.
• “Teacher preparation programs are not preparing teachers to adequately differentiate instruction and behavior support” (p. 25) (Educator Preparation).
• “Licensure regulations lack pathways for unlicensed but effective teachers to teach in DC” (p. 26) (Human Capital Management Systems).
Strategies
Strategies were grouped into “topic areas” for each state; therefore, the phrases in parentheses represent one of three broad areas in which the strategies were grouped.
District of Columbia identified several strategies. Some are listed below; please click on the link in the “More Information” section to review all of the State’s strategies.
• “DCPS IMPACTplus - DCPS has designed incentives for its best teachers to be assigned to and teach in high-poverty schools through IMPACTplus, which makes the highest performing teachers in the lowest income schools eligible for the largest bonuses. In addition to larger bonuses for teachers in low-income schools, DCPS has expanded its bonus structure to include a specific financial add-on for the most successful teachers in its 40 lowest performing schools” (p. 32) (Human Capital Management Systems).
• “As a part of the equitable access plan, OSSE will propose regulations to reform the way in which educator licenses are issued in the District of Columbia. These proposed revisions will be anchored in the following two premises:
Performance Measures
District of Columbia identified several performance measures. Some are listed below; please click on the link in the “More Information” section to review all of the State’s performance measures.
• “No highly effective teacher will be denied teaching in DCPS due to licensure regulations. Target Date: Spring 2016” (p. 44).
• “Targeted, evidence-based, trauma-informed behavioral health training will be available to high-need schools. Target Date: Fall 2015” (p. 44).
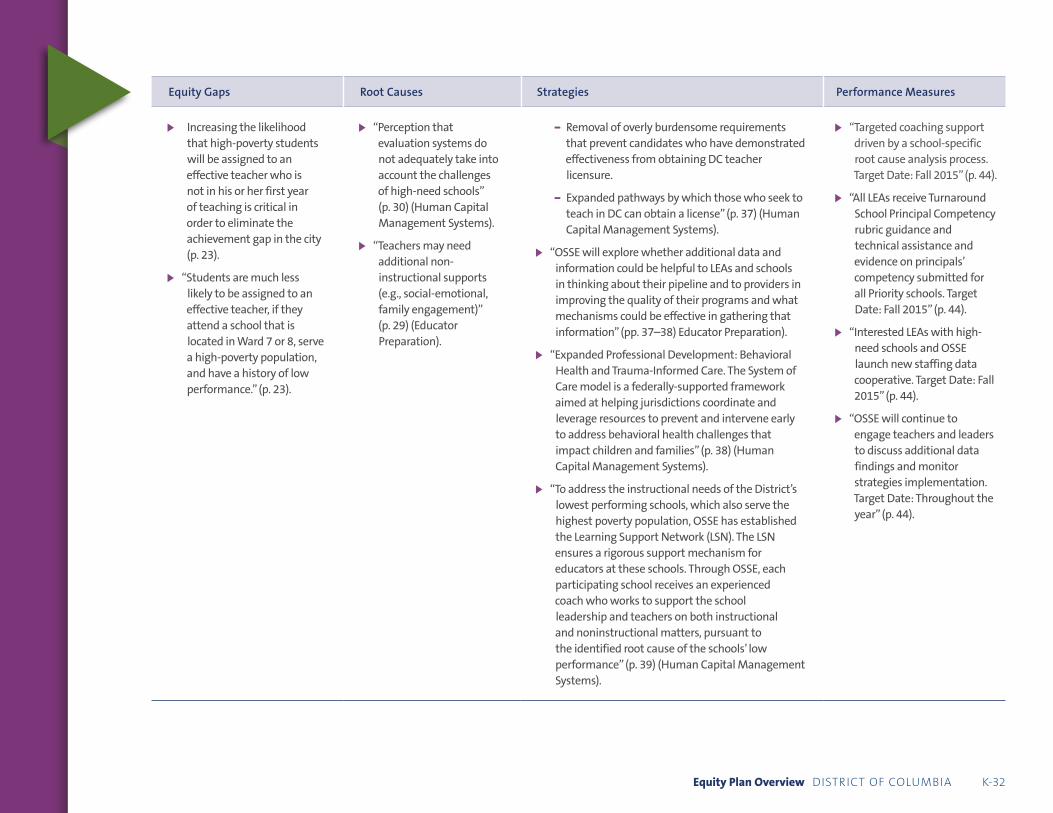
Equity Plan Overview DISTRICT OF COLUMBIA K-32
Equity Gaps Root Causes Strategies Performance Measures
• Increasing the likelihood that high-poverty students will be assigned to an effective teacher who is not in his or her first year of teaching is critical in order to eliminate the achievement gap in the city (p. 23).
• “Students are much less likely to be assigned to an effective teacher, if they attend a school that is located in Ward 7 or 8, serve a high-poverty population, and have a history of low performance.” (p. 23).
• “Perception that evaluation systems do not adequately take into account the challenges of high-need schools” (p. 30) (Human Capital Management Systems).
• “Teachers may need additional non-instructional supports (e.g., social-emotional, family engagement)” (p. 29) (Educator Preparation).
− Removal of overly burdensome requirements that prevent candidates who have demonstrated effectiveness from obtaining DC teacher licensure.
− Expanded pathways by which those who seek to teach in DC can obtain a license” (p. 37) (Human Capital Management Systems).
• “OSSE will explore whether additional data and information could be helpful to LEAs and schools in thinking about their pipeline and to providers in improving the quality of their programs and what mechanisms could be effective in gathering that information” (pp. 37–38) Educator Preparation).
• “Expanded Professional Development: Behavioral Health and Trauma-Informed Care. The System of Care model is a federally-supported framework aimed at helping jurisdictions coordinate and leverage resources to prevent and intervene early to address behavioral health challenges that impact children and families” (p. 38) (Human Capital Management Systems).
• “To address the instructional needs of the District’s lowest performing schools, which also serve the highest poverty population, OSSE has established the Learning Support Network (LSN). The LSN ensures a rigorous support mechanism for educators at these schools. Through OSSE, each participating school receives an experienced coach who works to support the school leadership and teachers on both instructional and noninstructional matters, pursuant to the identified root cause of the schools’ low performance” (p. 39) (Human Capital Management Systems).
• “Targeted coaching support driven by a school-specific root cause analysis process. Target Date: Fall 2015” (p. 44).
• “All LEAs receive Turnaround School Principal Competency rubric guidance and technical assistance and evidence on principals’ competency submitted for all Priority schools. Target Date: Fall 2015” (p. 44).
• “Interested LEAs with high-need schools and OSSE launch new staffing data cooperative. Target Date: Fall 2015” (p. 44).
• “OSSE will continue to engage teachers and leaders to discuss additional data findings and monitor strategies implementation. Target Date: Throughout the year” (p. 44).

Equity Plan Overview DISTRICT OF COLUMBIA K-33
PUBLIC REPORTING OF PROGRESS
“OSSE will annually report on the implementation of the strategies and on the equity gaps described in this plan” (p. 43).
More InformationFor more information, download the District of Columbia Equity plan.
Source: District of Columbia Office of the State Superintendent of Education. (2015). District of Columbia plan to ensure equitable access to excellent educators. Retrieved from http://www2.ed.gov/programs/titleiparta/equitable/dcequitableplan100815.pdf

EQUITY PLAN OVERVIEW
FLORIDA
ANALYSIS
GAPS
STRATEGIES
MEASURES
ROOTCAUSES
DEFINITIONS
ENGAGEMENT
PUBLIC REPORTING
“While remarkable progress has been made in Florida to ensure
that every young person graduates from high school prepared for
college, career and life, there is still work to be done. The pages that
follow will show that while some equity gaps have closed, others
persist—calling all Florida educators to double efforts to ensure all
of Florida’s 2.7 million children have the opportunities they deserve.
Florida’s Plan for Equitable Access to Excellent Educators builds on
the profound successes of a generation of educators at all levels of
the system, as well as the foundation of high standards, aligned
assessments and reasonable accountability established and
reinforced by policy makers over the last fifteen years” (Florida
Department of Education, 2015, p. 3).
STAKEHOLDER ENGAGEMENT
• “In addition to direct and personal outreach to these stakeholder groups, the department also created a website for public input and comment” (p. 17).
• “Comments received directly from this open website and/or from other stakeholder consultation were generally affirming of the department’s approach and conclusions” (p. 18).
Equity Plan Overview FLORIDA K-34

Equity Plan Overview FLORIDA K-35
Equity Gaps
State Definitions of Key Terms: Florida defined 17 terms. Twelve of those terms (value-added measure, high-impact teacher, level 1 teacher, level 2 teacher, level 3 teacher, level 4 teacher, school letter grade, school poverty level, high-quartile poverty, lowest-quartile poverty schools, highest quartile minority, lowest-quartile minority) are additional definitions beyond those required by statute. All terms were used to inform identification of the State’s equity gaps.
Florida elected to concentrate on implementing strategies tied to its largest, most significant gaps; therefore, the gaps below represent only those identified gaps that the State will implement strategies to eliminate. For additional information about Florida’s other gaps, please click on the link in the “More Information” section.
• “Importantly, a focus on supporting more effective teaching at D and F schools also supports more effective teaching at schools serving large percentages of students who are poor and/or self-identify as minority” (p. 13).
• “By addressing the equitable access to excellent educators in Florida’s 550+ D and F schools, the department’s plan simultaneously addresses a more equitable distribution of excellent educators in schools serving large percentages of students who are poor or minority” (pp. 13–14).
Root Causes
Root causes were grouped into “topic areas” for each state; therefore, the phrases in parentheses represent one of three broad areas in which the root causes were grouped.
Florida identified several root causes. Some are listed below; please click on the link in the “More Information” section to review all of the State’s root causes.
• “VAM, the best information the profession has ever had about the impact of teaching on learning, is not widely understood or accepted. That districts have had the statutory authority to set their own cut scores and interpret VAM their own way has further obscured this valuable information from the people who could not do the most good with it, teachers and leaders. That districts have also bargained aspects of their evaluation systems, including the establishment of performance levels, i.e. cut scores, adds to the confusion and misinformation” (pp. 14–15).
• “There is also a disconnect between the evaluation ratings teachers receive and their school’s performance. For example, 91 percent of teachers are rated as Highly Effective or Effective at D and F schools, so those teachers are getting positive and favorable performance evaluations, despite what VAM would indicate about their impact on student learning” (p. 15) (Conditions).
Strategies
Strategies were grouped into “topic areas” for each state; therefore, the phrases in parentheses represent one of three broad areas in which the strategies were grouped.
Florida identified several strategies. Some are listed below; please click on the link in the
“More Information” section to review all of the State’s strategies.
• “The department must continue to communicate the power and purpose of VAM so teachers understand it, and teachers must see their individual raw VAM scores in a way that has not been affected by local calculations. VAM is still not well understood in Florida making it difficult for some educators to see its utility. Improving educators’’ understanding of VAM will support educators in using the information to make data-driven decisions in service of equitable access. To be implemented in fall 2015 and beyond” (p. 21) (Conditions).
• “The department will identify and convene Florida’s highly effective teachers according to the methodology outlined in this report in order to support them in communicating their effective practices to other educators. Using the power of teacher leadership, especially in D and F schools, to build capacity shows respect for hard working educators and invests directly in those whose impact is greatest and supports them in building the capacity of their colleagues. To be implemented in spring 2016 and during the 2016-17 school year” (p. 21) (Human Capital Management).
Implementation Measures
Florida identified several implementation measures. Please click on the link in the “More Information” section to review all of the State’s implementation measures.
Florida chose to identify its implementation measures at the end of each strategy, therefore, see the
“Strategies” section.

Equity Plan Overview FLORIDA K-36
Equity Gaps Root Causes StrategiesImplementation Measures
• “Many districts continue to have hiring and transfer policies that result in schools perceived as more challenging not being able to access or retain highly effective educators” (p. 15) (Human Capital Management Systems).
• “State-approved teacher preparation programs in Florida may not be preparing pre-service educators for the schools and children who need them most thus these educators seek placements where they perceive teaching will be less challenging” (p. 15) (Human Capital Management Systems).
• “Some districts have chosen not to, don’t know how to, or have bargained away their authority/ability to make staffing decisions that result in more equitable distribution of effective educators, especially at D and F schools” (p. 16) (Other).
• “School district leaders will be provided district-level data and state comparisons for each of the analyses in this report so they can determine to what extent local action may be necessary to highlight equity successes or correct equity gaps. Educators with better information make better decisions. To be provided annually in accordance with 1012.34, F.S.” (p. 21) (Human Capital Management Systems).
• “The department will consider an explicit focus on, and metrics to measure, the distribution of highly effective teachers across all school types as part of its upcoming strategic planning process. To be considered during winter 2015” (p. 21) (Human Capital Management Systems).
• “The department will consider pursuing legislative support for funding to increase the proportion of highly effective teachers in D and F schools in school districts that may not have the financial ability to do so on their own. The more highly effective teachers in a school the more likely students will be to achieve at high levels thus closing equity gaps. To be considered in spring 2016” (p. 22) (Human Capital Management Systems).

PUBLIC REPORTING OF PROGRESS
“ The annual report and the monitoring authority under this statute provides the department with substantial authority for ensuring equitable access to excellent educators for the students in Florida most in need” (p. 24).
Equity Plan Overview FLORIDA K-37
More InformationFor more information, download the Florida Equity plan.
Source: Florida Department of Education. (2015). Florida’s plan to ensure equitable access to excellent educators. Retrieved from http://www2.ed.gov/programs/titleiparta/equitable/flequityplan121415.pdf

EQUITY PLAN OVERVIEW
GEORGIA
ANALYSIS
GAPS
STRATEGIES
MEASURES
ROOTCAUSES
DEFINITIONS
ENGAGEMENT
PUBLIC REPORTING
“Georgia’s Equity Plan represents the hard work of many individuals
who collaborated with the Georgia Department of Education
(GaDOE) to draft a data-driven plan that will ensure Equitable
Access to Effective Educators for all Georgia students” (Georgia
Department of Education, 2015, p. 3).
“That being said, how can Georgia ensure Equitable Access to
Effective Educators for all Georgia students? Four common themes
have emerged throughout the review of current data sources and
stakeholder conversations:
• Recruitment and teacher preparation,
• Teacher and principal effectiveness,
• Retention and professional growth, and
• Factors that impact the learning and working environment.
Each of these themes encompasses the intensive and extensive
education reform that has evolved during the RT3 [Race to the Top]
grant years. Georgia must now ensure the equity plan is aligned
and strategically articulated for implementation, monitoring and
reporting of progress” (p. 4).
Equity Plan Overview GEORGIA K-38

STAKEHOLDER ENGAGEMENT
• “To document the engagement process a list of diverse individuals was compiled by GaDOE to invite and engage in the equity conversation. Meetings were held in a physical location and recorded through a webinar for further viewing. Monthly updates and resources will be accessible on the GaDOE (Title IIA) website also” (p. 10).
• “Stakeholders engaged in the work during these meetings include: teachers, parents, school board members, community organizations, advocacy group leaders, business representatives, and other interested citizens in the community. Conversations were guided with discussion protocols to ensure
the focus remained on the equity gap work. In addition webinars were conducted to ensure feedback from all viewpoints. All communications were added to the compilation of stakeholder feedback” (p. 11).
• “At the State level, stakeholder groups will be provided updates on current data and implemented strategies. These updates will allow for even greater public awareness of the State’s progress in addressing issues of inequitable access” (p. 47).
• “GaDOE will continue to refine this plan in collaboration with all stakeholders specifically seeking the input of district and school level leaders” (p. 51).
Equity Plan Overview GEORGIA K-39
Equity Gaps
State Definitions of Key Terms: Georgia defined 20 terms. Fifteen of those terms (Leader effectiveness measures, Teacher effectiveness measure, total student enrollment, total number of teachers, percent of teachers in first year, average years of experience, percent of teachers out-of-field, percent of classes taught by teachers who are not highly qualified, average number of days absent, adjusted average teacher salary, effective district induction program, induction phase teacher/principal, percent of teacher/principal turnover rate, poverty/low-income quartile, minority quartile, and locale) are additional definitions beyond those required by statute. All terms were used to inform identification of the State’s equity gaps.
Georgia elected to concentrate on implementing strategies tied to its largest, most significant gaps; therefore, the gaps below represent only those identified gaps that the State will implement strategies to eliminate. For additional information about Georgia’s other gaps, please click on the link in the “More Information” section.
Root Causes
Root causes were grouped into “topic areas” for each state; therefore, the phrases in parentheses represent one of three broad areas in which the root causes were grouped.
Georgia identified several root causes. Some are listed below; please click on the link in the “More Information” section to review all of the State’s root causes.
• “Lack of Professional Learning for Administrators” (page has no number) (Human Capital Management Systems).
• “Lack of support – high principal/teacher turnover rate, parent engagement, parent education level, and/or fewer role models” (page has no number) (Human Capital Management Systems).
Strategies
Strategies were grouped into “topic areas” for each state; therefore, the phrases in parentheses represent one of three broad areas in which the strategies were grouped.
Georgia identified several strategies. Some are listed below; please click on the link in the “More Information” section to review all of the State’s strategies.
• “Link Teacher and Principal Performance Data to Preparation Programs” (page has no number) (Educator Preparation).
Performance Measures
Georgia identified several performance measures. Some are listed below; please click on the link in the “More Information” section to review all of the State’s performance measures.
• “By 2018, building level leaders will review student placement procedures to ensure students are placed with more effective teachers” (page has no number).

Equity Plan Overview GEORGIA K-40
Equity Gaps Root Causes StrategiesPerformance Measures
• “First-year teachers (inexperienced teachers) in the highest poverty quartile (HPQ) is percentage 7.7% and the lowest poverty quartile is 4.4%; therefore, the first-year teachers’ equity gap is 3.4 percentage points in regard to low-income students” (p. 27).
• “First-year teachers (inexperienced teachers) in the highest minority quartile (HMQ) is percentage 9.2% and the lowest minority quartile is 3.5%; therefore, the first-year teachers’ equity gap is 5.7 percentage points equity gaps in regard to minority students” (p. 27).
• “Average years’ experience in the HPQ is 12.6 years and the lowest quartile is 14 years; therefore the average years’ experience equity gap is a difference of 1.4 years in regard to low-income students” (p. 27).
• “Average years’ experience in the HMQ is. 11.8 years and the lowest minority quartile is 14.9%; therefore, the average years’ experience equity gap is a difference of 3.1 years in regard to the minority students” (p. 27).
• “Percent of teachers “out-of-field” in the HPQ is 2.1% and in the lowest poverty quartile is 1.5%; therefore, the percent of teachers out-of-field equity gap is 0.6 percentage points in regard to low-income students” (p. 27).
• “Percent of teaches “out-of-field” in the HMQ is percentage is 2.2% and in the lowest minority quartile is 0.9%; therefore, the percent of teachers “out-of-field” equity gap is 1.3 percentage points in regard to minority students” (p. 27).
• “Percent of classes taught by teachers not Highly Qualified in the HPQ is 1.4% and in the lowest poverty quartile is 0.6%; therefore, the percent of classes taught by teachers not Highly Qualified equity gap is 0.8 percentage points in regard to low-income students” (p. 28).
• “Inappropriate teacher placement” (page has no number) (Human Capital Management Systems).
• “Lack of leader and teacher effectiveness – struggle with how to engage students, bias regarding families” (page has no number) (Human Capital Management Systems).
• “Lack of common vision” (page has no number) (Human Capital Management Systems).
• “Professional learning not aligned to teachers’ needs” (page has no number) (Human Capital Management Systems).
• “Leaders provide ineffective feedback to assistant principals and teachers” (page has no number) (Human Capital Management Systems).
• “Inability to use data to make decisions” (page has no number) (Human Capital Management Systems).
• “Ineffective Communication skills” (page has no number) (Human Capital Management Systems).
• “Ineffective Teachers/Leaders” (page has no number) (Human Capital Management Systems).
• “Lack of support” (page has no number) (Conditions).
• “Strengthen induction and provide a professional development pathway” (page has no number) (Educator Preparation).
• “Continue to develop professional learning modules to support teacher and leader performance” (page has no number) (Human Capital Management Systems).
• “Increase the availability of professional learning opportunities for special education staff” (page has no number) (Human Capital Management Systems).
• “Promote PBIS [Positive Behavioral Interventions & Supports] to address school climate challenges” (page has no number) (Conditions).
• “By 2018, District level leaders will monitor building level leaders to ensure placement of effective teachers in highest need situations” (page has no number).
• “Educators are focused on the academic growth of their students by focusing on their own professional growth” (page has no number).

Equity Plan Overview GEORGIA K-41
Equity Gaps Root Causes StrategiesPerformance Measures
• “Percent of classes taught by teachers not Highly Qualified in the HMQ is 2.2% and in the lowest minority quartile is 0.4%; therefore. the percent of classes taught by teachers not Highly Qualified equity gap is 1.8 percentage points in regard to minority students” (p. 28).
• “Adjusted average teacher salary in the HPQ is $55,250 and in the lowest poverty quartile is $55,452; therefore, the equity gap is $192 in regard to the low-income students” (p. 28).
• “Adjusted average teacher salary in the HMQ is $52,995 and in the lowest minority quartile is $58,654; therefore, the equity gap is $5,658 in regard to the minority students” (p. 28).
• “Teacher turnover rate in the HPQ is 20.9% and in the lowest poverty quartile is 14.3%; therefore, the percent of teacher turnover rate equity gap is 6.5 percentage points in regard to low-income students.
• “Teacher turnover rate in the HMQ is 23.1% and in the lowest minority quartile is 13.4%; therefore, the percent of teacher turnover rate equity gap is 9.7 percentage points in regard to minority students. NOTE: Table–Percent of Teacher turnover rate per years’ experience.
− Years’ experience- 1-10 Years: HPQ is 44.3% and lowest poverty quartile (LPQ) is 39.6%; therefore, the equity gap for 1-10 Years teacher turnover rate is 9.8 percentage points in regard to teachers years’ experience (1-10 Years) with low-income students.
− Years’ experience- 1-10 Years: HMQ is 47.5% and lowest minority quartile is 30.4%; therefore, the equity gap for 1-10 Years teacher turnover rate is 13 percentage points in regard to teachers years’ experience (1-10 years) with minority students” (p. 28).
• “Lack of resources” (page has no number) (Human Capital Management Systems).
• “Ineffective Leadership” (page has no number) (Human Capital Management Systems).
• “Expectations too high” (page has no number) (Human Capital Management Systems).
• “Shallow pool of effective teachers” (page has no number) (Human Capital Management Systems).
• “Lack of opportunities – Access to higher level courses, life factors, health and bad habits” (page has no number) (Human Capital Management Systems).
• “The conditions and resources necessary for teacher retention in the profession and professional growth at each career stage are identified, valued, and provided through individualized, ongoing, and collaboratively designed and delivered professional learning focused on the common goal of improving student learning” (page has no number).
• “Use annual evaluations to inform talent development and management decisions (TAPS Ratings)” (page has no number).

Equity Plan Overview GEORGIA K-42
Equity Gaps Root Causes StrategiesPerformance Measures
• “Principal turnover rate in the. HPQ is 23.1% and in the lowest poverty quartile is 15.5%; therefore, the percent of principal turnover rate equity gap is 7.6 percentage points in regard to low-income students” (p. 29).
• “Principal turnover rate in the HMQ is 22.4% and in the lowest minority quartile is 16.5%; therefore, the percent of principal turnover rate equity gap is 5.9 percentage points in regard to minority students.
− Principal turnover rate in the HMQ in rural locale is 31.8% and in the LMQ is 16.5%; therefore, the percent of principal turnover rate in rural local equity gap is 15.3 percentage points in regard to rural minority students” (p. 29).
• “Mean Growth Percentile in the HPQ is 47.5% and in the lowest poverty quartile is 51.5%; therefore, the MGP equity gap is a difference of 3.9 percentage points in regard to low-income students.
− MGP in the highest poverty quartile in RURAL locale is 46.9% and in the Lowest poverty quartile is 51.5%; therefore, the RURAL equity gap is a difference of 4.6 percentage points in regard to the rural low-income students” (p. 29).
• “Mean Growth Percentile in the HMQ is 48% and in the lowest minority quartile is. 50.4%; therefore, the MGP equity gap is a difference of 2.3 percentage points in regard to minority students” (p. 29).

PUBLIC REPORTING OF PROGRESS
“Publicly Report Equity Plan Progress and collect feedback from stakeholders” [1st, 2nd, and 3rd year] (page has no number).
More InformationFor more information, download the Georgia Equity plan.
Source: Georgia Department of Education. (2015). Equitable access to excellent educators. Retrieved from http://www2.ed.gov/programs/titleiparta/equitable/gaequityplan91415.pdf
Equity Plan Overview GEORGIA K-43

EQUITY PLAN OVERVIEW
HAWAII
“HIDOE is committed to closing the gaps in equity by increasing the
number of experienced, licensed, and highly qualified teachers for
all students who attend public schools in Hawai’i. The commitment
to close the gaps in equity is shared by Hawaii’s stakeholder groups;
as such, this plan is also written for the State’s stakeholders: HIDOE
staff, students, parents, community members, partners in other
State agencies, and institutions of higher education, both public and
private. This document summarizes the process by which stakeholders
analyzed the State’s data and provided recommendations on the
root cause(s) and strategies for closing the gaps in equity. The
strategies focus on attracting, retaining, supporting, compensating,
and communicating with applicants, teachers, and school leaders
to close the gap in equity of excellent educators throughout the
state” (Hawaii State Department of Education, 2015, p. 3).
STAKEHOLDER ENGAGEMENT
• “In Phase 1 of this plan, HIDOE gathered an initial stakeholder panel of 15 members (See Appendix C) representing SEA stakeholders, LEA stakeholders, and parents. Following the introduction, the stakeholders were broken into small role groups to review the data, identify gaps, determine possible root causes and brainstorm strategies to close identified gaps” (p. 31).
ANALYSIS
GAPS
STRATEGIES
MEASURES
ROOTCAUSES
DEFINITIONS
ENGAGEMENT
PUBLIC REPORTING
Equity Plan Overview HAWAII K-44

• “The involvement of stakeholders includes the collaboration, partnership, and commitment from Hawaii’s parents, community members, SEA personnel and LEA personnel” (p. 31).
• “Using the data gathered, the equity gaps identified by the initial stakeholders, and the suggestions for simplifying the data presentation, HIDOE continued to engage with various stakeholder groups throughout the development of this plan” (p. 31).
Equity Plan Overview HAWAII K-45
Equity Gaps
State Definitions of Key Terms: Hawaii defined 8 terms. Three of those terms (equity, equity gap, and quartile analysis) are additional definitions beyond those required by statute. All terms were used to inform identification of the State’s equity gaps.
Hawaii elected to concentrate on implementing strategies tied to its largest, most significant gaps; therefore, the gaps below represent only those identified gaps that the State will implement strategies to eliminate. For additional information about Hawaii’s other gaps, please click on the link in the “More Information” section.
Root Causes
Root causes were grouped into “topical areas” for each state; therefore, the phrases in parentheses represent one of three broad areas in which the root causes were grouped.
Hawaii identified several root causes. Some are listed below; please click on the link in the “More Information” section to review all of the State’s root causes.
• “Teachers who are dedicated to working in the high poverty/high minority schools are not additionally compensated for working in these schools, which are perceived to be more challenging than schools that are low poverty/low minority” (p. 35) (Human Capital Management Systems).
• “Teachers who are hired from out of state are not compensated for their non-HIDOE prior teaching experience” (p. 35) (Human Capital Management Systems).
Strategies
Strategies were grouped into “topical areas” for each state; therefore, the phrases in parentheses represent one of three broad areas in which the strategies were grouped.
Hawaii identified several strategies. Some are listed below; please click on the link in the “More Information” section to review all of the State’s strategies.
• “Increase the amount of non-HIDOE K-12 teaching experience from what is currently accepted for new hires” (p. 40) (Human Capital Management Systems).
• “Provide a Lump Sum/Bonus for teachers who work in high poverty/high minority schools” (p. 40) (Human Capital Management Systems).
Implementation Measures
Hawaii identified several implementation measures. Some are listed below; please click on the link in the “More Information” section to review all of the State’s implementation measures.
• “Track recruitment and retention for teachers whose non-HIDOE prior teaching experience is accepted. Timeline Start (Implementation Date): July 2016” (p. 58).
• “Track recruitment and retention for teachers who receive a lump sum bonus Timeline Start (Implementation Date): January 2017” (p. 58).
• “Track recruitment and retention for teachers who receive incentive. Timeline Start (Implementation Date): January 2017” (p. 63).

Equity Plan Overview HAWAII K-46
Equity Gaps Root Causes Strategies Implementation Measures
• “High poverty/high minority students of Native Hawaiian and/or Pacific Islander ethnicity are more likely to have an Inexperienced teacher in comparison to schools with low poverty or low Native Hawaiian and/or Pacific Islander ethnic student population(s)” (p. 30).
• “High poverty/high minority students of Native Hawaiian and/or Pacific Islander ethnicity are more likely to have an Unqualified teacher in comparison to schools with low poverty or low Native Hawaiian and/or Pacific Islander ethnic student population(s)” (p. 30).
• “High poverty/high minority students of Native Hawaiian and/or Pacific Islander ethnicity are more likely to have an Out-of-Field teacher in comparison to schools with low poverty or low Native Hawaiian and/or Pacific Islander ethnic student population(s)” (p. 30).
• “Stakeholders expressed their concerns over the lack of an available supply of teacher applicants who have completed a teacher preparation program and received training and preparation for working in a high poverty/high minority schools. Stakeholders identified the following root causes related to teacher preparation programs: 1) there are not enough locally prepared teachers to fill the vacant positions in the HIDOE, especially for the high poverty/high minority schools; and 2) there are no colleges/universities to train teachers located in or close to these communities” (pp. 35–36) (Educator Preparation).
• “The learning curve for new teachers is steep. Studies have shown that teachers who lack support from their school administrators and expert teachers are more likely to leave teaching within the first years of teaching” (p. 37) (Conditions).
• “In recent years, HIDOE’s retention rate for teachers in their first 5 years of the profession has been 55% to 60%. In addition, an increasing number of experienced teachers are retiring” (p. 38) (Human Capital Management Systems).
• “Provide incentives to have experienced teachers remain or transfer to high poverty/high minority schools” (p. 45) (Human Capital Management Systems).
• “Increase the induction and mentoring support to have community members provide support to teachers as well. Provide release time to new/beginning teachers to meet with communities and high-performing, effective Principal(s) as well as Parent Community Network Centers (PCNC)” (p. 46) (Conditions).
• “Track and analyze reasons why teachers leave (exit interviews/data)” (p. 46) (Conditions).
• “Track number of local recruits. Timeline Start (Implementation Date): May 2016” (p. 63).
• “Track retention of hires. Timeline Start (Implementation Date): July 2016” (p. 63).
• “Track number of participants offered/hired into HIDOE high poverty/high minority schools. Timeline Start (Implementation Date): May 2016” (pp. 63–64).
• “Survey teachers on support from the community. Timeline Start (Implementation Date): July 2016” (p. 64).

PUBLIC REPORTING OF PROGRESS
• “Starting with school year 2016-17 the HIDOE will be able to produce annual end-of-year reports on progress made. The HIDOE will continue to collect, report, and share the data annually to include trend reports that show evidence of progress over time” (p. 55).
• “The reports will be completed annually and made publicly available on our public internet site as well as the Teacher Quality site” (p. 57).
More InformationFor more information, download the Hawaii Equity plan.
Source: Hawaii Department of Education. (2015). Equitable access to excellent educators. Retrieved from http://www2.ed.gov/programs/titleiparta/equitable/hiequityplan120715.pdf
Equity Plan Overview HAWAII K-47

EQUITY PLAN OVERVIEW
IDAHO
ANALYSIS
GAPS
STRATEGIES
MEASURES
ROOTCAUSES
DEFINITIONS
ENGAGEMENT
PUBLIC REPORTING
“This plan details elements of Idaho’s approach to achieving the
objective of improving access to excellent educators for minority
and students from low-income families. Idaho is committed to
improving student outcomes across the state by expanding access
to excellent educators for all students. This plan represents a first
step in a comprehensive approach to strengthening and maintaining
educator preparation and effectiveness across the state, with an
emphasis on districts and schools demonstrating the greatest need”
(Idaho State Department of Education, 2015, p. 1).
STAKEHOLDER ENGAGEMENT
• “The stakeholders will participate in the development, implementation, and feedback for ongoing monitoring of this plan. To ensure a shared theory of action, ISDE will include stakeholder input” (p. 2).
• “Stakeholder input will be ongoing and include additional meetings and feedback loops. Each component of Idaho’s Plan to Ensure Equitable Access to Excellent Educators will be developed through this collaborative process. Stakeholder groups will be engaged to add substantive knowledge from varying perspectives to engage in ongoing data reviews, preliminary root-cause-analyses, and monitoring and modification of strategies” (pp. 2–3).
Equity Plan Overview IDAHO K-48

Equity Plan Overview IDAHO K-49
Equity Gaps
State Definitions of Key Terms: Idaho defined 11 terms. Six of those terms (excellent teacher, excellent school leader, teacher and principal evaluation ratings, teacher and principal turnover, teacher and principal absenteeism, teacher salaries) are additional definitions beyond those required by statute. All terms were used to inform identification of the State’s equity gaps.
Idaho elected to concentrate on implementing strategies tied to its largest, most significant gaps; therefore, the gaps below represent only those identified gaps that the State will implement strategies to eliminate. For additional information about Idaho’s other gaps, please click on the link in the “More Information” section.
• “This analysis matches data from the CRDC [Civil Rights Data Collection] that shows little difference between the percent of inexperienced teachers in the highest and lowest quartiles, with 5.5% of inexperienced teachers in high poverty schools versus 4.2% in low poverty schools as shown in Idaho’s Educator Equity Profile from 2011-2012” (p. 17).
• “In summary, Idaho will currently focus on the gaps associated with inexperienced teachers as it relates to poor and minority students, regardless of rural or non-rural status, and the high rate at which students are taught by unqualified teachers across all quartiles” (p. 22).
Root Causes
Root causes were grouped into “topic areas” for each state; therefore, the phrases in parentheses represent one of three broad areas in which the root causes were grouped.
• “Based on the internal ISDE Equity Team collective experiences in working with districts and educators it was hypothesized that they preliminary root cause is the inability of districts to recruit and retain educators” (p. 22) (Human Capital Management Systems).
Strategies
Strategies were grouped into “topic areas” for each state; therefore, the phrases in parentheses represent one of three in which the strategies were grouped.
• “Proposed Tax Credit for Certificated Personnel” (p. 23) (Human Capital Management Systems).
• “Regional Educational Resource Centers” (p. 24) (Human Capital Management Systems).
• “Career Ladder; 5-year phase-in for increased teacher salary beginning July 1, 2015” (p. 24) (Human Capital Management Systems).
Performance Measures
Idaho identified several performance measures. Some are listed below; please click on the link in the “More Information” section to review all of the State’s performance measures.
• “Decrease in turnover” (p. 25).
• “Increase in student performance” (p. 25).
• “Increase the level of State support and professional development opportunities for rural school districts to increase educator effectiveness” (p. 26).
• “The career ladder will assist in recruiting and retaining teachers with experience” (p. 26).

Equity Plan Overview IDAHO K-50
PUBLIC REPORTING OF PROGRESS
• “The ISDE [Idaho State Department of Education] will create a webpage specifically for posting the plan for Equitable Access to Excellent Educators along with questions and answers. This website will include a unique email address specifically for communication about this work. In addition, the website will include opportunities for feedback from stakeholders such as parents, educators, and community groups. As the plan is implemented,
information on-going monitoring that can be shared publicly will be reported to the stakeholder group and posted to the website” (p. 30).
• “The ISDE will periodically (at least annually) review and revise its plan based on annual data review and analysis with stakeholders. Public reporting will also take place via media releases to the public at least annually” (p. 30).
More InformationFor more information, download the Idaho Equity plan.
Source: Idaho State Department of Education. Idaho plan to equitable access to excellent educators. Retrieved from http://www2.ed.gov/programs/titleiparta/equitable/idequityplan11615.pdf

EQUITY PLAN OVERVIEW
ILLINOIS
ANALYSIS
GAPS
STRATEGIES
MEASURES
ROOTCAUSES
DEFINITIONS
ENGAGEMENT
PUBLIC REPORTING
“As part of the Excellent Educators for All Initiative, what follows is
the Educator Equity Plan prepared by the Illinois State Board of
Education (ISBE). Work for this project began in early August 2014
and is ongoing. This work, which occurred in three phases, supports
other ISBE initiatives as well as work of a variety of organizations in
Illinois interested in public schools, approaches to educator
preparation, and equity for all children” (Illinois State Board of
Education, 2015, p. 6).
STAKEHOLDER ENGAGEMENT
• “The development of the State Equity Plan for Illinois occurred in three phases. First, upon release of the information regarding the project from the U.S. Department of Education (ED), staff from ISBE began meeting with stakeholders to introduce the project while informing groups that the Equity Profile would not arrive until sometime in the fall. This work occurred from August through the middle of November of 2014. Second, after receipt of the Equity Profile for Illinois from ED, the data was shared with stakeholders and ISBE staff. From this, a series of claims was developed and, in order to contemplate probable causes and potential remedies, additional data was identified. This work took place in December 2014 through March 2015. Most importantly, through this work, stakeholders provided feedback leading to the identification of three probable causes. Once the conversations with stakeholder groups resulted in the identification of the same themes, work began on strategies for implementation” (p. 8).
• “In addition to continuing to meet regularly with stakeholders in order to keep them abreast of this work, data will be shared on the ISBE website, through webinars, and in the State Superintendent’s Weekly Message” (p. 48).
Equity Plan Overview ILLINOIS K-51
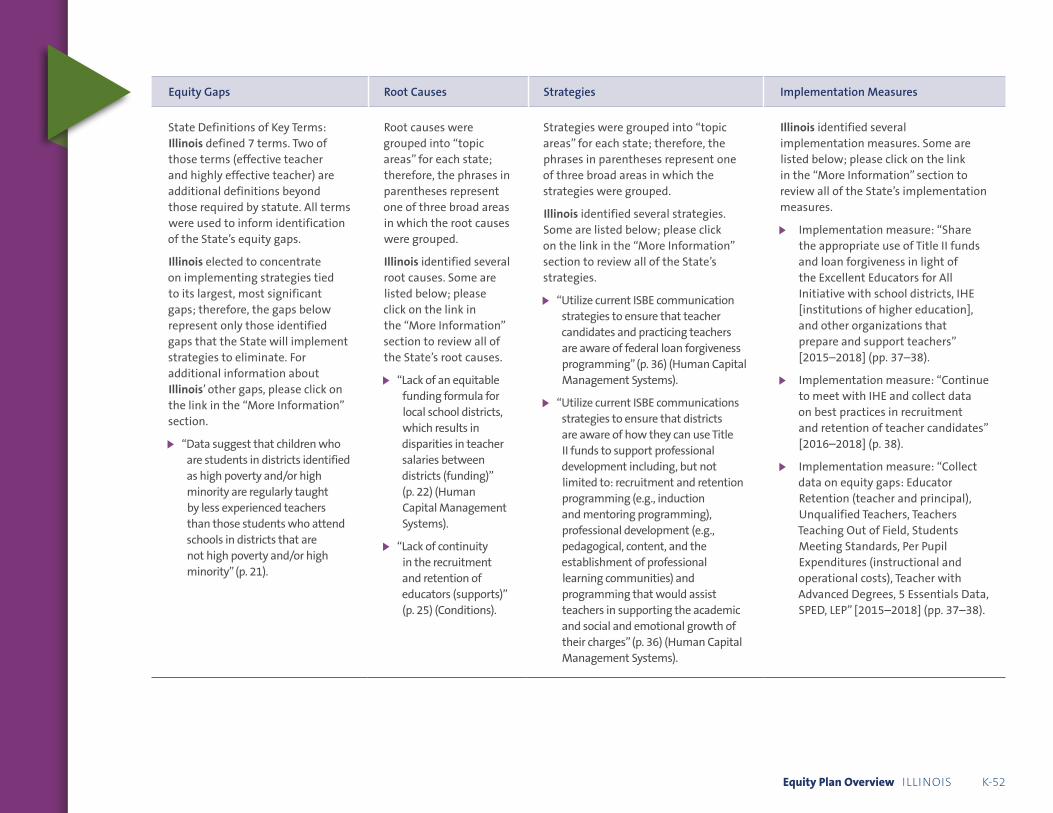
Equity Plan Overview ILLINOIS K-52
Equity Gaps
State Definitions of Key Terms: Illinois defined 7 terms. Two of those terms (effective teacher and highly effective teacher) are additional definitions beyond those required by statute. All terms were used to inform identification of the State’s equity gaps.
Illinois elected to concentrate on implementing strategies tied to its largest, most significant gaps; therefore, the gaps below represent only those identified gaps that the State will implement strategies to eliminate. For additional information about Illinois’ other gaps, please click on the link in the “More Information” section.
• “Data suggest that children who are students in districts identified as high poverty and/or high minority are regularly taught by less experienced teachers than those students who attend schools in districts that are not high poverty and/or high minority” (p. 21).
Root Causes
Root causes were grouped into “topic areas” for each state; therefore, the phrases in parentheses represent one of three broad areas in which the root causes were grouped.
Illinois identified several root causes. Some are listed below; please click on the link in the “More Information” section to review all of the State’s root causes.
• “Lack of an equitable funding formula for local school districts, which results in disparities in teacher salaries between districts (funding)” (p. 22) (Human Capital Management Systems).
• “Lack of continuity in the recruitment and retention of educators (supports)” (p. 25) (Conditions).
Strategies
Strategies were grouped into “topic areas” for each state; therefore, the phrases in parentheses represent one of three broad areas in which the strategies were grouped.
Illinois identified several strategies. Some are listed below; please click on the link in the “More Information” section to review all of the State’s strategies.
• “Utilize current ISBE communication strategies to ensure that teacher candidates and practicing teachers are aware of federal loan forgiveness programming” (p. 36) (Human Capital Management Systems).
• “Utilize current ISBE communications strategies to ensure that districts are aware of how they can use Title II funds to support professional development including, but not limited to: recruitment and retention programming (e.g., induction and mentoring programming), professional development (e.g., pedagogical, content, and the establishment of professional learning communities) and programming that would assist teachers in supporting the academic and social and emotional growth of their charges” (p. 36) (Human Capital Management Systems).
Implementation Measures
Illinois identified several implementation measures. Some are listed below; please click on the link in the “More Information” section to review all of the State’s implementation measures.
• Implementation measure: “Share the appropriate use of Title II funds and loan forgiveness in light of the Excellent Educators for All Initiative with school districts, IHE [institutions of higher education], and other organizations that prepare and support teachers” [2015–2018] (pp. 37–38).
• Implementation measure: “Continue to meet with IHE and collect data on best practices in recruitment and retention of teacher candidates” [2016–2018] (p. 38).
• Implementation measure: “Collect data on equity gaps: Educator Retention (teacher and principal), Unqualified Teachers, Teachers Teaching Out of Field, Students Meeting Standards, Per Pupil Expenditures (instructional and operational costs), Teacher with Advanced Degrees, 5 Essentials Data, SPED, LEP” [2015–2018] (pp. 37–38).

Equity Plan Overview ILLINOIS K-53
Equity Gaps Root Causes Strategies Implementation Measures
• “Data suggest that children who are students in districts identified as high poverty and/or high minority are more frequently taught by teachers without the proper licensure in comparison to those students who attend schools in districts that are not high poverty and/or high minority” (p. 21).
• “Data suggest that children who are students in districts identified as high poverty and/or high minority are more frequently taught by teachers that are not identified as highly qualified in comparison to those students who attend schools in districts that are not high poverty and/or high minority” (p. 21).
• “Data suggest that children who are students in districts identified as high poverty and/or high minority are more frequently taught by [teachers] who are absent for 10 or more days in comparison to those students who attend schools in districts that are not high poverty and/or high minority” (pp. 21–22).
• “Data suggest that teachers in districts identified as high poverty and/or high minority have a lower salary than teachers in districts that are not high poverty and/or high minority” (p. 22).
• “Lack of awareness of community (practices and values) once in a high-needs school district (cultural competency)” (p. 28) (Conditions).
• “Develop, with teacher preparation institutions, best practices for preparing individuals who wish to teach in high-poverty and/or high-minority districts and ensuring that these individuals have ample opportunity to engage in regular and prolonged field experiences in these districts” (p. 36) (Educator Preparation).
• “Award to LEAs grants for a three-year period that require: the development of recruitment and retention programming (e.g., induction and mentoring, Professional Learning Communities (PLCs), other professional development), the use of teacher leaders as instructional leaders within the school, and programming that capitalizes on the skills of parents and community members and supports family engagement” (p. 36) Human Capital Management Systems).
• Implementation measure: “Collect data on program implementation and efficacy for pilot school districts receiving grants” [2016–2018] (p. 38).
• Implementation measure: “Meet with stakeholder groups regarding the Excellent Educators for All Initiative (the State Educator Preparation and Licensure Board, the Consolidated Committee of Practitioners, and the P-20 Subcommittee on Teacher and Leader Effectiveness)” [2016–2018] (p. 38).

Equity Plan Overview ILLINOIS K-54
PUBLIC REPORTING OF PROGRESS
• “As meetings will take place in the fall and spring of each year, information and data will be shared regularly through an ISBE webpage dedicated to the Excellent Educators for All Initiative” (p. 48).
• “At the conclusion of each fiscal year, ISBE will share a report that summarizes the work that occurred in meetings as well as the data submitted by districts and institutions of higher education or provided by ISBE. This report shall include progress on the lessening of the identified equity gaps” (p. 48).
More InformationFor more information, download the Illinois Equity plan.
Source: Illinois State Board of Education. (2015). 2015 Illinois equity plan. Retrieved from http://www2.ed.gov/programs/titleiparta/equitable/ilequityplan11615.pdf

EQUITY PLAN OVERVIEW
INDIANA
ANALYSIS
GAPS
STRATEGIES
MEASURES
ROOTCAUSES
DEFINITIONS
ENGAGEMENT
PUBLIC REPORTING
“While 89 percent of Indiana educators were rated as Highly Effective
or Effective for the 2013–14 school year, this percentage does not
trickle down to the schools with the highest numbers of nonwhite
students and students receiving free and reduced-price lunch.
Furthermore, the rate of retention of our Highly Effective and Effective
teachers (Excellent Educators) in high-needs schools is lower than in
our low-needs schools. This challenge is Indiana’s biggest equity gap.
The data analyzed through the development of this plan shows that
these Highly Effective and Effective educators are leaving our high-
needs schools, possibly transferring to low-needs schools or private
schools, moving out of state, or leaving the teaching field altogether”
(Indiana Department of Education, 2015, p. 3).
STAKEHOLDER ENGAGEMENT
• “The IDOE conducted three face-to-face meetings and one virtual meeting to involve stakeholders in the development of the equity plan” (p. 5).
• “The goal of these stakeholder meetings was to provide the IDOE with needed information for the development of this plan. We provided stakeholders with background information and data needed to offer informed feedback. Stakeholders then participated in a process of identifying equity gaps, conducting a root cause analysis, and identifying strategies aligned to Indiana’s equity challenge” (p. 6).
• “The IDOE will annually survey all stakeholders to garner feedback and input regarding the implementation of the educator equity plan. This survey will ask stakeholders if they feel the plan is being implemented effectively and also request suggestions for updates and revisions” (p. 6).
Equity Plan Overview INDIANA K-55

Equity Plan Overview INDIANA K-56
Equity Gaps
State Definitions of Key Terms: Indiana defined 12 terms. Seven of those terms (equity gap, excellent educators, ineffective teacher, improvement necessary teacher, retention, focus school, and priority school) are additional definitions beyond those required by statute. All terms were used to inform identification of the State’s equity gaps.
Indiana elected to concentrate on implementing strategies tied to its largest, most significant gaps; therefore, the gaps below represent only those identified gaps that the State will implement strategies to eliminate. For additional information about Indiana’s other gaps, please click on the link in the “More Information” section.
• “Highly Effective teachers in low-poverty schools were retained at an average rate 9% higher than those in high poverty schools” (p. 21).
• “Effective teachers in low-poverty schools were retained at an average rate 14% higher than those in high-poverty schools” (p. 21).
• “Highly Effective teachers in low-minority schools were retained at an average rate 7% higher than those in high-minority schools” (p. 21).
• “Effective teachers in low-minority schools were retained at an average rate 12% higher than those in high-minority schools” (p. 21).
• “Students in low-poverty and minority schools are taught more consistently by Highly Effective and Effective teachers year to year as compared with students in high-poverty and high-minority schools” (p. 21).
Root Causes
Root causes were grouped into “topical areas” for each state; therefore, the phrases in parentheses represent one of three broad areas in which the root causes were grouped.
Indiana identified several root causes. Some are listed below; please click on the link in the “More Information” section to review all of the State’s root causes.
• “Inadequate Educator Preparation” (p. 24) (Educator Preparation).
• “Lack of Quality or Consistency of Leadership” (p. 24) (Conditions).
• “Negative and Public Political Perceptions” (p. 24) (Conditions).
• “Negative School Climate or Environment” (p. 24) (Conditions).
• “Lack of teacher mentoring and support” (p. 24) (Human Capital Management Systems).
Strategies
Strategies were grouped into “topical areas” for each state; therefore, the phrases in parentheses represent one of three broad areas in which the strategies were grouped.
Indiana identified several strategies. Some are listed below; please click on the link in the “More Information” section to review all of the State’s strategies.
• “IDOE will release resources for compensation factors, teacher leadership, and teacher retention via the new Equity website” (p. 24) (Human Capital Management Systems).
• “Implement a stakeholder group for inexperienced teachers to develop a statewide culture and climate survey” (p. 24) (Conditions).
• “IDOE will work with the Teacher-Leadership group to develop communication and programs to uplift the teaching profession in Indiana” (p. 24) (Conditions).
• “IDOE will encourage teachers to become National Board Certified teachers by releasing resources to the field” (p. 24) (Human Capital Management Systems).
Implementation Measures
Indiana identified several implementation measures. Some are listed below; please click on the link in the
“More Information” section to review all of the State’s implementation measures.
• “IDOE Annual data collections for teacher retention” (p. 24).
• “IDOE Annual data collections for poverty and minority schools and districts” (p. 24).
• “IDOE Annual data collection for teacher evaluations” (p. 24).
• “IDOE Annual report of A–F accountability letter grades” (p. 24).

Equity Plan Overview INDIANA K-57
Equity Gaps Root Causes Strategies Implementation Measures
• “Nonexistent or Nonresponsive Professional Development” (p. 24) (Human Capital Management Systems).
PUBLIC REPORTING OF PROGRESS
• “Annually IDOE will survey the original stakeholders to receive feedback on the implementation of the strategies set forth in this plan” (p. 29).
• “The survey results will be shared with stakeholders and will allow the IDOE to assess the awareness and Effectiveness of the strategies” (p. 29).
• “The IDOE will also release an annual report on the progress toward the goals and implementation of the strategies stated in this plan. The annual report will be distributed to stakeholders as well as posted on the IDOE’s equity plan website. After each annual report is published, the IDOE will reassess the strategies, review new data available, and make course corrections to the equity plan as needed” (p. 29).
More InformationFor more information, download the Indiana Equity plan.
Source: Indiana Department of Education, Division of Educator Effectiveness. (2015). Ensuring equitable access to excellent educators. Retrieved from http://www2.ed.gov/programs/titleiparta/equitable/inequityplan081115.pdf

EQUITY PLAN OVERVIEW
IOWA
ANALYSIS
GAPS
STRATEGIES
MEASURES
ROOTCAUSES
DEFINITIONS
ENGAGEMENT
PUBLIC REPORTING
“This plan details Iowa’s approach to achieving the objective of
improving access to excellent educators for the state’s most
disadvantaged youth. However, Iowa is committed to improving
student outcomes across the State by expanding access to excellent
teaching and leading for all students. As such, the plan is not just
about increasing the effectiveness of educators in high-need
districts, schools, and classrooms, but rather a comprehensive
approach to strengthening and maintaining teacher and principal
effectiveness across the state, with an emphasis on the schools
and classrooms with the greatest need” (Iowa Department of
Education, 2015, pp. 1–2).
STAKEHOLDER ENGAGEMENT
• “Two main stakeholder groups were formed to guide and provide feedback regarding the development of this plan” (p. 19).
• “First the Department convened an internal work team made of staff with specific expertise related to issues of equitable access. This group included seventeen representatives from diverse and varied backgrounds. These stakeholders included representatives from Title I, II, and Ill programs, the Board of Educational Examiners, the Iowa Civil Rights Commission, early childhood, special education, our state equity coordinator, higher education, and the standards and curriculum bureau. This group met monthly to identify gaps, conduct a root cause analysis, and identify strategies to address the root causes” (p. 19).
Equity Plan Overview IOWA K-58

• “Second, the Department worked with an external stakeholder group to provide a feedback loop and sounding board for the creation of the equitable access plan. The group includes twenty-seven members with representation from higher education, K-12 teachers and administrators, parents, legislators, the Iowa State Education Association, the Iowa Association of School Boards, School Administrators of Iowa and area education agencies, etc. Representatives from the internal team met with this group every month over the course of four months to gather feedback about the work of the internal team. Feedback was then taken back to the internal team for consideration and discussion” (pp. 19–20).
• “The State also has a network for informing stakeholder groups such as parent and community organizations. The State will reach out to these stakeholder groups to gather information on plan implementation through the use of surveys, focus groups, and posting contact information on the website in case stakeholders have questions or comments” (p. 71).
Equity Plan Overview IOWA K-59
Equity Gaps
State Definitions of Key Terms: Iowa defined 11 terms. Six of those terms (beginning teacher, career teacher, qualified or highly qualified teacher, Class B License, effective or highly effective teaching [an unfinished draft] and student achievement/student learning) are additional definitions beyond those required by statute. All terms were used to inform identification of the State’s equity plans.
For additional information about Iowa’s other gaps, please click on the link in the “More Information” section.
Root Causes
Root causes were grouped into “topic areas” for each state; therefore, the phrases in parentheses represent one of three broad areas in which the root causes were grouped.
Iowa identified several root causes. Some are listed below; please click on the link in the “More Information” section to review all of the State’s root causes.
• “Educators lack critical skills to address the needs of all students” (p. 38) (Educator Preparation).
• “The State does not have a shared definition of effective teaching to guide improvement efforts and evaluation of teaching and learning” (p. 38) (Human Capital Management Systems).
Strategies
Strategies were grouped into “topic areas” for each state; therefore, the phrases in parentheses represent one of three broad areas in which the strategies were grouped.
Iowa identified several strategies. Some are listed below; please click on the link in the “More Information” section to review all of the State’s strategies.
• “Implement multi-tiered systems of support in all Iowa schools that are sustained by evidence based practices, early warning systems and ongoing progress monitoring” (p. 40) (Human Capital Management Systems).
Implementation Measures
Iowa identified several implementation measures. Some are listed below; please click on the link in the “More Information” section to review all of the State’s implementation measures.
• “Multi-tiered systems of support in all Iowa schools that are sustained by evidence based practices, early warning systems and ongoing progress monitoring” started as an existing strategy in fall 2014 (ongoing) (p. 52).

Equity Plan Overview IOWA K-60
Equity Gaps Root Causes Strategies Implementation Measures
• “With the exception of Asian students, all of our important subgroups (minority students, students living in poverty, students with disabilities and students who are second language learners) had large and persistent achievement gaps as compared with all students” (p. 32).
• “These gaps have been in place across many years of data collection” (p. 32).
• “In some cases these gaps are widening over time. That is, fewer percentages of students in those subgroups are achieving proficient status on our large-scale accountability assessment” (p. 33).
• “Even in cases where the gaps appear over time to be lessening, the rate of improvement on closing the gap is extremely slow” (p. 33).
• “The Department has not yet identified the knowledge and skills teachers need to meet the needs of all students” (p. 38) (Educator Preparation).
• “Inconsistency in support across the State has led to considerable variation in teacher effectiveness” (p. 38) (Human Capital Management Systems).
• “One-size-fits-all approaches to improvement have not served Iowa teachers, leaders, and learners very well” (p. 38) (Human Capital Management Systems).
• “Create and support coaching networks that focus on building the capacity of teachers and leaders to create effective cultures of learning for students and adults” (p. 40) (Conditions).
• “Create structures and supports for increasing teacher leadership roles within Iowa schools” (p. 40) (Human Capital Management Systems).
• “Create a statewide structure for scaling instructional improvement initiatives with consistent levels of support and accountability at the local, State, and regional level” (p. 40) (Human Capital Management Systems).
• “Create and implement a statewide differentiated accountability system aligned to Iowa’s continuous improvement model” (p. 40) (Human Capital Management Systems).
• “Create a statewide definition of effective teaching that can guide strategic actions focused on improving teaching and learning” (p. 40) (Human Capital Management Systems).
• “Create and support coaching networks that focus on building the capacity of teachers and leaders to create effective cultures of learning for students and adults” (started spring 2015, ongoing) (p. 55).
• “Create structures and supports for increasing teacher leadership roles within Iowa schools” (started as an existing strategy in fall 2013, annually) (p. 56).
• “Create a statewide structure for scaling instructional improvement initiatives with consistent levels of support and accountability at the local, State, and regional level” (started as an existing strategy in fall 2015, ongoing) (p. 59).
• “Create a statewide definition of effective teaching that can guide strategic actions focused on improving teaching and learning” (started as an existing strategy in fall 2014, monthly) (p. 63).

PUBLIC REPORTING OF PROGRESS
• “Reports will be published on the website at times that coincide with the need for public input on proposed actions or changes to the plan. As evaluation plans for each of the initiatives identified in the equity plan are finalized, the timelines of dissemination of information will be included” (p. 71).
• “In addition, the State will use its monthly School Leader Update newsletter to inform P-12 school systems” (p. 71).
Equity Plan Overview IOWA K-61
More InformationFor more information, download the Iowa Equity plan.
Source: Iowa Department of Education. (2015). Iowa’s state plan to ensure equitable access to excellent educators. Retrieved from http://www2.ed.gov/programs/titleiparta/equitable/iaequityplan121715.pdf

EQUITY PLAN OVERVIEW
KANSAS
ANALYSIS
GAPS
STRATEGIES
MEASURES
ROOTCAUSES
DEFINITIONS
ENGAGEMENT
PUBLIC REPORTING
“Kansas believes that all children in Kansas deserve an equal
opportunity to a quality education. Kansas children, regardless of
race, income, or disability, deserve access to a safe and healthy
place to learn, rigorous expectations, and excellent educators in
every classroom. This plan will focus on ensuring that every Kansas
child has the opportunity to learn from quality teachers” (Kansas
State Board of Education, 2015, p. 2).
STAKEHOLDER ENGAGEMENT
• “The Kansas State Department of Education [KSDE] has a history of working collaboratively with teachers, principals, and superintendents, education organizations, and community groups in order to accomplish what is in the best interest of its children and youth: The plan’s success will depend, in large part, on the long-term involvement and ownership of stakeholders. KSDE staff is committed to engaging diverse stakeholders in meaningful ways as the work continues. This includes their input as Kansas designs webinars, documents, communications and other strategies for ensuring school and district staff, parents and communities have a voice. This will help ensure there is understanding and transparency with the Equitable Access Plan. KSDE has involved stakeholders from the beginning and will continue to do so by using the Kansas Multi-Tier System of Supports’ self-correcting feedback loop” (p. 5).
• “KSDE has a number of advisory councils that are important to the equitable access work. The purpose of the advisory councils in regard to the Equitable Access Plan to:
− Review data and serve as advisors on interpreting the data and the root causes behind Kansas’s equity gaps.
− Identify and prioritize root causes of inequities in accessing excellent teachers.
− Review and provide feedback on the draft plan” (p. 6).
Equity Plan Overview KANSAS K-62

Equity Plan Overview KANSAS K-63
Equity Gaps
State Definitions of Key Terms: Kansas defined 9 terms. Four of those terms (excellent teacher, excellent school leader, experienced, and percent poverty) are additional definitions beyond those required by statute. All terms were used to inform identification of the State’s equity gaps.
Kansas elected to concentrate on implementing strategies tied to its largest, most significant gaps; therefore, the gaps below represent only those identified gaps that the State will implement strategies to eliminate. For additional information about Kansas’ other gaps, please click on the link in the “More Information” section.
• “Students in districts and buildings with high concentrations of poverty are taught at higher rates by inexperienced teachers than students in districts and buildings with low concentrations of poverty” (p. 28).
Root Causes
Root causes were grouped into “topic areas” for each state; therefore, the phrases in parentheses represent one of three broad areas in which root causes were grouped.
Kansas identified several root causes. Some are listed below; please click on the link in the “More Information” section to review all of the State’s root causes.
• “Geographic Location: population density in western Kansas. Frontier, rural, semi-urban, urban” (p. 33) (Human Capital Management Systems).
• “Teacher Salaries: budget cuts; poor starting salaries” (p. 33) (Human Capital Management Systems).
• “Skill Gap: lack of aligned professional learning opportunities; inconsistent induction and mentoring opportunities” (p. 33) (Conditions).
• “Teacher Turnover: inadequate professional learning opportunities; inadequate preparation; lack of mentoring programs; requires a Master’s Degree plus experience” (pp. 34–35) (Human Capital Management Systems).
Strategies
Strategies were grouped into “topic areas” for each state; therefore, the phrases in parentheses represent one of three broad areas in which strategies were grouped.
Kansas identified several strategies. Some are listed below; please click on the link in the
“More Information” section to review all of the State’s strategies.
• “Ongoing professional learning” (p. 36) (Human Capital Management Systems).
• “Ongoing development, training and access to a system for education enterprise (p. 38) (Human Capital Management Systems).
• “Teacher preparation” (p. 41) (Educator Preparation).
• “A system of teacher evaluation to include effectiveness ratings that will inform individual professional learning needs” (p. 43) (Human Capital Management Systems).
Performance Measures
• “Kansas has established a baseline year for Gap 1 and Gap 2. Kansas will expect the Gap to close in each Gap calculation by May 2016” (p. 45).
• “Kansas will use the percentage of special education waivers in 2013-14 and the number of waivers for special education as its baseline measurements. Kansas will expect to decrease the [percentage] and the number of waivers by May 2017” (p. 45).

Equity Plan Overview KANSAS K-64
Equity Gaps Root Causes Strategies Performance Measures
• “Students in districts and buildings with high concentrations of minority students are taught at higher rates by inexperienced teachers than districts and buildings with low concentrations of minority students” (p. 28).
• “More waivers for teaching license endorsements are granted in special education than any other grade level or subject waiver (94.1%)” (p. 28).
• “Location of Minority Populations: urban versus suburban and rural; 4 priority school districts” (p. 34) (Educator Preparation).
• “Education requirements: requires a master’s degree plus experience; lack of institutions of higher education in W. [western] Kansas” (p. 35) (Educator Preparation).
PUBLIC REPORTING OF PROGRESS
“ Annually, beginning October 2015, KSDE will post on its webpage a copy of the current Plan to Ensure Equitable Access to Excellent Educators, including ongoing additions and amendments. A brief summary of the gaps will also be posted and progress toward those gaps will be reported annually on this site” (p. 47).
More InformationFor more information, download the Kansas Equity plan.
Source: Kansas State Department of Education. Kansas plan to ensure equitable access to excellent educators. Retrieved from http://www2.ed.gov/programs/titleiparta/equitable/ksequityplan92515.pdf

EQUITY PLAN OVERVIEW
KENTUCKY
ANALYSIS
GAPS
STRATEGIES
MEASURES
ROOTCAUSES
DEFINITIONS
ENGAGEMENT
PUBLIC REPORTING
“In the spirit of continuous improvement, the Kentucky Department of
Education (KDE) will ensure the Equity Plan is a purposeful, ongoing,
dynamic and living document that evolves over time. KDE will monitor
and communicate the results of improvement efforts to stakeholders,
provide technical assistance for district personnel to support their
efforts to implement strategies, engage in a continuous process of
improvement that highlights the purpose of the plan and use the
results to measure success as well as determine next steps. This plan
also outlines the five measures that will be used to evaluate impact of
the implemented strategies and explains how data from the measures
will be publicly reported to support continuous improvement”
(Kentucky Department of Education, 2015, p. 1).
STAKEHOLDER ENGAGEMENT
• ”The Commissioner regularly seeks input on education issues from partners through advisory committees and stakeholder groups” (p. 2).
• “The Equity Plan work group made contact with each advisory council and reached out to additional stakeholder groups to enlist their assistance with the communication and development of the plan” (p. 3).
• “Each meeting began with an overview of the history of equitable distribution as part of No Child Left Behind. It was explained the focus was on the distribution of highly qualified teachers to ensure that poor and minority students were not taught at higher rates than their peers. It also was explained that the federal definition of highly qualified simply meant teachers held the appropriate certification to teach the course(s) for which they were assigned” (p. 3).
Equity Plan Overview KENTUCKY K-65

• “Groups quickly recognized that having the appropriate certification was a step in the right direction, but other strategies would be necessary to ensure Excellent Educators for All. As is the norm, Kentucky turned to data analysis. Specific equity data was shared and a discussion regarding the possible root causes and strategies to address the equitable access issues ensued” (p. 3).
• “Engaging stakeholders in the development and implementation of ‘Kentucky’s Equitable Access to Effective Educators’ plan has been a priority from its inception. The KDE will continue to provide opportunities for feedback regarding the plan via the regularly scheduled meetings of the Commissioner’s advisory councils and other stakeholder groups” (p. 4).
Equity Plan Overview KENTUCKY K-66
Equity Gaps
State Definitions of Key Terms: Kentucky defined 21 terms. Sixteen of those terms (effective teacher, effective leader, overall effectiveness of school teachers and leaders, overall effectiveness, exceptional child/children and youth, first year teacher, limited English proficient (LEP), Kentucky Teacher Internship Program (KTIP), novice teacher, overall student growth rating of teachers and leaders, tenure/continuing service contract, teacher turnover, percentage of teacher turnover, retention, working conditions and working conditions calculation) are additional definitions beyond those required by statute. All terms were used to inform identification of the State’s equity gaps.
For additional information about Kentucky’s other gaps, please click on the link in the “More Information” section.
• “Students in high-poverty schools are disproportionately taught by inexperienced, and novice teachers” (p. 20).
Root Causes
Root causes were grouped into “topic areas” for each state; therefore, the phrases in parentheses represent one of three broad areas in which the root causes were grouped.
• “Teachers are not exiting their educator preparation programs prepared to meet the challenges of the profession” (p. 23) (Educator Preparation).
• “Lack of proactive recruitment efforts” (p. 26) (Human Capital Management Systems).
• “Hiring Timelines” (p. 26) (Human Capital Management Systems).
• “Teacher and student assignment. New and inexperienced teachers are often placed with students with the greatest needs” (p. 26) (Human Capital Management Systems).
Strategies
Strategies were grouped into “topic areas” for each state; therefore, the phrases in parentheses represent one of three broad areas in which the strategies were grouped.
• “Educator Preparation” (p. 23) (Educator Preparation).
• “Recruitment, Hiring, and Placement” (p. 26) (Human Capital Management Systems).
• “Ongoing Professional Learning (Teacher and Principal Development)” (p. 30) (Human Capital Management Systems).
Performance Measures
Kentucky identified several performance measures. Some are listed below; please click on the link in the “More Information” section to review all of the State’s performance measures.
• (Annual) Comprehensive District and School Improvement Plan (CDIPs/CSIPs) include Equitable Access Strategies (p. 44).
• (Annual) Onsite Monitoring of Implementation of Equitable Access Strategies through the Consolidated Monitoring Process (p. 44).
• (Fall 2016) Equity Baseline Measures in District and School Report Card (p. 44).
• (Fall 2017) Progress Measured in District and School Report Card (pp. 44–45).

Equity Plan Overview KENTUCKY K-67
Equity Gaps Root Causes Strategies Performance Measures
• “Students in high-minority schools are disproportionately taught by inexperienced and novice teachers” (p. 21).
• “Students in high-poverty schools are less likely to be taught by National Board Certified teachers” (p. 21).
• “Students in high-minority schools are less likely to be taught by National Board Certified teachers” (p. 21).
• “Schools with a high level of poverty are more likely to experience teacher turnover” (p. 21).
• “Schools with a high-minority population are more likely to experience teacher turnover” (p. 21).
• “Professional Learning is not aligned to educator need” (p. 30) (Human Capital Management).
• “Inconsistent Induction and Mentoring Opportunities” (p. 30) (Human Capital Management Systems).
• “Lack of opportunities for career advancement” (p. 37) (Conditions).
• “Lack of supportive school leadership” (p. 37) (Conditions).
• “Retention Strategies” (p. 37) (Human Capital Management Systems).
• (Annual) Revision to Statewide Equity Plan Based on Data and Stakeholder Feedback (p. 45).
PUBLIC REPORTING OF PROGRESS
“Kentucky is creating a tab on the school and district report cards to report each school’s equity measures. The report cards are published each year and provide information about the development of school and district improvement plans” (p. 40).
More InformationFor more details you can download the Kentucky Equity plan.
Source: Kentucky Department of Education. (2015). Equitable access for excellent educators plan for Kentucky. Retrieved from http://www2.ed.gov/programs/titleiparta/equitable/kyequityplan072415.pdf

EQUITY PLAN OVERVIEW
LOUISIANA
ANALYSIS
GAPS
STRATEGIES
MEASURES
ROOTCAUSES
DEFINITIONS
ENGAGEMENT
PUBLIC REPORTING
“Louisiana is committed to improving student outcomes across the
state by expanding access to excellent teachers for all students. As
such, this plan does not provide for a redistribution of high-quality
educators from low-need to high-need local education agencies (LEAs),
schools, or classrooms. Rather, this plan provides for a comprehensive
approach to teacher recruitment, certification, and improvement
across the State, with an emphasis on schools and classrooms with
the greatest need. The plan builds on practices of ‘high-poverty’ and
‘high-minority’ LEAs with rich concentrations of excellent educators,
and it addresses challenges in ‘high-poverty’ and ‘high-minority’
LEAs where students have more limited access to excellent
educators” (Louisiana Department of Education, 2015, p. 1).
STAKEHOLDER ENGAGEMENT
• “To learn more about teacher recruitment, certification, and preparation needs and opportunities, the Department in July 2014, in partnership with the Board of Regents (BOR), surveyed teachers statewide about their own experiences with preparation and in the classroom. Principals and personnel directors shared their experience hiring and supporting new teachers, and preparation program faculty shared their collaborations with partner schools and LEAs” (p. 4).
• “In addition to the above mentioned public engagement opportunities, the LDOE formed a workforce committee consisting of human resource directors from various LEAs across the state to advise the Department on teacher and leader recruitment, hiring and retention issues” (p. 5).
• “Ongoing engagement with stakeholder groups for feedback and refinement of the implementation process at least annually” (p. 16).
Equity Plan Overview LOUISIANA K-68

Equity Plan Overview LOUISIANA K-69
Equity Gaps
State Definitions of Key Terms: Louisiana defined seven terms. Two of those terms (highly effective, effective teachers) are additional definitions beyond those required by statute. All terms were used to inform identification of the State’s equity gaps.
Louisiana elected to concentrate on implementing strategies tied to its largest, most significant gaps; therefore, the gaps below represent only those identified gaps that the State will implement strategies to eliminate. For additional information about Louisiana’s other gaps, please click on the link in the “More Information” section.
• “High-poverty parishes have a higher rate of out-of-field teachers compared to the rest of the state’s parishes (15.8 percent and 10.4 percent, respectively)” (p. 9).
• “High-minority parishes have a higher rate of out-of-field teachers compared to the rest of the state’s parishes (12.7 percent and 10.2 percent, respectively)” (p. 9).
• “High-poverty parishes have a higher rate of inexperienced teachers compared to the rest of the state’s parishes (15.0 percent and 7.9 percent, respectively)” (p. 9).
• “High-minority parishes have a higher rate of inexperienced teachers compared to the rest of the state’s parishes (12.6 percent and 7.2 percent, respectively)” (p. 10).
Root Causes
Root causes were grouped into “topic areas” for each state; therefore, the phrases in parentheses represent one of three broad areas in which the root causes were grouped.
• “More Time to Practice in the Classroom” (p. 11) (Human Capital Management Systems).
• “Teacher Shortages” (p. 12) (Human Capital Management Systems).
• “Teacher Supply Not Meeting Demand” (p. 12) (Human Capital Management Systems).
• “Current Certification Policies Place Hiring Barriers on LEAs” (p. 12) (Human Capital Management Systems).
Strategies
Strategies were grouped into “topic areas” for each state; therefore, the phrases in parentheses represent one of three broad areas in which the strategies were grouped.
• “Expansion of Believe and Prepare Pilot Program’s Most Promising Teacher Preparation Practices” (p. 13) (Educator Preparation).
• “Encourage More and Stronger Partnerships Between LEAs and Preparation Programs” (p. 13) (Educator Preparation).
• “Support District Recruitment and Hiring Practices” (p. 14) (Human Capital Management Systems).
Performance Measures
• “By 2018, 50 percent of LEAs in Louisiana will have conducted a workforce analysis with the support of the LDOE that projects short- and long-term hiring needs, thus enabling LEAs to improve recruitment and placement practices” (p. 15).
• “By 2018, 50 percent of LEAs in Louisiana will have a formalized partnership with a teacher preparation program that addresses LEA hiring needs, particularly in high-need schools and subject areas, as identified through workforce analysis” (p. 15).
• “By 2020, the rate of out-of-field teachers in both high-poverty and high-minority parishes will reduce by 20 percent” (p. 15).
• “By 2020, the rate of inexperienced teachers in both high-poverty and high-minority parishes will reduce by 10 percent” (p. 15).

Equity Plan Overview LOUISIANA K-70
PUBLIC REPORTING OF PROGRESS
Louisiana will annually report Progress. “The information will be reported in an Equity Plan Data Summary Sheet and added to the Statewide Results Data Center on the LDOE website” (p. 15).
More InformationFor more information, download the Louisiana Equity plan.
Extracted from: Louisiana Department of Education. (2015). Louisiana’s plan for ensuring equitable access to excellent teachers for all students. Retrieved from http://www2.ed.gov/programs/titleiparta/equitable/laequityplan12315.pdf

EQUITY PLAN OVERVIEW
MAINE
ANALYSIS
GAPS
STRATEGIES
MEASURES
ROOTCAUSES
DEFINITIONS
ENGAGEMENT
PUBLIC REPORTING
“In our 2015 plan for equitable access, we have tried to reflect our
renewed effort to effectively integrate agency initiatives and
collaborate with professional organizations to minimize gaps in
access to excellent educators” (Maine Department of Education,
2015, p. 1).
“This plan details our approach to achieving our objective of
improving access to excellent educators for our state’s most
disadvantaged youth. However, Maine is committed to improving
student outcomes across the state by expanding access to excellent
teaching and leading for all students through the implementation
of this plan and through the implementation of Maine’s
performance evaluation and professional growth (PEPG) systems.
As such, the plan to provide equitable access to excellent educators
is a comprehensive approach to strengthening and maintaining
educator effectiveness across the State, with an emphasis on our
schools and classrooms in greatest needs” (p. 1).
Equity Plan Overview MAINE K-71

STAKEHOLDER ENGAGEMENT
• “Maine DOE held four focus groups with stakeholders in spring 2015” (p. 3).
• “Prior to the focus groups, the Maine DOE first published an article in the Maine Commissioner of Education’s Weekly Update on January 6, 2015: http://mainedoenews.net/2015/0l/06/maine-to-develop-plan-to-ensure-equitable-access-to-effective-educators/. The article provided an overview of the work to be accomplished and resulted in independent solicitations for membership our stakeholder focus group meetings” (p. 3).
• “As documented in the agendas found in Appendices B-D, stakeholders were directly involved in the root cause analysis. Stakeholders also collaborated in examining data to identify Maine’s most significant gaps in equitable access to excellent teaching and leading—which, together with our root-cause analyses, informed our theory of action” (pp. 3–4). “Moving forward, the Maine DOE plans to meet annually with these groups to share information and solicit input and assistance in the long-term implementation, monitoring, and improvement of our plan” (p. 4).
Equity Plan Overview MAINE K-72
Equity Gaps
State Definitions of Key Terms: Maine defined 14 terms. Nine of those terms (teacher, teacher turnover, principal turnover, average teacher salaries, elementary school, high school, isolated-small schools, high-risk elementary schools and high-risk high schools) are additional definitions beyond those required by statute. All terms were used to inform identification of the State’s equity gaps.
For additional information about Maine’s other gaps, please click on the link in the “More Information” section.
• “Students from high-poverty, isolated-small and high-risk schools are served by inexperienced and out-of-field teachers more often than students in other settings” (p. 13).
Root Causes
Root causes were grouped into “topic areas” for each state; therefore, the phrases in parentheses represent one of three broad areas in which the root causes were grouped.
• “Difficult to fill positions due to location and available resources and teaching demands” (p. 17) (Conditions).
• “Mentoring and induction” (p. 17) (Human Capital Management Systems).
• “High Turnover” (p. 17) (Human Capital Management Systems).
• “Salary to benefits to ratio” (p. 20) (Human Capital Management Systems).
• “Low student attendance” (p. 20) (Conditions).
Strategies
Strategies were grouped into “topic areas” for each state; therefore, the phrases in parentheses represent one of three broad areas in which the strategies were grouped.
• “Recruitment and Retention” (p. 17) (Human Capital Management Systems).
• “State Policy Driven Incentives” (p. 20) (Human Capital Management Systems).
• “Educator Preparation Enhancements” (p. 22) (Educator Preparation).
Implementation Measures
Maine identified several imple-men tation measures. Some are listed below; please click on the link in the “More Information” section to review all of the State’s implementation measures.
• “Engage the Human Capital Management Systems (HCMS) committee to review and suggest clarifications to Maine’s plan for equitable access to excellent educators” (p. 25). Start January 2015 – Annually (p. 25).
• “Maine DOE will provide a critical review of potential funding streams for longevity incentive” (p. 29). (Started as part of budget development Summer 2016, biennially,) (p. 29).

Equity Plan Overview MAINE K-73
Equity Gaps Root Causes Strategies Implementation Measures
• “Students in high-risk, isolated-small, and high-poverty schools are served by teachers who work in the school for shorter periods of time (higher turnover) than students in other settings” (p. 13).
• “Students in high school are served by principals who work in the school for shorter periods of time (higher turnover) more often than students in elementary schools and, overall, principal turnover is higher than teacher turnover” (p. 13).
• “Lack of Adequate Pre-Service Preparation for Teachers” (p. 23) (Educator Preparation).
• “Lack of Adequate pre-service preparation for principals” (p. 23) (Educator Preparation).
• “Host an update meeting with stakeholders about progress on the implementation of the equitable access plan” (Start Fall 2016, twice a year) (p. 29).
• “Review and update Maine’s Plan to Ensure Equitable Access to Excellent Educators” (Start 2017–2018, every two years) (p. 29).
PUBLIC REPORTING OF PROGRESS
• “Annually update the gap analysis described in this plan. The updated information will be posted on the Maine DOE website, shared in a newsroom article, and distributed to superintendents” (p. 24).
• “Provide regular updates in the Commissioner’s Weekly Update as progress is made on the plan” (p. 24).
• “Incorporate educator summative effectiveness rating for schools, generated through the 2016–2017 PEPG systems, into the annual gap analysis update starting in 2017–2018” (p. 24).
More InformationFor more information, download the Maine Equity plan.
Source: Maine Department of Education. (2015). Maine’s plan to ensure equitable access to excellent teachers for all students. Retrieved from http://www2.ed.gov/programs/titleiparta/equitable/meequityplan0815.pdf

EQUITY PLAN OVERVIEW
MARYLAND
ANALYSIS
GAPS
STRATEGIES
MEASURES
ROOTCAUSES
DEFINITIONS
ENGAGEMENT
PUBLIC REPORTING
“Maryland’s current plan provides statewide policy and practice
changes to support LEAs as they further examine their equitable
distribution gaps. The plan provides strategies to incentivize teachers,
to collaborate with LEAs and with teacher preparation programs, to
support current teachers with more individualized professional
development, and to acknowledge the geographical, environmental,
and institutional causes of attrition and address them through
improvements in the quality of life for all teachers. As Maryland
further develops the new State Plan to Ensure Equitable Access to
Excellent Educators in partnership with its LEAs, it is expected that
more specific and individualized strategies will be established”
(Maryland State Department of Education, 2015, p. 6).
STAKEHOLDER ENGAGEMENT
• “In the 2014–2015 school year, Maryland formed an internal committee from across the Department to gather and analyze the State data, to complete the root cause analysis, and to brainstorm strategies for addressing these causes” (p. 9).
• “Outreach to stakeholders from this preliminary analysis included the State Superintendent and the Chief Academic Officer describing and discussing the draft plan with the LEA Superintendents at the Public School Superintendents Association of Maryland (PSSAM) meeting on June 5, 2015, and later requested input by sharing an electronic copy of the draft plan” (p. 9).
• “At the May 19, 2015 State Board Meeting, Dr. Jack Smith, Chief Academic Officer, made a presentation on Maryland’s State Plan for Ensuring Equitable Access to Excellent Educators. He described the process for developing the plan and working with LEAs” (p. 9).
Equity Plan Overview MARYLAND K-74

• “Maryland expanded its outreach to stakeholder groups that represent parents and guardians. Requests for comments/input for Maryland’s Plan for Ensuring Equitable Access to Excellent Educators was sent via e-mail to the following groups on May 5, 2015: Superintendent’s Family Engagement Council; Maryland’s Parent Involvement Matters Awards winners (parents representing all 24 local school systems), and LEA Family Involvement Coordinators” (p. 10).
• “Future input will be integrated as part of Maryland’s plan to review the equity data on an annual basis in conjunction with the Master Plan reviews” (p. 12).
Equity Plan Overview MARYLAND K-75
Equity Gaps
State Definitions of Key Terms: Maryland defined 13 terms. Eight of those terms (certified teachers, highly qualified teacher [HQT], core academic classes, all HTQ and Non HQT [NHQT] classes, excellent educator, effective educator, highly effective educator, and ineffective educator) are additional definitions beyond those required by statute. All terms were used to inform identification of the State’s equity gaps.
Maryland elected to concentrate on implementing strategies tied to its largest, most significant gaps; therefore, the gaps below represent only those identified gaps that the State will implement strategies to eliminate. For additional information about Maryland’s other gaps, please click on the link in the “More Information” section.
Root Causes
Root causes were grouped into “topic areas” for each state; therefore, the phrases in parentheses represent one of three broad areas in which the root causes were grouped.
Maryland identified several root causes. Some are listed below; please click on the link in the “More Information” section to review all of the State’s root causes.
• “Insufficient supply of well-prepared teachers…” (p. 54) (Educator Preparation).
• “Geographic location…” (p. 54) (Conditions).
• “Flexible retirement…” (p. 54) (Human Capital Management Systems).
• “Teacher Attrition…” (p. 55) (Human Capital Management Systems).
Strategies
Strategies were grouped into “topic areas” for each state; therefore, the phrases in parentheses represent one of three broad areas in which the strategies were grouped.
Maryland identified several strategies. Some are listed below; please click on the link in the “More Information” section to review all of the State’s strategies.
• “Collaboratively engage in a process that uses observation and exit data from departing teachers to further refine elements of disposition to be considered when admitting a potential teacher into an educator preparation program in order to produce better teachers more likely to stay in teaching ten or more years” (pp. 61–62) (Educator Preparation).
• “Continue to facilitate ongoing conversations with teacher associations and local school systems to address seniority issues that force the placement of the least experienced teacher in the lowest salaried, and often most difficult, teaching situations” (pp. 62–63) (Human Capital Management Systems).
Implementation Measures
Maryland identified several implementation measures. Some are listed below; please click on the link in the “More Information” section to review all of the State’s implementation measures.
• “Utilize Staffing Report to monitor and improve the percentage of HQT in each LEA” (annually) (p. 72).
• “Report and analyze State Performance Plan (SPP)” Indicators (annually) (p. 73).

Equity Plan Overview MARYLAND K-76
Equity Gaps Root Causes Strategies Implementation Measures
• “Unqualified Teachers in the Highest v. Lowest Minority Quartile Schools: For minority students the gaps were much smaller, no LEA noted a gap in minority students being taught by unqualified teachers. The state wide gap is 6.3 percent thus, Maryland will address this at the state level” (p. 23).
• “Out-of-Field Teachers in the Highest v. Lowest Poverty Quartile Schools: The data for teachers teaching out-of-field in the highest poverty quartile schools showed three LEAs with significant gaps. Carroll County demonstrated a gap of 60.9 percent. There was only one high poverty school in Carroll County, which is an alternative school. The school only had four teachers (3.6 FTE’s) and two aides in 2014. It also started with 8 students in 9/30 enrollment and ended with 23 in June Net Roll as there were transfers in during the year. The alternative setting and small teacher population is why teachers were teaching multiple subjects in different fields and is why that number is so high. Charles County had a 6 percent gap and Baltimore City demonstrated a 10.8 percent gap” (p. 28).
• “Shortage Areas…” (p. 56) (Human Capital Management Systems).
• “Inconsistent Induction and Mentoring Opportunities” (p. 30) (Human Capital Management Systems).
• “Lack of opportunities for career advancement” (p. 37) (Conditions).
• “Lack of supportive school leadership” (p. 37) (Conditions).
• “Broaden and deepen their local school system partnerships to ensure that teacher candidates have authentic experiences with populations of all diversities in order to prepare adequately to serve well the critical needs of the students who most need them” (p. 62) (Educator Preparation).
• “Explore with local school system partners and education preparation providers, both traditional and alternative, ways in which practicing teachers can enhance their practice and their abilities to teach effectively and meet requirements in more than one area through additional certifications and professional development” (pp. 63–64) (Educator Preparation).
• “Monitor and collect data from eleven college/university teacher preparation programs that continue to pilot the manual described above (Preparing Educators for High Poverty/Culturally and Linguistically Diverse Schools: A Manual for Teacher Educators, Teachers, and Principals) and expand use to all preparation programs” (beginning fall 2015, establish IHE working committee to formulate integration model and means of addressing proficiency) (p. 79).

Equity Plan Overview MARYLAND K-77
Equity Gaps Root Causes Strategies Implementation Measures
• “Out-of-Field Teachers in the Highest v. Lowest Minority Quartile. Schools: The analysis of out-of-field teachers in the highest minority quartile schools as opposed to the lowest minority quartile schools also displayed only two gaps. Prince George’s has a 5.4 percentage point gap and Baltimore City has an 11.3 percentage point gap” (p. 29).
• “In the highest poverty quartile schools, three LEAs, Carroll (58.2 percent), Somerset (7.6 percent), Baltimore City (21.8 percent) and the State overall (8.8 percent) demonstrated significant gaps in the percent of classes not being taught by highly qualified teachers” (p. 30).
• “The analysis of classes not taught by highly qualified teachers in the highest minority quartile schools as opposed to the lowest minority quartile revealed gaps in three LEAs and the State. Those LEAs are Baltimore County (6.4 percent), Prince George’s (12.3 percent), and Baltimore City (5 percent). The gap statewide is 10.1 percent” (p. 31).

Equity Plan Overview MARYLAND K-78
PUBLIC REPORTING OF PROGRESS
• “Maryland will continue to print summary information in various formats that report on the collected data. These reports include (1) Analysis of Professional Salaries; (2) Staff Employed at School and Central Office Levels; (3) Professional Staff by Type of Degree and Years of Experience; and (4) Professional Staff by Assignment, Race/Ethnicity and Gender. These four reports are posted on the MSDE website (www.marylandpublicschools.org)” (p. 80).
• “Additionally, the Staffing report, which is produced biannually, will provide an additional update on this information. This data analysis will occur annually after data is returned from the LEAs. Maryland will continue to periodically review and update its plan as necessary to reflect changes in the State’s strategies and programs as required in ESEA Section 1111(f)(1)(B). Maryland will potentially set targets once the newest data is collected and can be reviewed by the LEAs and the State Board” (p. 80).
More InformationFor more information, download the Maryland Equity plan.
Source: Maryland State Department of Education. (2015). Maryland state plan to ensure equitable access to excellent educators. Retrieved from http://www2.ed.gov/programs/titleiparta/equitable/mdequityplan101615.pdf

EQUITY PLAN OVERVIEW
MASSACHUSETTS
ANALYSIS
GAPS
STRATEGIES
MEASURES
ROOTCAUSES
DEFINITIONS
ENGAGEMENT
PUBLIC REPORTING
“Our goal is to ensure that all students have the requisite knowledge,
skills, and experiences to successfully navigate an economically
viable career pathway in a 21st century economy. Put more simply,
we aim to prepare all students for success in the world that awaits
them after high school” (Massachusetts Department of Elementary
and Secondary Education, 2015, p. 4).
“Our theory of action to address the equity gaps in Massachusetts.
is based on the core belief that excellent teachers and leaders are
critical to improving student achievement:
• Whereas the teacher is the single most important school-based
factor in determining whether students sink or soar;
• Whereas the principal is critically important in setting up the
culture and structures within which teachers will find success,
leading to improved outcomes for students;
• Whereas the superintendent is critically important in setting up
the systems and structures within which educators will find
success, leading to improved outcomes for students;
• Therefore all students should have equitable access to excellent
educators. In order to attain equitable access, we must pay
particular attention to access for low income and minority
students” (p. 5).
Equity Plan Overview MASSACHUSETTS K-79

STAKEHOLDER ENGAGEMENT
• “Stakeholder engagement for the Equity Plan coincided with stakeholder engagement for the ESEA flexibility waiver. Thus, we conducted stakeholder engagement for ESEA flexibility in tandem with developing the Equity Plan. Further, the state engaged stakeholders throughout the process of developing the equity plan: after the Equity Profile was released from USED; during the development process, to analyze root causes; and in review of Equity Plan drafts” (p. 10).
• “Feedback from the stakeholder engagement mentioned above was valuable in identifying equity gaps and exploring several root causes (reflected in Section 4: Identified Equity Gaps and Section 5: Root Cause Analysis). Stakeholder feedback also demonstrated the cyclical nature of some causes and gaps. For example, school climate and culture can affect educator retention/turnover rates. In countering this attrition, hiring practices can lead to gaps in teacher experience, preparation and effectiveness, which in turn exacerbate inequities in school climate” (p. 11).
Equity Plan Overview MASSACHUSETTS K-80
Equity Gaps
State Definitions of Key Terms: Massachusetts defined 19 terms. Fourteen of those terms (absenteeism, educator, educator preparation, English language learners, evaluation ratings, excellent educators, high poverty, high needs students, high minority schools, highly qualified teacher, unqualified educator, unprepared educator, quartiles and waiver) are additional definitions beyond those required by statute. All terms were used to inform identification of the State’s equity gaps.
For additional information about Massachusetts’ other gaps, please click on the link in the “More Information” section.
• “Within Massachusetts, students of color and students from low-income families are disproportionately taught by inexperienced teachers” (p. 18).
Root Causes
Root causes were grouped into “topic areas” for each state; therefore, the phrases in parentheses represent one of three broad areas in which root causes were grouped.
Massachusetts identified three root Causes. Some are listed below; please click on the link in the “More Information” section to review the State’s root causes.
• “In Massachusetts, first year teachers are more likely to be assigned students who are academically behind when compared with students assigned to more experienced teachers” (p. 19) ( Human Capital Management Systems).
Strategies
Strategies were grouped into “topic areas” for each state; therefore, the phrases in parentheses represent one of three broad areas in which strategies were grouped.
Massachusetts identified several strategies. Some are listed below; please click on the link in the “More Information” section to review all of the State’s strategies.
• [The Student Learning Experience Report] “ This would ensure that students are not disproportionately taught by inexperienced, unqualified, chronically absent, or out of field teachers” (p. 32) (Conditions).
• “Administer and analyze several new surveys that contribute to an overall picture of educator preparation programs and inexperienced teachers’ effectiveness; Candidates Survey, Supervising Practitioners Survey, Hiring Employer Survey (one year out), and Program Completer Survey (one year out).” (p. 31) (Educator Preparation)
Performance Measures
Massachusetts identified several performance measures. Some are listed below; please click on the link in the “More Information” section to review all of the State’s performance measures.
• “ESE will provide information on the content and progress of the Equity Plan through an Annual Report and an Equitable Access section of the ESE website” (p. 43).
• “In addition to the aforementioned goals and metrics for tracking the progress of individual strategies, [Massachusetts] ESE will continue to monitor overall changes in equity gaps. ESE intends to use the following metrics to track progress toward eliminating equity gaps for student subgroups, and will publicly share this data in an annual equity report” (p. 47).

Equity Plan Overview MASSACHUSETTS K-81
Equity Gaps Root Causes Strategies Performance Measures
• “However, students in high-poverty and high-minority schools are about five times more likely than their peers in low-poverty and low-minority schools to be taught by unqualified teachers” (p. 20).
• “Students in high-poverty and high-minority schools are also more likely to have an administrator who does not have the specific license for his/her specific role” (p. 21).
• “Our data shows us that there are roughly twice as many teachers with a preliminary license in high-poverty and high-minority schools as there are in low-poverty and low-minority schools” (p. 21).
• “The average median for the student growth percentiles for teachers teaching math is 6% lower in high-poverty quartiles (HPQs) vs. low-poverty quartiles (LPQs)” (p. 24).
• “The average median for the student growth percentiles for teachers teaching math is 2% lower in HMQs vs. LMQs” (p. 24).
• “Stakeholders reported that a lack of preparation and support for serving diverse students – including ELLs, students of different cultures, and those with social-emotional needs – contributed to educator turnover” (p. 22) (Educator Preparation).
• “Inadequate Training for Diverse Student Needs” (p. 25) (Educator Preparation).
• “Rollout a revised Educator Preparation Program Approval Process, including Guidelines for Program Approval that emphasize program outcomes” (p. 30) (Educator Preparation).
• “Develop and implement the Educator Evaluation Guidebook for Inclusive Practice… which aims to align best practices in inclusive instruction and positive behavior support with core aspects of the Educator Evaluation framework” (p. 34) (Human Capital Management Systems).
• “As the equity plan is a living document subject to alterations, ESE intends to continue soliciting and responding to the feedback of diverse stakeholders” (p. 43).

Equity Plan Overview MASSACHUSETTS K-82
PUBLIC REPORTING OF PROGRESS
“ ESE will provide information on the content and progress of the equity plan through an Annual Report and an Equitable Access section of the ESE website” (p. 43).
More InformationFor more information, download the Massachusetts Equity plan.
Source: Massachusetts Department of Elementary and Secondary Education. (2015). Massachusetts state equity plan 2015-2019. Retrieved from http://www2.ed.gov/programs/titleiparta/equitable/maequityplan080715.pdf
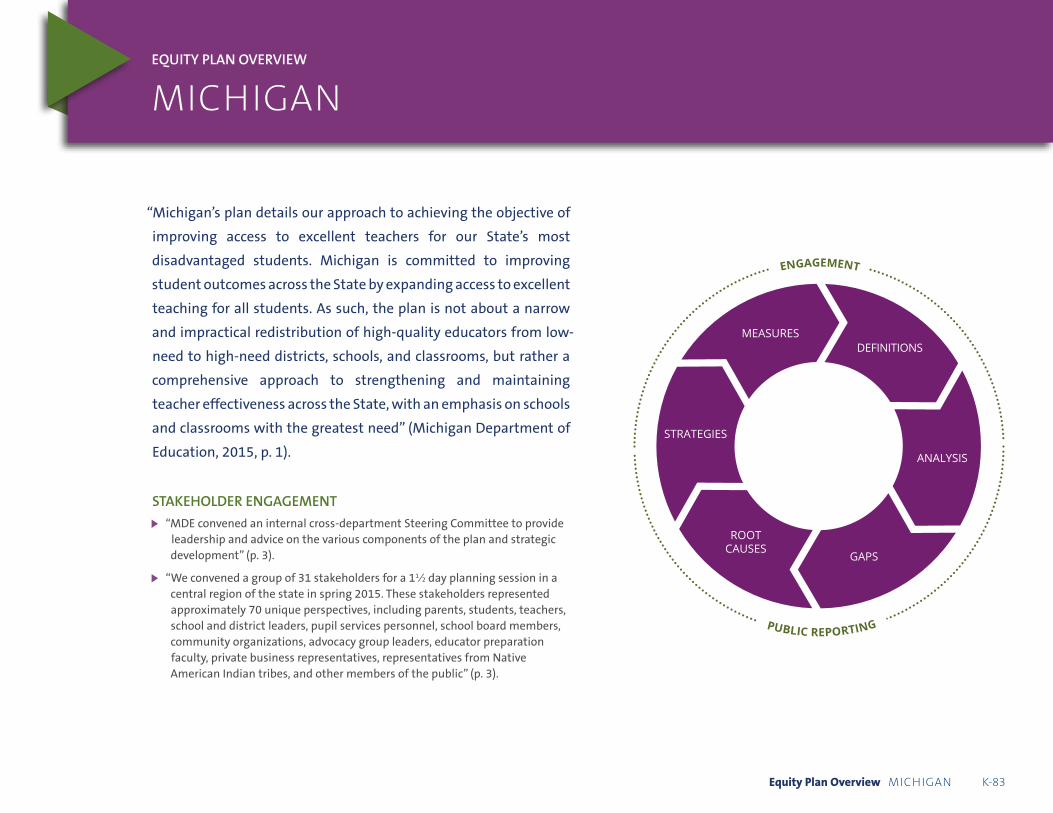
EQUITY PLAN OVERVIEW
MICHIGAN
ANALYSIS
GAPS
STRATEGIES
MEASURES
ROOTCAUSES
DEFINITIONS
ENGAGEMENT
PUBLIC REPORTING
“Michigan’s plan details our approach to achieving the objective of
improving access to excellent teachers for our State’s most
disadvantaged students. Michigan is committed to improving
student outcomes across the State by expanding access to excellent
teaching for all students. As such, the plan is not about a narrow
and impractical redistribution of high-quality educators from low-
need to high-need districts, schools, and classrooms, but rather a
comprehensive approach to strengthening and maintaining
teacher effectiveness across the State, with an emphasis on schools
and classrooms with the greatest need” (Michigan Department of
Education, 2015, p. 1).
STAKEHOLDER ENGAGEMENT
• “MDE convened an internal cross-department Steering Committee to provide leadership and advice on the various components of the plan and strategic development” (p. 3).
• “We convened a group of 31 stakeholders for a 11⁄2 day planning session in a central region of the state in spring 2015. These stakeholders represented approximately 70 unique perspectives, including parents, students, teachers, school and district leaders, pupil services personnel, school board members, community organizations, advocacy group leaders, educator preparation faculty, private business representatives, representatives from Native American Indian tribes, and other members of the public” (p. 3).
Equity Plan Overview MICHIGAN K-83

• “To ensure that we garnered meaningful input for the plan, particularly on analyzing root causes, we chose to use a highly structured process called “Structured Dialogic Design,” which ensures a focused, authentic discussion that promotes consensus building and shared ownership. Through this process, stakeholders were asked to review data, identify barriers and root causes, and develop strategies to address the barriers and root causes” (p. 3).
• “One of the strategies developed with stakeholders was to continue to involve them in further planning and implementation by establishing a statewide Excellent Educator Advisory Group (composed of many of the same stakeholder groups). This Advisory Group will oversee the long-term commitment to implementing the strategies in this plan” (p. 5).
Equity Plan Overview MICHIGAN K-84
Equity Gaps
State Definitions of Key Terms: Michigan defined 7 terms. Two of those terms (limited English proficiency [LEP] and students with disabilities [SWD]) are additional definitions beyond those required by statute. All terms were used to inform identification of the State’s equity gaps.
Michigan elected to concentrate on implementing strategies tied to its largest, most significant gaps; therefore, the gaps below represent only those identified gaps that the State will implement strategies to eliminate. For additional information about Michigan’s other gaps, please click on the link in the “More Information” section.
• “Significant gaps in proportions of experienced teachers are observable in schools with large populations of minority students and in schools with large populations of poor students” (p. 17).
• “As in Table 1, High-poverty schools have 13.3 percentage points more inexperienced teachers than low-poverty schools. This 13.3 percentage point difference, when starting from a baseline of 21.7% at low-poverty schools, translates to roughly a 60% increase” (p. 9).
Root Causes
Root causes were grouped into “topical areas” for each state; therefore, the phrases in parentheses represent one of three broad areas in which the root causes were grouped.
• “Michigan has limited state level data that shows the link between the barriers, root causes, and strategies. Therefore, MDE examined national research on factors that impact equitable access and on issues related to the teacher pipeline of recruitment, hiring, development, and retention. A summary of the relevant research studies is included in included in Appendix H. The following are some of the common findings.
− High numbers of inexperienced teachers at high-needs schools is a result of high turnover and low retention (Human Capital Management Systems).
− As many as a third of teachers leave after their first three years of teaching and almost 50 percent leave after five years (Human Capital Management Systems).
Strategies
Strategies were grouped into “topic areas” for each state; therefore, the phrases in parentheses represent one of three broad areas in which the strategies were grouped.
• “Establish and maintain an Excellent Educator Advisory group” (p. 19) (Human Capital Management Systems).
• “Establish and implement a robust agenda for data analysis to inform the Excellent Educators Advisory group in its work to identify and evaluate targeted strategies” (p. 20) (Human Capital Management Systems).
• “Implement the Michigan Teacher Corps (MTC)” (p. 20) (Human Capital Management Systems).
Implementation Measures
Michigan identified several implementation measures. Some are listed below; please click on the link in the “More Information” section to review all of the State’s implementation measures.
• “Excellent Educator Advisory Group” (strategy started July 2015) (p. 23).
• “Data Analysis Agenda” (strategy started July 2015) (p. 26).
• “Michigan Teacher Corps” (strategy started winter 2015) (p. 27).
• “School Leader and Master Teacher Capacity” (strategy started June 2015) (p. 29).

Equity Plan Overview MICHIGAN K-85
Equity Gaps Root Causes Strategies Implementation Measures
• “Once again, the share of White students falls (by approximately 8.3%) and the share of African American students rises (by approximately 37.8%)” (p. 12).
• “The overall percentage of both unqualified and out-of-field teachers is small with little variability across types of schools” (p. 17).
• “Based on these findings, the gaps in access for students in schools with large populations of minority and poor students to experienced teachers are the largest and potentially the most pressing. For that reason, this plan focuses on these gaps, while building in a plan to further explore gaps in equitable access for students with disabilities and with limited English proficiency” (p. 17).
− Problems with having high quality teachers in at-risk schools include teacher supply, teacher distribution, teacher recruitment, support for new teachers, and school environment (Human Capital Management Systems).
− Teachers plan to stay longer in schools with a positive work context, independent of the school’s student demographics (Conditions).
− Teachers stay when they have a school leader who ensures the school works properly, provides instructional leadership, and is an inclusive decision-maker (Conditions).
− Teachers stay when there are high levels of collegial support that includes having an environment of respect and trust, formal structures for collaboration and support, and a shared set of professional goals and purposes (Conditions).
− Teachers stay when the school culture reinforces norms of student discipline and parent engagement” (pp. 18–19) (Conditions).
• “Support the Kent County’s School Leader and Master Teacher Initiative” (p. 21) (Human Capital Management Systems).
• “Increase Awareness and Support Research on Teacher Loan Forgiveness Program” (p. 22) (Human Capital Management Systems).
• “Teacher Loan Forgiveness Program” (strategy started spring 2015) (p. 31).

Equity Plan Overview MICHIGAN K-86
PUBLIC REPORTING OF PROGRESS
“ When the state Annual Report on Equitable Access is released, MDE will post it on the MDE website and conduct webinars for stakeholders to share its results, respond to any questions, and obtain feedback about ways to refine and improve the plan and implementation process. MDE will also present at state
association conferences on the equitable access issue, the data, and strategies. These presentations will increase public awareness about state efforts and progress in addressing issues of inequitable access” (p. 32).
More InformationFor more information, download the Michigan Equity plan.
Source: Michigan Department of Education. Michigan’s plan to ensure equitable access to excellent teachers. (2016). Retrieved from http://www2.ed.gov/programs/titleiparta/equitable/miequityplan060115.pdf

EQUITY PLAN OVERVIEW
MINNESOTA
ANALYSIS
GAPS
STRATEGIES
MEASURES
ROOTCAUSES
DEFINITIONS
ENGAGEMENT
PUBLIC REPORTING
“This plan details strategies to ensure that all Minnesota students
have access to excellent educators. MDE has taken a comprehensive
approach to addressing intertwining root causes that affect a school
district’s or charter school’s ability to attract, train, support, and
retain excellent educators. Strategies proposed will help to address
supply and demand needs, increase support to schools that need it
most, increase the Department’s focus on equity, and provide
assistance to local schools and districts in the area of equity”
(Minnesota Department of Education, 2015, p. 2).
“MDE has prioritized the elimination of achievement gaps between
groups of students. The Department recognizes that ensuring
equitable access to excellent teachers and leaders is a key factor in
achieving the goal of cutting achievement gaps in half by 2017” (p. 2).
STAKEHOLDER ENGAGEMENT
• “Input into Minnesota’s Teacher Equity plan was provided through a series of meetings with two different groups of stakeholders. A Steering Committee was formed to design and guide the work of the plan. In addition, a larger Advisory Committee was put in place to react to the information, definitions, strategies and suggestions developed by the Steering Committee and provide feedback and additional ideas” (p. 4).
• “Membership for both committees was solicited from a wide range of organizations and interest groups” (p. 4).
Equity Plan Overview MINNESOTA K-87

• “All aspects of the plan were discussed with both the steering committee and advisory committee. This included decisions on the development of a work plan, determination of root causes, development of strategies, and plans to monitor and report progress. A substantial amount of data related
to the plan was an integral part of the discussion, and committee members requested and were provided additional data to more robustly review the information. Using the data as a foundation, the members developed a set of root causes to guide the development of strategies for this plan” (p. 4).
Equity Plan Overview MINNESOTA K-88
Equity Gaps
State Definitions of Key Terms: Minnesota defined 7 terms. Two of those terms (equity gap and equitable access) are additional definitions beyond those required by statute. All terms were used to inform identification of the State’s equity gaps.
• “Schools in the highest poverty quartile are more likely to have inexperienced, unqualified, and out-of-field teachers than schools in the lowest poverty quartile” (p. 21).
• “Schools in the highest minority quartile are more likely to have inexperienced, unqualified, and out-of-field teachers than schools in the lowest minority quartile” (p. 21).
• “Priority and Focus schools are more likely to have inexperienced, unqualified, and out-of-field teachers than Reward schools” (p. 21).
Root Causes
Root causes were grouped into “topic areas” for each state; therefore, the phrases in parentheses represent one of three broad areas in which the root causes were grouped.
• “Ineffective leadership…” (p. 24) (Human Capital Management Systems).
• “Inconsistent and ineffective induction and retention strategies…” (p. 24) (Human Capital Management Systems).
• “Inconsistent and inequitable funding systems…” (p. 24) (Human Capital Management Systems).
• “Barriers to licensure…” (p. 24) (Human Capital Management Systems).
• “Institutional racism...” (p. 24) (Conditions).
Strategies
Strategies were grouped into “topic areas” for each state; therefore, the phrases in parentheses represent one of three in which the strategies were grouped.
• “Increase the Department’s focus on equity and provide technical assistance to schools and districts in the area of equity” (p. 24) (Human Capital Management Systems).
• “Provide support to identified schools and districts through Minnesota’s Regional Centers of Excellence” (p. 24) (Human Capital Management Systems).
• “Integrate teacher equity into districts and charter World’s Best Workforce (WBWF) plans” (p. 24) (Human Capital Management Systems).
• “Implement teacher workforce development strategies that support supply and demand needs in identified content areas and schools” (p. 24) (Human Capital Management Systems).
Implementation Measures
Minnesota identified several implementation measures. Some are listed below; please click on the link in the “More Information” section to review all of the State’s implementation measures.
• “Qualified, effective team members are recruited, hired, and retained in equity specialist positions by October 1, 2015” (p. 28).
• “A State equity team representing diverse stakeholders is established by 2016” (p. 28).
• “The percentage of inexperienced teachers in schools with high poverty and minority rates, priority and focus schools, and charter schools served by the Regional Centers decreases between 2015 and 2022” (p. 33).
• “Center support to schools and districts is delivered consistently across State regions on an ongoing basis” (p. 33).

Equity Plan Overview MINNESOTA K-89
Equity Gaps Root Causes Strategies Implementation Measures
• “Charter schools are more likely to have inexperienced, unqualified, and out-of-field teachers than non-charter schools” (p. 21).
• “Strengthen teacher induction to support early career educators and those in career transition” (p. 24) (Human Capital Management Systems).
• “Increase support for charter schools, particularly charter school authorizers” (p. 24) (Human Capital Management Systems).
• “Study funding and resource allocation based on equitable access and the needs of schools and districts” (p. 24) (Human Capital Management Systems).
• “Targeted schools will demonstrate increased student proficiency rates, higher graduation rates, and reduced achievement gaps between 2015 and 2018” (p. 33).
• “The percentage of districts and charters that incorporate equitable teacher distribution based on experience and qualifications, hiring practices, and induction and mentoring in WBWF summary reports will be 100 percent by 2016 and will remain at 100 percent in 2017 and beyond” (p. 37).
• “MDE established a long-term goal to reduce the equity gap by 50 percent by the year 2022, just eight years from the 2014 baseline year” (p. 53).

Equity Plan Overview MINNESOTA K-90
PUBLIC REPORTING OF PROGRESS
• “Districts and charters are to hold an annual public meeting and publish a report each year on district or charter plans, including progress toward student achievement goals. In addition to the current components of WBWF, the public reporting should include the equitable distribution of teachers based on experience level and qualifications as well as hiring practices, induction activities and mentoring processes for less-experienced teachers. Minnesota Department of Education has been partnering with Parents United, a statewide parent advocacy group, to develop and pilot resources that districts and charters can access and use to facilitate public reporting and community engagement” (p. 35).
• “A summary of the annual report must be submitted to the Commissioner each year that documents the WBWF student achievement goals, the strategies and initiatives that the district and charter engaged in to meet the goals, and the subsequent progress made on those goals. This summary should also include data on the equitable distribution of teachers and strategies to address any inequities” (p. 35).
More InformationFor more information, download the Minnesota Equity plan.
Source: Minnesota Department of Education. (2015). State plan to ensure poor and minority students have equitable access to experienced, qualified and in-field teachers. Retrieved from http://www2.ed.gov/programs/titleiparta/equitable/mnequityplan060115.pdf

EQUITY PLAN OVERVIEW
MISSISSIPPI
ANALYSIS
GAPS
STRATEGIES
MEASURES
ROOTCAUSES
DEFINITIONS
ENGAGEMENT
PUBLIC REPORTING
“For the first time in recent memory, policymakers across the State
agree on the importance of education and the need to support
comprehensive reform efforts. The unification of the legislative
body, Governor’s office, and the heads of the education sectors has
presented a unique opportunity for Mississippi to work toward a
common goal: Ensuring a bright future for every child.
To accomplish this goal, the Mississippi Department of Education
(MDE) identified and addressed barriers to learning across the state:
• strong, consistent leadership at the district and building level;
• college and career readiness;
• sound literacy and numeracy for students by the end of
third grade;
• instructional quality for all students; and
• safe and appropriate learning environments in all schools”
(Mississippi Department of Education, 2015, p. 2).
Equity Plan Overview MISSISSIPPI K-91

STAKEHOLDER ENGAGEMENT
• Stakeholders who participated in the Stakeholder Engagement meeting were provided with school district data representing the demographics of the districts in Mississippi…using the data the participants were led through a root cause analysis to determine the possible causes for the equity gaps in the various areas of the state” (p. 15).
• “More frequent updates to inform the plan, as well as strategic approaches to addressing implementation, will be informed by our ongoing stakeholder engagement” (p. 32).
Equity Plan Overview MISSISSIPPI K-92
Equity Gaps
State Definitions of Key Terms: Mississippi defined 8 terms. Three of those terms (excellent teacher, teacher evaluation system ratings and highly qualified teacher) are additional definitions beyond those required by statute. All terms were used to inform identification of the State’s equity gaps.
Mississippi elected to concentrate on implementing strategies tied to its largest, most significant gaps; therefore, the gaps below represent only those identified gaps that the State will implement strategies to eliminate. For additional information about Mississippi’s other gaps, please click on the link in the “More Information” section.
• “Students in high minority schools are disproportionately taught by inexperienced teachers (0-3 years of experience) in comparison to schools with lower proportions of minority students” (p. 20).
• “Students in high minority schools are disproportionately taught by a higher number of non-highly qualified teachers (e.g., out of field, on emergency license, no license, expert citizen license) in comparison to schools with lower proportions of minority students” (p. 21).
Root Causes
Root causes were grouped into “topical areas” for each state; therefore, the phrases in parentheses represent one of three broad areas in which the root causes were grouped.
• “Lack of recruitment within communities” (p. 23) (Human Capital Management Systems).
• “Inadequate teacher supply” (p. 24) (Human Capital Management Systems).
• “Lack of recognition of progress” (p. 24) (Conditions).
• “Inexperienced teachers are not prepared to teach where they are placed and are not being prepared by their education training program” (p. 26) (Educator Preparation).
• “New teachers are not equipped to operate in the culture of the high-poverty schools” (p. 27) (Educator Preparation).
• “There is a cultural disconnection between students and teachers; a lack of cultural competency” (p. 27) (Educator Preparation).
Strategies
Strategies were grouped into “topical areas” for each state; therefore, the phrases in parentheses represent one of three broad areas in which the strategies were grouped.
• “Attract, Recruit, and Retain” (p. 23) (Human Capital Management Systems).
• “Cultural Competence” (p. 26) (Conditions).
• “Teacher Enhancement and Support” (p. 28) (Human Capital Management Systems).
Performance Measures
Mississippi identified several performance measures. Some are listed below; please click on the link in the “More Information” section to review all of the State’s performance measures.
• “Inexperienced Teachers: The MDE sets as a goal for the focus school districts to reduce their differential of inexperienced teachers over the next five years” (p. 31).
• “Inappropriately Licensed Teachers: The MDE sets as a goal for the focus school districts to reduce their differential of inappropriately licensed teachers over the next five years” (p. 31).
• “Educator Effectiveness: The MDE will annually review the summative scores on the Mississippi Teacher Evaluation System for each of the focus school districts to monitor their progress towards providing ‘excellent’ educators for all students” (p. 31).

Equity Plan Overview MISSISSIPPI K-93
Equity Gaps Root Causes Strategies Performance Measures
• “Students in high poverty schools are disproportionately taught by inexperienced teachers (0-3 years of experience) in comparison to schools with lower proportions of poor students” (p. 21).
• “Students in high-poverty schools are disproportionately taught by a higher number of non-highly qualified teachers (e.g., out of field, on emergency license, no license, expert citizen’s license) in comparison to schools with lower proportions of poor students” (p. 21).
• “Our data analyses revealed that 10 school districts had the most prevalent equity gaps in the state. Though the strategies will benefit all districts in our state, we have elected to focus on the following 10 districts with the most prevalent equity gaps:
− Benton County School District− Coahoma Agricultural High School− Coahoma County School District− Hazlehurst City School District− Holly Springs School District− Holmes County School District− Leflore County School District− Quitman County School District− West Tallahatchie School District− Yazoo City School District” (p. 21).
• “Culturally responsive teaching is not taught or shared with new teachers” (p. 27) (Educator Preparation).
• “Lack of teacher support” (p. 28) (Educator Preparation).
• “Division between teacher preparation programs and the school setting” (p. 28) (Educator Preparation).
• “The Bill & Melinda Gates Foundation’s college-ready strategy focuses on four initiatives to increase teachers’ effectiveness and improve students’ readiness for college and careers: (1) implementation of the MS College and Career-Ready Standards, (2) improved teacher development, (3) rigorous teacher evaluation, and (4) personalized learning for students. The Foundation will track outcomes related to the implementation, sustainability, impact, and scale of these initiatives through the Measure to Learn and Improve (MLI) project. As a state selected to participate in the MLI project, Mississippi teachers will participate in an annual survey” (p. 31).
Equity Plan Overview MISSISSIPPI K-94
PUBLIC REPORTING OF PROGRESS
“ Annual public reporting on progress toward addressing root causes to eliminate equity gaps will include posting a progress report on the MDE website, sending the link to all LEAs and stakeholders. Every two years the MDE will formally update this plan based on new data, new analyses of root causes, and new strategies” (p. 32).
More InformationFor more information, download the Mississippi Equity plan.
Source: Mississippi Department of Education. (2015). Mississippi state plan to ensure equitable access to excellent educators. Retrieved from http://www2.ed.gov/programs/titleiparta/equitable/msequityplan102915.pdf

EQUITY PLAN OVERVIEW
MISSOURI
ANALYSIS
GAPS
STRATEGIES
MEASURES
ROOTCAUSES
DEFINITIONS
ENGAGEMENT
PUBLIC REPORTING
“Missouri recognizes that inequities exist in students’ access to
great teachers and school leaders across the United States.
Students of color, students from low-income families, rural
students, students with disabilities, students with limited English
proficiency, and students who struggle academically are less likely
than their peers to have such access. The causes of these inequities
vary from place to place and context to context, with numerous
policy, practice, economic, and sociocultural factors at play. Because
of the multiple causes for inequity in teacher and leader distribution,
the solutions must be systemic rather than merely treating the
symptoms” (Missouri Department of Elementary & Secondary
Education, 2015, p. 2).
“Current Missouri data suggest that high-poverty, high-minority
and rural students experience less effective teachers at a higher
rate than do students in more affluent schools” (p. 2).
STAKEHOLDER ENGAGEMENT
• “Representatives from education associations and the Missouri Department of Elementary and Secondary Education have met on multiple separate occasions” (p. 4).
• “The first meeting included a general overview of the equity plan process, including timelines and sections required in the final plan. The meeting also included a review of a potential data set to inform the plan and discussion on potential causes and strategies” (p. 5).
Equity Plan Overview MISSOURI K-95

• “The second meeting was facilitated by the Center for Great Teachers and Leaders (GTL) and the Reform Support Network (RSN). In that meeting, participants again reviewed available data and made suggestions on additional data to inform the plan. The group also considered root causes for the inequity the data suggest. After exploring root causes, the group began to consider possible strategies to address in the plan. The group also
considered additional stakeholders to include in future conversations. These future conversations will include focus groups in school districts where the data suggest educational inequity occurs. The groups in attendance accepted the responsibility of continued conversations with their respective constituents, agreed to bring that feedback to our next meeting, and reviewed the potential timeline for moving forward” (p. 5).
Equity Plan Overview MISSOURI K-96
Equity Gaps
State Definitions of Key Terms: Missouri defined 13 terms. Eight of those terms (Rural: Remote, average poverty rate of community, discipline rate, adjusted average salary, retention rate, absenteeism, Effective index, and excellent educator) are additional definitions beyond those required by statute. All terms were used to inform identification of the State’s equity gaps.
Missouri elected to concentrate on imple-menting strategies tied to its largest, most significant gaps; therefore, the gaps below represent only those identified gaps that the State will implement strategies to eliminate. For additional information about Missouri’sother gaps, please click on the link in the “More Information” section.
Root Causes
Root causes were grouped into “topic areas” for each state; therefore, the phrases in parentheses represent one of three broad areas in which the root causes were grouped.
Missouri identified several root causes. Some are listed below; please click on the link in the “More Information” section to review all of the State’s root causes.
• “One of the primary reasons that more high-quality and diverse individuals are not recruited into teacher education programs is that there is no comprehensive effort underway at this time. While some educator preparation programs and professional associations engage in general recruitment strategies, there is no comprehensive effort and certainly none including the Department of Education” (p. 35) (Human Capital Management Systems).
• “Beginning teachers who lack the necessary content knowledge and pedagogical skills to be successful are an indication that educator preparation can be improved. In addition, too many teacher education graduates are unfamiliar with the particular challenges of urban education and are unsuccessful when placed in those settings” (p. 38) (Educator Preparation).
Strategies
Strategies were grouped into “topic areas” for each state; therefore, the phrases in parentheses represent one of three broad areas in which the strategies were grouped.
• “Recruiting High-quality and Diverse Individuals” (p. 35) (Human Capital Management Systems).
• “Ensure Relevant and Effective Preparation” (p. 37) (Educator Preparation).
Performance Measures
Missouri identified several performance measures. Some are listed below; please click on the link in the “More Information” section to review all of the State’s performance measures.
• “Surveys of administrators in the State’s most rural and high-poverty, high-minority schools will show that perceived hiring difficulties are lessening” (p. 54).
• “Educator job listing databases will have increased traffic to postings made by the most rural and high-poverty, high-minority schools” (p. 54).

Equity Plan Overview MISSOURI K-97
Equity Gaps Root Causes Strategies Performance Measures
• “According to Missouri data, teachers who are less than fully qualified are more prevalent in schools with higher percentages of high-poverty and minority students. In high-poverty schools, 16.3 percent of teachers are less than fully qualified and 15.1 percent are in high-minority schools. In rural schools, 13 percent are less than fully qualified. In contrast, in low-poverty schools the percentage of less than-fully qualified teachers. is only 5.7 percent. This is particularly prevalent at the secondary level. The gap between the percentage of less than fully qualified teachers in more affluent schools and the rural schools is 9.3 percent. The gap is 17.2 percent between the affluent schools. and the high-poverty schools, and 17.4 percent for minority schools” (p. 9).
• “In high-minority schools, 12.2 percent of teachers are instructing out-of-field, which is 5.8 percent more than secondary teachers in low-poverty schools” (p. 10).
• “On average, teachers in low-poverty schools have. 13.72 years of experience; teachers in rural schools have 12.1 years of experience; teachers in high-minority schools have 10.7 years of experience; and teachers in high-poverty schools have approximately 9.97 years of experience. This means that students in high-poverty schools have teachers with 3.75 fewer years of experience than students in low-poverty schools” (p. 10).
• “A lack of accurate data about the disciplines and regions in the state where shortages are likely to occur contributes to the use of less than fully qualified teachers. In addition to a lack of accurate data, the data are not available far enough in advance to act to alleviate the shortage” (p. 40) (Human Capital Management Systems).
• “Communities that are very rural offer few options outside of the school. (i.e. housing, social events, etc.). High-poverty and high-minority schools are sometimes located in areas that are perceived as unsafe or with student populations that a prospective teacher might not feel they will be successful teaching. When teachers are not attracted to schools in these locations, schools often must attempt to educate students with teachers who are unqualified or are needed to teach in areas for which they are not certified” (p. 42) (Human Capital Management Systems).
• “Teaching is a high-intensity occupation. There are many factors and areas of stress with which teachers must contend as a part of their duties. Significant support and development is necessary to build necessary teacher capacity. In addition, governance issues are sometimes a reason that ongoing support and development are not available. Beyond support and development, not enough opportunities exist to highlight exemplary practice that can be replicated in other school settings” (pp. 44–45) (Conditions).
• “Provide an Adequate Quantity of Qualified Candidates” (p. 40) (Conditions & Human Capital Management Systems).
• “Attract Candidates to Hard-To-Staff Areas and Locations” (p. 41) (Human Capital Management Systems).
• “Ensure Teachers are Supported and Developed by Effective Principals” (p. 43) (Human Capital Management Systems).
• “Develop Effective School Leaders” (p. 55) (Human Capital Management Systems).
• “Surveys of high school juniors and seniors will show increasing interest in pursuing teaching particularly in hard-to-staff disciplines” (p.54).
• “Incentives (once identified and made available) will be increasingly utilized” (p. 54).
• “Evaluation ratings of teachers will improve” (p. 55).
• “Evaluation ratings of principals will improve” (p. 55).

Equity Plan Overview MISSOURI K-98
Equity Gaps Root Causes Strategies Performance Measures
• “The gap in percentage of retention between low-poverty schools and high-poverty and high-minority schools is more than 23 percent” (p. 11).
• “In high-poverty schools, 21.4 percent of first-year teachers do not receive a mentor, a rate which is triple that of low-poverty schools” (p. 11).
PUBLIC REPORTING OF PROGRESS
• “After 90 days, a summary of progress on all action steps associated with the “90 Day Plan” will be developed and publicly reported. That summary will include a simple “Yes/No” indicator for each action step to communicate which steps have been completed and which steps remain in progress, including copies of any artifacts or work products that would demonstrate completion of, or substantive progress toward, the applicable action steps. A brief summary of progress toward interim benchmarks associated with longer-term action steps will also be included in the progress report” (p. 52).
• “For each of the subsequent plan phases (i.e. Six months, 12 months, 18 months, and 24 months),a similar report will be generated and publicly reported that includes detailed information about progress toward those action steps particular to the scope of the plan phase in question, along with a brief summary of progress toward longer-term goals. The 12-month report will include analysis of impact evidence and a “dashboard” data report presenting a quick summary of progress toward reducing equity gaps. The 24-month report will include an in-depth analysis of impact evidence, an updated data dashboard, and a narrative summary reflecting on the state of equitable access for all students” (p. 52).
More InformationFor more information, download the Missouri Equity plan.
Source: Missouri Department of Elementary & Secondary Education. (2015). Ensure equitable access to excellent educators. Retrieved from http://www2.ed.gov/programs/titleiparta/equitable/moequityplan073015.pdf

EQUITY PLAN OVERVIEW
MONTANA
ANALYSIS
GAPS
STRATEGIES
MEASURES
ROOTCAUSES
DEFINITIONS
ENGAGEMENT
PUBLIC REPORTING
“The Montana State Plan will make continuous progress toward full
access to excellent educators for all Montana children. Montanans
are committed to ensuring equal access for all students to
well-prepared, highly qualified, experienced, and appropriately
endorsed teachers and school leaders with an emphasis on schools
and classrooms with the greatest needs” (Office of Public Instruction,
State of Montana, 2015, p. 5).
“To shape the 2015 Montana State Plan, a team of key leaders at the
Office of Public Instruction (OPI), led by the assistant superintendent
of the Department of Education Services, followed these steps. The
OPI team:
• Developed and is implementing Montana’s strategic action plan
and timeline for engaging education stakeholders in the process.
(Attachment A)
• Reviewed data provided by the U.S. Department of Education
(ED) and the data collected and analyzed at the state level.
• Addressed root cause analyses based on the data reviewed and
through discussions with education stakeholder groups.
• Created a plan to measure and report progress on closing the
equity gap and continuously improve the State plan” (pp. 5–6).
Equity Plan Overview MONTANA K-99
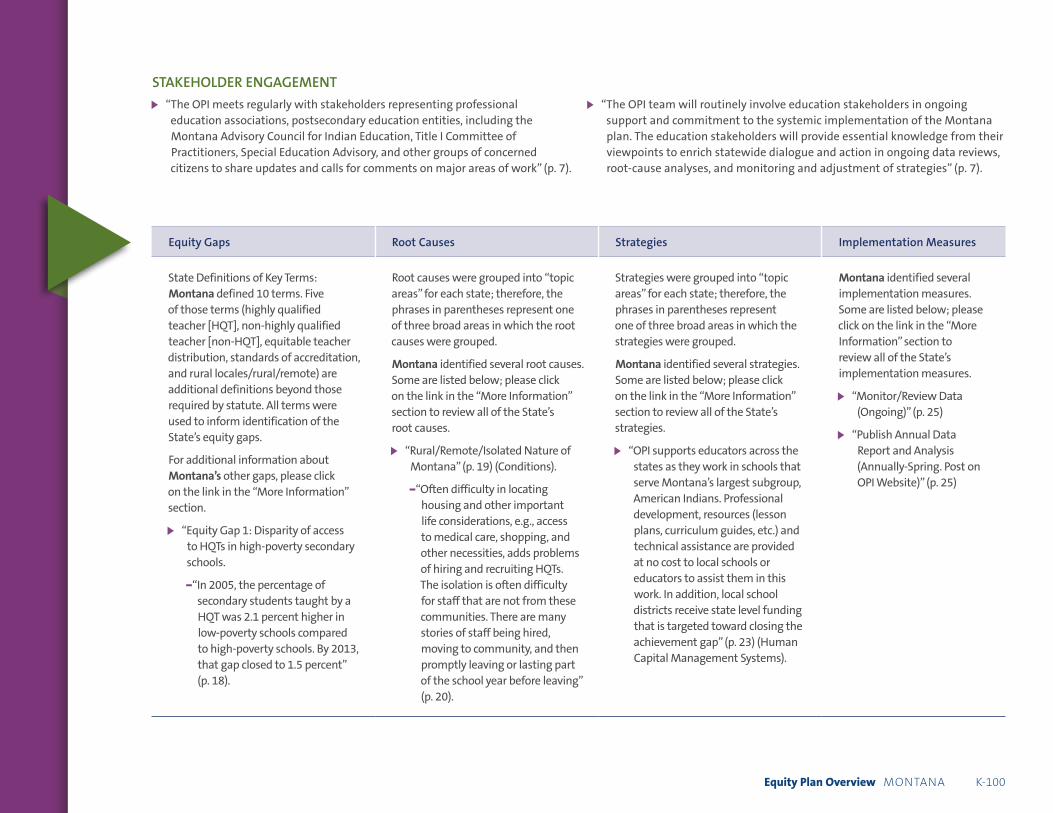
STAKEHOLDER ENGAGEMENT
• “The OPI meets regularly with stakeholders representing professional education associations, postsecondary education entities, including the Montana Advisory Council for Indian Education, Title I Committee of Practitioners, Special Education Advisory, and other groups of concerned citizens to share updates and calls for comments on major areas of work” (p. 7).
• “The OPI team will routinely involve education stakeholders in ongoing support and commitment to the systemic implementation of the Montana plan. The education stakeholders will provide essential knowledge from their viewpoints to enrich statewide dialogue and action in ongoing data reviews, root-cause analyses, and monitoring and adjustment of strategies” (p. 7).
Equity Plan Overview MONTANA K-100
Equity Gaps
State Definitions of Key Terms: Montana defined 10 terms. Five of those terms (highly qualified teacher [HQT], non-highly qualified teacher [non-HQT], equitable teacher distribution, standards of accreditation, and rural locales/rural/remote) are additional definitions beyond those required by statute. All terms were used to inform identification of the State’s equity gaps.
For additional information about Montana’s other gaps, please click on the link in the “More Information” section.
• “Equity Gap 1: Disparity of access to HQTs in high-poverty secondary schools.
−“In 2005, the percentage of secondary students taught by a HQT was 2.1 percent higher in low-poverty schools compared to high-poverty schools. By 2013, that gap closed to 1.5 percent” (p. 18).
Root Causes
Root causes were grouped into “topic areas” for each state; therefore, the phrases in parentheses represent one of three broad areas in which the root causes were grouped.
Montana identified several root causes. Some are listed below; please click on the link in the “More Information” section to review all of the State’s root causes.
• “Rural/Remote/Isolated Nature of Montana” (p. 19) (Conditions).
−“Often difficulty in locating housing and other important life considerations, e.g., access to medical care, shopping, and other necessities, adds problems of hiring and recruiting HQTs. The isolation is often difficulty for staff that are not from these communities. There are many stories of staff being hired, moving to community, and then promptly leaving or lasting part of the school year before leaving” (p. 20).
Strategies
Strategies were grouped into “topic areas” for each state; therefore, the phrases in parentheses represent one of three broad areas in which the strategies were grouped.
Montana identified several strategies. Some are listed below; please click on the link in the “More Information” section to review all of the State’s strategies.
• “OPI supports educators across the states as they work in schools that serve Montana’s largest subgroup, American Indians. Professional development, resources (lesson plans, curriculum guides, etc.) and technical assistance are provided at no cost to local schools or educators to assist them in this work. In addition, local school districts receive state level funding that is targeted toward closing the achievement gap” (p. 23) (Human Capital Management Systems).
Implementation Measures
Montana identified several implementation measures. Some are listed below; please click on the link in the “More Information” section to review all of the State’s implementation measures.
• “Monitor/Review Data (Ongoing)” (p. 25)
• “Publish Annual Data Report and Analysis (Annually-Spring. Post on OPI Website)” (p. 25)
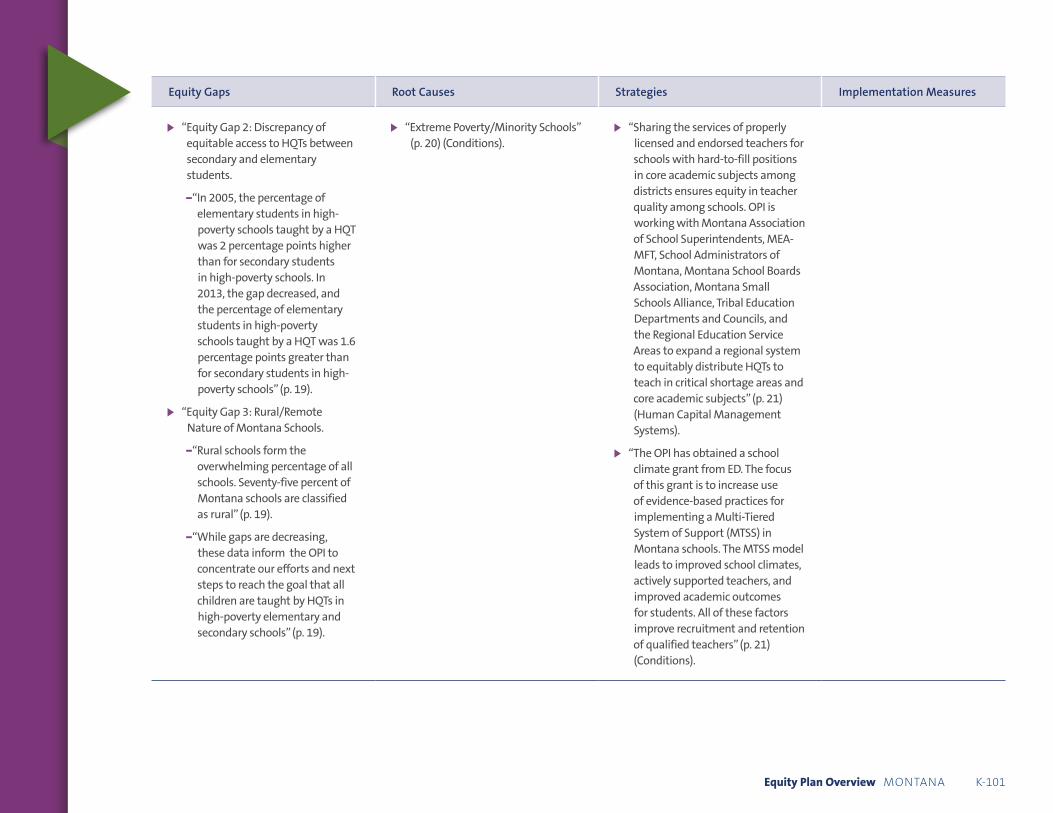
Equity Plan Overview MONTANA K-101
Equity Gaps Root Causes Strategies Implementation Measures
• “Equity Gap 2: Discrepancy of equitable access to HQTs between secondary and elementary students.
−“In 2005, the percentage of elementary students in high-poverty schools taught by a HQT was 2 percentage points higher than for secondary students in high-poverty schools. In 2013, the gap decreased, and the percentage of elementary students in high-poverty schools taught by a HQT was 1.6 percentage points greater than for secondary students in high-poverty schools” (p. 19).
• “Equity Gap 3: Rural/Remote Nature of Montana Schools.
−“Rural schools form the overwhelming percentage of all schools. Seventy-five percent of Montana schools are classified as rural” (p. 19).
−“While gaps are decreasing, these data inform the OPI to concentrate our efforts and next steps to reach the goal that all children are taught by HQTs in high-poverty elementary and secondary schools” (p. 19).
• “Extreme Poverty/Minority Schools” (p. 20) (Conditions). • “Sharing the services of properly
licensed and endorsed teachers for schools with hard-to-fill positions in core academic subjects among districts ensures equity in teacher quality among schools. OPI is working with Montana Association of School Superintendents, MEA-MFT, School Administrators of Montana, Montana School Boards Association, Montana Small Schools Alliance, Tribal Education Departments and Councils, and the Regional Education Service Areas to expand a regional system to equitably distribute HQTs to teach in critical shortage areas and core academic subjects” (p. 21) (Human Capital Management Systems).
• “The OPI has obtained a school climate grant from ED. The focus of this grant is to increase use of evidence-based practices for implementing a Multi-Tiered System of Support (MTSS) in Montana schools. The MTSS model leads to improved school climates, actively supported teachers, and improved academic outcomes for students. All of these factors improve recruitment and retention of qualified teachers” (p. 21) (Conditions).

Equity Plan Overview MONTANA K-102
PUBLIC REPORTING OF PROGRESS
“ Montana has a robust longitudinal data system that accommodates publications of these data. Further, the 2015 Montana Plan to Ensure Equitable Access to Excellent Educators will be published on the OPI website under
Highly Qualified Teacher (HQT). The OPI team will review the data annually, make adjustments, and generate interim reports to stakeholders and the public” (p. 26).
More InformationFor more information, download the Montana Equity plan.
Source: Montana Office of Public Instruction. (2015). 2015 Montana plan to ensure equitable access to excellent educators. Retrieved from http://www2.ed.gov/programs/titleiparta/equitable/mtequityplan102815.pdf

EQUITY PLAN OVERVIEW
NEBRASKA
ANALYSIS
GAPS
STRATEGIES
MEASURES
ROOTCAUSES
DEFINITIONS
ENGAGEMENT
PUBLIC REPORTING
“A culture of school success for every student, every day!” is the aim of
Nebraska’s new initiative—Accountability for a Quality Education
System, Today and Tomorrow (AQuESTT), specifically in the Educator
Effectiveness tenet. AQuESTT integrates components of accountability,
assessment, accreditation, college and career readiness standards,
and data into a system of school improvement and support for all
students (including minority and poor students) and schools.
Nebraska’s ESEA Educator Equity Plan is integrated into AQuESTT so
that there is a comprehensive approach to ensuring access to quality
educators for all students, especially the most disadvantaged
(including minority and poor students), and to strengthening and
maintaining teacher and principal effectiveness throughout the
state” (Nebraska State Board of Education, 2015, p. 1).
STAKEHOLDER ENGAGEMENT
• “On March 20, 2015, this group was tasked with analyzing the data and helping to identify the root causes or underlying issues, as well as proposing strategies to meet those issues. Members of this group were also asked to review and provide feedback on the draft plan” (p. 5).
• “Two groups of external stakeholders and two internal groups played particularly major roles in developing Nebraska’s Educator Equity Plan. The external stakeholder groups were the Nebraska Council on Teacher Education (NCTE) and the ESEA/NCLB Committee of Practitioners (COP). NCTE is comprised of approximately 60 members, representing three main constituency groups: school administrators, teachers, and the 16 approved college and university teacher preparation programs in the state. Also
Equity Plan Overview NEBRASKA K-103

represented on the NCTE full council are community colleges, private and public school administrators and teachers, and state education association leaders. NCTE Members are appointed by the State Board of Education” (p. 5).
• “A second internal group that included leaders and staff from ESEA Federal Programs, Early Childhood, Special Education, Curriculum and Instruction, Equity and Instructional Strategies, Career Education, Adult Services and Teacher Preparation, Assessment and Accountability, Accreditation and School Improvement, and the Data Research and Evaluation teams participated in the development of the equity plan and the review of the
draft plan before submission. These meetings provided the opportunities for work across the NDE to be aligned with the equity plan and supported the integration of equity issues into existing efforts, specifically the new AQuESTT accountability system” (p. 7).
• “On April 27-28, 2015, the “AQuESTT EmPOWERED by DATA” conference had over 800 teachers and administrators in attendance. In addition to presentations on AQuESTT’s Educator Effectiveness activities, a separate discussion focused specifically on this Educator Equity Plan with an opportunity for attendees to submit feedback and comments” (p. 7).
Equity Plan Overview NEBRASKA K-104
Equity Gaps
State Definitions of Key Terms: Nebraska defined 20 terms. Fifteen of those terms (rural schools, non-rural schools, elementary schools, secondary schools, 1st year teacher, total experience [district], district tenure, NeSA student achievement—below expectations, NeSA student achievement—exceeds expectations, cohort, 4-year cohort graduation rate, 18-month college-going rate, synchronous distance learning, three-year average turnover, and turnover rate) are additional definitions beyond those required by statute. All terms were used to inform identification of the State’s equity gaps.
For additional information about Nebraska’s other gaps, please click on the link in the “More Information” section.
• Although the data analysis did not show very large differences in the statutory metrics of “unqualified,” “out of field,” and “inexperienced” teachers for poor and minority students, there are gaps in the comparisons of the highest minority, highest poverty, and rural schools. However, no gaps were greater than 3.69%, and more data is needed to determine if a true “gap” actually exists, due to such small numbers” (p. 27).
Root Causes
Root causes were grouped into “topic areas” for each state; therefore, the phrases in parentheses represent one of three broad areas in which the root causes were grouped.
Nebraska identified several root causes. Some are listed below; please click on the link in the “More Information” section to review all of the State’s root causes.
• “Fewer people are entering the field of teaching in Nebraska” (p. 28) (Human Capital Management Systems).
• “Hiring policies and practices are totally under local control” (p. 29) (Human Capital Management Systems).
Strategies
Strategies were grouped into “topic areas” for each state; therefore, the phrases in parentheses represent one of three broad areas in which the strategies were grouped.
Nebraska identified several strategies. Some are listed below; please click on the link in “More Information” section to review all of the State’s strategies.
• “Strengthen local emphasis on equitable access to effective educators, especially for minority and poor students” (p. 35) (Human Capital Management Systems).
• “Increase the number of classes with appropriately endorsed teachers through the use of technology such as distance education” (p. 38) (Human Capital Management Systems).
Performance Measures
Nebraska identified several performance measures. Some are listed below; please click on the link in the “More Information” section to review all of the State’s performance measures.
• “Nebraska will meet the requirement for public reporting of progress toward eliminating equity gaps as defined in the performance goals by using the state’s report card and making annual reports to the State Board of Education. In the State of the Schools Report (SOSR) for the 2015-16 school year, the State will report:
−− The comparison of schools with the highest percentages of minority student populations and schools with lowest percentages of minority student populations (as determined by highest minority and lowest minority quartiles) and

Equity Plan Overview NEBRASKA K-105
Equity Gaps Root Causes Strategies Performance Measures
• “As Tables 8 and 9 indicate, there are some very large gaps in achievement when examining the percentage of students who “exceed” expectations and the percentage who fall “below expectations” on the Nebraska Statewide Assessment (NeSA) in both the minority and poverty comparisons. This is most obvious in the subject areas of Science and Math and more so at secondary level than at the elementary level. Achievement gaps were small or non-existent in the rural schools comparison. While student achievement is influenced by many factors, the greatest impact by far is the effectiveness of the teacher. And, teachers need leadership and supportive systems in their schools to be effective” (p. 26).
• “Lack of diversity in teacher preparation program applicants (even though much attention is given to recruitment of and support for diverse populations at several levels; i.e. Educators Rising student career organization, teacher preparation institutions, recruitment/priority efforts, various loan forgiveness programs, state, conferences, social media, etc.)” (p. 29) (Educator Preparation).
• “Mentoring programs lack state funds, a mandate, or guidelines” (p. 29) (Human Capital Management Systems).
• “RURAL SCHOOLS (majority of Nebraska schools are in small rural communities) and difficulty attracting teachers” (p. 28) (Human Capital Management Systems).
• “Loan forgiveness programs” (p. 41) (Human Capital Management Systems).
• “Work with higher education programs to encourage individuals to become teachers, especially minority populations” (p. 42) (Educator Preparation).
• “State level support for mentoring programs” (p. 42) (Human Capital Management Systems).
−− between schools with the highest percentages of student populations of poor children (those from families who live in poverty, based on eligibility for free and reduced school lunches) compared to schools with the lowest percentages of poor children (i.e. those from families who live in poverty; as determined by highest poverty and lowest poverty quartiles) at both the elementary and secondary levels, for:
>> Inexperienced teachers – reduce the gaps in the distribution of first-year teachers in high poverty and high minority schools, and
>> ‘Out of field’ teachers - reduce the gaps in the number of courses being taught by ‘out of field’ teachers in high poverty and high minority schools” (p. 48).

Equity Plan Overview NEBRASKA K-106
Equity Gaps Root Causes Strategies Performance Measures
• “It is the belief of all stakeholders, based on Stakeholder Group meetings input, and discussions with various citizens in Nebraska, that all Nebraska students, including minority and poor students, must have access to the highest quality educators possible and that the state must continue to ensure all teachers and all principals are effective educators. Nebraska further believes that improving both access to effective educators and the effectiveness of all educators, with an emphasis on achieving equity among schools with higher populations of minority and poor students, will help reduce the student outcome gaps identified in this analysis” (p. 27).
• “Nebraska is intentionally setting an annual target of improvement rather than a numeric goal for the equity performance goals since, to be truly integrated, the strategies are collaborative efforts and not unique ESEA projects:
−− Equity Plan is posted on website and used; equity issues are emphasized in conferences and trainings.
−− Number of synchronous distance learning courses in high poverty and high minority schools will increase so there are fewer
“out of field” teachers.
−− Increase number and diversity of new teachers” (p. 45).

Equity Plan Overview NEBRASKA K-107
PUBLIC REPORTING OF PROGRESS
“ This Educator Equity Plan will be evaluated through annual public reporting of progress toward meeting the performance goals and through monitoring the progress on implementing the strategies in the plan. Nebraska will meet the requirement for public reporting of progress toward eliminating equity gaps as defined in the performance goals by using the State’s report card and making annual reports to the State Board of Education” (p. 48).
More InformationFor more information, download the Nebraska Equity plan.
Source: Nebraska Department of Education. (2015). Nebraska educator equity plan. Retrieved from http://www2.ed.gov/programs/titleiparta/equitable/neequityplan082515.pdf

EQUITY PLAN OVERVIEW
NEVADA
ANALYSIS
GAPS
STRATEGIES
MEASURES
ROOTCAUSES
DEFINITIONS
ENGAGEMENT
PUBLIC REPORTING
“This plan details our approach to achieving our goal of improving
access to excellent educators for Nevada’s most disadvantaged
youth. However, Nevada is committed to improving student
outcomes across the state by expanding access to excellent
teaching and leading for all students. As such, the plan is not about
a narrow and impractical redistribution of high-quality educators
from low-need to high-need schools and classrooms, but rather a
comprehensive approach to strengthening teacher and principal
effectiveness across Nevada, with an emphasis on our schools and
classrooms with the greatest need” (Nevada Department of
Education, 2015, p. 3).
STAKEHOLDER ENGAGEMENT
• “The NDE [Nevada Department of Education] held four video-conferenced stakeholder meetings with representation from across the state in spring 2015, and solicited public input through the NDE website” (p. 4).
• “Stakeholder input illuminated the root causes and state-level strategies outlined in Section 4, which were aligned to other state-level initiatives” (p. 6).
• “The plan to continue to solicit stakeholder input is outlined in the Nevada Implementation Timeline (Table 15) and includes Summer 2016 reporting of the Equitable Access Plan Year 1 Progress Report to update equity data and discuss how the strategies are working, and Summer 2017 updating of the Nevada Plan to Ensure Equitable Access to Excellent Educators” (p. 6).
Equity Plan Overview NEVADA K-108

Equity Plan Overview NEVADA K-109
Equity Gaps
State Definitions of Key Terms: Nevada defined 34 terms. Twenty-nine of those terms (first year teacher, teacher and principal evaluation ratings, excellent teacher, excellent school administrator, student with disabilities, English learner, equitable access, equity gap, percentage [%] point difference, highest EL quartile school, lowest EL quartile school, highest IEP quartile school, lowest IEP quartile school, highest minority quartile school, lowest minority school, highest poverty quartile school, lowest poverty quartile school, equity high need school, underperforming school, persistently underperforming school, 1 star school, 2 star school, priority school, focus school–elementary and middle school, focus school–high school, victory schools, root-cause analysis, theory of action, and human capital/talent management) are additional definitions beyond those required by statute. All terms were used to inform identification of the State’s equity gaps.
For additional information about Nevada’s other gaps, please click on the link in the “More Information” section.
• “There is an 8.01 percentage point equity gap in first-year teachers with regard to the quartile of schools with the highest percentage of English learners (13.48%), compared to the quartile of schools with the lowest percentage of English learners (5.47%)” (p. 20).
Root Causes
Root causes were grouped into “topic areas” for each state; therefore, the phrases in parentheses represent one of three broad areas in which the root causes were grouped.
Nevada identified several root causes. Some are listed below; please click on the link in the “More Information” section to review all of the State’s root causes.
• “Lack of aligned professional learning based on student data and teacher needs; lack of aligned structures in a learner-centered system; and lack of alignment between initiatives” (p. 24) (Human Capital Management Systems).
• “Lack of Systemic Learner-Centered Aligned Infrastructure to Support Site-based Administrator Effectiveness” (p. 28) (Human Capital Management Systems).
• “Lack of Alignment in District Human Capital Policies” (p. 32) (Human Capital Management Systems).
• “Lack of District-wide Systemic Learner-Centered Aligned Infrastructure to Support Teacher Effectiveness” (p. 32) (Human Capital Management Systems).
Strategies
Strategies were grouped into “topic areas” for each state;
therefore, the phrases in parentheses represent one of three broad areas in which the strategies were grouped.
Nevada identified several strategies. Some are listed below; please click on the link in the “More Information” section to review all of the State’s strategies.
• “Systemic learner-centered infrastructures to support educators” (p. 32) (Human Capital Management Systems).
• “Revision of licensure renewal requirements” (p. 34) (Human Capital Management Systems).
• “Improve district recruitment, hiring, and professional learning practices for teachers at underperforming schools” (p. 34) (Human Capital Management Systems).
• “Create a Victory Schools Program” (p. 37) (Human Capital Management Systems).
• “Modernize the Nevada Plan for School Finance” (p. 38) (Human Capital Management Systems).
Performance Measures
Nevada identified several performance measures. Some are listed below; please click on the link in the “More Information” section to review all of the State’s performance measures.
• “By Summer 2016, NDE will adopt regulations for collection and reporting (anonymous and aggregate) of new NEPF school year 2015-2016 evaluation effectiveness ratings data for principals. NDE will use this data to calculate equity gaps for the four student subgroups for the State and all LEAs, and use data to further set equity goals using these metrics, such as equity gaps decline by 1 percent per year between 2016 and 2020” (p. 32).
• “By summer 2017, NDE and districts will annually track school-level hiring and retention data by teacher effectiveness performance ratings at underperforming schools and those serving students at the highest quartiles of poverty, minority, EL, and IEP schools. Principal supervisors can use these data to drive conversations with principals about how they are working to retain their most effective teachers and support ineffective teachers with professional development in alignment with NEPF standards and indicators” (p. 35).

Equity Plan Overview NEVADA K-110
Equity Gaps Root Causes Strategies Performance Measures
• “There is a 3.3 percentage point equity gap in classes not taught by highly qualified teachers with regard to the quartile of schools with the highest percentage of students from low-income families (7.86%), compared to the quartile of schools with the lowest percentage of students in from low-income families (4.56%)” (p. 20).
• “There is a 3.98 percentage point equity gap in classes not taught by highly qualified teachers with regard to the quartile of schools with the highest percentage of students of color (7.57%), compared to the quartile of schools with the lowest percentage of students of color (3.59%)” (p. 20).
• “There is a 2.99 percentage point equity gap in classes not taught by highly qualified teachers with regard to the quartile of schools with the highest percentage of English learners (7.45%), compared to the quartile of schools with the lowest percentage of English learners (4.46%)” (p. 20).
• “There is an 8.89 percentage point equity gap in first-year teachers with regard to the quartile of schools with the highest percentage of students from low-income families (14.18%), compared to the quartile of schools with the lowest percentage of students from low-income families (5.29%)” (p. 20).
• “We believe that the root-cause analysis also identifies a need for improvement in fiscal resources to match demographic shifts in Nevada’s K-12 population” (p. 35) (Human Capital Management Systems).
• “Teach Nevada Scholarship Program and programs for innovation and the prevention of remediation” (p. 38) Educator Preparation).
• “By 2018, the number of applicants per teaching vacancy by district will be roughly equivalent in high-and low-need schools” (p. 35).
• “By 2018, the percentage of teaching positions vacant on first day of school will be roughly equivalent in high- and low-need schools; between 2015 and 2020, the percentage will decline by at least 1 percent per year” (p. 35).
• “By 2018, to the extent money is available; evaluation of the effectiveness of the initiatives will include a review and analysis of data relating to each particular initiative’s goals, particularly in high-need districts and schools, which could include addressing equitable access to effective educators” (p. 38).
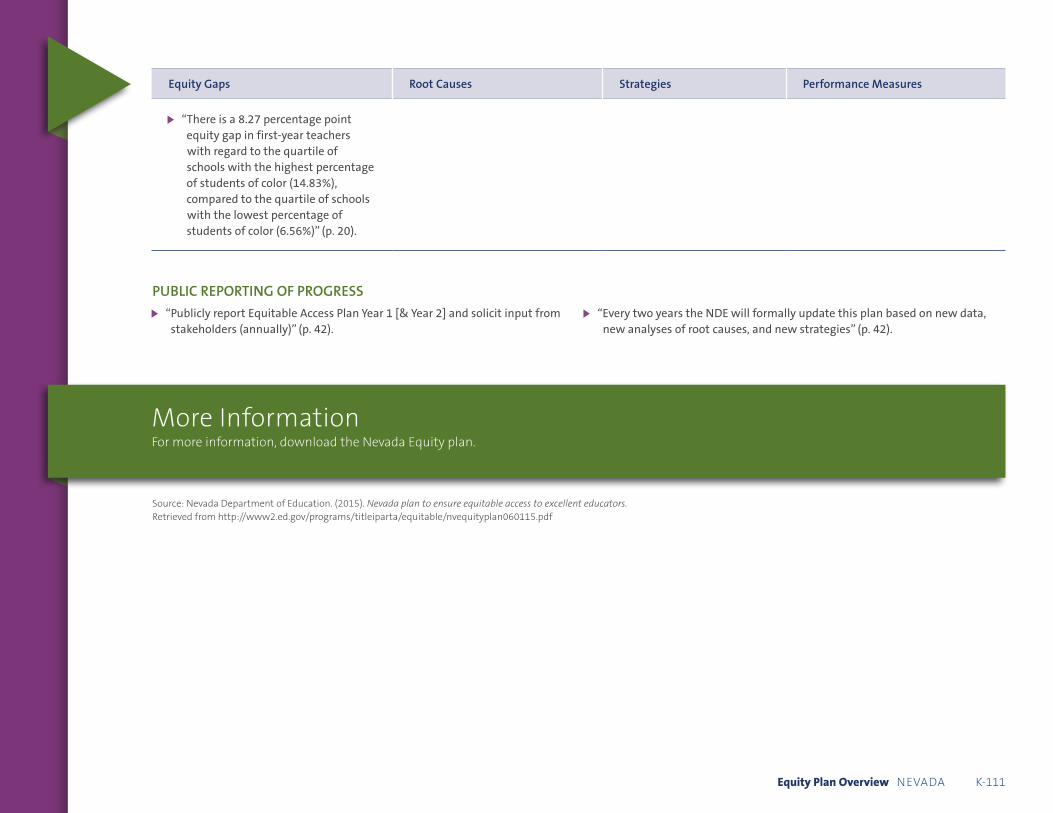
Equity Plan Overview NEVADA K-111
Equity Gaps Root Causes Strategies Performance Measures
• “There is a 8.27 percentage point equity gap in first-year teachers with regard to the quartile of schools with the highest percentage of students of color (14.83%), compared to the quartile of schools with the lowest percentage of students of color (6.56%)” (p. 20).
PUBLIC REPORTING OF PROGRESS
• “Publicly report Equitable Access Plan Year 1 [& Year 2] and solicit input from stakeholders (annually)” (p. 42). • “Every two years the NDE will formally update this plan based on new data,
new analyses of root causes, and new strategies” (p. 42).
More InformationFor more information, download the Nevada Equity plan.
Source: Nevada Department of Education. (2015). Nevada plan to ensure equitable access to excellent educators. Retrieved from http://www2.ed.gov/programs/titleiparta/equitable/nvequityplan060115.pdf

EQUITY PLAN OVERVIEW
NEW HAMPSHIRE
ANALYSIS
GAPS
STRATEGIES
MEASURES
ROOTCAUSES
DEFINITIONS
ENGAGEMENT
PUBLIC REPORTING
“This plan details our approach to achieving the objective of improving
access to excellent educators for the state’s most disadvantaged
youth. New Hampshire is committed to improving student outcomes
across the state by expanding access to excellent teachers for all
students. The New Hampshire plan is a comprehensive, systemic, and
ongoing approach to strengthening and maintaining teacher
effectiveness across the State, with an emphasis on our schools and
classrooms with the greatest need” (New Hampshire Department of
Education, 2015, p. 1).
STAKEHOLDER ENGAGEMENT
• “As a result, in late October, the Commissioner of Education requested that a Task Force be convened modeled after our Phase I and Phase II Educator Task Forces, which actively engaged a broad group of stakeholders in the development of the NH Model Educator Support and Evaluation System” (p. 3).
• “The invitees were asked to join the Task Force to actively engage in a review of state data summaries to discuss equity gaps, their root causes and potential ameliorating strategies” (p. 4).
• “The NH DOE will seek to engage school districts and their communities in relevant dialogue that helps to clarify specific contexts of each unique setting that may influence current gap status as well serve to understand the potential levers for change and improvement that are best suited to each location” (pp. 31–32).
• “In addition, additional opportunities for communication will be discussed with stakeholders beginning with the meeting already scheduled for June 4, 2015” (p. 32).
Equity Plan Overview NEW HAMPSHIRE K-112

Equity Plan Overview NEW HAMPSHIRE K-113
Equity Gaps
State Definitions of Key Terms: New>Hampshire defined seven terms. Two of those terms (effective teacher and highly qualified teacher) are additional definitions beyond those required by statute. All terms were used to inform identification of the State’s equity gaps.
New>Hampshire elected to concentrate on implementing strategies tied to its largest, most significant gaps; therefore, the gaps below represent only those identified gaps that the State will implement strategies to eliminate. For additional information about New>Hampshire’s>other gaps, please click on the link in the “More Information” section.
• “In the state a statistically significant higher average of beginning teachers is serving students in the highest poverty quartile of districts and schools compared to the average number of beginning teachers serving students in the lowest poverty quartile of districts and schools” (p. 16).
• “In the Manchester School District, a statistically significant higher average of beginning teachers is serving students in the highest poverty quartile of districts and schools compared to the average number of beginning teachers serving students in the lowest poverty quartile of districts and schools” (p. 16).
• “In the Manchester School District, a statistically significant higher average of beginning teachers is serving the highest quartile of minority students in districts and schools compared to the average number of beginning teachers serving the lowest quartile of minority students in districts and schools” (p. 16).
Root Causes
Root causes were grouped into “topic areas” for each state; therefore, the phrases in parentheses represent one of three broad areas in which the root causes were grouped.
• “Culture of Respect Within School and Community” (p. 21) (Conditions).
• “Culture of Low Expectation” (p. 21) (Conditions).
• “Better Teacher Preparation/Better Communication With Teacher Preparation” (p. 21) (Educator Preparation).
Strategies
Strategies were grouped into “topic areas” for each state; therefore, the phrases in parentheses represent one of three broad areas in which the strategies were grouped.
New>Hampshire identified several strategies. Some are listed below; please click on the link in the “More Information” section to review all of the State’s strategies.
• “Parent/Community Engagement” (p. 21) (Human Capital Management Systems).
• “MTSS [Multi-tiered systems of support]” (pp. 22–23) (Human Capital Management Systems). • “Student-Centered Learning” (p. 25) (Human Capital Management Systems). • “Culturally Responsive Professional Development for teachers and leadership” (p. 26) (Condtions).
Implementation Measures
New>Hampshire identified several implementation measures. Some are listed below; please click on the link in the “More Information” section to review all of the State’s implementation measures.
• “Parent/Community Engagement” (started February 2016) (pp. 21–22).
• “Multi-tiered Systems of Support” (started February 2016) (pp. 22–23).
• “Culturally Responsive Professional Development for Teachers and Leadership” (started February 2016) (p. 24).
• “Student-Centered Learning Engagement” (started February 2016) (p. 25).

Equity Plan Overview NEW HAMPSHIRE K-114
PUBLIC REPORTING OF PROGRESS
“ Based on data collected from biannual site visits to school districts the NH DOE will annually provide an update of progress on plan implementation efforts and changes in identified gap areas by posting to the New Hampshire Department of Education website” (p. 33).
More InformationFor more information, download the New Hampshire Equity plan.
Source: New Hampshire Department of Education. (2015). Ensuring equitable access for all students to excellent educators. Retrieved from http://www2.ed.gov/programs/titleiparta/equitable/nhequityplan91415.pdf

EQUITY PLAN OVERVIEW
NEW JERSEY
ANALYSIS
GAPS
STRATEGIES
MEASURES
ROOTCAUSES
DEFINITIONS
ENGAGEMENT
PUBLIC REPORTING
“As a state, we are deeply committed to attracting, developing, and
retaining a world-class corps of educators. This involves creating
policies and programs to support teachers and leaders throughout
their entire lifecycle as educators. This process starts with fully
preparing strong candidates, recruiting those candidates into New
Jersey school districts, supporting them as they grow and develop,
and working to retain them within the profession and the state.
Initiatives supporting these work streams support the end goal of
ensuring excellent educators are driving positive student outcomes
in all New Jersey classrooms” (New Jersey Department of Education,
2015, pp. 8–9).
STAKEHOLDER ENGAGEMENT
“Engagement with external stakeholders is essential to ensure that New Jersey’s plan is comprehensive, sustainable, and likely to lead to significant progress in eliminating equity gaps. The Department has sought and will continue to ensure representative stakeholder groups and have established the following approach for this engagement:
• Solicit Feedback on Federal Guidance
• Solicit Specific Strategy Support
• Conduct Ongoing and Additional Outreach” (pp. 3–4).
Equity Plan Overview NEW JERSEY K-115

Equity Plan Overview NEW JERSEY K-116
Equity Gaps
State Definitions of Key Terms: New Jersey defined 13 terms. Eight of those terms (educators, excellent educators, novice teachers, equity gap, equitable access, students with limited English proficiency [LEP], students with disabilities, and root-cause) are additional definitions beyond those required by statute. All terms were used to inform identification of the State’s equity gaps.
New Jersey elected to concentrate on implementing strategies tied to its largest, most significant gaps; therefore, the gaps below represent only those identified gaps that the State will implement strategies to eliminate. For additional information about New Jersey’s other gaps, please click on the link in the “More Information” section.
• “…HQT lacks a measure of skills to adequately deliver content. In the future, the Department will be able to study multiple years of data gathered from the new AchieveNJ evaluation system to identify trends that can better inform student access to excellent educators across the state” (p. 17).
• “The Matrix Report for the 2013-14 school year identified 3,706 of New Jersey’s 114,265 teachers (3.2%) as potentially working out of their field. A significant number of New Jersey students—more than one-fifth—are taught by at least one teacher who does not hold certification in the appropriate area…the student level data reveals a small but significant equity gap between racial and ethnic subgroups and along the lines of economic disadvantage” (p. 18).
• “The Department recognizes Black-White and Hispanic-White equity gaps in access to in-field teachers. These gaps appear to be driven almost entirely by a handful of districts…in the 10 districts with the most out-of -field teachers, large gaps exist, and these districts tend to have larger populations in disadvantaged subgroups. In looking at the data for “All Other Districts”, the out- of-field gaps are either dramatically smaller or nonexistent. Therefore, if the Department solves the equity gap in the top 10 districts, the gaps will be nearly eliminated” (p. 19).
Root Causes
Root causes were grouped into “topic areas” for each state; therefore, the phrases in parentheses represent one of three broad areas in which the root causes were grouped.
New Jersey identified several root causes. Some are listed below; please click on the link in the “More Information” section to review all of the State’s root causes.
• “Lack of awareness about, focus on, and/or ability to impact out-of-field placement in some districts” (p. 27) (Human Capital Management Systems).
• “Lack of clarity around link between endorsement area and job duties” (p. 28) (Human Capital Management Systems).
• “Teacher turnover is one of the most likely reasons that a significant portion of New Jersey students are being taught by novice teachers…” (p. 30) (Human Capital Management Systems).
Strategies
Strategies were grouped into “topic areas” for each state; therefore, the phrases in parentheses represent one of three broad areas in which the strategies were grouped.
New Jersey identified several strategies. Some are listed below; please click on the link in the “More Information” section to review all of the State’s strategies.
• “Use improved evaluation structures to provide better data, feedback, and support” (p. 23) (Human Capital Management Systems).
• “Ensure districts receive appropriate support, improve understanding of certification eligibility” (p. 28) (Human Capital Management Systems).
• “Support novice teachers through more robust and meaningful preparation, certification, and induction practices” (p. 30) (Human Capital Management Systems).
• “Regional Achievement Centers” (p. 34) (Human Capital Management Systems).
Performance Measures
New Jersey identified several performance measures. Some are listed below; please click on the link in the “More Information” section to review all of the State’s performance measures.
• “We will continue to collect and analyze relevant data to access metrics with the goal of eliminating 50% of identified areas of inequity within three years and 90% within six years, with a focus on closing identified within school gaps” (p. 37).

Equity Plan Overview NEW JERSEY K-117
PUBLIC REPORTING OF PROGRESS
• “The Department is committed to continue reporting on the equity gaps identified through this report and future gaps made evident by the additional data collection efforts detailed in Action 1A and 1B. We will do so by taking the following steps on an annual basis:
− Produce the matrix report for dissemination to LEAs.
− Report on educator evaluation and disseminate publicly through the Department’s website, external broadcast communication tools, and press releases, if applicable.
− Update the Educator Preparation Provider Reports on an annual basis” (p. 37).
• “In addition, the Department plans to follow federal requirements related to future updates of the Excellent Educators for All Initiative which will include an update of all data points identified in this plan. This information will be made available publicly through the Department’s website” (p. 37).
More InformationFor more information, download the New Jersey Equity plan.
Source: New Jersey State Board of Education. (2015). Excellent educators for all initiative. Retrieved from http://www2.ed.gov/programs/titleiparta/equitable/njequityplan092415.pdf

EQUITY PLAN OVERVIEW
NEW MEXICO
ANALYSIS
GAPS
STRATEGIES
MEASURES
ROOTCAUSES
DEFINITIONS
ENGAGEMENT
PUBLIC REPORTING
“The public K-12 education system in New Mexico serves over 330,000
students through 89 school districts and 96 charter schools. New
Mexico’s student population is 60% Hispanic and 75% minority. Over
two-thirds of the state’s students qualify for free or reduced price
lunch. The state’s demographics add urgency to this plan, as any
unequal access minority or economically disadvantaged students
impacts a majority of the state” (New Mexico Public Education
Department, 2015, p. 4).
“Ensuring equal access to an excellent education for all children is a
promise the New Mexico Public Education Department (PED) is
committed to deliver” (p. 2).
STAKEHOLDER ENGAGEMENT
• “Three in-person stakeholder meetings were hosted in Albuquerque, Roswell, and Santa Fe” (p. 5).
• “Each meeting followed the same agenda: PED opened by sharing the equity data and describing current efforts to address the gaps and then engaged in an open dialogue with attending stakeholders” (p. 5).
• “As New Mexico continues implementation of its educator equity plan, it has made the following commitments in regards to ongoing stakeholder engagement:
− Annual meetings to report on equity gaps and progress in implementing programs to address the gaps.
− Annual, public reporting on educator equity progress through the district report card and PED website” (p. 6).
Equity Plan Overview NEW MEXICO K-118

Equity Plan Overview NEW MEXICO K-119
Equity Gaps Root Causes Strategies Implementation Measures
State Definitions of Key Terms: New Mexico defined 14 terms. Nine of those terms (equity gap, experienced teachers, less-than-effective teachers, local education agency or school district [LEA], qualified teachers, stakeholder, summative teacher evaluation, effective teachers, and teacher preparation program) are additional definitions beyond those required by statute. All terms were used to inform identification of the State’s equity gaps.
• “Minority and Economically Disadvantaged Students Have a Greater Chance of Having a Minimally Effective or Ineffective Teacher” (p. 12).
• “The Lowest Performing Students in the State Have a Similar Chance of Being Taught by an Effective Teacher” (p. 16).
• “The Gaps Between Minority and Economically Disadvantaged Students’ Access to an Effective Teacher is Exaggerated in Math and Science” (p. 18).
• “Inexperienced teachers have similar rates of ineffectiveness to experienced teachers, but are less likely to be highly effective of exemplary; there are very few unqualified teachers in the state” (p. 21).
Root causes were grouped into “topic areas” for each state; therefore, the phrases in parentheses represent one of three broad areas in which the root causes were grouped.
New Mexico identified several root causes. Some are listed below; please click on the link in the “More Information” section to review all of the State’s root causes.
• “Cultural Competency” (p. 22) (Conditions).
• “Recruiting and Retaining Effective Teachers” (p. 22) (Human Capital Management Systems).
• “Teacher Preparation” (p. 22) (Educator Preparation).
• “Mentorship and Professional Development” (p. 23) (Human Capital Management Systems).
Strategies were grouped into “topic areas” for each state; therefore, the phrases in parentheses represent one of three broad areas in which the strategies were grouped.
New Mexico identified several strategies. Some are listed below; please click on the link in the “More Information” section to review all of the State’s strategies.
• Teacher Preparation: NMPrep; American Indian Education Training Program; Teacher Preparation Report (pp. 24–26). (Educator Preparation).
• Cultural Competency: Enhancing the NM TEACH Educator Effectiveness Classroom Observation Protocol; Academic Language Development for all (ALD4ALL) in New Mexico (pp. 26–28) (Conditions).
• Recruitment and Retention of Effective Teachers: NMTEACH; Pay for Performance Pilot Program; Streamlined Teacher Licensure Advancement; Santa Fe Fellows Program; Policy Enabling Better Recruitment and Retention of Effective Teachers: Administrative Licensure, Level I Teacher Licensure Alternatives, Eliminating unnecessary credit requirements, and Highly Qualified Teacher Waiver (pp. 28–33) (Human Capital Managements Systems).
• Mentoring and Professional Development: AP Teacher Training; Teachers Pursuing Excellence; Regional Capacity-Building in New Mexico: WIDA Professional Certification (pp. 33–35). (Human Capital Management Systems).
New Mexico identified several implementation measures. Some are listed below; please click on the link in the “More Information” section to review all of the State’s implementation measures.
• “Determine the impact of teachers in their first 3 years of teaching on student achievement and collaborating with Colleges of Education on how to improve their performance” (p. 37).
• “Review first-year mentoring programs across the state and finding best practices for sharing across districts and charters” (p. 37).
• “Implement a teacher preparation approval process that drives effectiveness from training programs” (p. 37).
• “Analyze potential gaps between English language learners and non-English language learners and students with disabilities and those without” (p. 37).

Equity Plan Overview NEW MEXICO K-120
PUBLIC REPORTING OF PROGRESS
• “…on an annual basis, PED will conduct the same analyses documented in this report and create a longitudinal data set to track the state’s progress in closing educator equity gaps. Specifically, the annual analyses will focus on minority and economically disadvantaged students’ access to effective teachers, with a specific look at math and science teachers, Q1 and Q3 students and geography. The results of these analyses will be shared at annual educator equity plan monitoring meetings” (p. 37).
• “This plan, along with documents associated with annual monitoring meetings will be posted on the PED website (http://ped.state.nm.us/ped/index.html) when finalized” (p. 37).
More InformationFor more information, download the New Mexico Equity plan.
Source: New Mexico Department of Education. (2015). New Mexico plan to ensure equitable access to excellent educators. Retrieved from http://www2.ed.gov/programs/titleiparta/equitable/nmequityplan060115.pdf

EQUITY PLAN OVERVIEW
NEW YORK
ANALYSIS
GAPS
STRATEGIES
MEASURES
ROOTCAUSES
DEFINITIONS
ENGAGEMENT
PUBLIC REPORTING
“The Department strives to ensure that all students graduate from
secondary school and are college- and career-ready. Currently, two
predominant issues limit the Department’s ability to realize this
vision—persistent achievement gaps between student subgroups
and inequitable access to the most effective educators” (New York
State Education Department, 2015, p. 4).
“Additionally, compared to their peers, students from low-income
families, minority students, particularly Black and Hispanic students,
and the lowest achieving students in New York State are considerably
more likely to be placed with teachers who are rated ‘Ineffective’ on
State-provided measures of student growth” (p. 4 ).
“Family income, race, and other student demographics should not
predict the likelihood of a student having access to the most effective
teachers and principals. The Department therefore aims to ensure
that students from low-income families, low-achieving students,
minority students, students with disabilities, and students who are
English language learners are placed in classrooms and schools led by
the State’s most effective teachers and principals. No students in New
York should be disproportionately taught by teachers rated Ineffective,
first-year teachers, or teachers who are not highly qualified, nor should
they be disproportionately attending schools led by principals rated
Ineffective” (p. 12).
Equity Plan Overview NEW YORK K-121

STAKEHOLDER ENGAGEMENT
• “The Department will continue to engage with experts and practitioners to develop and improve its work around educational equity and talent management. In October 2014, the Department assembled an STLE Advisory Board, made up of superintendents from LEAs that represent the geographic and demographic diversity of New York State. Strengthening Teacher and Leader Effectiveness Advisory Board members have been asked to collaborate with and present to other stakeholder groups on the development of career ladder pathways; submit concrete tools, resources, and models for inclusion in the Department’s guidance; provide feedback and input on draft materials; and potentially serve as model LEAs for New York State educators” (p. 6).
• “In addition, parties such as the School and District Accountability Think Tank and the New York State Technical Advisory Committee (TAC) have actively contributed to Department work around accountability and the metrics used by the Department” (p. 6).
• “Finally, the Department has engaged thousands of stakeholders around the revised teacher and principal evaluation system. The Learning Summit on Annual Professional Performance Review (APPR) was held in order to consult with, and solicit feedback from a variety of stakeholders including experts in education, economics, and psychometrics and a dedicated email box has received over 4,000 comments and suggestions since early April 2015” (p. 6).
Equity Plan Overview NEW YORK K-122
Equity Gaps
State Definitions of Key Terms: New York defined 12 terms. Seven of those terms (most effective educators, school-level teacher or principal turnover rate, three-year principal turnover rate, retention of educators, English language learners or limited English proficient students, students with disabilities, and students in the lowest performance quintile) are additional definitions beyond those required by statute. All terms were used to inform identification of the State’s equity gaps.
For additional information about New York’s other gaps, please click on the link in the “More Information” section.
• “In 2013–14, students in the quartile of schools with the highest percentage of students in poverty were 4.7 times more likely to be placed with first-year teachers than students in the quartile of schools with the lowest percentage of students in poverty” (p. 39).
Root Causes
Root causes were grouped into “topic areas” for each state; therefore, the phrases in parentheses represent one of three broad areas in which the root causes were grouped.
New York identified several root causes. Some are listed below; please click on the link in the “More Information” section to review all of the State’s root causes.
• Preparation: “The influx of early career educators makes the improvement of teacher preparation program imperative. As novice teachers make up a larger percentage of the teaching force, impacting a higher percentage of students than ever before, it is even more critical that novice teachers are well prepared and competent” (p. 53) (Educator Preparation).
Strategies
Strategies were grouped into “topic areas” for each state; therefore, the phrases in parentheses represent one of three broad areas in which the strategies were grouped.
New York identified several strategies. Some are listed below; please click on the link in the “More Information” section to review all of the State’s strategies.
• “Utilize evaluation results, combining observable teacher and principal practice with the impact on student growth, to design and implement comprehensive systems to address student and talent management needs” (p. 63) (Human Capital Management Systems).
Performance Measures
New York identified several performance measures. Some are listed below; please click on the link in the “More Information” section to review all of the State’s performance measures.
• “# and % teachers in the LEA rated High Effective (H), Effective (E), Developing (D), or Ineffective (I)” (p. 91).
• “% students in the highest quintile prior year scale score assigned to a teacher rated H/E/D/I” (p. 91).
• “# and % of teachers retained with State-provided growth rating of Highly Effective or Effective” (p. 93).
• “# and % of teachers retained with overall composite rating of Highly Effective or Effective” (p. 93).

Equity Plan Overview NEW YORK K-123
Equity Gaps Root Causes Strategies Performance Measures
• “Students in the quartile of schools with the highest percentage of minority students were 4.1 times more likely to be placed with first-year teachers than students in the quartile of schools with the lowest percentage of minority students” (p. 39).
• “In 2013–14, students in the quartile of schools with the highest percentage of students in poverty were 5.5 times more likely to be placed with teachers teaching outside of their certification area than students in the quartile of schools with the lowest percentage of students in poverty” (p. 39).
• “Students in the quartile of schools with the highest percentage of minority students were 4.9 times more likely to be placed with teachers teaching outside of their certification area than students in the quartile of schools with the lowest percentage of minority students” (p. 39).
• Recruitment: “As a result, the teacher labor market is quite local, which is problematic for regions served by preparation programs that historically produce teachers with low qualifications, as the region is likely going to hire teachers with low qualifications” (p. 54) (Educator Preparation).
• Development: “Even with promising practice emerging in professional development across the State there is room for improvement. All professional development should stem from the analysis of student learning and evaluation data and be intentionally designed to meet student and talent management needs” (p. 57) (Human Capital Management Systems).
• Retention: “The Department’s analysis shows a greater rate of principal turnover in schools that serve higher percentages of students from low-income families. Schools in the highest poverty quartile have a principal turnover rate that is more than twice that of schools in the lowest poverty quartile” (p. 57) (Human Capital Management Systems).
• Educator Preparation: “The Department will continue to support and monitor improvements to access and entry into the profession, such as the redesign of teacher and principal preparation programs through performance-based assessments, clinically grounded instruction, and innovative new educator certification pathways” (p. 63) (Educator Preparation).
• Educator Evaluation “. . . the Department will continue to provide support and monitoring to LEAs as they implement teacher and principal evaluation systems that meaningfully differentiate the effectiveness of educators and inform employment decisions” (p. 63) (Human Capital Management Systems).
• The TLE Continuum: “The Department will provide resources and support to LEAs utilizing evaluation results in the design and implementation of robust career ladder pathways as part of their comprehensive and strategic use of the TLE continuum” (p. 63) (Human Capital Management Systems). TLE, the Teacher and Leader Effectiveness Continuum, is the State’s talent management framework.
• “Average first year teacher State-provided growth scores” (p. 93).
• “% core classes taught by HQT” (p. 94).

Equity Plan Overview NEW YORK K-124
PUBLIC REPORTING OF PROGRESS
“ The Department will ensure schools have the information and resources they need to make strategic staffing decisions based on student academic needs and that all students have equitable access to the most effective educators so that all students have the opportunity for a high-quality education they deserve” (p. 100).
More InformationFor more information, download the New York Equity plan.
Source: New York State Education Department. (2015). New York state’s plan to ensure equitable access to the most effective educators (2014–2015). Retrieved from http://www2.ed.gov/programs/titleiparta/equitable/nyequityplan072015.pdf

EQUITY PLAN OVERVIEW
NORTH CAROLINA
ANALYSIS
GAPS
STRATEGIES
MEASURES
ROOTCAUSES
DEFINITIONS
ENGAGEMENT
PUBLIC REPORTING
“North Carolina has a history of establishing high standards for
student academic achievement and for holding all schools accoun-
table for working to ensure that all students are college- and career-
ready” (North Carolina Department of Public Instruction, 2015, p. 3).
“Because of the critical role of teachers in actualizing this
commitment, North Carolina understands the importance of
ensuring that every child has competent, caring, and qualified
teachers. To that end, North Carolina continues to review licensure
policies to eliminate barriers and facilitate the licensing of teachers
from other states and to create accelerated alternate routes to
teaching. The current ESEA laws focus on teachers who meet the
definition of ‘highly qualified,’ and understandably, content
expertise is a critical component of effective teaching. However,
North Carolina acknowledges the significant body of research that
identifies other personal and professional qualities that teachers
must possess to positively impact student achievement. Therefore,
while the North Carolina’s Equity Plan addresses gaps in teacher
qualifications, the plan includes a significant focus on teacher
effectiveness” (p. 3).
“Understanding that excellent educators are essential to student
success, NC is deeply committed to ensuring that every student has
effective teachers and that every school has an effective leader,
regardless of where each student attends school” (p. 3).
Equity Plan Overview NORTH CAROLINA K-125

STAKEHOLDER ENGAGEMENT
• “To begin the development of the new Equity Plan, a team of NCDPI leaders attended the Equity Meeting hosted by the Council of Chief State School Officers (CCSSO) and the Center for Great Teachers and Leaders (GTL), February 3-4, 2015, in San Diego, California. The team identified key internal and external stakeholders to assist with the development of the Equity Plan. On February 20, 2015, the first internal stakeholder meeting was held with cross-agency divisions” (p. 9).
• “On April 13, 2015, NCDPI in collaboration with the Southeast Comprehensive Center, SEDL, held the Equity Plan External Stakeholders’ meeting at the North Carolina School Boards Association in Raleigh, North Carolina. Attendees covered a wide spectrum of stakeholders including representatives” (p. 10).
• “The stakeholders, among other things, reviewed the North Carolina 2011 Equity Plan, reviewed the template of the 2015 Equity Plan and its components, discussed gaps (comparing certain characteristics of educators in schools with high and low concentrations of poor students, hereafter referred to as economically disadvantaged students as is done under the ESEA, as well as schools with high and low concentrations of minority students) using the Educator Equity Profile provided by the USED…along with analyses of gaps based on the Teacher Working Conditions (TWC) Survey results from the 2013- 14 school year looking at two variables, managing student conduct and teacher leadership” (p. 10).
• “Stakeholder engagement will occur each year through established councils and committees (e.g., Superintendent’s Parent Advisory Council, Committee of Practitioners, Educator Equity Plan External Stakeholders, etc.), as well as other ad hoc groups as necessary” (p. 50).
Equity Plan Overview NORTH CAROLINA K-126
Equity Gaps
State Definitions of Key Terms: North Carolina defined 10 terms. Five of those terms (effective teacher, highly effective teacher, novice, highly qualified teacher, and teacher in need of improvement) are additional definitions beyond those required by statute. All terms were used to inform identification of the State’s equity gaps.
For additional information about North Carolina’s other gaps, please click on the link in the “More Information” section.
• “Additionally, students in these high-poverty, high-minority schools have a greater probability of receiving instruction from an inexperienced teacher than the students in schools with lower percentages of EDS [economically disadvantaged students] and minority student populations” (p. 26).
Root Causes
Root causes were grouped into “topic areas” for each state; therefore, the phrases in parentheses represent one of three broad areas in which the root causes were grouped.
North Carolina identified several root causes. Some are listed below; please click on the link in the “More Information” section to review all of the State’s root causes.
• “Inadequately trained and experience teachers and school administrators” (p. 28) (Educator Preparation).
Strategies
Strategies were grouped into “topic areas” for each state; therefore, the phrases in parentheses represent one of three broad areas in which the strategies were grouped.
North Carolina identified several strategies. Some are listed below; please click on the link in the “More Information” section to review all of the State’s strategies.
• “Expansion of Access to Teacher Preparation Programs” (p. 33) (Educator Preparation).
Performance Measures
North Carolina identified several performance measures. Some are listed below; please click on the link in the “More Information” section to review all of the State’s performance measures.
• “One potential measure would be (to monitor) the equity gap in the percentage of highly effective teachers serving low-poverty versus high-poverty schools. Currently the gap stands at 9.61 percentage points (16.69% - 7.08%, Figure 3 of the equity plan). Yearly targets of 1.5 percentage point decreases could be established” (p. 50).

Equity Plan Overview NORTH CAROLINA K-127
Equity Gaps Root Causes Strategies Performance Measures
• “The analyses presented above indicate that students in North Carolina schools with high percentages of economically disadvantaged and minority student populations have less access to highly effective teaching than their peers in schools with lower percentages of EDS and minority student populations” (p. 26).
• “This problem is further exacerbated by trends in teacher mobility. It is clear that schools with higher EDS [economically disadvantaged students] and minority student populations are losing experienced teachers every year to schools with more affluent student populations and those experienced teachers are being replaced by inexperienced teachers. This particular trend needs further analysis to understand if there are differences in teaching effectiveness between those teachers who are remaining in, and departing from, schools with high EDS and minority student population. The North Carolina Department of Public Instruction (NCDPI) currently is developing tools for its districts and charter schools that will allow district leaders to use teacher effectiveness data to develop human capital management strategies that can mitigate the debilitating effects of teacher mobility and attrition” (p. 26).
• “Unrealistic and unreasonable expectations, especially for accountability and testing” (p. 28) (Human Capital Management Systems).
• “Unsupportive school administrators, parents, and the community” (p. 28) (Conditions).
• “Low, inadequate teacher salaries” (p. 28) (Human Capital Management Systems).
• “Inadequate professional development” (p. 29) (Human Capital Management Systems).
• “Teacher and Administrator Preparation Programs” (p. 34) (Educator Preparation).
• “High-Quality Professional Development” (p. 40) (Human Capital Management Systems).
• “Expansion of the Turnaround Teams for Low-Performing Schools” (p. 42) (Human Capital Management Systems).
• “Focus on Teacher Retention” (p. 44) (Human Capital Management Systems).
• “A second potential measure would be (to monitor) the equity gap in the percentage of highly effective teachers serving low-minority versus high-minority schools. Currently the gap stands at 6.39 percentage points (14.24% - 7.85%, Figure 4 of the equity plan). Yearly targets of 1 percentage point decreases could be established” (p. 50).
• “A third potential measure would be the percentage of effective or highly effective teachers leaving high-poverty schools due to teacher mobility (teachers transfer within the State). Analyses are to be concluded in the winter of 2016” (p. 50).
• “A fourth potential measure would be the percentage of effective or highly effective teachers leaving high-minority schools due to teacher mobility (teachers transfer within the State). Analyses to be concluded in the winter of 2016” (p. 50).

Equity Plan Overview NORTH CAROLINA K-128
PUBLIC REPORTING OF PROGRESS
“ Once the NCSBE [North Carolina School Board of Education] approves the inclusion of equity measures into its Strategic Plan, discussions will follow regarding the inclusion of this type of information in the annual School Report Card” (p. 45).
More InformationFor more information, download the North Carolina Equity plan.
Source: North Carolina Department of Public Instruction. (2015). North Carolina’s state plan to ensure equitable access to excellent educators. Retrieved from http://www2.ed.gov/programs/titleiparta/equitable/ncequityplan111215.pdf

EQUITY PLAN OVERVIEW
NORTH DAKOTA
ANALYSIS
GAPS
STRATEGIES
MEASURES
ROOTCAUSES
DEFINITIONS
ENGAGEMENT
PUBLIC REPORTING
“The intent of the North Dakota State Equity Plan is to ensure poor and
minority students are not taught by inexperienced, unqualified, or
out-of-field teachers at higher rates than their counterparts. In order
to have all students reach proficiency, it is imperative every student
has a highly qualified teacher. Teachers have a critical role in actualizing
this commitment; thus, NDDPI is also committed to ensuring every
child has a competent, caring, and effective teacher” (North Dakota
Department of Public Instruction, 2015, p. 3).
STAKEHOLDER ENGAGEMENT
• “The State Equity Initiative Planning Committee convened four times between December 2014 and June 2015” (p. 5).
• “The NDDPI will continuously monitor statewide equity issues and publicly report on the progress. The intent is to continue to convene the State Equity Initiative Planning Committee periodically to provide input and support. These meetings will be publicly reported on the NDDPI website” (p. 29).
Equity Plan Overview NORTH DAKOTA K-129

Equity Plan Overview NORTH DAKOTA K-130
Equity Gaps
State Definitions of Key Terms: North Dakota defined 12 terms. Seven of those terms (Education Standards and Practices Board (ESPB), excellent educators, equity gap, equitable access, Regional Education Association (REA), high poverty school and low poverty school) are additional definitions beyond those required by statute. All terms were used to inform identification of the State’s equity gaps.
North Dakota elected to concentrate on implementing strategies tied to its largest, most significant gaps; therefore, the gaps below represent only those identified gaps that the State will implement strategies to eliminate. For additional information about North Dakota’s other gaps, please click on the link in the “More Information” section.
• “There was a 7.3% difference in high poverty secondary schools compared to low poverty secondary schools being taught by new, inexperienced teachers. There was a 5.51% difference at the elementary school level between high and low poverty schools” (p. 10).
• “Higher levels of new teachers teaching in high poverty schools than in low poverty schools” (p. 12).
• “Teacher recruitment and retention” (p. 12).
• “Teacher shortage areas” (p. 12).
• “Equitable access to high quality professional development (PD)” (p. 12).
Root Causes
Root causes were grouped into “topic areas” for each state; therefore, the phrases in parentheses represent one of three broad areas in which the root causes were grouped.
North Dakota identified several root causes. Some are listed below; please click on the link in the “More Information” section to review all of the State’s root causes.
• “High poverty schools are less desirable” (p. 17) (Conditions).
• “Location issues” (p. 17) (Conditions).
• “Lack of Teacher Support” (p. 18) (Human Capital Management Systems).
• “Low Perception of Teaching Profession” (p. 18) (Conditions).
• “Teachers Leaving Profession” (p. 20) (Human Capital Management Systems).
• “Uncertain of PD Quality to Meet Teacher and Student Needs” (p. 21) (Human Capital Management Systems).
• “High Pressure due to Policy Factors” (p. 21) (Conditions).
Strategies
Strategies were grouped into “topic areas” for each state; therefore, the phrases in parentheses represent one of three broad areas in which the strategies were grouped.
North Dakota identified several strategies. Some are listed below; please click on the link in the “More Information” section to review all of the State’s strategies.
• “Provide incentives to recruit and retain highly qualified teachers” (p. 17) (Human Capital Management Systems).
• “Develop a plan to positively market the teaching profession across the state” (p. 18) (Conditions).
• “Develop education preparation programs for secondary schools” (p. 20) (Educator Preparation).
• “Develop Grow Your Own teacher program” (p. 20) (Human Capital Management Systems).
• “Bring highly qualified professional development to districts” (p. 22) (Human Capital Management Systems).
Implementation Measures
North Dakota identified several implementation measures. Some are listed below; please click on the link in the “More Information” section to review all of the State’s implementation measures.
• Implementation measure for “providing incentives to recruit and retain highly qualified teachers started fall 2015” (p. 17).
• Implementation measure for “developing a plan to positively market the teaching profession across the State started spring 2016” (p. 18).
• Implementation measure for “developing education preparation programs for secondary schools started spring 2016” (p. 20).
• Implementation measure for “developing Grow Your Own teacher program started spring 2016” (p. 20).
• Implementation measure for “bringing highly qualified professional development to districts started 2015 – 2016 school year” (p. 22).

Equity Plan Overview NORTH DAKOTA K-131
PUBLIC REPORTING OF PROGRESS
• NDDPI “will continue use of the state, LEA, and school report card system to monitor and publicly report progress of LEAs toward reaching and maintaining the goal of having all core academic subject teachers highly qualified” (pp. 29–30).
• “Monthly NDDPI Newsletters” (p. 30).
More InformationFor more information, download the North Dakota Equity plan.
Source: North Dakota Department of Public Instruction. (2015). North Dakota state plan to ensure equitable access to excellent educators. Retrieved from http://www2.ed.gov/programs/titleiparta/equitable/ndequityplan82815.pdf

EQUITY PLAN OVERVIEW
OHIO
ANALYSIS
GAPS
STRATEGIES
MEASURES
ROOTCAUSES
DEFINITIONS
ENGAGEMENT
PUBLIC REPORTING
“The Ohio Department of Education brought together a diverse
group of stakeholders to create a context-driven state educator
equity plan for ensuring equitable access to excellent educators for
poor and minority students. These stakeholders identified Ohio’s
educator equity gaps and possible strategies to address them.”
(Ohio Department of Education, 2015, p. 1).
“As a result of Ohio’s 2006 Teacher Equity Plan, Ohio monitored the
percentage of courses taught by highly qualified teachers. In the
2005-2006 school year, Ohio had 94.4 percent of courses being
taught by highly qualified teachers, and in 2013-2014 Ohio
progressed to having 98.7 percent of courses being taught by
highly qualified teachers. With Ohio’s 2015 Plan to Ensure Equitable
Access to Excellent Educators, Ohio will continue its journey to
ensure equitable access to excellent educators” (p. 3).
“Ohio’s 2015 Plan to Ensure Equitable Access to Excellent Educators
(hereafter referred to as Ohio’s Educator Equity Plan) presents the
state’s renewed commitment to provide equitable access to
excellent educators for poor and minority students.” (p. 3).
Equity Plan Overview OHIO K-132

STAKEHOLDER ENGAGEMENT
• “Department staff developed a list of Ohio stakeholder organizations representing the broad and comprehensive perspectives of Ohio educators in each of the four school district typologies: urban, suburban, rural and small town” (p. 5).
• “As a result, Ohio’s Equity Plan Work Group included 28 external stakeholders” (p. 5).
• “The department developed a time frame for in-person, external stakeholder group involvement spanning from January to March. The department set three external meeting dates” (p. 5) (see Appendix B for the stakeholder list).
Equity Plan Overview OHIO K-133
Equity Gaps
State Definitions of Key Terms: Ohio defined 8 terms. Three of those terms (ineffective teacher, ineffective principal, and equity gap) are additional definitions beyond those required by statute. All terms were used to inform identification of the State’s equity plans.
For additional information about Ohio’s other gaps, please click on the link in the “More Information” section.
• “Teacher inexperience is nearly two times more prevalent in high poverty schools than in low poverty schools” (p. 13).
• “Courses in schools with the highest enrollments of students in poverty are roughly 11 times more likely to be taught by either an unqualified teacher or an out-of-field teacher, as compared to those with the lowest enrollment” (p. 13).
Root Causes
Root causes were grouped into “topic areas” for each state; therefore, the phrases in parentheses represent one of three broad areas in which the root causes were grouped.
Ohio identified several root causes. Some are listed below; please click on the link in the “More Information” section to review all of the State’s root causes.
• “Pre-service teacher education students may have limited or no experience with poor or minority students. If educator preparation programs do not provide this experience, graduates may come unprepared to teach in those settings, even though many graduates begin their careers in high-poverty and high-minority schools. These graduates also lack awareness and understanding of educational procedures and practices used in Ohio’s schools. For instance, many novice teachers do not understand the evaluation
Strategies
Strategies were grouped into “topic areas” for each state; therefore, the phrases in parentheses represent one of three broad areas in which the strategies were grouped.
Ohio identified several strategies. Some are listed below; please click on the link in the “More Information” section to review all of the State’s strategies.
• “Conduct research on the link between educator preparation and student performance data; use data to inform preparation program improvement” (p. 25) (Educator Preparation).
• “Require teacher preparation programs to include cultural competency in their curricula that will help new educations be successful with the students, families and communities they serve” (p. 25) (Educator Preparation).
Performance Measures
Ohio identified several performance measures. Some are listed below; please click on the link in the “More Information” section to review all of the State’s performance measures.
• “Ohio has established progress measures for its identified poverty equity gaps.” (p. 37).
• “For each measure, Ohio plans to reduce the gap by half as illustrated below:
− In high-poverty schools, 2.7 percent of teachers received ineffective ratings, whereas 0.2 percent of teachers in low-poverty schools received this rating, a difference of 2.5 percentage points.
− In high-poverty schools, 1.3 percent of principals received ineffective ratings, whereas 0.1 percent of principals in low-poverty schools received this rating, a difference of 1.2 percentage points” (p. 37).

Equity Plan Overview OHIO K-134
Equity Gaps Root Causes Strategies Performance Measures
• “Students in schools with the highest minority enrollments are five times more likely to encounter ineffective educators” (p. 15).
• “Schools in the highest quartile by student poverty are staffed by 13 times the proportion of ineffective teachers and ineffective principals than in those in the lowest quartile” (p. 14).
• “Schools with the highest rate of minority enrollments have nearly twice the rate of inexperienced teachers on their teaching staffs” (p. 15).
system they will engage in, beginning with their first year of teaching. The 2013 Educator Preparation Performance Statewide Report included survey responses from resident educators stating that their program did not prepare them well for understanding value-added growth measures” (pp. 18–19) (Educator Preparation).
• “Educator preparation program structures can vary from institution to institution” (p. 19) (Educator Preparation).
• “Transfer and placement: Deployment of teachers is also a concern when it comes to inequitable access to effective teachers” (p. 19) (Human Capital Management Systems).
• “Data-based decisions: Educators need data to make informed human capital management decisions. Too often, schools are not likely using the data available to make strategic staffing decisions, which impacts equitable access to excellent educators.” (p. 21) (Human Capital Management Systems).
• “Pilot recruitment programs designed to prepare educators for high-needs fields and hard-to-staff schools” (p. 26) (Human Capital Management Systems).
• “Advocate for data systems that report the number of teachers changing schools within districts, changing positions within their districts, moving to other districts or into administration or leaving the profession” (p. 30) (Human Capital Management Systems).
• “Establish a clearinghouse of best practices at the local and regional levels that focuses on ensuring equitable access to excellent educators” (p. 30) (Human Capital Management Systems).
• “Partner with regional centers and organizations to offer trainings on using evaluation data to inform professional learning” (p. 30) (Human Capital Management Systems).
• Ohio has established progress measures for its identified minority equity gaps.” (p. 38)
• “For each measure, Ohio plans to reduce the gap by half as illustrated below:
− In high-minority schools 2.5 percent of teachers received ineffective ratings, whereas 0.5 percent of teachers in low-minority schools received this rating, a difference of 2 percent.
− In high-minority schools, 1.3 percent of principals received ineffective ratings, whereas 0.5 percent of principals in low-minority schools received this rating, a difference of 0.8 percent” (p. 38).
• “Ohio has established progress measures for its identified Educator Workforce Strength Index gaps” (p. 39).
• “For each measure, Ohio plans to reduce the gap by half as illustrated below:
− The Average Workforce Index in Ohio’s high-poverty schools is 92.3; in Ohio’s low-poverty schools it is 98.1, a difference of 5.8 percentage points.

Equity Plan Overview OHIO K-135
Equity Gaps Root Causes Strategies Performance Measures
− The Average Workforce Index in Ohio’s high-minority schools is 92.2; in Ohio’s low-minority schools it is 98, a difference of 5.8 percentage points” (pp. 38–39).
PUBLIC REPORTING OF PROGRESS
• “Ohio understands the importance of monitoring statewide progress toward eliminating identified equity gaps and reporting it to the public. The department will first build public awareness of our baseline equity gaps and the State plan to address these gaps” (p. 40).
• “Secondly, Ohio will update the public on the annual progress toward meeting their five-year progress measures” (p. 40).
• “The department will use the following three methods to publicly report progress: the Ohio Equity website, meetings and conferences, and long-term stakeholder engagement” (p. 40).
More InformationFor more information, download the Ohio Equity plan.
Source: Ohio Department of Education. (2015). Ohio’s 2015 plan to ensure equitable access to excellent educators. Retrieved from http://www2.ed.gov/programs/titleiparta/equitable/ohequityplan060115.pdf

EQUITY PLAN OVERVIEW
OKLAHOMA
ANALYSIS
GAPS
STRATEGIES
MEASURES
ROOTCAUSES
DEFINITIONS
ENGAGEMENT
PUBLIC REPORTING
“The goal of Oklahoma’s Equitable Access to Excellent Educators Plan is
to ensure that all students regardless of race or income have equitable
access to excellent educators. The EAEE Plan includes quantitative
measurements of existing equity gaps, analyses of the root causes of
these gaps, strategies for eliminating these gaps, and specific steps
for ongoing monitoring and support. This plan was prepared with the
input of stakeholders representing multiple backgrounds, interests,
and agencies” (Oklahoma State Department of Education, 2015, p. 1).
STAKEHOLDER ENGAGEMENT
• “These stakeholders played a key role in the following tasks:− Defining key terms
− Identifying equity gaps
− Identifying root causes of equity gaps
− Identifying strategies for eliminating equity gaps” (p. 5).
• “OSDE grouped participants into eight focus groups based on stakeholder type: teachers; parents/students; administrators; school personnel; education organizations; economic development; higher education/teacher preparation; and community agencies” (p. 7).
• “OSDE will also continue the stakeholder engagement process through the implementation phrase. It will continue to use focus groups to access implementation efforts, identify ways to support LEAs during the implementation process and review new data to determine the progress of narrowing equity gaps” (p. 10).
• “The stakeholder groups will continue to stay engaged via the virtual forum. Feedback from this forum will be gathered and shared at TLE [Teacher & Leader Effectiveness] Commission monthly meetings as well as State Board of Education monthly meetings” (p. 29).
Equity Plan Overview OKLAHOMA K-136

Equity Plan Overview OKLAHOMA K-137
Equity Gaps
State Definitions of Key Terms: Oklahoma defined 11 terms. Six of those terms (effective teacher, new teacher, rural, urban, town, suburban) are additional definitions beyond those required by statute. All terms were used to inform identification of the State’s equity gaps.
For additional information about Oklahoma’s other gaps, please click on the link in the “More Information” section.
• “Fewer qualified teachers in high minority and high poverty schools” (p. vii).
• “Fewer experienced teachers in high minority and high poverty schools” (p. vii).
• “Fewer effective teachers in high minority and high poverty schools” (p. vii).
Root Causes
Root causes were grouped into “topic areas” for each state; therefore, the phrases in parentheses represent one of three broad areas in which the root causes were grouped.
Oklahoma identified several root causes. Some are listed below; please click on the link in the “More Information” section to review all of the State’s root causes.
• “Poor school climate and culture in HP and HM schools” (p. 21) (Conditions).
• “Poor working conditions and pay in HP and HM schools” (p. 21) (Conditions).
• “Lack of value for education as a career path” (p .21) (Conditions).
• “Lack of support for teachers and principals in HP and HM schools” (p. 21) (Conditions).
Strategies
Strategies were grouped into “topic areas” for each state; therefore, the phrases in parentheses represent one of three broad areas in which the strategies were grouped.
Oklahoma identified several strategies. Some are listed below; please click on the link in the “More Information” section to review all of the State’s strategies.
• Professional development and mentoring for teachers in high-poverty/high-minority schools (p. 21) (Human Capital Management Systems).
• Professional development for principals in high-poverty/high-minority schools (p.21) (Human Capital Management Systems).
• Improved recruitment and retention practices (p. 21) (Human Capital Management Systems).
• Improved educator preparation and pathways (p. 21) (Educator Preparation).
Implementation Measures
Oklahoma identified several implementation measures. Some are listed below; please click on the link in the “More Information” section to review all of the State’s implementation measures.
• “Equity Gap Literacy for Legislators” (during spring 2015, ongoing) (p. 29).
• “Educator Interviews” (during spring 2015, ongoing) (p. 30).
• “EngageOK Summer Conference” (during summer 2015, ongoing) (p. 30).
• “Quarterly Advisory Committee” (during spring 2015, ongoing) (p. 30).
• “State Superintendent’s Advisory Councils” (during spring 2015, ongoing) (p. 30).
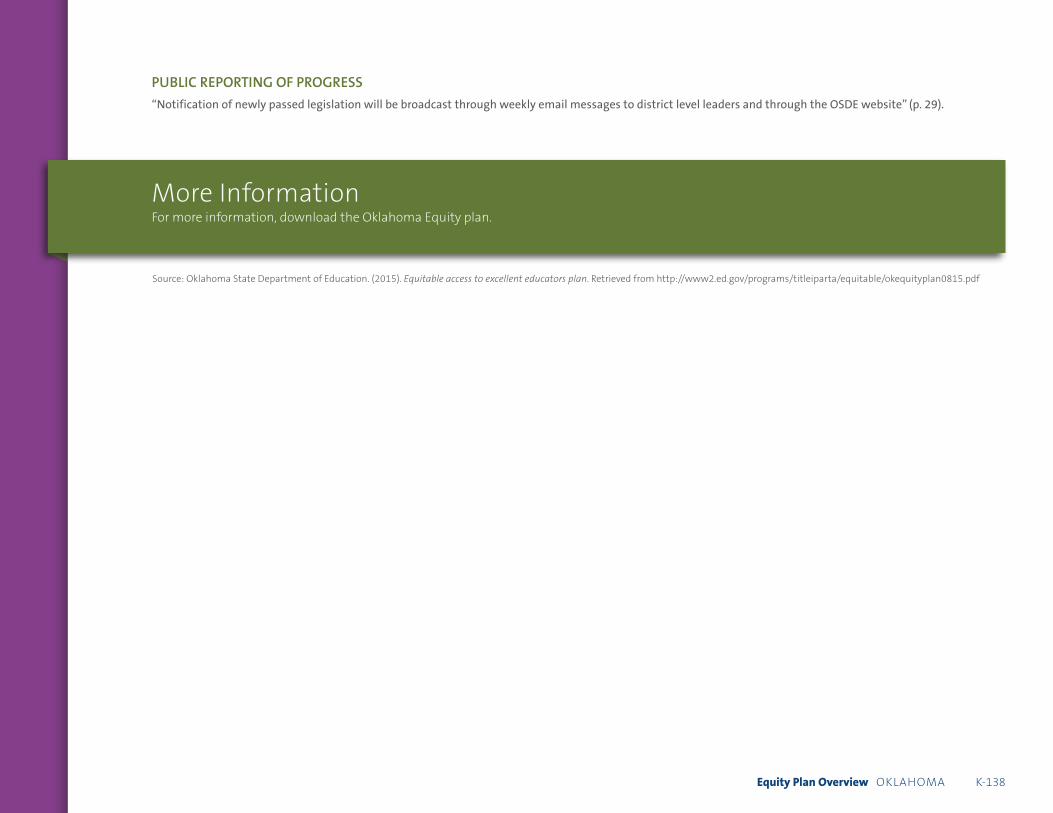
Equity Plan Overview OKLAHOMA K-138
More InformationFor more information, download the Oklahoma Equity plan.
PUBLIC REPORTING OF PROGRESS
“Notification of newly passed legislation will be broadcast through weekly email messages to district level leaders and through the OSDE website” (p. 29).
Source: Oklahoma State Department of Education. (2015). Equitable access to excellent educators plan. Retrieved from http://www2.ed.gov/programs/titleiparta/equitable/okequityplan0815.pdf

EQUITY PLAN OVERVIEW
OREGON
ANALYSIS
GAPS
STRATEGIES
MEASURES
ROOTCAUSES
DEFINITIONS
ENGAGEMENT
PUBLIC REPORTING
“This plan details our approach to achieving our objective of
improving access to excellent educators for our state’s most
marginalized youth. However, Oregon is committed to improving
student outcomes across the state by expanding access to excellent
teaching and leading for all students. As such, the plan is not about
a narrow and impractical redistribution of high-quality educators
from low-need to high-need districts, schools, and classrooms, but
rather a comprehensive approach to strengthening and maintaining
teacher and principal effectiveness across the State, with an
emphasis on our schools and classrooms with the greatest need”
(Oregon Department of Education, 2015, p. 5).
STAKEHOLDER ENGAGEMENT
• “As described below, ODE has involved stakeholders from the beginning and will continue to do so through a statewide outreach of key stakeholder groups that will oversee the long-term implementation of and improvement of this plan” (p. 8).
• “To ensure that we drafted a shared plan of action, ODE presented the work of the equity plan via four conference venues attended by Oregon stakeholder meetings in spring 2015 and solicited public input through a Survey Monkey feedback process” (p. 8).
• “We [ODE] will continue to involve stakeholders in our activities going forward through additional meetings, through ongoing two-way feedback loops, and through the support of a larger statewide education partners (composed of stakeholder groups), which will oversee the long-term commitment to implementing the strategies in this plan” (p. 10).
Equity Plan Overview OREGON K-139

• “The stakeholder groups will be tapped to add substantive knowledge from their particular perspective to engage in ongoing data reviews, root-cause-analyses, and monitoring and modification of strategies” (p. 10).
Equity Plan Overview OREGON K-140
Equity Gaps
State Definitions of Key Terms: Oregon defined 13 terms. Eight of those terms (excellent teacher, excellent school leader, nontraditional teachers, bilingual teachers, teacher and administrator turnover, teacher and administrator turnover by FRPL, provisional/emergency license and diverse educator) are additional definitions beyond those required by statute. All terms were used to inform identification of the State’s equity gaps.
Oregon elected to concentrate on implementing strategies tied to its largest, most significant gaps; therefore, the gaps below represent only those identified gaps that the State will implement strategies to eliminate. For additional information about Oregon’s other gaps, please click on the link in the “More Information” section.
Root Causes
Root causes were grouped into “topic areas” for each state; therefore, the phrases in parentheses represent one of three broad areas in which the root causes were grouped.
• “Lack of Alignment in District Human Capital Policies” (p. 44) (Human Capital Management Systems).
• “Inconsistent Induction and Mentoring Opportunities” (p. 47) (Human Capital Management Systems).
• “The “Belief” Gap impedes the implementation of culturally responsive pedagogy and practice” (p. 47) (Conditions).
• “Lack of Diversity Faculty and Staff in Teacher Preparation Programs” (p. 51) (Educator Preparation).
• “Lack of Necessary Culturally Responsive Pedagogy and Practice Content” (p. 51) (Educator Preparation).
• “Underexposure to High-Need School Settings” (p. 51) (Educator Preparation).
Strategies
Strategies were grouped into “topic areas” for each state; therefore, the phrases in parentheses represent one of three in which the strategies were grouped.
• “Human Capital Management” (p. 43) (Human Capital Management Systems).
• “Ongoing Professional Learning” (p. 47) (Human Capital Management Systems).
• “Monitor Teacher and Principal Preparation” (p. 51) (Human Capital Management Systems).
Performance Measures
Oregon identified several performance measures. Some are listed below; please click on the link in the “More Information” section to review all of the State’s performance measures.
• “By 2018, a new survey of ODE staff on the alignment between policy areas ODE will find at least 75 percent of their staff will agree or strongly agree that policies are aligned across ODE and across state agencies” (p. 45).
• “By 2018, the number of applicants per teaching vacancy (by district/region) will be roughly equivalent in high- and low-need schools” (p. 45).
• “By 2018, at least 75 percent of districts will administer a new survey of school district staff on the alignment policy areas across their central offices, and 75 percent of their staff will agree or strongly agree that there is alignment” (p. 45).
• “By 2018, survey data will find that at least 75 percent of teachers agree or strongly agree that their preparation programs prepared them to be successful in diverse classroom” (p. 52).

Equity Plan Overview OREGON K-141
Equity Gaps Root Causes Strategies Performance Measures
• “Inadequate numbers of bilingual educators. The lack of licensed bilingual educators continues to be a major issue in Oregon as the student demographics rapidly shift. The recruitment and retention efforts focus on this issues as well as a push to revise licensure requirements for native language speakers working in classrooms” (p. 38).
• “Educator Licensure Process/Endorsement Barriers. There is no doubt that educators seeking teacher or administrator licensure must demonstrate competency in a variety of academic measures. However, state research reveals that educators of color consistently struggle to meet the testing requirements to obtain licensing and/or endorsements. The work of removing these barriers is an integral component to the focus on the recruitment and retention to diverse educators. This includes preparation support while enrolled in teacher preparation programs” (p. 38).
• “By 2018, survey data will find that at least 75 percent of mentor teachers agree or strongly agree that their mentees were culturally responsive and well prepared” (p. 52).

Equity Plan Overview OREGON K-142
PUBLIC REPORTING OF PROGRESS
“ Annual public reporting on progress towards addressing root causes and to eliminate equity gaps will include posting a progress report on the ODE website and sending the links to all LEAs and stakeholders . . . More frequent updates to inform the plan, as well as strategic approaches to addressing implementation, will be emerge through our biannual work with education partners across the state” (p. 53).
More InformationFor more information, download the Oregon Equity plan.
Source: Oregon Department of Education. (2015). Oregon’s equitable access to educator plan. Retrieved from http://www2.ed.gov/programs/titleiparta/equitable/orequityplan113015.pdf

EQUITY PLAN OVERVIEW
PENNSYLVANIA
ANALYSIS
GAPS
STRATEGIES
MEASURES
ROOTCAUSES
DEFINITIONS
ENGAGEMENT
PUBLIC REPORTING
“Pennsylvania’s theory of action is built around strategically
improving the management of Pennsylvania’s human capital
in our schools—especially in the poorest and highest minority
schools to enable them to recruit, hire, retain, and support a pool of
highly effective, qualified, fully certified teachers, principals,
and other school staff. Pennsylvania’s activities are organized
around four strategies: human capital management; ongoing
professional learning; teacher and principal preparation; and
fiscal equity…” (Pennsylvania Department of Education, 2015,
page has no number).
“Activities will focus on eliminating the underlying causes that
result in Pennsylvania’s eight equity gaps; a ninth gap dedicated to
incomplete, inadequate or data that cannot be readily accessed”
(page has no number).
STAKEHOLDER ENGAGEMENT
• “Staff developed a work plan devoted to Pennsylvania’s equitable educator stakeholders group; in addition to identifying responsible individuals, the work plan included a timeline of periodic meetings and communications with stakeholders to obtain feedback and recommendations. PDE involved stakeholders beginning with the development of its plan and will continue to involve them throughout the implementation phase after the plan submission” (p. 12).
• “The first stakeholder meeting was a recorded webinar scheduled for Tuesday April 7, 2015 from 1:00 pm to 3:30 pm” (p. 12).
Equity Plan Overview PENNSYLVANIA K-143

• “Additionally, an electronic notice was disseminated to all Pennsylvania LEAs (499 school districts, 173 charter schools, 70 area vocational and career technical centers and 29 intermediate units) informing them about Pennsylvania’s need to develop an equitable access to excellent educators state plan, creation of a resource account dedicated solely to receive feedback from stakeholders related to Pennsylvania’s equitable access to excellent educators state plan and the URL for the recorded April webinar” (p. 13).
• “On April 14, 2015 PDE convened a voluntary, representative group of 12 school personnel administrators to identify equity gaps, root causes, strategies for mitigating equity gaps and metrics for determining state progress. A consultant external to PDE facilitated the day-long working session” (p. 13).
Equity Plan Overview PENNSYLVANIA K-144
Equity Gaps
State Definitions of Key Terms: Pennsylvania defined 14 terms. Nine of those terms (educator(s), excellent educator(s), equity gap, highly effective teacher, highly effective principal/school leader, inexperienced principal, Pennsylvania’s educator effectiveness system, Pennsylvania Value Added Assessment System (PVAAS), and unqualified principal) are additional definitions beyond those required by statute. All terms were used to inform identification of the state’s equity gaps.
For additional information about Pennsylvania’s other gaps, please click on the link in the “More Information” section.
• “Students in Philadelphia School District’s poorest and highest minority schools are being taught by unqualified, not HQTs” (p. 54).
Root Causes
Root causes were grouped into “topic areas” for each state; therefore, the phrases in parentheses represent one of three broad areas in which the root causes were grouped.
Pennsylvania identified several root causes. Some are listed below; please click on the link in the “More Information” section to review all of the State’s root causes.
• “Schools do not cultivate internal talent pools, such as student teachers, substitutes, teachers for leadership positions, and paraprofessionals for vacancies” (p. 54) (Human Capital Management Systems).
• “School safety is a concern” (p. 55) (Conditions).
• “Lack of effective screening tools” (p. 55) (Human Capital Management Systems).
Strategies
Strategies were grouped into “topic areas” for each state; therefore, the phrases in parentheses represent one of three broad areas in which the strategies were grouped.
Pennsylvania identified several strategies. Some are listed below; please click on the link in the “More Information” section to review all of the State’s strategies.
• “Human Capital Management” (p. 65) (Human Capital Management Systems).
• “Professional Learning/Development” (p. 65) (Human Capital Management Systems).
• “Teacher and Principal Preparation” (p. 66) (Educator Preparation).
• “Fiscal Equity” (p. 66) (Human Capital Management Systems).
Performance Measures
Pennsylvania identified several performance measures. Some are listed below; please click on the link in the “More Information” section to review all of the State’s performance measures.
• “By the end of the 2016–17 school year, Pennsylvania’s HQT percentage will reach 99 percent” (p. 71).
• “By the end of the 2016–17 school year, the number of type of 01 emergency permits issued to Pennsylvania’s poorest and highest minority schools will decrease by five percent” (p. 71).
• “By the end of the 2016–17 school year, the gap between per student spending in Pennsylvania’s poorest and highest minority schools will shrink by at least 1.5%” (p. 76).

Equity Plan Overview PENNSYLVANIA K-145
Equity Gaps Root Causes Strategies Performance Measures
• “Students in Pennsylvania’s poorest and highest minority charter schools are being taught by unqualified, not HQTs” (p. 55).
• “Not all schools in Pennsylvania have qualified principals: a total of 21 principals in 2013–14 served on 01 emergency permits” (p. 58).
• “School nurses (a total of 4,901 emergency permits) and guidance counselors (a total of 1,901 emergency permits) are being hired on a type 01 emergency permit; these individuals are unqualified since they do not hold valid, appropriate Pennsylvania certificates” (p. 59).
• “Some teacher preparation programs fail to graduate high quality and well-prepared new teachers for today’s classrooms, including the poorest and highest minority schools” (p. 61).
• “Schools utilize outdated recruitment practices” (p. 55) (Human Capital Management Systems).
• “Lack of amenities and public transportation in the schools’ community contribute to hiring/retention challenges in Pennsylvania’s poorest and highest minority schools” (p. 58) (Human Capital Management Systems).
• “Inadequate financial resources limit classroom instructional materials, affects the number of teachers and other staff who can be hired, and limits the financial resources that are available for per pupil spending” (p. 61) (Human Capital Management Systems).
• “Lack of ongoing relationships/partnerships with preparation institutions and programs” (p. 61) (Human Capital Management Systems).
• “By the end of the 2016–17 school year, all focus and priority schools will be able to document their schools budgets are fiscally equitable for ELL, special education, poor, and minority students” (p. 76).
• “By the end of the 2016–17 school year, information related to school climate and learning environment will be available for the first time” (p. 79).

Equity Plan Overview PENNSYLVANIA K-146
PUBLIC REPORTING OF PROGRESS
“Pennsylvania will utilize the following channels of distribution to publicly report state progress at least annually in mitigating equity gaps between the state’s poorest and highest minority schools:
• A new web page dedicated to Pennsylvania’s Equitable Access to Excellent Educators state plan will be created as soon as the plan is approved by the United States Department of Education;
• Information will be shared via social media, including PDE’s Twitter and Facebook accounts;
• PDE’s press and communications office will publish press releases for distribution of progress data to Philadelphia, Pittsburgh, York, Harrisburg, Allentown, Reading, Scranton, Erie, Johnstown and rural areas of the state;
• An executive summary prepared and distributed to each stakeholder member, who will be asked to post the summary on their web page, included synopses in newsletters and/or journals to inform the local school community and parents; Pennsylvania’s approved preparation programs will also receive a copy of the executive summary;
• The executive directors of appropriate Pennsylvania education organizations and associations will also receive an executive summary along with a request that the summary be distributed to its membership;
• As new public venues become available, they will be investigated for their appropriateness to post information related to Pennsylvania’s progress in mitigating its equity gaps and root causes; and
• Pennsylvania’s equity resource account will be retained and publicized for the public to provide feedback” (p. 81).
More InformationFor more information, download the Pennsylvania Equity plan.
Source: Pennsylvania Department of Education. (2015). Pennsylvania’s state plan for ensuring equitable access to excellent educators for all students. Retrieved from http://www2.ed.gov/programs/titleiparta/equitable/paequityplan081915.pdf

EQUITY PLAN OVERVIEW
PUERTO RICO
ANALYSIS
GAPS
STRATEGIES
MEASURES
ROOTCAUSES
DEFINITIONS
ENGAGEMENT
PUBLIC REPORTING
“In conclusion, PRDE is fully committed to promote and ensure
access to effective HQT, experienced and in field teachers for all
students in our public system. We will continue offering schools
ongoing academic support through school districts. We will use
our databases for decision making, and will maintain active
communication with the institutions of high education to
strengthen the development of qualified teachers.” (Puerto Rico
Department of Education, 2015, p. 38).
STAKEHOLDER ENGAGEMENT
• “In addition to the face to face interactions, PRDE and FLICC developed a stakeholder survey (See Appendix D) to collect information from stakeholders regarding their perceptions and opinions of what constitutes an excellent teacher; strategies and activities needed to guarantee an equitable access to excellent teachers for all students and suggestions on how to keep all stakeholders and the public informed on the progress of the Equity Plan” (p. 13).
• “Diverse mechanisms will be used to receive and integrate stakeholder recommendations and input. This feedback will be collected through face-to-face meetings, focus groups, PRDE’s website, and questionnaires regarding the Equity Plan. Ongoing communication will be maintained through PRDE’s internet portal which will include a space for a copy the Equity Plan to be uploaded and viewed by the public” (p. 14).
• “Internal and external stakeholders will be kept informed and will provide PRDE with the feedback on the status of the strategies used to minimize the identified equity gaps” (p. 34).
• “Equity meetings during the year with the PRDE Internal Equity Plan Team and the Committee of Stakeholders to discuss partial progress of the plan, challenges and strengths and to revise and amend content if necessary” (p. 35).
Equity Plan Overview PUERTO RICO K-147

Equity Plan Overview PUERTO RICO K-148
Equity Gaps
State Definitions of Key Terms: Puerto Rico defined 15 terms. Nine of those terms (highly qualified teachers [HQT], non-highly qualified teacher [NHQT], regular certification, new teacher, special recruitment, low performing schools, high-poverty quartile, low-poverty quartile, priority school and focus schools) are additional definitions beyond those required by statute. All terms were used to inform identification of the State’s equity gaps.
For additional information about Puerto Rico’s other gaps, please click on the link in the “More Information” section.
• “The percentages differences obtained from this comparison reflect a 9.48%, clearly showing that there is a gap between Non-minority and Minority students taught by an unqualified teacher” (p. 21).
• “The percentages differences obtained from this comparison reflect a difference of 9.39 percent, clearly showing that there is a gap between Non-minority and Minority students taught by an inexperienced teacher” (p. 22).
Root Causes
Root causes were grouped into “topic areas” for each state; therefore, the phrases in parentheses represent one of three broad areas in which the root causes were grouped.
Puerto Rico identified several root causes. Some are listed below; please click on the link in the “More Information” section to review all of the State’s root causes.
• “Increased turnover of new teachers with transitory positions” (p. 29) (Human Capital Management Systems).
• “Due to the economic situation of the island experienced teachers are moving to the US for better salaries and working conditions” (p. 29) (Human Capital Management Systems).
• “Eligible teacher lists in difficult to recruit subjects deplete rapidly” (p. 29) (Human Capital Management Systems).
• “Lack of interest in subjects of greatest necessity” (p. 29) (Human Capital Management Systems).
Strategies
Strategies were grouped into “topic areas” for each state; therefore, the phrases in parentheses represent one of three in which the strategies were grouped.
• “Human Capital Management” (p. 27) (Human Capital Management Systems).
• “Teacher Preparation and Workforce” (p. 29) (Educator Preparation).
• “Commitment of PRDE Personnel to Equitable Access for All Students Initiative” (p. 30) (Human Capital Management Systems).
Performance Measures
Puerto Rico identified several performance measures. Some are listed below; please click on the link in the “More Information” section to review all of the State’s performance measures.
• “By 2020, PRDE’s changes in public policies will result in a 3% reduction in the recruitment of unqualified and out of field teachers in high poverty schools. This reduction will support these schools to achieve their objectives and gain a 40 percent or more in the students’ outcomes based on the student report card” (p. 28).
• “By 2017, 50% of inexperienced teachers will be assigned to a certified mentor. The 80 percent of the inexperienced teachers that has a mentor will improve their academics strategies based in student achievement growth and retention” (p. 28).
• “By 2016, 100% of PD providers will be using the new PD catalogues that include topics on specific needs of the beginning teacher. The inexperienced teacher will receive a continuous job embedded support based on the PD to increase the repertory of academic strategies to attend to the students’ needs and improve in more than a 10 % their academic growth performance based in project and problem-based learning, among others” (p. 28).
• “By 2017, PRDE will have the results of the teacher questionnaires on the quality of PD options and online PD from at least 75 of the teachers. Our metric is that the 90 percent or more of the professional development attended the teacher’s needs” (p. 28).

Equity Plan Overview PUERTO RICO K-149
PUBLIC REPORTING OF PROGRESS
• Once the Plan has been approved, PRDE will immediately inform the public school system the content, short and long term objectives and the responsibilities of each school sector in the effective implementation of this Plan” (p. 34).
• “Some of the strategies that will be used in the dissemination of the plan, its progress evaluation, and the continuous feedback to and from the different stakeholders will include: (1) A site to the Equitable Access to Excellent Educators in PRDE’s web page for issues only related to this plan; (2) periodical publication published electronically on a monthly basis; (3) official communications; (4) e-mail; and (5) equity meetings” (p. 35).
• “The executive summary will be prepared and distributed to each stakeholder member, Educator Preparation Programs, and Education organizations and associations with a request that summaries be distributed to its members. It will also be posted on PRDE’s website and informed by an official communication” (p. 35).
More InformationFor more information, download the Puerto Rico Equity plan.
Source: Puerto Rico Department of Education. (2015). Equitable access to excellent educators plan 2015–2016. Retrieved from http://www2.ed.gov/programs/titleiparta/equitable/prequityplan122015.pdf

EQUITY PLAN OVERVIEW
RHODE ISLAND
ANALYSIS
GAPS
STRATEGIES
MEASURES
ROOTCAUSES
DEFINITIONS
ENGAGEMENT
PUBLIC REPORTING
“Our plan centers on and is guided by our state’s theory of action.
When Rhode Island successfully implements a coherent and
comprehen sive approach to managing educator talent, then LEAs
will be better able to recruit, retain, and develop excellent educators
and therefore provide students with equitable access to excellent
teachers and leaders. This approach must address all aspects of
talent management: preparation, certification, recruitment and
hiring, mentoring and induction, professional learning, educator
evaluation, educator environment, and compensation” (Rhode
Island Department of Education, 2015, p. 7).
STAKEHOLDER ENGAGEMENT
• “Therefore, during the plan development process, RIDE engaged multiple stakeholder groups in identification of equity gaps, brainstorming of root causes, and development of strategies. RIDE will continue to partner with stakeholders to implement the work and will seek their feedback on progress to date” (p. 8).
• “RIDE will continue to involve stakeholders in the refinement and implementation of the state’s equity plan through additional meetings and ongoing two-way feedback loops. Stakeholders will receive regular updates on the progress of equity plan, engage in ongoing data and root cause analysis, and provide input on how to refine the plan” (p. 12).
Equity Plan Overview RHODE ISLAND K-150

Equity Plan Overview RHODE ISLAND K-151
Equity Gaps
State Definitions of Key Terms: Rhode Island defined 16 terms. Eleven of those terms (experienced teacher or support professional working in a new context, less-than-effective teacher/support professional, chronically absent teacher/support professional, inexperienced leader, experienced leader working in a new context, chronically absent leader, novice leader, less-than-effective leader, novice teacher/support professional, excellent teacher or support professional, and excellent leader) are additional definitions beyond those required by statute. All terms were used to inform identification of the State’s equity gaps.
For additional information about Rhode Island’s other gaps, please click on the link in the “More Information” section.
• “Greater percentages of inexperienced teachers and support professionals work in HP and HM schools” (p. 32).
• “A greater percentage of middle school teachers and support professionals are inexperienced” (p. 32).
• “Greater percentages of inexperienced leaders work in HP and HM schools” (p. 32).
Root Causes
Root causes were grouped into “topic areas” for each state; therefore, the phrases in parentheses represent one of three broad areas in which the root causes were grouped.
• “Lack of Specific Preparation to Work in High Poverty and High Minority Schools” (p. 33) (Educator Preparation).
• “Confusing/Hard to Meet Certification Requirements” (p. 37) (Human Capital Management Systems).
• “Insufficient Professional Learning, Induction, and Coaching” (p. 39) (Human Capital Management Systems).
• “Lack of a Diverse Cohort of Educators and Candidates” (p. 39) (Human Capital Management Systems).
• “Ineffective Recruitment, Hiring, and Staff Management Practices” (p. 45) (Human Capital Management Systems).
• “Unfavorable Perceptions of High Poverty and High Minority Schools” (p. 48) (Conditions).
• “Limited Career Paths and Leadership Opportunities” (p. 48) (Human Capital Management Systems).
Strategies
Strategies were grouped into “topic areas” for each state; therefore, the phrases in parentheses represent the “topic area/s” in which the strategies were grouped.
Rhode Island identified several strategies. Some are listed below; please click on the link in the “More Information” section to review all of the State’s strategies.
• “Continue to coordinate opportunities for LEAs and programs to meet and build partnerships” (p. 35) (Conditions).
• “Increase understanding of new pathways and certificates” (p. 37) (Human Capital Management Systems).
• “Serve as a thought partner to preparation providers and LEAs as they work to increase the diversity of the educator workforce” (p. 39) (Educator Preparation).
• “Identify ways to improve LEA implementation of educator evaluation” (p. 41) (Human Capital Management Systems).
Performance Measures
Rhode Island identified several performance measures. Some are listed below; please click on the link in the “More Information” section to review all of the State’s performance measures.
• “By June 2017, fewer teachers in highest poverty and highest minority LEAs will hold emergency certificates” (p. 42).
• “By June 2018, 75 percent of beginning teachers in highest poverty and highest minority schools will be supported by an induction model” (p. 43).
• “By December 2017, one LEA partner will implement one or more changes to recruitment, hiring, staff management, and compensation policies and practices” (p. 46).
• “By December 2016, RIDE and two LEA partners will develop and begin implementing a targeted support plan” (p. 46).
• “By June 2017, at least two LEAs with high poverty and high minority schools will complete a self-assessment of teaching and learning conditions” (p. 51).

Equity Gaps Root Causes Strategies Performance Measures
• “A greater percentage of middle school leaders are inexperienced compared to leaders at other schools” (p. 32).
• “Greater percentages of unqualified educators work in HP and HM schools” (p. 32).
• “Greater percentages of middle school and high school educators are unqualified” (p. 32).
• “Greater percentages of educators work out of field in high HP and HM schools” (p. 32).
• “Lack of Competitive Compensation” (p. 49) (Human Capital Management Systems).
• “Poor teaching and learning conditions and insufficient resources” (p. 50) (Conditions).
• “Continue providing job-embedded coaching related to educator evaluation through the principal partnership.” (p. 41) (Human Capital Management Systems).
• “Help union and LEA leaders, including human resource directors, self-assess recruitment, hiring, staff management, and compensation policies and practices” (p. 46) (Human Capital Management Systems).
PUBLIC REPORTING OF PROGRESS
• “RIDE will publish an annual report each October on the equity gaps identified in this plan as well as additional equity gaps identified in the future in the equitable distribution of teachers in the state and public is on the website” (p. 52).
• “RIDE will maintain a web page and blog focused on highlighting state implementation of equity plan strategies and reporting progress toward performance objectives” (p. 52).
More InformationFor more information, download the Rhode Island Equity plan.
Source: Rhode Island Department of Education. (2015). Ensuring equitable access to excellent educators. Retrieved from http://www2.ed.gov/programs/titleiparta/equitable/riequityplan072015.pdf
Equity Plan Overview RHODE ISLAND K-152

EQUITY PLAN OVERVIEW
SOUTH CAROLINA
ANALYSIS
GAPS
STRATEGIES
MEASURES
ROOTCAUSES
DEFINITIONS
ENGAGEMENT
PUBLIC REPORTING
“This plan details our approach to achieving our objective of
improving access to excellent educators for our state’s most
disadvantaged youth. However, South Carolina is committed to
improving student outcomes across the State by expanding access
to excellent teaching and leading for all students. As such, the plan
is not about a narrow and impractical redistribution of high-quality
educators from low-need to high-need districts, schools, and
classrooms, but rather a comprehensive approach to strengthening
and maintaining teacher and principal effectiveness across the
State, with an emphasis on our schools and classrooms with the
greatest need” (South Carolina Department of Education, 2015, p. 3).
STAKEHOLDER ENGAGEMENT
• “To begin this process in an informed way, the SCDE held an initial, state-wide stakeholder meeting with the SC Transformation Team, made up of representatives from key stakeholder groups that will oversee the long-term implementation of and improvement of this plan. To ensure that the SCDE produced a truly shared plan of action, the SCDE held an initial stakeholder meeting with the SC Transformation Team, then one stakeholder meeting in each of the three regions throughout the State (Upstate, Pee Dee, Midlands, and Low Country)” (p. 4).
• “In all meetings, stakeholders examined quantitative data, identified root causes, and brainstormed strategies” (p. 5).
• “The SC Transformation Team will continue to be consulted on plan direction, particularly approval of strategies, setting targets, and setting benchmark goals over the next five years” (p. 4).
Equity Plan Overview SOUTH CAROLINA K-153

Equity Plan Overview SOUTH CAROLINA K-154
Equity Gaps
State Definitions of Key Terms: South Carolina defined the 5 required terms. All terms were used to inform identification of the State’s equity gaps.
South Carolina elected to concentrate on implementing strategies tied to its largest, most significant gaps; therefore, the gaps below represent only those identified gaps that the State will implement strategies to eliminate. For additional information about South Carolina’s other gaps, please click on the link in the “More Information” section.
• “Inexperienced Teachers: The data indicate a gap in the ability to attract new or less experienced teachers to high poverty and/or high-minority schools” (p. 13).
• “Unqualified Teachers: The data show a significant gap related to unqualified teachers in high poverty and/or high minority schools” (p. 13).
• “Out-of-Field Teachers: While the percentage of teachers may be low, much like the unqualified teachers percentage, it likely translates into a significant number of actual classes taught by teachers who are out-of-field, particularly for high poverty and/or high minority students. In this way, the data show a significant gap related to out-of-field teachers in high poverty and/or high-minority schools” (p. 13).
Root Causes
Root causes were grouped into “topic areas” for each state; therefore, the phrases in parentheses represent one of three broad areas in which the root causes were grouped.
• “High poverty, high needs schools are challenging, and teachers in these schools need support, especially in the early years of their careers” (p. 31) (Human Capital Management Systems).
• “Pre-service teachers lack meaningful exposure to high minority, high poverty learning environments in rural districts” (p. 31) (Educator Preparation).
• “The field of education is not attractive” (p. 31) (Conditions).
• “There are few connections between institutions of higher education and the local school districts” (p. 31) (Human Capital Management Systems).
• “Teacher salaries need to be competitive in order to attract new talent into the field” (p. 31) (Human Capital Management Systems).
• “There is no training for school administrators on shared leadership to assist them in empowering their teacher leaders” (p. 31) (Human Capital Management Systems).
Strategies
Strategies were grouped into “topic areas” for each state; therefore, the phrases in parentheses represent one of three broad areas in which the strategies were grouped.
• “The SCDE will support and help build out the pipeline that leads new, less experienced teachers into the high poverty, high minority—mostly rural—teaching positions” (p. 34) (Human Capital Management Systems).
• “The SCDE will promote distributed leadership and learning opportunities to provide instructional support and improved school climate” (p. 35) (Human Capital Management Systems).
• “The SCDE will advocate for greater salary equity in South Carolina” (p. 36) (Human Capital Management Systems).
Performance Measures
South Carolina identified several performance measures. Some are listed below; please click on the link in the “More Information” section to review all of the State’s performance measures.
• “By the end of the 2019–20 school term, 90% of IHEs located closest to South Carolina’s high minority, high poverty rural school districts will report increased collaboration with identified local school districts due to SCDE and other efforts. Evidence = Collaboration survey results from 2016–17, 2017–18, 2018–19, and 2019–20. Baseline to be established in 2015–16” (p. 35).
• “By the end of the 2019-20 school term, 90% of identified districts will report increased collaboration with local IHEs due to SCDE and other efforts. Evidence = Collaboration survey results from 2016–17, 2017–18, 2018–19, and 2019–20. Baseline to be established in 2015–16” (p. 35).
• “By Fall 2017, 90% of identified schools will participate in the school/culture and distributed leadership assessments and associate professional development offered through the Office of School Transformation. Evidence = List of participating and non-participating school principals in distributed leadership assessment and professional development for 2015–16, 2016–17, 2017–18, 2018–19, and 2019–20” (p. 36).

Equity Gaps Root Causes Strategies Performance Measures
• “Teacher Turnover: Data from the SCDE indicate that schools with high concentrations of minority students and students from low-income families have higher teacher turnover than schools with low concentrations of those students” (p. 13).
• “Teacher Salaries: Stakeholders said the approximate $3,000 difference in salary becomes a contributor, especially when the district does not have other perks to offer and when a new teacher must pay more in travel expenses to come to a rural district. Several district representatives were clear that a lower salary has caused them to lose effective educators to neighboring, higher paying districts” (p. 13).
• “By Fall 2016, the SCDE will complete a report related to increasing the starting salary for South Carolina’s novice teachers. Evidence = SCDE report” (p. 37).
• “By Fall 2018, South Carolina will publish defined strategies for ensuring equity in teachers’ salaries among high poverty, high minority and low poverty, low minority schools and districts. Evidence = SCDE publications outlining recommendations” (p. 37).
PUBLIC REPORTING OF PROGRESS
“ Beginning in 2016-17, the Office of School Transformation, on collaboration across appropriate offices within the SEA and the Internal Equity Team, will evaluate implementation of strategies and progress toward eliminating identified equity gaps for both poor students and minority students annually. This evaluation will be published in an annual progress report” (p. 33).
More InformationFor more information, download the South Carolina Equity plan.
Source: South Carolina Department of Education. (2015ber). South Carolina state plan for equitable access to excellent educators. Retrieved from http://www2.ed.gov/programs/titleiparta/equitable/scequityplan09012015.pdf
Equity Plan Overview SOUTH CAROLINA K-155

EQUITY PLAN OVERVIEW
SOUTH DAKOTA
ANALYSIS
GAPS
STRATEGIES
MEASURES
ROOTCAUSES
DEFINITIONS
ENGAGEMENT
PUBLIC REPORTING
“This Equity Plan comes at a time where the state narrative is one of
a teacher shortage, in which the projected pipeline barely meets
the needs of the state, and in which specific geographical and
content areas of the state seem to be at a greater disadvantage.
Since Equity Plans were first required of states, South Dakota has
made tremendous progress in closing the state equity gaps. Where
gaps still exist, they tend to be centered around rural, remote, high
poverty schools in the state that have a large Native American
population and that are located on or near Indian Reservations.
These are areas of the state in which the state education agency (SEA)
is providing as much targeted support of teachers as is practically
possible” (South Dakota Department of Education, 2015, p. 45).
STAKEHOLDER ENGAGEMENT
• “Stakeholder groups, in particular the Commission on Teaching and Learning (CTL) and the Professional Learning Community for Teachers (PLC) were directly involved in the creation of Stage 1 of the South Dakota Equity Plan via data walks and root cause analysis, both of which were used to inform the theory of action” (p. 2).
• “The South Dakota DOE will continue to engage the PLC and CTL as the equity plan is implemented” (p. 3).
Equity Plan Overview SOUTH DAKOTA K-156

Equity Plan Overview SOUTH DAKOTA K-157
Equity Gaps
State Definitions of Key Terms: South Dakota defined 13 terms. Eight of those terms (poor school, highly qualified teacher, high minority school, gap group student, high gap school, inexperienced administrators, unqualified administrators and highly qualified administrators) are additional definitions beyond those required by statute. Terms were used to inform identification of the State’s equity gaps.
For additional information about South Dakota’s other gaps, please click on the link in the “More Information” section.
• “An analysis of the data confirms that there remain significant gaps for students in the state’s defined Gap group student, particularly American Indian, Special Education, and English Language Learner students. In both English Language Arts and Mathematics, across all grades, Gap group student proficiency rates were approximately 30% lower than those of their Non-Gap Group counterparts” (p. 23).
• “Data indicate that attendance and graduation rates are also concerns for these areas in the state South Dakota has set a statewide attendance goal of 94% for every student. While nearly 80% of all students across the state, and over 89% of Non-Gap group students met this bar, only 54.31% of the state’s American Indian. Students reached the goal. This indicates a significant proportion of students in this category are missing out on critical learning time, and have significant gaps in the amount of instruction they are receiving” (p. 24).
Root Causes
Root causes were grouped into “topic areas” for each state; therefore, the phrases in parentheses represent one of three broad areas in which the root causes were grouped.
• “The supply of new teachers” (p. 27) (Human Capital Management Systems).
• “Remote, rural locations” (p. 27) (Human Capital Management Systems).
• “Poverty” (p. 28) (Conditions).
• “Cultural differences” (p. 28) (Educator Preparation).
• “Teaching multiple subjects” (p. 29) (Human Capital Management Systems).
Strategies
Strategies were grouped into “topic areas” for each state; therefore, the phrases in parentheses represent one of three in which the strategies were grouped.
• “Expanded analysis and access to data surrounding inequities” (p. 30) (Human Capital Management Systems).
• “Engagement of Key Stakeholders” (p. 34) (Conditions).
• “Leverage of high quality supports and professional development opportunities” (p. 35) (Human Capital Management Systems).
• “Focusing the Narrative on Educational Excellence” (p. 41) (Human Capital Management Systems).
Implementation Measures
South Dakota identified several implementation measures. Some are listed below; please click on the link in the “More Information” section to review all of the State’s implementation measures.
• “New JAG programs will receive year one supports, and existing programs will begin working with returning students most in need of support. This work will continue through the entirety of the 2015–16 year and is overseen by the Secretary of Education” (fall 2015) (p. 55).
• “SD DOE’s Office of Learning and Instruction will oversee the delivery of the annual stoplight survey to help the department identify the most critical needs for teacher and administrator support in the upcoming year” (fall 2015) (p. 55).
• “The CTL will finish the work to design a new certification system and the SEA will solicit public input on the proposal” (winter 2015–16) (p. 55).

Equity Gaps Root Causes Strategies Implementation Measures
• “Perhaps because of this gap in learning occurring at the Elementary and Middle school levels, the American Indian subgroup saw the lowest four-year cohort graduation rate for any group in the State” (p. 24).
• “The results of the stoplight survey will be aggregated and shared with LEAs. Trainings will occur to assist LEAs in planning support for their teacher” (winter 2015–16) (p. 55).
PUBLIC REPORTING OF PROGRESS
• “SD DOE’s Division of Assessment and Accountability will release a final/revised delivery plan to address. The SEAs goals of ensuring that:
−− Students have access to high quality standards and instruction.
−− Students are supported by effective teachers and leaders.
−− Students enter schools that provide an environment conducive to learning” (p. 45).
• “This will include an expanded equity plan and data report that will become an annual data report. Data tables from the report will be generated at the school, district, and state levels and will be shared with LEAs. Aggregated data will be made publicly available. The SEA will share this information with the key stakeholder groups identified in this plan as regular stakeholder meetings take place on either a quarterly, semi-annual, or annual basis depending on the structure and schedule of the group” (p. 45).
• “Updates and progress tracking will happen at the SEA level quarterly and will be used to track trajectories towards success. Quarterly stock-takes will be given to senior SEA management to ensure that the state is on track to meet these goals. Data analysis, reporting and monitoring will be the responsibility of SD DOE’s Division of Assessment and Accountability” (p. 45).
More InformationFor more information, download the South Dakota Equity plan.
Source: South Dakota Department of Education. (2015). South Dakota educator equity plan 2015. Retrieved from http://www2.ed.gov/programs/titleiparta/equitable/sdequityplan122015.pdf
Equity Plan Overview SOUTH DAKOTA K-158

EQUITY PLAN OVERVIEW
TENNESSEE
ANALYSIS
GAPS
STRATEGIES
MEASURES
ROOTCAUSES
DEFINITIONS
ENGAGEMENT
PUBLIC REPORTING
“Our theory of action for addressing issues of inequity centers on the
following principles and key beliefs:
• Research shows that teachers have a greater impact on student
achievement than any other in school factor. Yet some students,
in many instances the students who need good teaching the most,
systematically do not have the same access to effective teaching.
• We believe this gap develops as a result of two key issues: 1) an
inadequate supply of effective teachers, and 2) the within- or between-
school factors limiting access to effective teachers for particular groups
of students. We carefully examine data metrics for each of these issues.
• There are a number of factors that impact a district’s supply of effective
teachers and students’ access to those teachers. To address these
issues the State needs to continue working with districts to improve
human capital management—preparation, recruitment, hiring, staffing,
evaluation, development, retention, and compensation. Much of this
work has been underway in Tennessee over the last several years.
• Districts vary considerably in the set of human capital issues they face,
and improving access to meaningful data will lead to improved district-
level decisionmaking in this area.
• Our strategy for engagement includes several phases: initial support for
districts across the full spectrum of human capital decisions, providing
data to districts to facilitate targeted analyses and initiatives, and,
finally, public transparency and accountability for equity and results”
(Tennessee Department of Education, 2015, p. 2).
Equity Plan Overview TENNESSEE K-159

STAKEHOLDER ENGAGEMENT
• “The Tennessee Department of Education recognizes the need for early and frequent input from stakeholders in three key ways:
− Development of the equity plan,
− Root cause analysis at the state, district, and school level, and
− Implementation and monitoring of state and local strategies to address equity gaps” (p. 21).
• “In early 2015, under the leadership of Commissioner Candice McQueen, an engagement plan was developed to gather feedback on the draft equity plan from teachers, district leadership, and external policy and community organizations” (p. 21).
• “External stakeholder engagement will be a critical focus in 2015. We already address issues of human capital with a variety of stakeholder groups, and the engagement around this plan will capitalize on these existing stakeholder meetings. We will continue to communicate with several key audiences regarding this plan, including: directors of schools, supervisors and principals, teachers and teacher advocacy groups, and other external education organizations” (p. 4).
Equity Plan Overview TENNESSEE K-160
Equity Gaps Root Causes Strategies Implementation Measures
State Definitions of Key Terms: Tennessee defined 10 terms. Five of those terms (between school gap, equity gap, highly qualified, Tennessee Value Added Assessment System [TVAAS], and within-school gap) are additional definitions beyond those required by statute. All terms were used to inform identification of the State’s equity gaps.
Tennessee elected to concentrate on implementing strategies tied to its largest, most significant gaps; therefore, the gaps below represent only those identified gaps that the State will implement strategies to eliminate. For additional information about Tennessee’s other gaps, please click on the link in the “More Information” section.
Root causes were grouped into “topic areas” for each state; therefore,
the phrases in parentheses represent one of three broad areas in which root causes were grouped.
Tennessee identified several root causes. Some are listed below; please click on the link in the “More Information” section to review all of the State’s root causes.
• “Inadequate professional learning” (p. 25) (Human Capital Management Systems).
• “Lack of quality prep programs in certain regions/for certain subjects” (p. 25) (Educator Preparation).
Strategies were grouped into “topic areas” for each state; therefore, the phrases in parentheses represent one of three broad areas in which strategies were grouped.
Tennessee identified several strategies. Some are listed below; please click on the link in the “More Information” section to review all of the State’s strategies.
• Evaluation: “Because we have identified school leadership and the evolving expectations as a potential root cause of our equity gaps, we are investing more in a new evaluation tool that will clarify expectations and provide more targeted feedback to leaders” (p. 30) (Human Capital Management Systems).
Tennessee identified several implementation measures. Some are listed below; please click on the link in the “More Information” section to review all of the State’s implementation measures.
• “All districts are implementing the revised version [Tennessee Instructional Leadership Standards (TILS)] in the 2014–2015 school year” (pp. 30–31).

Equity Plan Overview TENNESSEE K-161
Equity Gaps Root Causes Strategies Implementation Measures
• “In 50 of the State’s 142 districts, advanced low-income students receive highly effective teachers at lower rates than their advanced, not low-income peers” (p. 17).
• “About 60 out of the 142 districts, however, had an equity gap greater than zero, meaning that low-performing students had less access to highly effective teachers than their high-performing peers” (p. 16).
• “Rural Challenges” (p. 24) (Human Capital Management Systems).
• “Variance in Leadership Skills and Capacity” (p. 24) (Human Capital Management Systems).
• Compensation: “We plan to continue working with districts to strengthen and expand their differentiated pay plans. Technical assistance resources and individual consulting are available to districts as they draft future year plans (p. 33) (Human Capital Management Systems).
• Recruitment and Hiring: “We plan to continue working with districts to use these new selection tools and the Teacher-Teacher site. Phase 2 will also highlight some of the additional work we hope to engage in around recruitment and selection” (p. 35) (Human Capital Management Systems).
• Professional Learning: “In addition to efforts focused on teacher professional learning, the state has also devoted resource to improving administrator professional learning. The state-run Tennessee Academy of School Learners (TASL) is a state provided professional development program and one of two pathways for beginning administrators to advance their license” (p. 36) (Human Capital Management Systems).
• “In its first phase [Comprehensive Educator Data Management System], scheduled for release in fall 2015, this new system will connect our evaluation and licensure data systems, allowing for a holistic view of an educator’s preparation and teaching profile” (p. 31).
• “In October 2014, the State Board of Education passed a revised version of the Tennessee Educator Preparation Policy that encompassed the new CAEP standards and accounted for program impact and outcomes by establishing annual reporting categories. The specific metrics and benchmarks are being developed and will be used as part of the approval process in 2017” (p. 33).

Equity Plan Overview TENNESSEE K-162
Equity Gaps Root Causes Strategies Implementation Measures
• “Continuing to share human capital data and providing new and more frequent reports is a key strategy in the state’s plan to ensure equitable access to excellent educators” (p. 38) (Human Capital Management Systems).
• “Phase 2 of the state’s plan to ensure equitable access to excellent educators is designed to provide targeted supports to those districts in greatest need” (p. 40) (Human Capital Management Systems).
• “. . . The state has also developed a district equity gap report which will be incorporated into the next iteration of the human capital data reports in 2015-2016. The state aims to include information on working conditions, supply, and access as part of those additions to the human capital data report . . .” (p. 39).

Equity Plan Overview TENNESSEE K-163
PUBLIC REPORTING OF PROGRESS
• “At the State level, we anticipate continuing to provide stakeholder groups updated information about human capital data, which going forward will include updates on their equity supply and access metrics. The state department will also be responsible for providing updates about both our data and strategies to the State Board of Education. These updates will allow for even greater public awareness about the State’s progress in addressing issues of inequitable access. We have also invested in several state-level structures that aid in the monitoring and ongoing evolution of this work. The internal Office of Research and Policy provides innovative and timely analysis of these key metrics” (p. 44).
• “At the district level, the primary mechanism for continued awareness and monitoring will be through Tennessee’s human capital data reports. As one of our key strategies, these reports will be available on a yearly basis to districts and include a wealth of data regarding evaluation, retention, working conditions, supply, and access data. This LEA-level data will be summarized and analyzed to determine the progress that each LEA is making to ensure equitable access to highly effective teachers. This data will be shared with the Division of Consolidated Planning and Monitoring (CPM) and utilized as part of the annual LEA risk-assessment. The annual LEA risk assessment incorporates over 65 indicators of risk that prioritize LEAs and identify those that will have conditions placed on grant awards and/or will require an on-site Results-Based Monitoring visit by a cross-departmental team” (p. 44).
• “The Results-Based Monitoring conducted by CPM is a comprehensive on-site process that looks at effective program implementation, not just compliance. The review instrument focuses on specific levers that affect student academic achievement, not specific funding sources. The in-depth review of teacher equity issues by will focus on areas such as quality leadership, instructional practices, and effective teachers” (p. 44).
• “As mentioned in previous sections, the state has done extensive work over the last three years to reimagine and restructure the district support function. Both the Centers of Regional Excellence (CORE) offices and the Division of Consolidated Planning and Monitoring (CPM) will play integral roles in supporting districts with specific equity issues. CORE offices conduct yearly data deep-dives with each district to identify yearly priorities and develop their CORE office plan for support. This information is then used to inform each district’s strategic plan and school improvement plans to which Federal and State resources must be aligned. The CPM office collects, reviews, and approves the consolidated federal funding applications that outline the use of ESEA and IDEA funds. Both the strategic planning process (LEA and school) and the consolidated federal funding application are aligned and integrated within the new ePlan system. This shared, web based system allows for planning and budgeting of available funds to be fully integrated and transparent to all stakeholders” (p. 45).
• “By using these existing structures to monitor and support both State- and district-level implementation of strategies to address equity, Tennessee is ensuring that this plan is not a standalone effort, but rather an embedded aspect of the human capital data we expect ourselves and districts to address each year” (p. 45).
More InformationFor more details you can download the Tennessee Equity plan.
Source: Tennessee Department of Education (2015). Equitable Access to Excellent Educators. Retrieved from http://www2.ed.gov/programs/titleiparta/equitable/tnequityplan9115.pdf

EQUITY PLAN OVERVIEW
TEXAS
ANALYSIS
GAPS
STRATEGIES
MEASURES
ROOTCAUSES
DEFINITIONS
ENGAGEMENT
PUBLIC REPORTING
“Recognizing these challenges, Texas embarked upon the develop
ment of the 2015 Equity Plan by first identifying the following
guiding principles that would be critical to the design of an
effective plan:
• Seek input and guidance from those individuals and
organizations in a position to make the 2015 Equity Plan
succeed by relying on a robust stakeholder process.
• Ensure that districts and campuses at the local level, with
access to the most precise data regarding effective educators
and with the authority to enact local policies directed at
increasing equity, are empowered.
• Leverage, not layer, initiatives selected to be implemented by
taking advantage of existing resources, programs, and successes
to build upon promising work already underway.
• Invest in actions with the greatest potential to narrow the
equity gap by evaluating each proposed strategy in terms of both
its feasi bility and its likely impact” (Texas Education Agency,
2015, p. 2).
Equity Plan Overview TEXAS K-164

STAKEHOLDER ENGAGEMENT
• “To take advantage of the expertise, experience, and talent of these stakeholders, the Planning Team scheduled a series of stakeholder meetings, including an initial meeting with each stakeholder group followed by a “virtual town hall” meeting” (p. 5).
• “The initial stakeholder meetings were designed to create an interactive opportunity for stakeholders to review data and serve as advisors on interpreting the data” (p. 5).
• “The virtual town hall meeting, held in late April, provided stakeholders an opportunity to review the draft of their work and make final suggestions. A survey designed to ensure a focused examination of the plan’s key features was distributed prior to the virtual town hall” (p. 5).
• “A key mechanism for this ongoing stakeholder engagement process is the Texas Equity Plan Website (website), designed and hosted by TXCC. The website will be used to update all interested stakeholders, local education agencies, policymakers, and the general public on developments and progress made in implementing the 2015 Equity Plan” (p .5).
Equity Plan Overview TEXAS K-165
Equity Gaps
State Definitions of Key Terms: Texas defined 7 terms. Two of those terms (excellent educators and teacher absences) are additional definitions beyond those required by statute. All terms were used to inform identification of the State’s equity gaps.
Texas elected to concentrate on implementing strategies tied to its largest, most significant gaps; therefore, the gaps below represent only those identified gaps that the State will implement strategies to eliminate. For additional information about Texas’ other gaps, please click on the link in the “More Information” section.
Root Causes
Root causes were grouped into “topic areas” for each state; therefore, the phrases in parentheses represent one of three in which the root causes were grouped.
• “Campus leadership challenges” (p. 20) (Conditions).
• “Insufficient training and support for teachers” (p. 20) (Human Capital Management Systems).
Strategies
Strategies were grouped into “topic areas” for each state; therefore, the phrases in parentheses represent one of three in which the strategies were grouped.
• “Develop guidance and tools for districts to create and implement local equity plans” (p. 22) (Human Capital Management Systems).
• “Encourage training of and support for mentors of novice teachers” (p. 22) (Human Capital Management Systems).
• “Facilitate campus leader training and support” (p. 22) (Human Capital Management Systems).
Performance Measures
Texas identified several performance measures. Some are listed below; please click on the link in the “More Information” section to review all of the State’s performance measures.
• “Number and percentage of districts receiving from ESCs the training and resource toolkits to assist with development of local equity plans” (p. 25).
• “Percentages of teachers developing professional development plans, subject to future adminis tration of a statewide climate and culture survey” (p. 28).
• “Average number of hours of fieldbased experience provided by each EPP (p. 28).

Equity Plan Overview TEXAS K-166
Equity Gaps Root Causes Strategies Performance Measures
• “Data Analysis Measure 1: Inexperienced teachers. The results of the analyses show that schools with high concentra tions of minority students and students living in poverty do have higher percentages of inexperienced teachers than schools with low concentrations of those students. Across the State, on average, schools had 9.0 percent of their teachers with less than one year of experience. Schools in the highest student minority quartile had 12.1 percent of their teachers with less than one year of experience. In comparison, schools in the lowest quartile of minority students had 6.2 percent of teachers who were inexperienced.” The trend is similar in terms of students living in poverty. Schools in the highest quartile by student poverty status had 11.8 percent of their teachers with less than one year of experience. In comparison, schools in the lowest quartile by student poverty status had 6.2 percent of their teachers who were inexperienced” (p. 9).
• “Data Analysis Measurement 2: Unqualified teachers. Across the state, on average, schools employed less than one percent of teachers who failed to meet the HQT standard. Although this percentage is small, the distribution of unqualified teachers by student minority status and poverty status shows that there were higher percentages of unqualified teachers (nonHQT) in schools with high concentrations of minority students and students living in poverty” (p. 11).
• “Facilitate targeted professional development for teachers, including teacher candidates” (p. 22) (Educator Preparation).
• “Pilot opportunities for reward, recognition, and advancement of excellent teachers” (p. 22) (Human Capital Management Systems).
• “Percent of EEIP firstyear teachers assigned a mentor who teaches or has taught the same subject” (p. 37).
• “Attrition rate of teachers assigned a mentor as a part of implementing EEIP” (p. 37).

• “Schools in the lowest minority student quartile had 0.4 percent of their teachers fail to meet the HQT standard, whereas schools in the highest student minority quartile had more than one percent of their teachers fail to meet the HQT standard” (p. 11).
PUBLIC REPORTING OF PROGRESS
“ Public reporting on progress will include districts publicly reporting their status in providing for the equitable distribution of effective educators, in the same vein as district HQT reports, and the posting of aggregate progress reports on the Texas Equity Plan website” (p. 38).
More InformationFor more information, download the Texas Equity plan.
Source: Texas Education Agency. (2015). State plan to ensure equitable access to excellent educators. Retrieved from http://www2.ed.gov/programs/titleiparta/equitable/texasequityplan080715.pdf
Equity Plan Overview TEXAS K-167
Equity Gaps Root Causes Strategies Performance Measures

EQUITY PLAN OVERVIEW
UTAH
ANALYSIS
GAPS
STRATEGIES
MEASURES
ROOTCAUSES
DEFINITIONS
ENGAGEMENT
PUBLIC REPORTING
“If a comprehensive and coherent plan for increasing excellence in
every classroom is a collaborative effort of the Utah State Office of
Education and local education agencies, and if that plan addresses
key areas of culture, leadership, teaching, and policy in Utah schools,
then teacher effectiveness will be enhanced so that all students will
have equitable access to excellent teaching and leading resulting
in higher levels of collegeandcareer readiness for all students” (Utah
State Office of Education, 2015, p. 1).
STAKEHOLDER ENGAGEMENT
• “Stakeholders included not only school districts and charter schools, but also higher education and policymakers” (p. 3).
• “Initial input was received at various meetings, and additional input was received via email as various stakeholders reviewed the developing plan at two district points, one after the initial draft was prepared in early April, and again after revisions were made based on input in May” (p. 3).
• “This stakeholder involvement will continue through implementation of the plan and will be expanded to include additional participation from parents by working directly with the Utah Parent Teacher Association (PTA)” (pp. 3–4).
• “Our approach in engaging stakeholders was to use existing meeting structures to engage a variety of organizations where teachers, administrators and policymakers were in attendance” (p. 4).
Equity Plan Overview UTAH K-168

Equity Plan Overview UTAH K-169
Equity Gaps
State Definitions of Key Terms: Utah defined 7 terms. Two of those terms (qualified infield and students with disabilities) are additional definitions beyond those required by statute. All terms were used to inform identification of the State’s equity gaps.
Utah elected to concentrate on implementing strategies tied to its largest, most significant gaps; therefore, the gaps below represent only those identified gaps that the State will implement strategies to eliminate. For additional information about Utah’s other gaps, please click on the link in the “More Information” section.
• “Inexperience in Charter Schools” (p. 16).
• “Underqualified teachers in Charter Schools (p. 16).
• “Underqualified teachers in Rural Schools” (p. 17).
• “Variability at the local level” (p. 17).
Root Causes
Root causes were grouped into “topic areas” for each state; therefore, the phrases in parentheses represent one of three broad areas in which the root causes were grouped.
Utah identified several root causes. Some are listed below; please click on the link in the “More Information” section to review all of the State’s root causes.
• “Current teacher preparation programs are not producing sufficient numbers of quality candidates for available positions, and existing policies may be inadequate to support teacher recruitment to the degree needed” (p. 22) (Educator Preparation).
• “Rural areas have less access to university programs and fewer resources for professional development” (p. 22) (Human Capital Management Systems).
• “Leadership programs focusing on school management lack comprehensive preparation for talent management and instructional leadership” (p. 23) (Educator Preparation).
• “Teachers’ stated and unstated assumptions including lack of confidence in student abilities to learn based on cultural assumptions about poverty, culture, linguistic diversity, and student disabilities; fixed mindsets; biases regarding student abilities and parent involvement; and perceived desirability of certain schools, classrooms, or geographical locations” (p. 25) (Conditions).
Strategies
Strategies were grouped into “topic areas” for each state; therefore, the phrases in parentheses represent one of three broad areas in which the strategies were grouped.
• “Teacher preparation and professional learning” (p. 22) (Educator Preparation).
• “Leadership enhancement” (p. 23) (Human Capital Management Systems).
• “Attention to cultural factors” (p. 25) (Conditions).
• “Local data analysis and goal setting” (p. 26) (Human Capital Management Systems).
Performance Measures
Utah identified several performance measures. Some are listed below; please click on the link in the “More Information” section to review all of the State’s performance measures.
• “Review of all the rules and policies related to Teacher Preparation will be completed by October 2015” (p. 23).
• “The Professional Learning Series will include elements focusing on excellent teaching for all students and will be implemented by summer 2015 and revised yearly thereafter” (p. 23).
• “Students whose teachers participate in Professional Learning Series will have a demonstrable increase in achievement (at least 1% per year) as demonstrated through Student Growth Percentiles and Student Learning Objectives by Spring, 2017” (p. 23).
• “Revision of administrative licensure rules will be completed by September, 2017” (p. 24).
• “A yearly report showing retention of teachers will show an overall increase in experience in charter schools, as well as in the system overall” (p. 24).

Equity Gaps Root Causes Strategies Performance Measures
• “Cultural perceptions of education including negative public perception of education as a viable career, leading to decreasing numbers of students entering teacher preparation programs” (p. 25) (Conditions).
• “Rural LEAs have limited access to highly qualified teachers and are perceived as less desirable” (p. 26) Human Capital Management Systems).
• “A review of preparation programs for evidence of developing cultural competencies will be completed by September, 2016, and resulting rules will be considered by the Board of Education by August, 2017” (p. 25).
• “Publicly recognize highly impacted/high achieving schools by 2016” (p. 26).
PUBLIC REPORTING OF PROGRESS
• “On approval from the Department of Education, the Utah Plan to Ensure Equitable Access to Excellent Teachers will be made public via press announcements, Facebook posts, and Twitter. It is also posted on the USOE website along with other pertinent information” (p. 28).
• “As the efforts succeed, additional press releases will be made to announce progress or solicit additional input. In particular, attention will be made to publicizing the work of local education agencies in increasing access to highly qualified and experienced educators for all students in the state” (p. 28).
• “Additionally, USOE will display equity data on the Utah Data Gateway where the public will be able to access and monitor progress as listed in our strategies. This information will be updated annually beginning in the fall of 2016. Each time the Gateway is updated there will be an accompanying press release and information pushed out through social media” (p. 28).
More InformationFor more information, download the Utah Equity plan.
Source: Utah State Office of Education. (2015). Utah plan to ensure equitable access to excellent educators. Retrieved from http://www2.ed.gov/programs/titleiparta/equitable/utequityplan82715.pdf
Equity Plan Overview UTAH K-170

EQUITY PLAN OVERVIEW
VERMONT
ANALYSIS
GAPS
STRATEGIES
MEASURES
ROOTCAUSES
DEFINITIONS
ENGAGEMENT
PUBLIC REPORTING
“If exposure to inexperienced teachers is systematically occurring in
particular regions and supervisory unions and if a comprehensive
approach to talent management for those regions and supervisory
unions is implemented carefully, monitored, and modified when
warranted over time, then Vermont school districts will be better
able to recruit, retain, and develop excellent educators such that all
students have equitable access to excellent teaching and leading
to help them achieve their highest potential in school and beyond”
(Vermont Agency of Education, 2015, p. 15).
STAKEHOLDER ENGAGEMENT
• “The statewide consultation supported the planning of seven public stakeholder meetings in regions of our State where highpoverty and highminority schools are concentrated. The purpose of the meetings was for stakeholders to:
− Review data and serve as advisors on interpreting the data and the root causes behind our state’s equity gaps, using the Center on Great Teachers and Leaders resource titled Resource 7: Engaging Stakeholders in a RootCause Analysis.
− Identify and prioritize root causes of inequalities in access to excellent teachers and leaders.
− Review and provide feedback on the draft plan” (p. 3).
• “Between regional stakeholder meetings, participants were encouraged to engage more widely with colleagues and communicate back further insights that they gained. These communications were added to the compilation of stakeholder input” (p. 4).
Equity Plan Overview VERMONT K-171

• “For stakeholders interested in staying updated on the progress of developing the plan, but who may not have been able to invest significant time in the plan’s development, we posted drafts on the website for review” (p. 4).
• “Publicly report Equitable Access Plan Year 1 Progress Report and solicit input from stakeholders” (p. 28).
• “Publicly report Year 2 progress and solicit input from stakeholders” (p. 28).
• “Compile a progress report of strategy performance metrics and present to stakeholders” (p. 28)
• “Publicly report Year 3 progress and solicit input from stakeholders” (p. 28).
Equity Plan Overview VERMONT K-172
Equity Gaps
State Definitions of Key Terms: Vermont defined 8 terms. Three of those terms (city/suburbs, town, rural) are additional definitions beyond those required by statute. All terms were used to inform identification of the State’s equity gaps.
Vermont elected to concentrate on implementing strategies tied to its largest, most significant gaps; therefore, the gaps below represent only those identified gaps that the State will implement strategies to eliminate. For additional information about Vermont’s other gaps, please click on the link in the “More Information” section.
• “…High Exposure to Inexperienced Teachers in HighPoverty Schools located in Towns and Rural areas” (p. 16).
Root Causes
Root causes were grouped into “topic areas” for each state; therefore, the phrases in parentheses represent one of three broad areas in which the root causes were grouped.
Vermont identified several root causes. Some are listed below; please click on the link in the “More Information” section to review all of the State’s root causes.
• “Lack of evidence to support understanding of teacher turnover” (p. 17) (Conditions).
• “It was suggested that there might be a cultural mismatch, which leads to higher turnover” (p. 19) (Human Capital Management Systems).
• “Lack of financial resources for less affluent school communities to provide professional development for new and early career teachers” (p. 21) (Human Capital Management Systems).
• “Lack of network/peer learning opportunities among firstyear/early career teachers” (p. 21) (Human Capital Management Systems).
Strategies
Strategies were grouped into “topic areas” for each state; therefore, the phrases in parentheses represent one of three broad areas in which the strategies were grouped.
Vermont identified several strategies. Some are listed below; please click on the link in the “More Information” section to review all of the State’s strategies.
• “Research” (p. 16) (Human Capital Management Systems).
• “Promoting Effective Hiring Practices” (p. 16) (Human Capital Management Systems).
• “Improving Professional Opportunities” (p. 16) (Human Capital Management Systems).
• “Improving Working Conditions in HighPoverty Schools” (p. 16) (Conditions).
Performance Measures
Vermont identified several performance measures. Some are listed below; please click on the link in the “More Information” section to review all of the State’s performance measures.
• “By 2016, a longitudinal analysis of teacher turnover in all schools will be completed to identify schools with persistent instability” (p. 18).
• “Every year between 2016 and 2020, replicate the analysis done in the teacher migration patterns study to identify if any changes occur” (p. 18).
• “By 2017, identify the schools with persistently high and low teacher turnover for participation in focus groups related to hiring and retention practices” (p. 20).
• “By 2018, partner with at least one program (selected through competitive bid) to expand student internship placements into counties identified with persistent high turnover and study the results of that program for implementation elsewhere” (p. 21).

Equity Gaps Root Causes Strategies Performance Measures
• “Highpoverty schools tend to have a higher percentage of students with academic and social needs who require additional support from teachers and staff” (p. 23) (Conditions).
• “By 2016, formalize partnership with Vermont NEA to support increased professional learning networks in rural towns and settings” (p. 23).
• “By 2017, survey the existing practicesof higher education institutions to identify the feasibility of an extension of mentoring/networking support (higher education facilitators), satellite programs for continued learning/professional development, and research opportunities for faculty and students in highpoverty rural and town school settings” (p. 23).
PUBLIC REPORTING OF PROGRESS
“ Report future equity findings through the Committee of Practitioners (COP) that currently oversees Title I policy and action. Annual public reporting on progress toward addressing root causes and eliminating equity gaps will include posting a progress report on the website, sending a link to all LEAs and stakeholders, and sending out press releases to our major news media” (p. 31).
More InformationFor more information, download the Vermont Equity plan.
Source: Vermont Agency of Education. (2015). Teacher and leader equitable access plan. Retrieved from http://www2.ed.gov/programs/titleiparta/equitable/vtequityplan92915.pdf
Equity Plan Overview VERMONT K-173

EQUITY PLAN OVERVIEW
VIRGINIA
ANALYSIS
GAPS
STRATEGIES
MEASURES
ROOTCAUSES
DEFINITIONS
ENGAGEMENT
PUBLIC REPORTING
“Virginia consistently ranks as one of the top states in the nation in
overall educational quality and performance in Education Week’s
annual Quality Counts report and receives frequent acclaim
nationally for its effective educational policies and practices.
Virginia has continued to develop a strong educational system
spanning early pre-K learning through advanced coursework at
some of the premier higher education institutions in the country.
Crucial to the State’s educational success is the high quality of its
teaching force. Providing a highly qualified and effective teacher in
every classroom is an integral component of Virginia’s ongoing
efforts to ensure all children receive a first-class education” (Virginia
Department of Education, 2015, p. 1).
STAKEHOLDER ENGAGEMENT
• “Several meeting were planned to begin the process of stakeholder engagement, involving both the internal VDOE workgroup, as well as a large and diverse external stakeholder group largely comprised of individuals who work directly with school divisions and representatives from several professional organizations” (p. 7).
• “Meetings focused on: (1) reviewing the data that identified the equity gaps, (2) conducting a root cause analysis, and (3) identifying potential strategies to address root causes” (p. 7).
• “Virginia will continue to engage all stakeholders in ongoing discussions as the work continues and strategies are implemented” (p. 9).
Equity Plan Overview VIRGINIA K-174
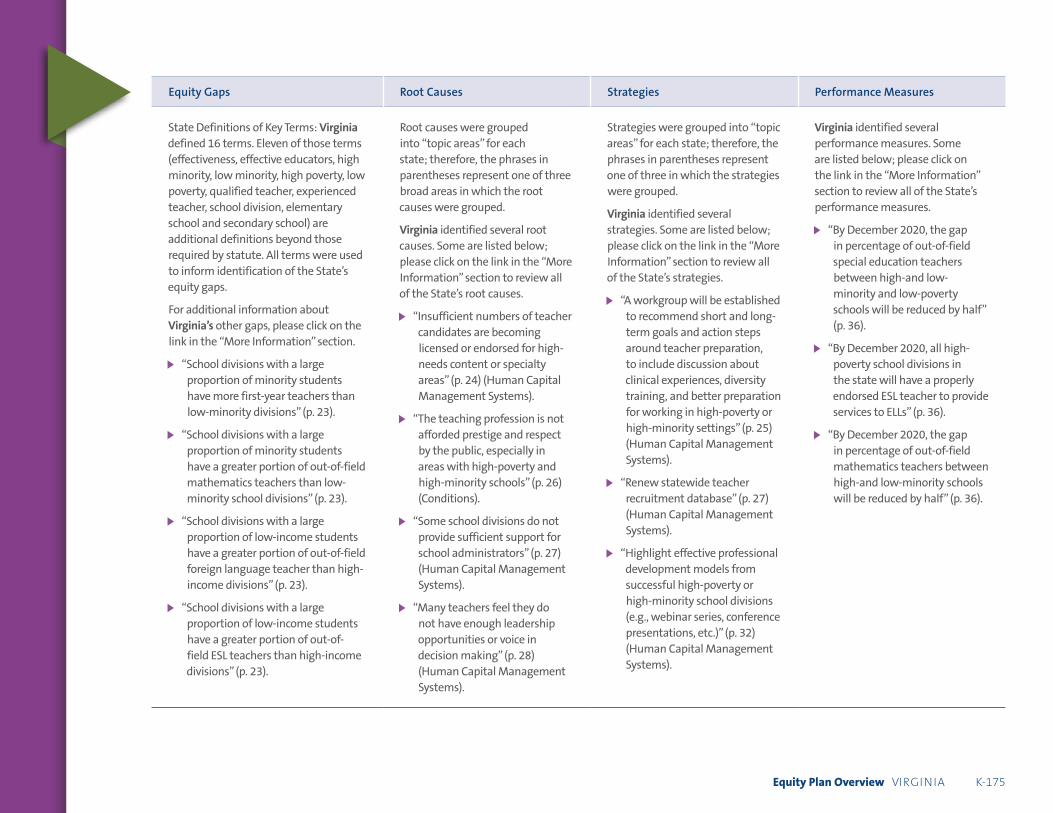
Equity Plan Overview VIRGINIA K-175
Equity Gaps
State Definitions of Key Terms: Virginia defined 16 terms. Eleven of those terms (effectiveness, effective educators, high minority, low minority, high poverty, low poverty, qualified teacher, experienced teacher, school division, elementary school and secondary school) are additional definitions beyond those required by statute. All terms were used to inform identification of the State’s equity gaps.
For additional information about Virginia’s other gaps, please click on the link in the “More Information” section.
• “School divisions with a large proportion of minority students have more first-year teachers than low-minority divisions” (p. 23).
• “School divisions with a large proportion of minority students have a greater portion of out-of-field mathematics teachers than low-minority school divisions” (p. 23).
• “School divisions with a large proportion of low-income students have a greater portion of out-of-field foreign language teacher than high-income divisions” (p. 23).
• “School divisions with a large proportion of low-income students have a greater portion of out-of-field ESL teachers than high-income divisions” (p. 23).
Root Causes
Root causes were grouped into “topic areas” for each state; therefore, the phrases in parentheses represent one of three broad areas in which the root causes were grouped.
Virginia identified several root causes. Some are listed below; please click on the link in the “More Information” section to review all of the State’s root causes.
• “Insufficient numbers of teacher candidates are becoming licensed or endorsed for high-needs content or specialty areas” (p. 24) (Human Capital Management Systems).
• “The teaching profession is not afforded prestige and respect by the public, especially in areas with high-poverty and high-minority schools” (p. 26) (Conditions).
• “Some school divisions do not provide sufficient support for school administrators” (p. 27) (Human Capital Management Systems).
• “Many teachers feel they do not have enough leadership opportunities or voice in decision making” (p. 28) (Human Capital Management Systems).
Strategies
Strategies were grouped into “topic areas” for each state; therefore, the phrases in parentheses represent one of three in which the strategies were grouped.
Virginia identified several strategies. Some are listed below; please click on the link in the “More Information” section to review all of the State’s strategies.
• “A workgroup will be established to recommend short and long-term goals and action steps around teacher preparation, to include discussion about clinical experiences, diversity training, and better preparation for working in high-poverty or high-minority settings” (p. 25) (Human Capital Management Systems).
• “Renew statewide teacher recruitment database” (p. 27) (Human Capital Management Systems).
• “Highlight effective professional development models from successful high-poverty or high-minority school divisions (e.g., webinar series, conference presentations, etc.)” (p. 32) (Human Capital Management Systems).
Performance Measures
Virginia identified several performance measures. Some are listed below; please click on the link in the “More Information” section to review all of the State’s performance measures.
• “By December 2020, the gap in percentage of out-of-field special education teachers between high-and low-minority and low-poverty schools will be reduced by half” (p. 36).
• “By December 2020, all high-poverty school divisions in the state will have a properly endorsed ESL teacher to provide services to ELLs” (p. 36).
• “By December 2020, the gap in percentage of out-of-field mathematics teachers between high-and low-minority schools will be reduced by half” (p. 36).

Equity Gaps Root Causes Strategies Performance Measures
• “School divisions with a large proportion of low-income students or minority students have a greater portion of out-of-field special education teachers than low-minority, high-income school divisions” (p. 23).
• “Teachers who enter the profession through an alternate route to licensure do not complete student teaching, which may contribute to greater challenges in the classroom” (p. 32) (Human Capital Management Systems).
• “Convene a workgroup to develop recommendations and develop action steps regarding pilot pre-service preparation programs for mathematics teachers” (p. 33) (Human Capital Management Systems).
• “Plan and coordinate programs to assist high-needs school divisions to increase the number of ESL teachers on staff” (p. 35) (Human Capital Management Systems).
PUBLIC REPORTING OF PROGRESS
• “The state equity plan will be posted on the VDOE’s Web site and updated on an ongoing basis. It is expected that data analysis will be conducted annually, with an updated plan to be posted at least every 2 years, as recommended in the Excellent Educators for All Initiative draft guidance” (p. 36).
• “Presentations regarding the equity plan will be made to a variety of audiences” (p. 36).
More InformationFor more information, download the Virginia Equity plan.
Source: Virginia Department of Education. (2015). Virginia’s plan to ensure excellent educators for all students. Retrieved from http://www2.ed.gov/programs/titleiparta/equitable/vaequityplan83115.pdf
Equity Plan Overview VIRGINIA K-176

EQUITY PLAN OVERVIEW
WASHINGTON
ANALYSIS
GAPS
STRATEGIES
MEASURES
ROOTCAUSES
DEFINITIONS
ENGAGEMENT
PUBLIC REPORTING
“Theory of Action. If we create multiple pathways into the teaching profession
and reduce barriers for teachers to achieve licensure and highly qualified status,
then Washington school districts will be better able to recruit, retain, and develop
educators to serve in all schools” (Washington State Board of Education, 2015,
p. 145).
“Theory of Action. If OSPI intentionally collaborates with pre-service teacher
education programs to align program requirements with identified equity gap
areas and expand dual endorsement programs, then Washington school
districts will be able to recruit, hire and retain teachers with both content area
expertise and a focus on either serving students with disabilities or students
who are English language learners” (p. 167).
“Theory of Action. If new teachers are provided support within the first three years
of their career in an induction and mentoring program, then they will become
effective teachers and be retained within the district and the state” (p. 181).
“Theory of Action. If Title II, Part A grants and state professional development
funding is focused on providing incentives, training, and time for unqualified,
out-of-field and inexperienced educators to develop, then districts will increase
their numbers of highly qualified, in field and experienced educators and
teachers will be more highly effective with their students” (p. 194).
“Theory of Action. If the Washington Legislature complies with the Supreme
Court order and fully funds all basic education categories, specifically
compensation, then school districts will have adequate and equitable hiring
capacity and will be able to recruit, retain and sustain effective educators to
serve all students within the state” (p. 208).
Equity Plan Overview WASHINGTON K-177

STAKEHOLDER ENGAGEMENT
• “In order to meaningfully engage with stakeholders and provide multiple opportunities for feedback, OSPI engaged in stakeholder meetings, conducted focus groups, and employed a working conditions survey” (p. 20).
• “In order to create broad, representative and ongoing stakeholder engagement, the Equity Plan Leadership Team plans to share the final Equity Plan with the stakeholders and to engage in ongoing stakeholder
coalition meetings during the implementation of the plan. Additionally, the Washington Educator Working Conditions Survey has been identified as a strategy that will be employed annually to inform policy decisions and implementation of the plan” (p. 20).
Equity Plan Overview WASHINGTON K-178
Equity Gaps
State Definitions of Key Terms: Washington defined 9 terms. Four of those terms (excellent teacher, excellent principal, highly qualified teacher [HQT], and not highly qualified teacher [not HQT]) are additional definitions beyond those required by statute. All terms were used to inform identification of the State’s equity gaps.
Washington elected to concentrate on implementing strategies tied to its largest, most significant gaps; therefore, the gaps below represent only those identified gaps that the State will implement strategies to eliminate. For additional information about Washington’s other gaps, please click on the link in the “More Information” section.
Root Causes
Root causes were grouped into “topic areas” for each state; therefore, the phrases in parentheses represent one of three broad areas in which the root causes were grouped.
Washington identified several root causes. Some are listed below; please click on the link in the “More Information” section to review all of the State’s root causes.
• “Late Hiring Timeline” (p. 145) (Human Capital Management Systems).
Strategies
Strategies were grouped into “topic areas” for each state; therefore, the phrases in parentheses represent one of three broad areas in which the strategies were grouped.
• “Invest in Multiple Pathways into the Teaching Profession” (p. 145) (Educator Preparation).
• “Collaborate to Strengthen Pre-Service Programs at Colleges of Education” (p. 167) (Educator Preparation).
Performance Measures
Washington identified several performance measures. Some are listed below; please click on the link in the
“More Information” section to review all of the State’s performance measures.
• “By the end of the 2015–16 school year, the Alternative Routes to Certification and Educator Retooling legislative requests will have passed and the increased funding and enhanced models will be implemented” (p. 151).

Equity Plan Overview WASHINGTON K-179
Equity Gaps Root Causes Strategies Performance Measures
• “With respect to the access rates to unqualified teachers (NotHQT), the state summary table below indicates that for the majority of student race/ethic groups, ELL, SPED and students in poverty (FRL) there is small disproportionality. However, 15.4 percent of American Indian students are more like to be in schools with a high percent of unqualified teachers as compared to 10.5 percent of all students, with means that 4.9 percent more American Indian students are taught by a high percent of unqualified teachers as compared to all students” (p. 52).
• “At the state level, student access rates to inexperienced teacher illustrate that students in poverty, ELL students, and Hispanic, Asian, Black and Pacific Islander students tend to be in a school with a high percentage of inex perienced teachers (with less than equal to five years of experience)” (p. 53).
• Especially, 33.3 percent of ELL students and 31.5 percent of Black students have higher access rate to inexperienced teachers compared to 20 percent of all students, a difference of 13.3 percentage points and 11.5 percentage points. These two students’ subgroups have severe equity gaps with respect to inexperienced teachers, and their actual gaps are large. The access rate to inexperienced teachers represents the high priority equity gap in Washington state” (p. 53).
• “Lack of sufficient pathways into the Teaching Profession” (p. 145) (Human Capital Management Systems).
• “Low Salaries” (p. 145) (Human Capital Management Systems).
• “Lack of Teachers in Content and Program Areas” (p. 145) (Educator Preparation).
• “Educator perception of working conditions of special education and English language learner workload” (p. 146) (Conditions).
• “Provide State Funded Induction and Mentoring Program to All Teachers Within the First 3 Years of Their Careers” (p. 181) (Human Capital Management Systems).
• “Focus Title II, Part A Grants and State Professional Development Funding on Identified Equity Gap Needs” (p. 194) (Human Capital Management Systems).
• “Full Funding of Basic Edu cation and Compensation Reform” (p. 208) (Human Capital Management Systems).
• “By the end of the 2016–17 school year, the Para-educator Pipeline bill and funding request and the Recruiting Washington Teachers Program funding increase will be developed and submitted to the Legislature” (p. 151).
• “By the end of the 2016–17 school year, the final recommendations and policy changes for strengthening the alignment of teacher education program requirements will be presented for adoption to the Professional Educator Standards Board. A summary of the rec om-mendations will be produced and included in the updated Equity Plan” (p. 171).
• “By the end of the 2015–16 school year, the state funded FTE mentor will be allocated to all school districts through the prototypical schools funding formula” (p. 184).
• “By the end of the 2017–18 school year, full funding of basic education will have been achieved by the Legislature (deadline as established by House Bill 2776 and 2261 and Supreme Court order)” (p. 213).

Equity Plan Overview WASHINGTON K-180
Equity Gaps Root Causes Strategies Performance Measures
• “In the state level, the equity gap with respect to inexperienced teachers (INX) is a high priority. Overall, there exists a tendency that students in FRL, ELL, and SPED and minority students have a higher access rate to unqualified (NotHQT), inexperienced (INX), and out-of-field (OTF) teachers as compared to White students” (p. 55).
PUBLIC REPORTING OF PROGRESS
• “The ESD Equity Gap Data Profiles (in Appendices) will be updated annually. The profiles will be disseminated to each ESD and school district through email and will be incorporated in the Title II, Part A grant application in the 2016-17school year .The profiles are also available to the public on the Title II, Part A webpage” (p. 223).
• “Beginning in the 2016-17 school year, a state Summary of Progress Closing Equity Gaps Profile will be created, measuring the statewide progress in closing equity gaps and meeting the minimum percentage performance goals. The profile will be available to the public on the Title II, Part A webpage” (p. 223).
• “In addition to sharing the equity plan and implementation progress through the Stakeholder Coalition meetings the Office of Superintendent of Public Instruction will issue an annual bulletin and memorandum to all school districts regarding the equity plan” (p. 223).
• “A web page has been developed for Washington State’s Ensuring Equitable Access to Excellent Educator Initiative and will feature all future data and plan updates. It will also be used in OSPI Twitter and Facebook social media posts” (p. 223).
More InformationFor more information, download the Washington Equity plan.
Source: Washington State Board of Education. (2015). Washington state equity plan: ensuring equitable access to excellent educators. Retrieved from http://www2.ed.gov/programs/titleiparta/equitable/waequityplan9415.pdf

EQUITY PLAN OVERVIEW
WEST VIRGINIA
ANALYSIS
GAPS
STRATEGIES
MEASURES
ROOTCAUSES
DEFINITIONS
ENGAGEMENT
PUBLIC REPORTING
“The West Virginia Department of Education strongly supports the
U.S. Department of Education’s goal of ensuring that every student
has equitable access to excellent educators and welcomes this
opportunity to present our plan for advancing this mission in West
Virginia. Their multi-faceted plan reflects extensive outreach to the
community and thoughtful deliberation about actions that most
likely will enable our schools and districts to attain this important
objective. Although the State’s plan will evolve over time, West
Virginia believes that our theory of action and the four targeted
strategies they have included in the plan embody a solid approach
to improving educator effectiveness, particularly for those most in
need” (West Virginia Board of Education, 2015, p. 77).
STAKEHOLDER ENGAGEMENT
• “To further encourage stakeholder participation, the equity plan will be made available on the WVDE website located at http://wvde.state.wv.us/certification/data/index.php and will be updated regularly following committee meetings” (p. 12).
• “The Internal Educator Equity Team, led by the Office of Educator Development, will share the equity plan implementation template electronically via a secure Microsoft 365 One Drive account” (p. 12).
Equity Plan Overview WEST VIRGINIA K-181

• “Membership from the following initiatives were included in the development of this plan, and will continue to serve as representatives for implementation of the plan:
−− lHE-High Quality Educator Stakeholder Committee (IHE-HQE);
−− Leadership Reform Stakeholders;
−− Educator Evaluation Taskforce;
−− WV Commission for Professional Teaching Standards (WVCPTS);
−− Reconnecting McDowell” (p. 12).
• “Additionally, West Virginia will continue to collaborate and consult with external stakeholders in an effort to ensure every student has equal access to a highly effective teacher and every teacher is led by a highly effective leader” (p. 12).
• “At least every two years, revisions to the plan will be made accordingly, through stakeholder feedback and data analyses” (page has no number).
Equity Plan Overview WEST VIRGINIA K-182
Equity Gaps
State Definitions of Key Terms: West Virginia defined 16 terms. Eleven of those terms (excellent teacher, excellent school leader, beginning teachers, ineffective teacher, Highly Qualified Teacher, high-poverty schools, low-poverty schools, neither high- nor low-poverty schools, poverty, high-minority schools and low-minority schools) are additional definitions beyond those required by statute. All terms were used to inform identification of the State’s equity gaps.
West Virginia elected to concentrate on implementing strategies tied to its largest, most significant gaps; therefore, the gaps below represent only those identified gaps that the State will implement strategies to eliminate. For additional information about West Virginia’s other gaps, please click on the link in the “More Information” section.
Root Causes
Root causes were grouped into “topic areas” for each state; therefore, the phrases in parentheses represent one of three broad areas in which the root causes were grouped.
West Virginia identified several root causes. Some are listed below; please click on the link in the “More Information” section to review all of the State’s root causes.
• “Through careful analysis of national research, state policy, and West Virginia data, it was determined that the root cause of educator inequity is attributed to the inconsistencies in the preparation and development of teachers and leaders” (page has no number) (Educator Preparation).
Strategies
Strategies were grouped into “topic areas” for each state; therefore, the phrases in parentheses represent one of three broad areas in which the strategies were grouped.
West Virginia identified several strategies. Some are listed below; please click on the link in the “More Information” section to review all of the State’s strategies.
• “Teacher Preparation Program Reform” (page has no number) (Educator Preparation).
• “Comprehensive Educator Evaluation System” (page has no number) (Human Capital Management Systems).
• “Principal (Leadership) Program Reform” (page has no number) (Human Capital Management Systems).
Performance Measures
West Virginia identified several performance measures. Some are listed below; please click on the link in the “More Information” section to review all of the State’s performance measures.
• “Reduce the identified equity gaps existing at specific programmatic levels by one (1) percent each year for the next three (3) years. Success in achieving this goal will drive our success in achieving our second goal—closing statewide equity gaps” (page has no number).
• “Reduce statewide equity gaps by .5 percent each year for the next three (3) years” (page has no number).

Equity Plan Overview WEST VIRGINIA K-183
Equity Gaps Root Causes Strategies Performance Measures
• “Data revealed that fewer students in high-poverty high schools were being taught by highly qualified teachers (80.2 percent) as compared to students in low-poverty high schools (89.9 percent)” (p. 62).
• “Data revealed that West Virginia students in high-poverty schools are taught by ineffective teachers at a higher rate than students in low-poverty schools” (p. 62).
• “Data revealed that West Virginia has an equity gap in inexperienced teachers at all programmatic levels, but most significantly at the elementary school level in high-poverty schools versus low-poverty schools (8.5 percent gap)” (p. 62).
• “The overwhelming consensus of stakeholders revealed a need to reform teacher preparation programs and principal preparation programs to better align with Council for the Accreditation of Educator Preparation (CAEP) Standards” (page has no number) (Educator Preparation).
• “It is important to note that data provided by the West Virginia Educator Preparation Programs (EPPs) indicate that teacher shortage is not attributed to a supply and demand issue. West Virginia institutions of higher education prepare teachers to enter the profession” (page has no number) (Educator Preparation).
• “Reconnecting McDowell Initiative” (page has no number) (Human Capital Management Systems).

PUBLIC REPORTING OF PROGRESS
• “West Virginia has established an initial timeline to guide the short-term and long-term implementation of our plan. Additional action steps will be added to the plan as strategic stakeholders meet and provide role specific feedback” (p. 73).
• “To ensure transparency, annual public reporting on progress toward addressing root causes to eliminate equity gaps will include posting a progress report on the WVDE website, sending the link to all LEAs and stakeholders” (p. 73).
• “Every two years WVDE will formally update this plan based on new data, new analyses of root causes, and new strategies. More frequent updates to inform the plan, as well as strategic approaches to addressing implementation, will be shared via stakeholder communications” (p. 73).
• “Long-term plans include publishing such reports using the WV Longitudinal Data System” (p. 73).
More InformationFor more information, download the West Virginia Equity plan.
Source: West Virginia Department of Education. (2015). West Virginia educator equity plan. Retrieved from http://www2.ed.gov/programs/titleiparta/equitable/wvequityplan9315.pdf
Equity Plan Overview WEST VIRGINIA K-184

EQUITY PLAN OVERVIEW
WISCONSIN
ANALYSIS
GAPS
STRATEGIES
MEASURES
ROOTCAUSES
DEFINITIONS
ENGAGEMENT
PUBLIC REPORTING
“This plan details our approach to achieving our objective of
improving access to excellent educators for our state’s students of
color and low-income youth. This plan represents targeted strategies
to eliminate disproportionalities based on a detailed analysis of
teacher qualifications in Wisconsin. While a state plan, this plan will
be focused on strategies related to the nine school districts to who
represent almost the entirety of our gaps in teacher experience and
preparation. DPI convened a team consisting of DPI staff to complete
this plan” (Wisconsin Department of Public Instruction, 2015, p. 1).
“As a team, this group:
• developed and began implementing a long-term strategy for
engaging stakeholders in ensuring equitable access to excellent
educators;
• reviewed Wisconsin educator data to identify equity gaps;
• conducted analyses, based on data and with stakeholders, to
identify the root causes that underlie our equity gaps to identify
and target our strategies accordingly;
• set measurable targets and created a plan for measuring and
reporting progress and continuously improving this plan” (p. 2).
Equity Plan Overview WISCONSIN K-185

STAKEHOLDER ENGAGEMENT
• “DPI held meetings with stakeholders, solicited public input through the DPI website, e-mail, and online survey instruments…” (p. 5).
• “DPI reached out separately to the nine school districts identified as the focus of our plan. The school districts were all provided information on the data analysis and information on the ESEA requirement. They were asked to provide online feedback and all were offered an opportunity to meet and discuss the data and their thoughts” (p. 6).
• “We will continue to involve stakeholders in our activities going forward. All stakeholders contacted through this process will be provided annual updates on our progress and opportunities to comment on that progress, which will inform the long-term commitment to implementing the strategies in this plan” (p. 6).
Equity Plan Overview WISCONSIN K-186
Equity Gaps
State Definitions of Key Terms: Wisconsin defined 7 terms. Two of those terms (excellent teacher and emergency credentialed teachers) are additional definitions beyond those required by statute. All terms were used to inform identification of the State’s equity gaps.
Wisconsin elected to concentrate on implementing strategies tied to its largest, most significant gaps; therefore, the gaps below represent only those identified gaps that the State will implement strategies to eliminate. For additional information about Wisconsin’s other gaps, please click on the link in the “More Information” section.
• “Increasing the number of credentialed and experienced educators serving in the high- need schools identified in these districts is the fastest way to alleviate inequality in Wisconsin and the most efficient way to apply strategies at scale” (p. 17).
Root Causes
Root causes were grouped into “topic areas” for each state; therefore, the phrases in parentheses represent one of three broad areas in which the root causes were grouped.
Wisconsin identified several root causes. Some are listed below; please click on the link in the “More Information” section to review all of the State’s root causes.
• “School districts are often unaware of the makeup within their districts and sometimes within their schools, of inexperienced and/or emergency-credentialed (unqualified or out-of-field) staff to the degree that they can make better human capital decisions regarding staffing to reduce inequitable distribution” (p. 24) (Human Capital Management Systems).
• “…nine districts struggle to financially support targeted professional learning…for their educators and instructional coaches…” (p. 25) (Human Capital Management Systems).
Strategies
Strategies were grouped into “topic areas” for each state; therefore, the phrases in parentheses represent one of three broad areas in which the strategies were grouped.
• “Resources for School Districts and Schools” (p. 21) (Conditions).
• “School Climate” (p. 21) (Conditions).
• “Ongoing Professional Learning (Skill Gaps)” (p. 21) (Educator Preparation).
• “Teacher Preparation” (p. 21) (Educator Preparation).
Implementation Measures
Wisconsin identified several implementation measures. Some are listed below; please click on the link in the “More Information” section to review all of the State’s implementation measures.
• “The report will be published annually beginning in November 2015. It will be expanded to address principals in the November 2016 report” (p. 24).
• “The Educator Effectiveness Team Director will be responsible for identifying any additional financial supports to the nine districts to support mentors and cooperating teachers. This work will be ongoing over the next two years” (pp. 26–27).
• “The TEPDL Team Director, working with the Educator Effectiveness Team Director, will be responsible for approving a standardized PDP by December 2016” (p. 27).

More InformationFor more information, download the Wisconsin Equity plan.
Source: Wisconsin Department of Public Instruction. (2015). Teacher equitable access plan for Wisconsin. Retrieved from http://www2.ed.gov/programs/titleiparta/equitable/wiequityplan082715.pdf
Equity Plan Overview WISCONSIN K-187
Equity Gaps Root Causes Strategies Implementation Measures
• “Inexperienced educators new to the profession require an induction program based on solid mentoring” (p. 26) (Human Capital Management Systems).
• “Preservice educators during their clinical student teaching/internship or residencies also require a strong mentoring component” (p. 26) (Human Capital Management Systems).
• “Limited professional opportunities and supports for teachers often inhibit school district efforts to retain teachers, particularly in Wisconsin’s urban districts” (p. 27) (Human Capital Management Systems).
• “The DPI’s Title I Team Director will be responsible for overseeing the creation of this page on the website and ensuring the nine school districts aware of it. This website will be updated as needed and will go live in January 2016” (p. 27).
• “DPI’s Director of the Educator Effectiveness Team will be responsible for managing these activities. These activities will begin in 2015 with a completion date of 2020” (p. 28).
PUBLIC REPORTING OF PROGRESS
• “Annual public reporting on progress toward addressing root causes to eliminate equity gaps will include posting a progress report on the DPI website, sending the link to the nine school districts and to stakeholders, providing opportunity for feedback and a mechanism to incorporate that feedback into an updated plan” (p. 40).
• “The DPI will annually publish reports on the equitable distribution of teachers and monitor school district progress in reducing the rates of disproportionality. DPI will work with school districts so they have complete information with which to make human resource decisions” (p. 40).
• “Every five years, DPI will formally update this plan based on new data, new analyses of root causes, and new strategies” (p. 40).

EQUITY PLAN OVERVIEW
WYOMING
ANALYSIS
GAPS
STRATEGIES
MEASURES
ROOTCAUSES
DEFINITIONS
ENGAGEMENT
PUBLIC REPORTING
“The WDE is committed to ensuring every student in a Wyoming
public school is taught by a highly qualified teacher, and recognizes
the significant impact that inequity can have on student
achievement, especially among low- income and minority students
as compared to their counterparts. Further, the WDE understands
the impact that teacher turnover can have on student achievement.
Consequently, the WDE is confident that this equity plan will ensure
every Wyoming student is taught by an experienced, highly qualified
teacher” (Wyoming Department of Education, 2015, p. 39).
STAKEHOLDER ENGAGEMENT
• “The WDE recognizes the importance of incorporating input and feedback from the State Equity Planning Committee into the Wyoming equity plan. Throughout development of the state equity plan, the WOE encouraged Committee members to provide honest input and feedback, which was gathered during the four Committee meetings, as noted in the section above” (p. 4).
• “Given the large geography of Wyoming and difficulty bringing stakeholders together in person, the Committee conducted meetings virtually, via online sessions. The North Central Comprehensive Center (NCCC) supported the online sessions through the use of Adobe Connect and meeting facilitation, allowing the WDE staff to fully participate in the planning discussions. Further, the NCCC developed a website to provide stakeholders with information about the Excellent Educators for All initiative, resources, and data. The website also stored meeting agendas, materials, and minutes” (p. 3).
• “The WDE will also biannually convene the Committee members to discuss the ongoing status of the equity plan implementation. Monitoring data will be used during these discussions. The outcome of these meetings will be adjustments to strategy implementation based on the monitoring data and Committee member feedback” (p. 5).
Equity Plan Overview WYOMING K-188

Equity Plan Overview WYOMING K-189
Equity Gaps Root Causes Strategies Performance Measures
State Definitions of Key Terms: Wyoming defined 10 terms. Five of those terms (teacher absences, teacher salary, teacher turnover, highly qualified teacher, and cohort) are additional definitions beyond those required by statute. All terms were used to inform identification of the state’s equity gaps.
For additional information about Wyoming’s other gaps, please click on the link in the “More Information” section.
• “Teacher absences” (p. 26).
• “Teacher turnover” (p. 26).
• “Lack of highly qualified special education teachers” (p. 26).
Root causes were grouped into “topic areas” for each state; therefore, the phrases in parentheses represent one of three broad areas in which the root causes were grouped.
Wyoming identified several root causes. Some are listed below; please click on the link in the “More Information” section to review all of the State’s root causes.
• “Negative media/press coverage” (p. 30) (Conditions).
• “Fewer applicants to teacher colleges” (p. 30) (Educator Preparation).
• “Few applicants” (p. 30) (Educator Preparation).
• “Less desirable job” (p. 30) (Educator Preparation).
• “Parents may or may not be as supportive” (p. 31) (Conditions).
Strategies were grouped into “topic areas” for each state; therefore, the phrases in parentheses represent one of three broad areas in which the strategies were grouped.
Wyoming identified several strategies. Some are listed below; please click on the link in the “More Information” section to review all of the State’s strategies.
• “Disseminate monthly press releases on positive news in schools, districts, and teacher prep programs, especially in relation to special education” (p. 30) (Human Capital Management Systems).
• “Create a teaching profession program similar to Future Farmers of America and Future Business Leaders of America” (p. 30) (Human Capital Management Systems).
• “Provide positive information about the teaching profession to college and high school students” (p. 30) (Human Capital Management Systems).
• “Support paraprofessional staff to become highly qualified SPED teachers” (p. 30) (Human Capital Management Systems).
• “Compensate SPED teacher for extra time spent holding case management meetings with adults” (p. 30) (Human Capital Management Systems).
Wyoming identified several performance measures. Some are listed below; please click on the link in the “More Information” section to review all of the State’s performance measures.
• “Number of press releases disseminated” (p. 36).
• “Document detailing how to create a teaching profession program” (p. 36).
• “Number of Career Fairs with teacher informational booths, including the participating local and regional IHEs and districts” (p. 36).
• “Document detailing how to recruit, support, and incentivize paraprofessional staff to become highly qualified SPED teachers” (p. 36).
• “Document detailing how to train principals on how to support SPED teachers” (p. 36).
• “Document detailing how to train principals on how to use funds to compensate SPED teachers” (p. 37).
• “Document detailing how to train principals on how to engage parents and families of SPED students” (p. 37).

Equity Plan Overview WYOMING K-190
PUBLIC REPORTING OF PROGRESS
• “All data will be reviewed annually by the WDE and the State Equity Planning Committee members to determine what additional strategies may need to be implemented, and will be publicly provided on an annual basis on the WDE website” (p. 35).
• “The WDE will collaborate with the identified responsible parties to ensure data collection, detailed in Table 5, and milestones are completed in accordance with the finalized strategy timelines” (p. 35).
• “These data will review on a bi-annual basis to assess strategy implementation, modification, and completion. The Information will be made available to appropriate education stakeholders across Wyoming” (p. 35).
• “To ensure the support is meeting district needs, data will be collected by surveying districts as they employ the guidance documents” (p. 35).
More InformationFor more information, download the Wyoming Equity plan.
Source: Wyoming Department of Education. (2015). Wyoming plan to ensure equitable access to excellent educators. Retrieved from http://www2.ed.gov/programs/titleiparta/equitable/wyequityplan11515.pdf