equity measurement clean energy industry
TRANSCRIPT
The State of Equity Measurement: A Review of Practices in the Clean Energy Industry
veic.org
September 1, 2019
i
Table of Contents Acknowledgments .........................................................................................................1
Introduction ................................................................................................................... 2
Background and Purpose ....................................................................................................... 2
Methodology ........................................................................................................................... 2
Terminology............................................................................................................................ 2
Key Findings .................................................................................................................. 5
Common Approaches to Equity in the Clean Energy Industry ................................................. 5
Defining Target Populations ................................................................................................... 7
Determining Disparate Impacts..............................................................................................10
Including Representative Voices............................................................................................17
Summary Table: Equity Metrics and Data Requirements ........................................ 21
Annotated Bibliography .............................................................................................. 26
A o t t e A t o s .......................................................................................................
Acknowledgements
VEIC would like to acknowledge the contributions of three key outside reviewers, whose work is at the front edge in addressing equity questions: Dr. Tony G. Reames, at the University of Michigan School for Environment and Sustainability and the Urban Energy Justice Lab; Dr. Diana Hernandez, at the Columbia University Mailman School of Public Health; and Michael Dworkin at Vermont Law School and the Institute for Energy and the Environment. VEIC deeply appreciates the support of Energy Trust of Oregon, particularly Executive Director Michael Colgrove, in funding this work and leading on equity issues in the energy efficiency industry. Energy Trust’s Dan Rubado and Juliette Thacher were also instrumental and shared their knowledge and time in support of this work. Lauren Wentz from Efficiency Vermont was particularly helpful in the early stages of research, bringing a strong understanding of equity issues. Dr. Carlos Mart n at the Urban Institute provided a deep background on diversity, equity and injustice that was central to the development of this paper.
The authors would also like to thank Dr. Marti Frank at Efficiency for Everyone, who provided invaluable insights and guidance during this project and who has been a strong partner on equity issues in the clean energy industry.
2
Introduction
Background and Purpose The purpose of this report is to document efforts to-date to define, collect, analyze, and report on equity in the clean energy industry. The research highlights practices that have worked well, establishes a comprehensive list of data sources, and synthesizes challenges that clean energy program administrators and evaluators have faced. It also identifies gaps in the availability of equity-related data, analytical techniques, and reporting methods.
These findings will be used to inform future guidance to help clean energy industry practitioners measure, analyze, and report on equity in their work.
Methodology The researchers conducted a literature review of policy documents and studies in the energy industry. Documents were selected with input from experts in the field of energy and equity and key references from these documents were investigated during the research. The central research questions guiding this work include:
• How is equity addressed in the clean energy industry? • What data were used to address and measure equity? • What type of analysis was conducted? • How were the findings reported, in what format and distribution channels?
The researchers also interviewed representatives from Energy Trust of Oregon and Efficiency Vermont to provide expertise in specific areas. Nineteen studies were deemed relevant by members of the project team and also included suggestions from industry representatives outside the project team. Information was collated in a shared document, synthesizing relevant information in each study, including the metrics and data used by the studies’ authors. Over the course of several months, the VEIC research team iteratively discussed findings and qualitatively evaluated the importance of each study.
Terminology Equity is a complex topic with varying definitions, across policy, industry and academia. Equity is different and broader than equality, and efforts at increasing equity may go beyond equal access or equal distribution to account for historical or present inequalities. This report includes six dimensions of equity, adapted from the equity definitions presented in the Part 2 companion report.
3
Historical legacies Equity requires an understanding and redressing of past instances of structural conditions of injustice and chronic unfairness.
Access discrimination Equity involves avoiding or redressing both explicit discrimination and implicit bias that limit access to products and services.
Awareness of populations Equity considers demographic differences and supports the identification of groups that may not be accessing services. Demographic characteristics most commonly include race, gender, income, and age, but can also involve other traits like language, rurality, physical challenge, internet bandwidth and use, household composition, housing tenure, household-head work schedules, or the inability to pay a large upfront fee.
Inclusion of other voices Equity requires that target groups (as defined above) are meaningfully represented in the design, delivery, and oversight of programs and services. This concept is sometimes known as “procedural justice.” Equity advocates frequently note gaps in programs’ staffing, supply chains, leadership, and advisory or regulatory entities as causes of unfair or inequitable conditions (particularly regarding race and income in relation to service area demographics).
Output differences Equity encompasses the quality of services and products. In other words, does the target group not just have access to the service, but have access to high-quality service? Output differences may be measured qualitatively rather than quantitatively.
Disparate impacts Equity involves consideration of the mid- and long-term outcomes of programs and services – the measurable results of the programs – and may be caused by unintended discriminatory effects.
In addition, the following are key clean energy industry terms used throughout the report:
• Clean energy: We use this term broadly to refer to a range of clean energy products, programs, and services to customers, including energy efficiency, renewable energy, and demand response. Most of our research was drawn from the energy efficiency industry, which has a longer track record and more robust evaluation protocols than other parts of the industry. However, the findings should be broadly applicable to any program trying to encourage adoption of clean energy.
• Program: A set of interventions, such as technical assistance and incentives, designed to encourage adoption of clean energy products, services, and practices.

4
• Program administrator (PA): The organization operating the clean energy program. In most states, utilities serve as PAs for clean energy programs. In some states, including Hawaii, Oregon, Vermont, and Wisconsin, non-utility third parties administer clean energy programs.
5
Key Findings
Common Approaches to Equity in the Clean Energy Industry Our research identified certain ways that equity is commonly addressed – and not addressed – in the clean energy industry. We summarize these themes across three axes: terminology used, demographic characteristics addressed, and dimensions of equity considered.
The term “equity” is rarely used in the clean energy industry. When equity is used, it most often references an equitable split in program spending between the residential and commercial sectors, in proportion to the fees collected from ratepayers to fund the program. When considering equity in relation to demographic characteristics such as race, gender, age, income, language spoken, housing status (e.g., renter vs. owner), and location, clean energy PAs tend to use other terms. The most common terms used in the clean energy industry are: low-income, energy burden, hard-to-reach, underserved, and disadvantaged. We found that the clean energy industry more commonly seeks to measure key indicators (e.g., energy burden) rather than to explicitly address the underlying ethical concept (it’s unfair for some people to have a bigger burden than others).
The clean energy industry most commonly focuses on low-income customers. This is likely because income levels are relatively easy to measure, and clean energy programs can readily align with income thresholds used in similar low-income programs (for example, Weatherization Assistance Programs (WAP) serving low-income customers). In addition, some clean energy PAs focus on housing type, often by targeting renters. Other efforts to address equity target geography, by focusing on certain disadvantaged or underserved communities, while others target language, by translating program materials into other languages. Some PAs also consider certain non-residential groups, such as small businesses, “hard-to-reach” and target them for enhanced programming. Notably, efforts in the clean energy industry to address equity in terms of race and gender seem largely limited to internal efforts to increase diversity in program staff, advisory boards, and suppliers. It is less common for clean energy programs to focus on race and gender when assessing program impacts. The reasons for this are not clear, though historically, the clean energy has been largely comprised of white and male, upper-middle class perspectives.
Equity of program access, impacts, and outcome is more often a policy goal than a formal requirement. Equity of treatment, program access, and outcome was not found to be a direct program requirement in most cases, but for many programs and jurisdictions equity in a broad sense was directly cited as a policy goal. For example, the Northwest Power and Conservation Council’s Model Conservation Standards includes action item MCS-1, “Ensure all-cost effective measures are acquired”, and calls out that all “[resource programs] should determine how to improve participation in cost-effective programs from any underserved segments.” Additionally, the Council’s assessment of under-served markets highlights the intent of MCS-1, “MCS-1
6
originated from interest in ensuring that all segments of the population receive the benefits of the region’s energy efficiency efforts.”1,2
To the extent that current clean energy programs – particularly efficiency programs – are not equitable in their design and delivery, most likely stems from inattention rather than intention. As noted by Chant and Huessy, “It is hard to find a legislator, regulator, efficiency program designer, or program implementer who intentionally sets out to create programs that take more resources away from low-income people than what the programs provide for them in services. However, the reality is that too many programs do just that. Across the country, efficiency programs paid for in part with low-income ratepayer funds fail to provide commensurate benefits to those ratepayers.”3 They go on to describe the factors that lead to “the inadvertent and inequitable allocation of energy efficiency program resources”: limited funding resources, cost-effectiveness testing requirements, lack of program metrics tied to equity, and regulatory processes that may discourage participation of low-income people and their advocates.4 Chant and Huessy go on to describe these challenges in depth. Other challenges experienced by industry professionals include limited savings potential of smaller homes, high costs of outreach to low-income customers and higher costs completing projects due to the need for higher incentives to overcome customer barriers.
The clean energy industry commonly focuses on three dimensions of equity. In our research, we found that PAs are most often addressing equity across the following dimensions:
• Defining target populations, • Determining disparate impacts of programs, and • Including representative voices in program design and delivery.
We did not find examples of clean energy PAs focused on other dimensions of equity, such as historical legacies (redressing past wrongs or chronic structural conditions of injustice) or explicit discrimination. It appears that most clean energy PAs have not yet addressed or found ways to measure these more challenging dimensions of equity.
The following sections provide more information about how the clean energy industry addresses equity across these three dimensions.
Defining Target Populations Many clean energy industry studies focus on defining certain target populations considered to require special consideration or treatment from clean energy programs. Identifying these target
1 Northwest Power and Conservation Council, “Seventh Northwest Conservation and Electric Power Plan” 2 Northwest Power and Conservation Council, “Northwest Under-Served Energy Efficiency Market Assessment,” April 2018, https://www.nwcouncil.org/reports/northwest-under-served-energy-efficiency-markets-assessment-draft. 3 Elizabeth Chant and Frances Huessy, “Justice for All: Measures of Equity for Low-Income programs,” ACEEE Summer Study Proceedings, Summer 2018, 1. 4 Ibid, 6-8.
7
groups is likely a necessary first step to addressing equity. Program design elements and the importance of designing for a targeted population is highlighted by a meta-analysis of program evaluations in California.5 In this study, income and education were the most frequently collected data points by evaluators and primary language spoken was the least often collected information. The key finding from this report was that programs that do not define and target key populations result in a participant population that is not representative of the general population. This report highlights the relevance of defining and targeting key populations in program design.
This research uncovered multiple studies identifying low-income energy customers as target populations to better understand, and more effectively engage. In the review of studies conducted by the research team, references to equity and inclusion were less frequent than references to key metrics like “energy burden.” Energy burden is metric that measures a household’s income relative to the amount spent on energy. Low-income customers are the most likely to have high energy burdens, particularly those who are limited to using high intensity and expensive fuel sources like oil and propane. Though this metric is frequently referenced, it may not fully capture the complexity of low-income customers’ relationships to energy expenses. Many low-income households have low energy expenditures because they are cost constrained. The impact of energy efficiency measures also depends heavily on the energy rates. Energy burden is a useful to tool for describing the challenges of addressing energy use in low-income households but may not fully capture the challenges of reaching and adequately addressing the needs of low-income customers.
References to geography, specifically rural versus urban customers, were infrequently referenced, though this was included by Energy Trust of Oregon. In addition, Focus on Energy, the statewide energy efficiency program in Wisconsin, has dedicated funding for programs serving rural residents and businesses.6 Of the other demographic variables, targeting programs based on dwelling type (e.g., multifamily housing) is relatively common in the clean energy industry, and there are efforts in some states (e.g., California, Massachusetts) to target program education and marketing to non-English language speakers.7 Efficiency Vermont developed a low-income multifamily program and translated several documents to Nepali and Arabic for New Americans. We did not find clean energy industry examples targeting groups based on education level, resident age, race, or ethnicity.
The literature reviewed less often referenced commercial and industrial (C&I) customers, though this is considered a target population by some organizations, particularly small and medium businesses. The most sophisticated metrics, like those developed by the Energy Trust of Oregon,
5 Marti Frank and Seth Nowak, “Who’s Participating and Who’s Not? The Unintended Consequences of Untargeted Programs,” ACEEE Summer Study Proceedings, Summer 2016, 13. 6 Focus on Energy, “Focus on Energy 2019 Program Updates,” December 13, 2018. https://www.focusonenergy.com/sites/default/files/inline-files/Focus_2019_Updates_Webinar.pdf 7 For example, Southern California Edison (SCE) and Southern California Gas Company (SoCalGas®) offer the Community Language Efficiency Outreach (CLEO) program. CLEO provides in-language energy efficiency outreach to the Chinese, Vietnamese, Korean, Hispanic, Indian and African-American communities. CLEO, http://www.cleosave.com/.
8
include references to metrics including (but not limited to) racial and ethnic diversity, contracts with women-owned businesses and relationships with community organizations in underserved areas.8 In another example, the California Energy Commission integrates job creation as a key metric along with the number of household health and safety issues abated through energy efficiency programs.
Key Metrics and Methods The two most common metrics used to identify target populations are 1) low annual income and 2) high energy burden.
• Low-income. Programs almost universally target very low-income groups, though some programs are now including moderate-income households, notably in the BayREN service area of San Francisco and in Efficiency Vermont’s service area. 9 In the APPRISE study on low-income market characterization in Maryland, the energy burden of low-income households was also highlighted as a key metric. In this study, households at or below 200% of the federal poverty level are considered low-income. The authors also referenced demographics (including characterizations like “child under 6” and “elderly”), type of housing, and energy affordability as key indicators to track equity efforts in Maryland.
• High energy burden. The Vermont Law School Energy Burden report defines energy burden in a two-step process. First, the amount of energy consumed multiplied by the price of energy equals a household’s energy spend. Energy burden is then calculated as a household’s annual spend on energy, divided by their annual income.10 Most programs use U.S. Census data to capture income data. In the Vermont Law School study, data were computed in aggregate, examining trends across the population. The University of Michigan conducted a study to capture social equity impacts of state policy and defined low-income populations as those earning below 200% of the federal poverty level.11 When a household’s energy burden surpasses 10% the home is considered to suffer energy poverty or to be “fuel poor.”
Methods to define target populations include calculations of energy burden, spatial analyses of energy burden, and analyses of demographic information. Geographic analyses were conducted by Energy Trust of Oregon, Illume Advising and VEIC. Energy Trust of Oregon reviewed residential, commercial and industry participation within Energy Trust’s service territory and computed participation rates and savings per participant site. Data from the American Community
8 Energy Trust of Oregon, “Energy Trust of Oregon: Diversity, Equity and Inclusion Operations Plan,” December 14, 2018. 9 Grounded Research and Consulting, “Market Characterization Study,” September 20, 2018. 10 Jonathan Teller-Elsberg et al., “Energy Costs and Burdens in Vermont: Burdensome for Whom?” (Vermont Law School, December 2014). 11 Ben Stacey, Tony Reames, and Urban Energy Justice Lab, “Social Equity in Energy State Policy: Indicators for Michigan’s Energy Efficiency Programs” (School for Environment & Sustainability, University of Michigan, December 2017).
9
Survey was aligned with participant data and non-participant site data using geographic analysis and used to develop indices for racial diversity and income. In addition, USDA Rural Urban Commuting Area Codes were referenced to develop an urban/rural index. Illume Advising conducted interviews in Vietnamese and Korean neighborhoods in Atlanta, GA using Census data to identify populations.12 In a study prepared by VEIC for Efficiency Vermont, spatial analysis was conducted to identify neighborhoods with high energy burdens. Survey data, geo-spatial modeling and energy use data were used to estimate average energy spending and burden for households in each Census block group in the state, for each energy category, including thermal, electric and transportation. This work initiated targeted efficiency spending in communities around the state.13
Case Study: Energy Costs and Burdens in Vermont: Burdensome for Whom? The Institute for Energy and the Environment at Vermont Law School issued a report analyzing the energy burden in Vermont using data from the Census Bureau’s American Community Survey. This research found a striking increase in energy burdens across the state over time, by analyzing energy burden by household income deciles. The analysis determining energy burden was conducted using a relatively simple two-step process:
Quantity of energy consumed x price of energy = spending on energy
Spending on energy/income = energy burden
An innovative element of this work was inclusion of interviews with influential stakeholder groups before finalizing the report to gain insights on what the most achievable recommendations might be in addressing energy burdens. The researchers then used this information to inform the final recommendations, targeted at each stakeholder group. Interviews were conducted with legislators, community groups, social service agencies and utility/fuel providers. The final recommendations for utilities and fuel providers included offering extra assistance for disconnected households and allowing for on-bill financing of efficiency improvements while also considering business strategies for diversification into energy services companies, in which the utility would act as an energy service company.
Determining Disparate Impacts Another body of studies focus on examining disparity in levels of program impacts or outcomes regarding different population segments, markets, and program focus areas. Key metrics for measuring and comparing program impacts are covered in more detail in this section. Determination of disparate impacts most often includes comparative analysis, examining:
• Whether the impacts for an individual group are proportional to that group’s share of the program-eligible population, or
12 Lisa Obear, “Georgia Power Language Needs Assessment,” (Illume Advising, February 2018). 13 Justine Sears, “Mapping Total Energy Burden in Vermont: Mapping Vermonters’ Thermal, Electric and Transportation Energy Use” (Efficiency Vermont, July 2016).

10
• How the program outcomes for different groups compare to other groups or program outcomes.
If outcomes represent less than the target population share relative to the total population or if targeted program impacts are less than those from other programs on a per participant basis, the targeted group may be said to be underserved.
Common performance indicators for clean energy programs include savings outcomes and investment levels, but those metrics alone may not be enough to inform a deeper consideration of program impacts for different groups. Targeted programs, particularly those serving low-income populations, often have minimum program performance requirements for spending and savings impact. For example, the DC Sustainable Energy Utility, administered by VEIC, has minimum performance benchmarks requiring 20% of program investment and 10% of energy savings for programs targeting low-income residents.14 Investment and savings metrics may not capture a full measure of equity, namely consideration for distribution and access, quality, or outcome, particularly when programs define success at the aggregate rather than participant level. Reviews of program participation studies and impact evaluations found that focusing on participation rates and comparison of outcomes across different participant groups can be used to provide programs with information on how they can better serve certain groups and the potential drivers for disparate program outcomes.
One type of analysis conducted to define target populations includes participant analysis, aimed at understanding who is participating in programs to identify gaps in reaching targeted groups. Participant analysis was used in both the Navigant Consulting study for National Grid Rhode Island15 and the Northwest Underserved Energy Efficiency Market Assessment report conducted by the Northwest Power and Conservation Council.16 In the study conducted by Navigant Consulting, a participation review was conducted of six major programs including single family programs, multifamily programs, residential new construction and small business. The goal was to understand participant characteristics and communicate those characteristics to regulators and other stakeholders. Using a random forest classification to classify by characteristics, the researchers developed a regression model to predict participation in programs based on demographic data, income data and property data. Northwest Power and Conservation Council also assessed participant demographics and conducted a participant distribution analysis, reviewing the participation rate across various demographic groups in programs relative to the general population.
14 DC Sustainable Energy Utility, 2018 Annual Report, https://www.dcseu.com/media/default/docs/about-us/dcseu-annualreport-final.pdf. 15 Navigant Consulting, “Energy Efficiency Program Customer Participation Study for National Grid,” October 19, 2017. 16 Northwest Power and Conservation Council, “Northwest Under-Served Energy Efficiency Market Assessment.”

11
The other common analysis conducted in these studies was geographic analyses, most commonly using spatial data and U.S. Census data. For example, the Applied Economics Clinic looked at energy efficiency program savings by zip code in Massachusetts, and found substantial differences in the level of energy savings in different Massachusetts towns.17 The researchers also mapped Census data, such as income levels, percentage of renters, and percentage of foreign-born populations, to identify communities that may be under-served by energy efficiency programs across the state. The study found that “lower-income communities are receiving lower efficiency savings. Families in towns and Boston neighborhoods with median household incomes of $45,000 or less averaged 1.9 percent in savings, while the remaining towns and neighborhoods averaged 2.7 percent.”18
Key Metrics and Methods Clean energy programs most commonly employ the following metrics to measure equity of program impacts:
• Program Investment: the level of program investment – often categorized by sector – with spending targets for programs targeting low-income or underserved communities. These investment targets are often set based on ratepayer contribution rates, with low-income spending targets set based on the total contribution from low-income ratepayers. For example, the research team has direct involvement with programs in Vermont and Washington, D.C. administered by VEIC, and both programs have spending targets intended to set a minimum level of low-income program investment. Other approaches to reviewing program investment include comparisons of program investment across different demographic groups. In an innovative approach, researchers at the University of Michigan developed the Energy Efficiency Equity Baseline (E3b), “which estimates equitable utility investment proportionate to the low-income population in the service territory and as a percentage of the total residential energy efficiency investment portfolio.”19 A case study covering use of the E3b for Utility Investments in Michigan is provided below.
• Energy Savings: the level of energy savings associated with targeted programs. Savings can be assessed at the participant/site level or for select program. Energy Trust of Oregon reviewed average energy savings per participant site as part of their Diversity, Equity, and Inclusion Data and Baseline Analysis with the goal of assessing level of service for program participants.20 Other programs track overall energy savings for targeted programs. As previously noted, the DC Sustainable Energy Utility, administered by VEIC,
17 Elizabeth A. Stanton, Emrat Nur Marzan, and Sagal Alisaiad, “Accessing Energy Efficiency in Massachusetts: An Initial Review of Data” (Applied Economics Clinic, prepared for Conservation Law Foundation, February 2018). 18 Ibid. 19 Tony Reames, Ben Stacey, and Michael Zimmerman, A Multi-State Analysis of Equity in Utility Sponsored Energy Efficiency Investments for Residential Electric Customers (University of Michigan, April 2019) 20 Dan Rubado et al., “2018 Diversity, Equity and Inclusion Data and Baseline Analysis” (Energy Trust of Oregon, December 26, 2018).
12
has program performance targets for low-income savings, combining program savings for electric and natural gas efficiency programs. Comparing program energy savings for targeted programs against those for other programs may highlight disparate outcomes.
• Energy Cost Savings: the level of energy cost (utility or fuel bill) savings for program participants. Interviews with program staff leading Efficiency Vermont’s targeted low-income efforts highlighted the program intent to track direct program benefits. The program is in the process of reviewing updated low-income tracking metrics and may propose an energy cost savings metric tracking monthly participant energy bill savings or program participants.
• Program Participation: the number of customers directly served by a program. For example, as part of internal tracking metrics, VEIC monitors the number of participants in different program areas including commercial, residential, and low-income programs. Current year customer counts are benchmarked against program participation from prior years to identify participation trends and areas that may be underserved.
• Participation Rate: a measure of the level of program participation as a proportion of potential or eligible customers. This may provide more information as to the program’s service levels for targeted markets. Comparison of participation rates can also serve as a benchmarking exercise to inform levels of equity across program offerings. Several studies included reviews of participation rates for different programs - those targeted at underserved populations and those with no eligibility criteria for participation. Examples were outlined in the previous section.
It is important to note that these metrics may rely on customer-specific data, which may not be available for all types of clean energy programs. For example, some energy efficiency programs work “midstream” or “upstream” by engaging with manufacturers, retailers, and wholesale distributors to influence the stocking and sales of energy-efficient products. These programs may not collect data on individual customers, which limits the type of analysis that can be performed.
If additional demographic and firmographic data can be gathered both for direct program participants and program-eligible non-participants, additional metrics can be developed that provide a more specific assessment of program equity. These metrics are less commonly used as they require data that is not often readily available and may require more sophisticated analysis:
• Participation Rates by Demographic or Firmographic Classification: measures program participation based on different demographic (e.g., income level, race, educational attainment) or firmographic (business type, business size, business sector) groupings. This type of analysis would usually rely on demographic data are collected for individual program participants rather than a Census-level analysis. Energy Trust of Oregon compared participation rates across demographic and firmographic indices they developed as part of their Diversity, Equity, and Inclusion (DEI) Data and Baseline Analysis. These indices included income, racial/ethnic diversity, and rural-urban location scored on a quintile scale, as well as groupings based on business type, size, and sector.
13
Differing rates of participation across these indices identified potential areas where Energy Trust’s customers may have been over or underserved by their current program efforts.21
• Comparisons of Participant and Program-Eligible Population Demographics/ Firmographics: determines whether demographics/firmographics of program participants reflect the demographics/firmographics of the eligible participant population and if certain demographic groups are under or underserved. The Northwest Power Council used this comparison approach in their equity assessment work using participant distributions, which measured the number of participants in selected demographic categories as a proportion of total program participants. Comparing participant distributions to total population distributions allowed the council to asses if certain groups might be over or underrepresented in program participation.22
• Comparisons of program investment and savings: assesses rates of investment and savings achieved by different demographic groups, such as the total level of savings for targeted vs. non-targeted programs or depth of savings achieved by different demographic/firmographic groupings. The University of Michigan’s Urban Energy Justice Lab developed the E3b metric previously discussed and highlighted in the case study below to provide a metric for such comparisons.
Methods and Data Sources Methods and metrics for determining disparate impacts of clean energy programs are informed by the availability and depth of detail for program tracking data and demographic and firmographic data for the program’s eligible participant base. Funding levels for this analysis can also dictate methods, with more complex analysis requiring greater levels of investment and certain third-party data sets, demographics and firmographics, requiring purchase. If demographic and firmographic data are available, additional analysis may also be required to align those data with program participants and program-eligible populations to ensure that they are appropriately representative of the program population.
Program Participant Data
Energy efficiency programs typically maintain program tracking databases for purposes of program management and regulatory or external reporting. For programs administered by utilities, customer billing and energy use records may also be available. Program participant data that may be used in determination of disparate program impacts includes:
• Spending levels by program: can include a breakdown of incentives received by program participants as well as other program costs (e.g., administrative, evaluation, and marketing costs)
21 Rubado et al. (Energy Trust of Oregon, December 26, 2018). 22 Northwest Power and Conservation Council, “Northwest Under-Served Energy Efficiency Market Assessment.”
14
• Energy savings by program: usually measures electricity savings in kWh or fuel savings in therms or MMBtu, and can also include other impacts (e.g., emission reductions, demand reduction, water savings)
• Energy savings by project or participant • Incentive per project or participant • Participant site location: may be used in geographic reference and analysis • Utility bills and costs: used as input for calculating energy burden
Demographic and Firmographic Data
Beyond information on program participation, additional demographic information for residential and multifamily populations may be used to inform analyses focused on determining disparity of program impacts. Similarly, firmographic data can be used when conducting these analyses for eligible program businesses. Energy efficiency programs rarely collect demographic or firmographic information for their participants, outside of income qualification for low-income targeted programs. Review of current program efforts to asses equity and participation found that these data are being sourced either from publicly available resources, such as the U.S. Census Bureau’s American Community Survey, or in the case of firmographic data from commercially available third-party data sources.23 Since these data are most likely not being collected for individual program participants, some level of data alignment and matching will be required as part of the analyses summarized below. Examples of demographic and firmographic data include:
Demographics
• Household size • Household income • Race and ethnicity • Age • Education level • Rural vs. Urban location24 • Energy expenditures – self reported25
Firmographics
• Industry type • Property characteristics • Business Size • Business sales
23 Rubado et al., “2018 Diversity, Equity and Inclusion Data and Baseline Analysis.” 24 Rubado et al. 25 Sears, “Mapping Total Energy Burden in Vermont: Mapping Vermonters’ Thermal, Electric and Transportation Energy Use.”

15
Data Alignment Methods
Deriving the metrics outlined above requires analysis of program tracking and participation, demographic, and firmographic data, which may necessitate alignment and matching exercises, as previously discussed. Two examples of data alignment approaches are provided here.
• Geographic analysis: this approach involves assigning demographic or firmographic data to individual program participants or service areas based on geographic boundaries (e.g., census tracts, counties, cities). Survey data or other records that have been collected for individual residents or properties within a geographic boundary are assigned to program participants that reside within that service boundary based on site records from program tracking records. This can be achieved through direct comparison of data sets, but it is often completed using GIS software, given the capabilities of those tools to align disparate data sets based on geographic location and produce comparative maps and other reports.26 This approach was used in Energy Trust of Oregon’s DEI Data and Baseline Analysis, as well as the Energy Burden studies completed by Vermont Law School and Efficiency Vermont.
• Direct matching: when demographic or firmographic data is available for unique individuals or site addresses, direct matching can be done using the site and account information from program tracking databases. Merging this data can be challenging for certain customer segments and may require data field adjustments given misalignment of data fields from different sources. Navigant used this approach in their customer participation study for National Grid Rhode Island, merging third-party data sources for household and property characteristics with program tracking data. They found low match rates for multifamily residential accounts creating uncertainty in the analysis. For participant income, there was also misalignment between the program tracking income categorization and the income information available from third party sources. Accuracy of matching to current residents or business owners may also pose a challenge with this approach when using historic data, as customer movement and business relocations or closures occur. This challenge was called out as a potential data health issue by Navigant in their analysis. Energy Trust of Oregon also noted this limitation: “Because third-party demographic data is a snapshot in time, it may not indicate the race/ethnicity or income of past participants since household and business ownership and occupancy change over time.”27
Once this data alignment is complete, participation and equity metrics can be derived through comparison and distribution analyses.
Case Study: University of Michigan Social Equity in State Policy The University of Michigan’s Urban Energy Justice Lab completed a study in 2017 reviewing the social equity achievements of two Michigan residential energy efficiency programs. The study
26 Rubado et al., “2018 Diversity, Equity and Inclusion Data and Baseline Analysis.” (Energy Trust of Oregon, December 26, 2018). 27 Ibid.
16
authors evaluated whether the level of investment and household energy savings for programs serving low-income residents were proportional to the number of low-income residents in each utility service territory. To determine whether program outcomes were equitable, the researchers compared actual levels of program investment and savings for low-income programs to proportional shares of investment and savings for the utility energy efficiency efforts. This comparison was enabled through the development of a new metric for measuring the disparities in program outcomes, the Energy Efficiency Equitable baseline (E3b), which serves as a benchmark for proportional levels of program outcome.
In the study, E3b metrics for program investment and savings were developed for two separate utility residential electric and gas efficiency programs, using information from utility regulatory filings and the proportion of low-income population for each utility service territory.
Investment E3b = Total Residential Program Investment x Low Income (% population)
Savings E3b = Total Residential Program Savings x Low Income (% population)
Once derived, the E3b metrics were compared to actual investment and savings levels for each low-income targeted program to assess equity and gaps in program outcomes. Results from the study found that gas program spending was more equitable than electric program spending. Gas program investments were within 1% of a proportional rate, while electric program spending showed a significant gap, 56% below a proportional level of investment. Savings levels showed much more significant disparities, with actual savings for gas programs 84.2% below and savings for electric programs 60.7% below proportional levels.
To further investigate these discrepancies, levels of per-capita spend and savings were derived for low-income and high-income programs for the same two utilities. Comparison of per-capita outcomes for these two groups mirrored the findings using the E3b metric. Investment ratios for gas programs were found to be more proportional than those for electric programs, and savings ratios much less proportional than level of investment, with per capita savings ratios reaching up to 22:1 in savings compared to investment when program savings between high and low-income customers were compared, combining electric and gas savings.28
This study provides an example of using publicly available information to determine disparity of program investment and outcomes to better inform policy and program implementation decisions.
Including Representative Voices The research team considered ways that the clean energy industry is incorporating equity into program processes, which we refer to as procedural fairness or justice. This includes the demographic representativeness of professional program staff, its consultants and supply chain
28 Stacey, Reames, and Urban Energy Justice Lab, “Social Equity in Energy State Policy: Indicators for Michigan’s Energy Efficiency Programs.”

17
providers, and leadership in comparison to their service population. It also involves having representative voices lead or otherwise participate meaningfully in program design.
Metrics, Methods, and Data Sources Because there was little published research, this synthesis of key metrics is based primarily on the experience of Energy Trust of Oregon, which shared its internal work with the research team, supplemented by general knowledge of clean energy industry activities.
Key metrics related to procedural fairness and representation in organizational staffing and oversight include:
• Number or proportion of diverse applicants, new hires and existing staff, usually in terms of race, gender, and age.
• Number or proportion of diverse board members on boards of directors, advisory boards, and other oversight bodies. This can relate to both the personal demographic characteristics of board members, usually in terms of race, gender, and age. It can also relate to the demographic representativeness of board members in representing the voices of certain groups (e.g., low-income communities, small businesses) or geographies.
• Number or proportion of diverse trade allies (clean energy contractors who are formally affiliated with the program), most commonly certified minority- and women-owned businesses.
• Number or proportion of clean energy projects completed by diverse trade allies, most commonly certified minority- and women-owned businesses.
• Number or proportion of contracts with diverse suppliers or vendors, most commonly certified minority- and women-owned businesses.
• Number of community organizations engaged, with a focus on those who represent diverse or underserved communities.
While these are important metrics, “qualitative measures about the quality of engagement must supplement quantitative measures of representativeness.”29 For example, interviews or focus groups with staff and board members can shed light on whether they feel meaningfully engaged. Organizations can also take steps to increase the level of cultural literacy, engagement, and inclusion by educating staff and board members through readings, presentations, and discussions.
At present, it is unknown what percentage of clean energy programs collect data related to procedural fairness and representation. Data on key metrics would need to be tracked and reported internally on an annual basis, to understand trends. To the extent that program administrators are collecting this type of data, it is generally used to support internal efforts to enhance diversity and inclusion, rather than reported externally to regulators, stakeholders, or other members of the public.
29 Martin, Carlos and Jamal Lewis, The State of Equity Measurement: A review of non-energy services delivery and their equity measures (Task 3 report).
18
Other Approaches to Include Representative Voices In addition to tracking progress against the metrics identified above, our research identified two notable strategies that clean energy program administrators and regulators are using to include representative voices in program design and delivery.
• Program design: includes the use of techniques such as Design Thinking or Lean Startup to gather meaningful input from customers.
• Advisory boards: involve the creation of formal oversight or advisory boards with representatives of defined groups.
Program design. Based on the research team’s experience, techniques such as Design Thinking and Lean Startup are becoming more common in the clean energy industry. Adapted from use in product development (Design Thinking) and start-up businesses (Lean Startup), these approaches include wa systematic process to get early, rapid feedback from prospective customers on new products and services. In the context of the clean energy industry, these products and services are usually new or refined programs designed to encourage adoption of energy-efficient products or practices.
Design Thinking30 and Lean Startup31 can support efforts to include representative voices by creating a structured, streamlined process to get useful feedback from target groups early in the program design process. For example, a Design Thinking approach to program design starts with empathizing with the customer, often through interviews with current or prospective customers. Design Thinking also includes a prototyping step in which program designers develop a simplified prototype, often a drawing or mock-up, of a product, service, or message and test it on customers. Similarly, Lean Startup emphasizes developing a “minimum viable product” (MVP) that can be tested on prospective customers to quickly gather useful feedback.
Design Thinking and Lean Startup can encourage inclusion of representative voices, but only if the customers and users engaged are representative of the target population for the program being designed. For this reason, it is important to define the target population before starting the program design process.
Advisory boards. Several states that are leaders in energy efficiency,32 notably Massachusetts, Connecticut, and Rhode Island, have created energy efficiency advisory councils to oversee the development and delivery of energy efficiency plans by utilities and program implementers. Energy Trust of Oregon has a diversity advisory group and VEIC has an energy equity advisory group. These advisory boards can support inclusion of representative voices by formalizing roles for representatives of key groups, such as low-income customers.
30 IDEO, “What is Design Thinking?” https://www.ideou.com/blogs/inspiration/what-is-design-thinking. 31 The Lean Startup, “Methodology” http://theleanstartup.com/principles. 32 ACEEE, 2018 State Energy Scorecard, https://aceee.org/state-policy/scorecard.
19
In Massachusetts, the Green Communities Act of 2008 created an Energy Efficiency Advisory Council (EEAC) to guide the long-term vision for the state’s energy future, as well as development and implementation of energy efficiency plans and programs by the state's investor-owned gas and electric utilities and energy efficiency providers. The EEAC is composed of representatives from organizations and interests that are named in the enabling legislation.33 It specifically includes representatives for residential consumers, the low-income weatherization and fuel assistance network, organized labor, energy efficiency small businesses, and nonprofits, among others.34
In Rhode Island, the Energy Efficiency & Resource Management Council (EERMC) reviews and oversees the energy efficiency and system reliability programs and initiatives administered by National Grid, the electric and gas utility.35 As in Massachusetts, members of the EERMC are appointed by the Governor and include nine voting representatives from large and small commercial and industrial customers, residential customers, low-income customers, environmental interests, energy design and codes, energy law and policy, energy efficiency education and employment tracking, and municipal energy users. Connecticut also has a similar advisory body, the Connecticut Energy Efficiency Board (EEB).36
In each of these states, the energy efficiency programs are primarily delivered by investor-owned utilities. These advisory boards, supported by expert consultants, meet regularly and have a formal role in program planning as well as monitoring and evaluating program results. They review utility program plans and results, and often recommend ways to improve the programs. The inclusion of representatives from certain groups, such as low-income customers, puts pressure on the utilities to offer more robust programs and services for these groups.
Case Study: Energy Trust of Oregon Energy Trust of Oregon has been making a sustained and comprehensive effort to improve diversity, equity, and inclusion (DEI). Their efforts encompass defining target populations, determining disparate impacts, and including representative voices. This case study focuses on their efforts to include representative voices, drawing on internal research and reports that Energy Trust of Oregon shared with the research team.
In 2018, Energy Trust of Oregon developed a DEI Operations Plan that set 10 measurable DEI goals that the organization is striving to meet by 2020.37 Six of these goals relate directly to procedural fairness and representation:
33 Massachusetts Green Communities Act of 2008, https://malegislature.gov/Laws/SessionLaws/Acts/2008/Chapter169 34 Massachusetts Energy Efficiency Advisory Council, http://ma-eeac.org/about/. 35 Rhode Island Energy Efficiency & Resource Management Council, https://rieermc.ri.gov/about/. 36 Connecticut Energy Efficiency Board, https://www.energizect.com/connecticut-energy-efficiency-board. 37 Energy Trust of Oregon, “Energy Trust of Oregon: Diversity, Equity and Inclusion Operations Plan," December 14, 2018.

20
1. Increase participation in the Trade Ally Network by minority-owned and women-owned business by 50 percent each by the end of 2020.
2. Increase the number of projects completed by minority-owned and women-owned trade allies by 15 percent by the end of 2020.
3. Increase the number of contracts executed with minority-owned and women-owned businesses by 15 percent by the end of 2020.
4. Increase market awareness and understanding of underserved populations by developing and deepening of relationships with up to 50 organizations (e.g. community-based organizations, culturally specific/culturally responsive organizations, municipal agencies, membership organizations, etc.) by the end of 2020.
5. Increase the diversity in recruitment and hiring of employees by 25 percent by the end of 2020.
6. Increase organizational cultural responsiveness by the end of 2020.38
Energy Trust of Oregon has also committed to increase transparency and community engagement by publishing its diversity, equity and inclusion operations plan and progress towards its goals.39 Finally, Energy Trust of Oregon is finalizing a Diversity Advisory Council to guide the board and staff on DEI efforts and progress.
38 Energy Trust of Oregon, “Diversity, Equity and Inclusion Update,” (December 14, 2018). 39 Ibid.
21
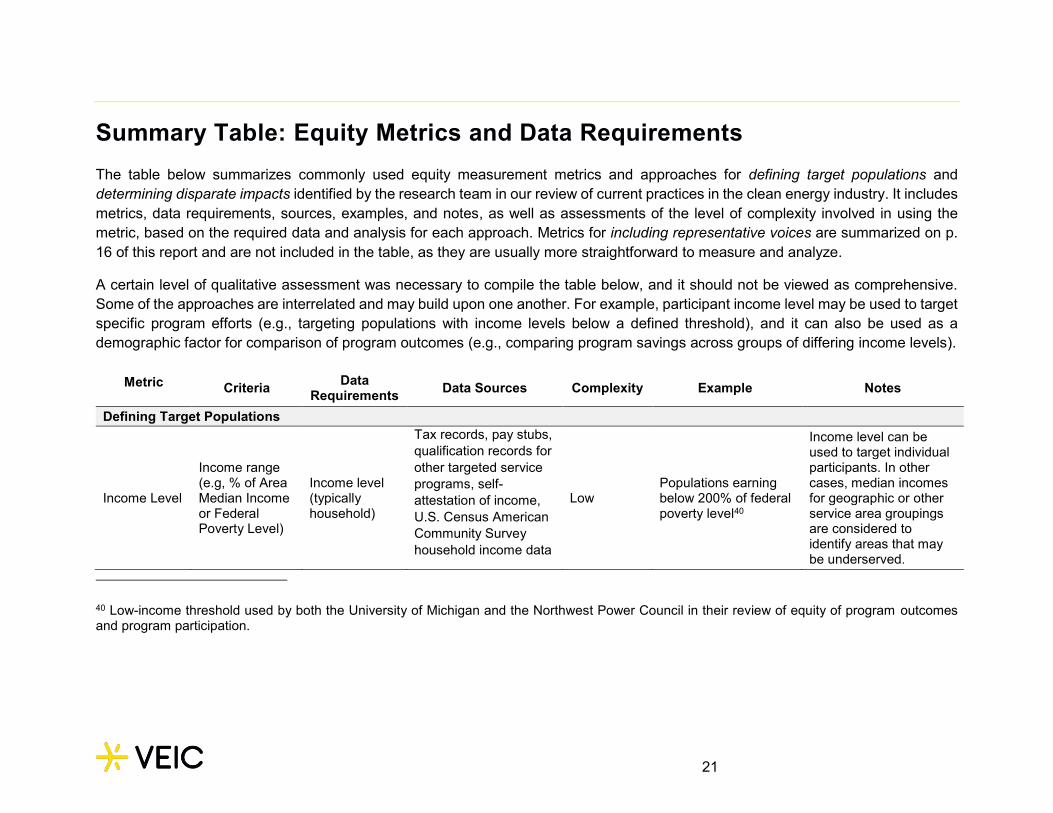
Summary Table: Equity Metrics and Data Requirements The table below summarizes commonly used equity measurement metrics and approaches for defining target populations and determining disparate impacts identified by the research team in our review of current practices in the clean energy industry. It includes metrics, data requirements, sources, examples, and notes, as well as assessments of the level of complexity involved in using the metric, based on the required data and analysis for each approach. Metrics for including representative voices are summarized on p. 16 of this report and are not included in the table, as they are usually more straightforward to measure and analyze.
A certain level of qualitative assessment was necessary to compile the table below, and it should not be viewed as comprehensive. Some of the approaches are interrelated and may build upon one another. For example, participant income level may be used to target specific program efforts (e.g., targeting populations with income levels below a defined threshold), and it can also be used as a demographic factor for comparison of program outcomes (e.g., comparing program savings across groups of differing income levels).
Metric Criteria Data Requirements Data Sources Complexity Example Notes
Defining Target Populations
Income Level
Income range (e.g, % of Area Median Income or Federal Poverty Level)
Income level (typically household)
Tax records, pay stubs, qualification records for other targeted service programs, self-attestation of income, U.S. Census American Community Survey household income data
Low Populations earning below 200% of federal poverty level40
Income level can be used to target individual participants. In other cases, median incomes for geographic or other service area groupings are considered to identify areas that may be underserved.
40 Low-income threshold used by both the University of Michigan and the Northwest Power Council in their review of equity of program outcomes and program participation.
22
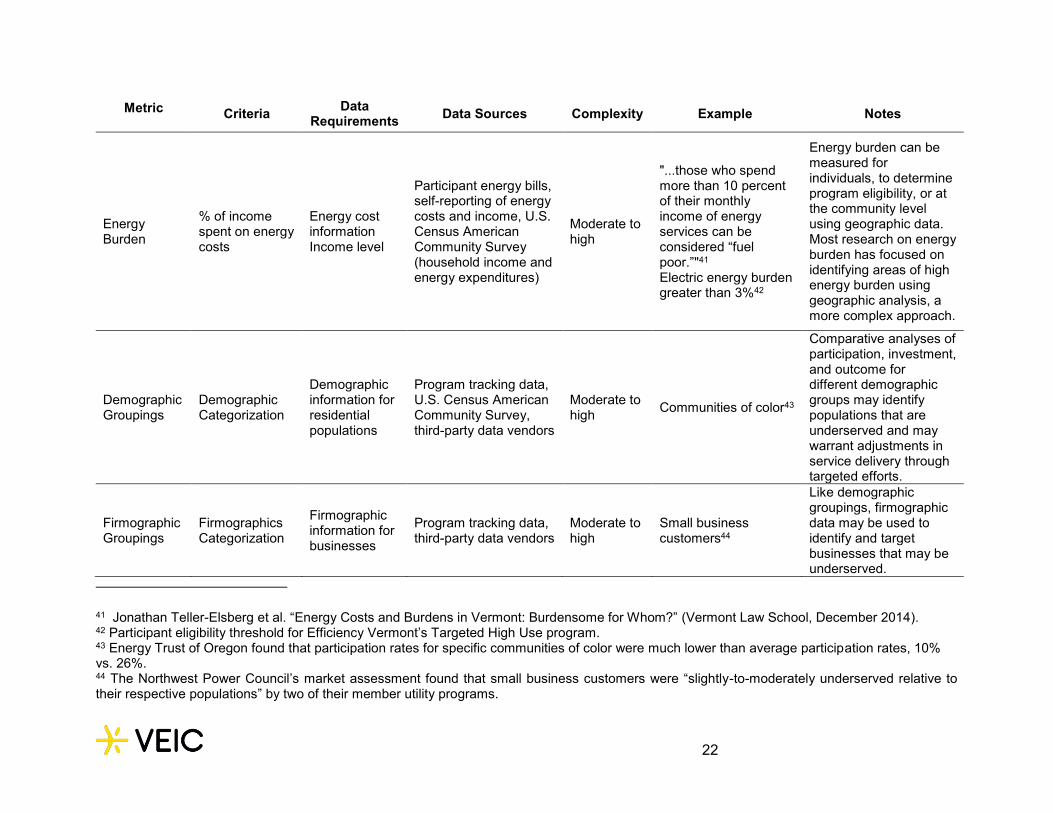
Metric Criteria Data Requirements Data Sources Complexity Example Notes
Energy Burden
% of income spent on energy costs
Energy cost information Income level
Participant energy bills, self-reporting of energy costs and income, U.S. Census American Community Survey (household income and energy expenditures)
Moderate to high
"...those who spend more than 10 percent of their monthly income of energy services can be considered “fuel poor.”"41 Electric energy burden greater than 3%42
Energy burden can be measured for individuals, to determine program eligibility, or at the community level using geographic data. Most research on energy burden has focused on identifying areas of high energy burden using geographic analysis, a more complex approach.
Demographic Groupings
Demographic Categorization
Demographic information for residential populations
Program tracking data, U.S. Census American Community Survey, third-party data vendors
Moderate to high Communities of color43
Comparative analyses of participation, investment, and outcome for different demographic groups may identify populations that are underserved and may warrant adjustments in service delivery through targeted efforts.
Firmographic Groupings
Firmographics Categorization
Firmographic information for businesses
Program tracking data, third-party data vendors
Moderate to high
Small business customers44
Like demographic groupings, firmographic data may be used to identify and target businesses that may be underserved.
41 Jonathan Teller-Elsberg et al. “Energy Costs and Burdens in Vermont: Burdensome for Whom?” (Vermont Law School, December 2014). 42 Participant eligibility threshold for Efficiency Vermont’s Targeted High Use program. 43 Energy Trust of Oregon found that participation rates for specific communities of color were much lower than average participation rates, 10% vs. 26%. 44 The Northwest Power Council’s market assessment found that small business customers were “slightly-to-moderately underserved relative to their respective populations” by two of their member utility programs.
23
Metric Criteria Data Requirements Data Sources Complexity Example Notes
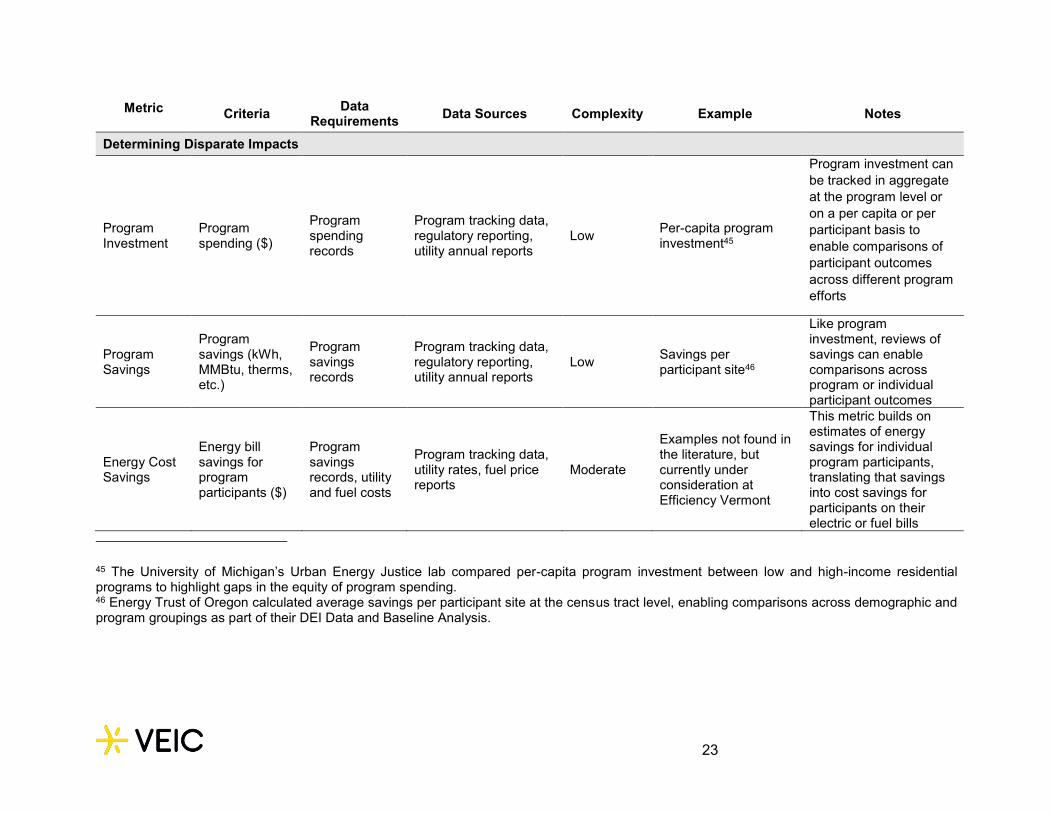
Determining Disparate Impacts
Program Investment
Program spending ($)
Program spending records
Program tracking data, regulatory reporting, utility annual reports
Low Per-capita program investment45
Program investment can be tracked in aggregate at the program level or on a per capita or per participant basis to enable comparisons of participant outcomes across different program efforts
Program Savings
Program savings (kWh, MMBtu, therms, etc.)
Program savings records
Program tracking data, regulatory reporting, utility annual reports
Low Savings per participant site46
Like program investment, reviews of savings can enable comparisons across program or individual participant outcomes
Energy Cost Savings
Energy bill savings for program participants ($)
Program savings records, utility and fuel costs
Program tracking data, utility rates, fuel price reports
Moderate
Examples not found in the literature, but currently under consideration at Efficiency Vermont
This metric builds on estimates of energy savings for individual program participants, translating that savings into cost savings for participants on their electric or fuel bills
45 The University of Michigan’s Urban Energy Justice lab compared per-capita program investment between low and high-income residential programs to highlight gaps in the equity of program spending. 46 Energy Trust of Oregon calculated average savings per participant site at the census tract level, enabling comparisons across demographic and program groupings as part of their DEI Data and Baseline Analysis.
24
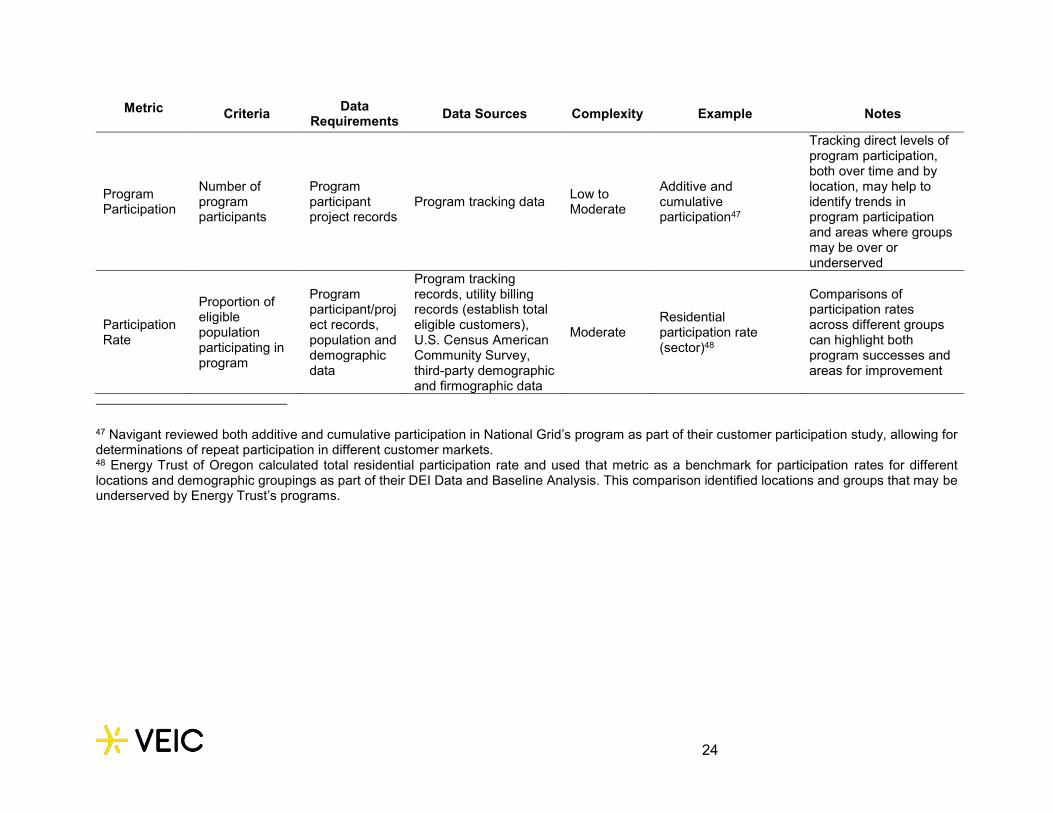
Metric Criteria Data Requirements Data Sources Complexity Example Notes
Program Participation
Number of program participants
Program participant project records
Program tracking data Low to Moderate
Additive and cumulative participation47
Tracking direct levels of program participation, both over time and by location, may help to identify trends in program participation and areas where groups may be over or underserved
Participation Rate
Proportion of eligible population participating in program
Program participant/project records, population and demographic data
Program tracking records, utility billing records (establish total eligible customers), U.S. Census American Community Survey, third-party demographic and firmographic data
Moderate Residential participation rate (sector)48
Comparisons of participation rates across different groups can highlight both program successes and areas for improvement
47 Navigant reviewed both additive and cumulative participation in National Grid’s program as part of their customer participation study, allowing for determinations of repeat participation in different customer markets. 48 Energy Trust of Oregon calculated total residential participation rate and used that metric as a benchmark for participation rates for different locations and demographic groupings as part of their DEI Data and Baseline Analysis. This comparison identified locations and groups that may be underserved by Energy Trust’s programs.

25
Metric Criteria Data Requirements Data Sources Complexity Example Notes
Participation Distribution
Proportion of total population for specific demographic or firmographic grouping
Population and demographic data
U.S. Census American Community Survey, third-party demographic and firmographic data
Moderate
"Using the participant distribution analysis, a utility might find that 80% of their program participants were single family households compared to 50% of their customers – a finding that would suggest single family households were overrepresented among program participants.”49
Participation distributions can serve as a benchmark for program participation rates, highlighting areas where participation rates differ from the population distribution for individual groups.
49 The Northwest Power Council’s market assessment used participation distributions for individual member programs to determine whether the distribution of program participants differed from overall population distributions, highlighting groups that may be underserved.
Annotated Bibliography
ACEEE. “Efficiency Metrics for Low-Income Programs.” ACEEE, December 8, 2017.
This memo from ACEEE to Efficiency Vermont outlines how the efficiency utility might consider tracking program impacts on low-income households, including non-energy benefits. ACEEE identified 17 metrics that are divided into 4 main categories: spending on low-income programs, outcomes and benefits of such programs, other energy efficiency portfolio benefits and equity. The memo lays out a table with metrics, definitions, data needs and limitations, mapping the various options available for more fully capturing outcomes of low-income programs.
APPRISE. “Maryland Low-Income Market Characterization Report,” October 3, 2018.
This study was commissioned by the Maryland Office of People’s Council and reports that differences in income, demographics, housing, energy use and energy affordability must be considered to effectively target energy programs. Program participation differs substantially by county in Maryland, demonstrating the importance of outreach and support to reach specific populations. According the research conducted here, renters are more likely to receive energy assistance as are homes with expensive bulk fuel needs. Elderly residents participate in energy assistance at lower rates than other populations and low-income households, on average, have unaffordable energy bills and housing costs. Agencies should account for their territory’s specific needs to ensure equitable access to programs.
Chant, Elizabeth, and Frances Huessy. “Justice for All: Measures of Equity for Low-Income Programs,” ACEEE Summer Study Proceedings. 2018.
This whitepaper emphasizes the interrelatedness of energy efficiency to other goals like increased health, reduced energy costs and clean air. The authors explore how to better reach low-income customers and highlights the importance of distributive justice in programs, defined as an equal or greater amount of spending across a portfolio spent on low-income programs. The authors argue that job creation and funds for subcontracting, especially in disadvantaged communities should be measured alongside traditional metrics for energy efficiency programs.
California Energy Commission. “Energy Equity Indicators Tracking Progress.” California Energy Commission, June 25, 2018.
A body of work from the California Energy Commission grew from Senate Bill 350 in 2015. The legislation declared that insufficient information exists to fully realize the potential of solar photovoltaic energy generation to serve low-income customers, including those in disadvantaged communities. This report outlines progress against equity indicators and is connected to a web-based “Interactive Story Map” that provides a geospatial view of the state’s equity progress by region and census tract.

27
Doughman, Pamela. “CEC Energy Equity Indicators: Overview of Draft Tracking Progress Report,” Presentation. April 4, 2018.
See above.
Doughman, Pamela, and Michael Sokol. “Clean Energy Equity Framework.” California Energy Commission, May 2017.
This report identifies relevant metrics to ensure that low-income customers are being served by energy efficiency and renewable energy programs in California. The report highlights two types of indicators. The first type is a geospatial indicator to measure local considerations related to the economy, demography, social engagement public health and environmental quality. Another set of indicators address three key objectives: increasing access to clean energy, expanding clean energy investment and increasing community resilience. There are 12 indicators to point to progress on the key objectives.
Energy Trust of Oregon. “Energy Trust of Oregon: Diversity, Equity and Inclusion Operations
Plan,” December 14, 2018.
In this report, Energy Trust of Oregon outlines internal goals for operations related to diversity, equity and inclusion. An inclusive stakeholder process was facilitated to inform the operations plan and wide-reaching goals. This work supports the organization’s goals of increasing customer participation in energy efficiency programs and renewable energy programs.
Energy Trust of Oregon. “Diversity, Equity and Inclusion Update.” December 14, 2018.
In this presentation, Energy Trust of Oregon presents recommendations on diversity, equity and inclusion to the board of directors. The presentation includes reports on the results of the baseline study conducted earlier, specifically participation rates in programs, staff diversity, diversity of contracts and the results of an Intercultural Effectiveness Survey.
Frank, Marti, and Seth Nowak. “Who’s Participating and Who’s Not? The Unintended Consequences of Untargeted Programs,” ACEEE Summer Study Proceedings. 2016.
This report synthesizes 66 California program evaluations and market studies, focusing on investor owned utility programs for a program cycle (2010-2012). The authors demonstrate that untargeted energy efficiency programs (targeting no specific group) result in participants who do not reflect the general population. One of the key findings from the report identifies program elements like the outreach approach and buy-in cost of the program greatly influenced participant demographics.
Grounded Research Consulting, LLC. “Market Characterization Study, BayREN Single Family Moderate Income,” September 20, 2018.
28
Interviews, surveys and a literature review conducted by Grounded Research Consulting, were used to characterize the single-family moderate-income population in the San Francisco Bay area. Customers who were targeted were identified as living in single family homes with less than five units with incomes between $48,000 and $125,000. The researchers discovered that barriers to whole home deep energy retrofits within this target group are most often financial barriers. Because many home owners in this group already have relatively low energy costs, investments in energy efficiency appear to be of limited value.
Navigant Consulting. “Energy Efficiency Program Customer Participation Study for National Grid,” October 19, 2017.
This study was commissioned by National Grid and investigated the influence of demographics, property type and energy use characteristics on participation and non-participation in programs. The authors found that in the Single-Family Homes Program, there was greater participation in urban and suburban areas. They also found that more low-income customers participated in the electric programs than the gas programs. Recommendations included more targeted marketing, performance metrics for contractors and strategically placed incentives.
Northwest Power and Conservation Council. “Northwest Under-Served Energy Efficiency Market Assessment,” April 2018.
The Northwest Power and Conservation Council published the Seventh Northwest Conservation and Electric Power Plan in 2016. The plan included action items for the region to complete in order to meet the plan objectives, and this report resulted from the action item MCS-1 - Ensure All Cost Effective Measures Are Acquired, which seeks to improve the regions energy efficiency program efforts by ensuring that programs reach different population segments proportionally. Working group members conducted participant analyses for their individual service territories, including participation distribution and participation rate analyses. The working group’s findings included that most segments were being reached by current program efforts, though some could be reached at a greater scale or with more consistency. Most programs in the region included programs targeted at segments perceived to be underserved. Additional findings were provided for different market segments and demographic groups.
Obear, Lisa. “Georgia Power Language Needs Assessment.” Illume Advising, February 2018.
Illume conducted interviews in Korean and Vietnamese neighborhoods to capture language preferences when interacting with utilities. Seventy-one customers were interviewed across the city of Atlanta and identified using Census data and zip codes, selecting on areas with the highest proportion of Korean and Vietnamese residents. The research found preferences for speaking in customers’ native language most prominent among the Baby Boomer generation and less prominent among Millennials.
29
Reeves, Scott, Reynolds Arlis, Matei Perussi, Tim Murray, Robert Lamoureux, and M. Sami Khawaja. “Massachusetts Low-Income Multifamily Initiative Impact Evaluation.” Cadmus, October 2015.
The Cadmus Group prepared this report for the Electric and Gas Program Administrators of Massachusetts and evaluated the impact of low-income multifamily programs in Massachusetts. Some recommendations from this evaluation include; improved program tracking systems for data collected and savings claimed, a consideration of the influence of gas measures, pro-active realization rates for each program administrator, on-site analyses of programs and low-income baseline assessments for heating measures.
Rubado, Dan, Andy Griguhn, Alex Novie, Debbie Menashe, Fred Gordon, and Dani Ledezma. “2018 Diversity, Equity and Inclusion Data and Baseline Analysis.” Energy Trust of Oregon, December 26, 2018.
This paper reports on the outcomes from a baseline analysis on diversity, equity and inclusion efforts at Energy Trust of Oregon. The report centers on four sectors; residents in underrepresented communities, small and medium businesses, commercial businesses in rural areas and small and medium industrial customers. Using largely U.S. Census Bureau data, the authors analyzed participation rates in all programs.
Sears, Justine. “Mapping Total Energy Burden in Vermont: Mapping Vermonters’ Thermal, Electric and Transportation Energy Use.” Efficiency Vermont, July 2016.
A team from Efficiency Vermont examined spatial patterns in energy expenditures and energy burdens in Vermont communities. They focused the research on how much residents pay for thermal heating, electricity and transportation energy. Survey data, modeling, and energy use data were used to estimate energy spending (expressed in dollars) and burden (expressed as a percent of income) for each Census block group in the state. This report led to potential starting points for energy efficiency efforts.
Stacey, Ben, Tony Reames, and Urban Energy Justice Lab. “Social Equity in Energy State Policy: Indicators for Michigan’s Energy Efficiency Programs.” School for Environment & Sustainability, University of Michigan, December 2017.
In this study, the authors developed a new quantitative measure: The Energy Efficiency Equitable Baseline (E3b), to identify disparities that occur in policy decision-making and program outcomes. They analyzed utility investments and energy savings from annual regulatory reports in Michigan and included spatial data representing the proportion of low-income residents in each utility territory. Overall, gas program investments were more equitable than electric.
Stanton, Elizabeth A., Emrat Nur Marzan, and Sagal Alisaiad, “Accessing Energy Efficiency in Massachusetts: An Initial Review of Data.” Applied Economics Clinic, prepared for Conservation Law Foundation, February 2018.

30
This study looked at energy efficiency program savings by zip code in Massachusetts, and found substantial differences in the level of energy savings in different Massachusetts towns.50 The researchers also mapped Census data, such as income levels, percentage of renters, and percentage of foreign-born populations, to identify communities that may be under-served by energy efficiency programs across the state. The study found that lower-income communities are receiving lower efficiency savings.
Teller-Elsberg, Jonathan, Benjamin Sovacool, Taylor Smith, and Emily Laine. “Energy Costs and Burdens in Vermont: Burdensome for Whom?” Vermont Law School, December 2014.
This report captures the growing energy burdens in Vermont and makes recommendations for utilities, legislators, outreach organizations and program developers. The Vermont Low Income Trust for Electricity commissioned the research and it was partially supported by Carnegie Mellon University. The data used to support the recommendations came largely from the Census Bureau’s American Community Survey, which provides expenditure data on electric, natural gas, oil and kerosene usage and household income.
50 Elizabeth A. Stanton, Emrat Nur Marzan, and Sagal Alisaiad, “Accessing Energy Efficiency in Massachusetts: An Initial Review of Data” (Applied Economics Clinic, prepared for Conservation Law Foundation, February 2018).
About the Authors
Emily Levin, Managing Consultant As Managing Consultant for Innovative Programs for VEIC’s Consulting Division, Emily designs innovative energy efficiency programs. Her team regularly reviews energy efficiency portfolios and recommends enhancements based on best practices. In this role, Emily has worked on market transformation efforts for heat pumps and heat pump water heaters in the Northeast and the Northwest. She has designed and reviewed energy efficiency programs in Florida, Hawaii, Maryland, Michigan, New Jersey, Rhode Island, Vermont, Washington, DC, and Wisconsin. Before joining VEIC Consulting in January 2014, she led residential strategy for Efficiency Vermont, an energy efficiency utility operated by VEIC. She also managed the Efficiency Vermont Home Performance with ENERGY STAR program from 2007-2010.
Elizabeth Palchak, Ph.D., Consultant As a behavioral scientist for VEIC’s Consulting Division, Elizabeth brings behavioral insights to program design, particularly in low-income, multifamily and residential markets. Her PhD work tested the effect of real-time feedback and financial incentives on energy use in off-campus student housing at the University of Vermont (UVM). She leverages qualitative data and design thinking tools to gain customer insights that improve program outcomes and is an experienced facilitator in multi-stakeholder decision-making processes and has supported program design in Vermont, Wisconsin, Tennessee and Washington, DC. Prior to VEIC, she led strategy for sustainable funding mechanisms at UVM and worked as a sustainability director at a nonprofit conservation organization in Jackson, WY. She has deep experience in higher education as an administrator and instructor and is an adjunct professor at UVM and Vermont Law School.
Robert Stephenson, Associate Director, Data and Technical Services Robert Stephenson is the Associate Director for VEIC’s Data & Technical Services Division. In this role he leads the Evaluation, Measurement, and Verification (EM&V) group overseeing strategy work and other activities necessary to mitigate risk for VEIC’s energy efficiency utility performance contracts. He has been instrumental in the design and implementation of tools to support the integration of savings values, calculations, and analysis into VEIC’s energy efficiency program tracking and reporting systems and has also contributed to examinations of equity and impact on underserved communities for VEIC’s programs. Prior to VEIC Robert worked at the Southface Energy Institute as a Research Engineer and various other energy service companies as an engineer and project manager supporting green building certification programs. He is a professional engineer with CEM and M&V certification.
3