equity metrics data initiative -...
TRANSCRIPT
EQUITY METRICS DATA INITIATIVE
Los Angeles City Council Energy, Climate Change and Environmental Justice Committee
August 1, 2017
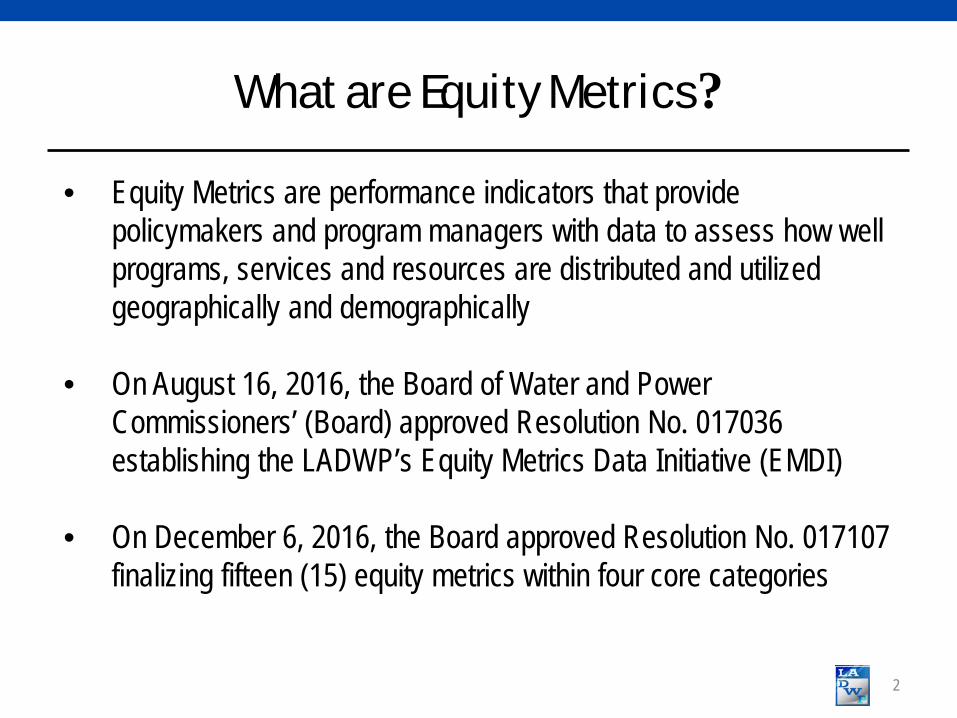
What are Equity Metrics?
• Equity Metrics are performance indicators that provide policymakers and program managers with data to assess how well programs, services and resources are distributed and utilized geographically and demographically
• On August 16, 2016, the Board of Water and Power
Commissioners’ (Board) approved Resolution No. 017036 establishing the LADWP’s Equity Metrics Data Initiative (EMDI)
• On December 6, 2016, the Board approved Resolution No. 017107
finalizing fifteen (15) equity metrics within four core categories
2
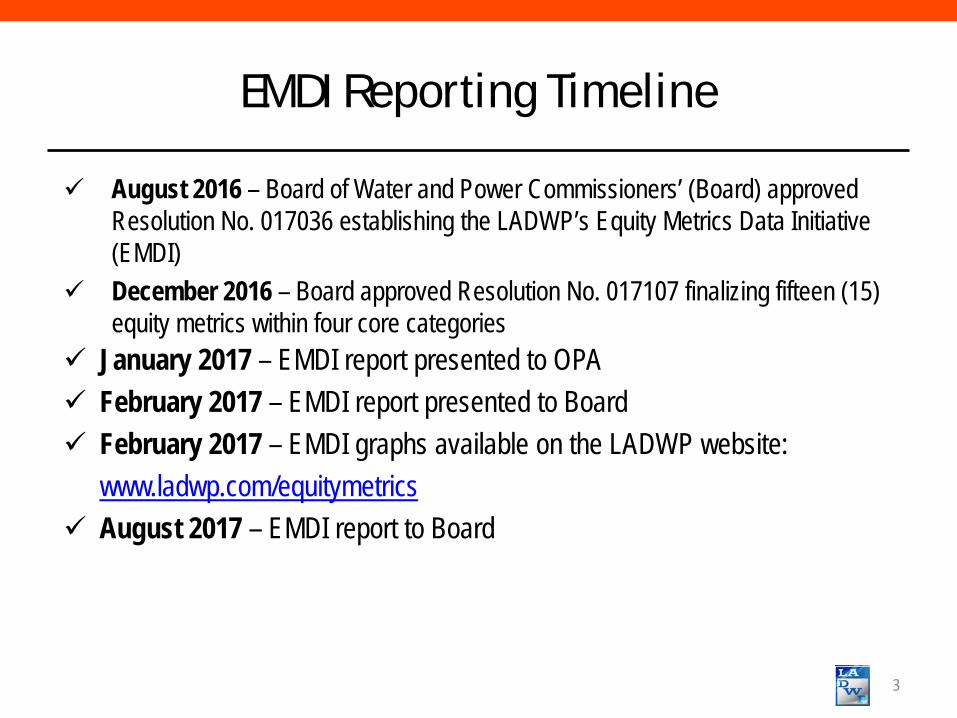
EMDI Reporting Timeline
August 2016 – Board of Water and Power Commissioners’ (Board) approved Resolution No. 017036 establishing the LADWP’s Equity Metrics Data Initiative (EMDI)
December 2016 – Board approved Resolution No. 017107 finalizing fifteen (15) equity metrics within four core categories
January 2017 – EMDI report presented to OPA February 2017 – EMDI report presented to Board February 2017 – EMDI graphs available on the LADWP website:
www.ladwp.com/equitymetrics August 2017 – EMDI report to Board
3
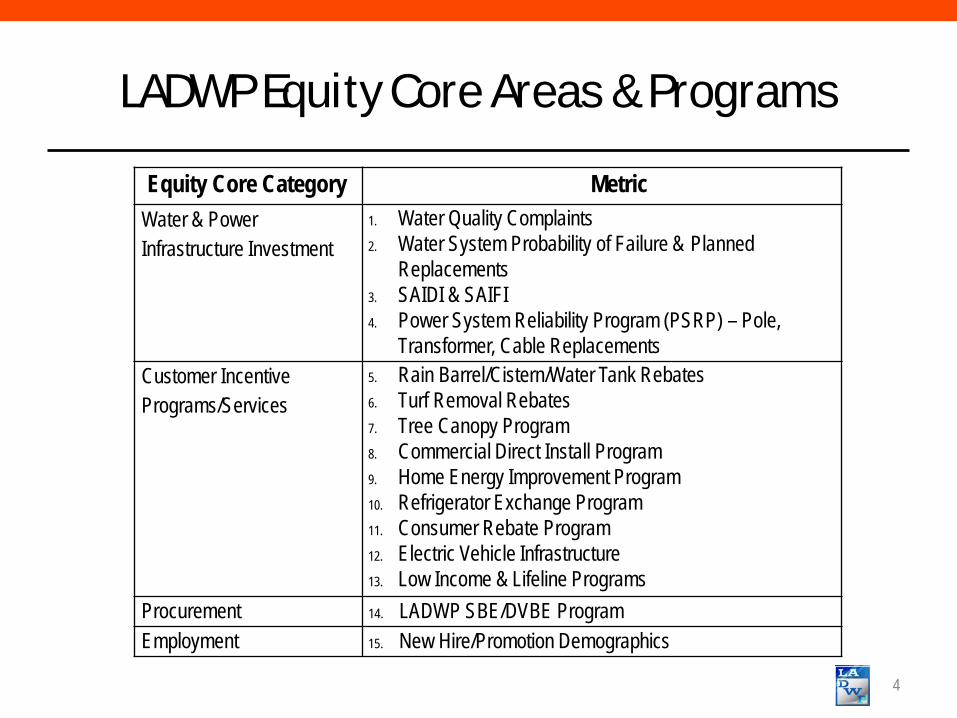
LADWP Equity Core Areas & Programs
4
Equity Core Category Metric Water & Power Infrastructure Investment
1. Water Quality Complaints 2. Water System Probability of Failure & Planned
Replacements 3. SAIDI & SAIFI 4. Power System Reliability Program (PSRP) – Pole,
Transformer, Cable Replacements Customer Incentive Programs/Services
5. Rain Barrel/Cistern/Water Tank Rebates 6. Turf Removal Rebates 7. Tree Canopy Program 8. Commercial Direct Install Program 9. Home Energy Improvement Program 10. Refrigerator Exchange Program 11. Consumer Rebate Program 12. Electric Vehicle Infrastructure 13. Low Income & Lifeline Programs
Procurement 14. LADWP SBE/DVBE Program Employment 15. New Hire/Promotion Demographics
CalEnviroScreen Map
5
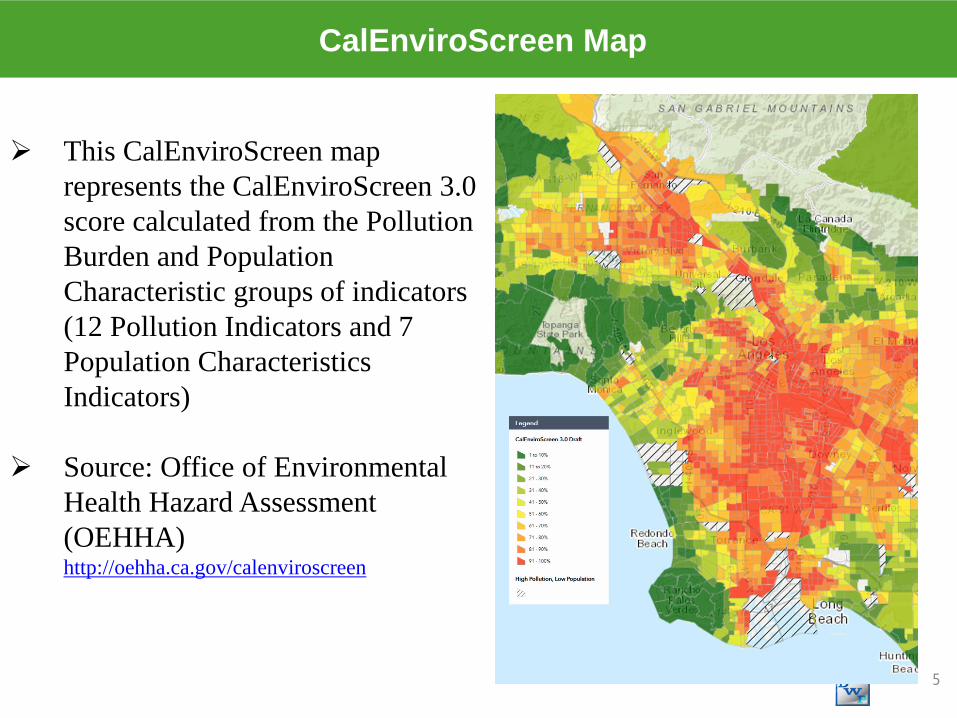
This CalEnviroScreen map represents the CalEnviroScreen 3.0 score calculated from the Pollution Burden and Population Characteristic groups of indicators (12 Pollution Indicators and 7 Population Characteristics Indicators)
Source: Office of Environmental
Health Hazard Assessment (OEHHA) http://oehha.ca.gov/calenviroscreen
CalEnviroScreen Poverty Characteristic Map
6
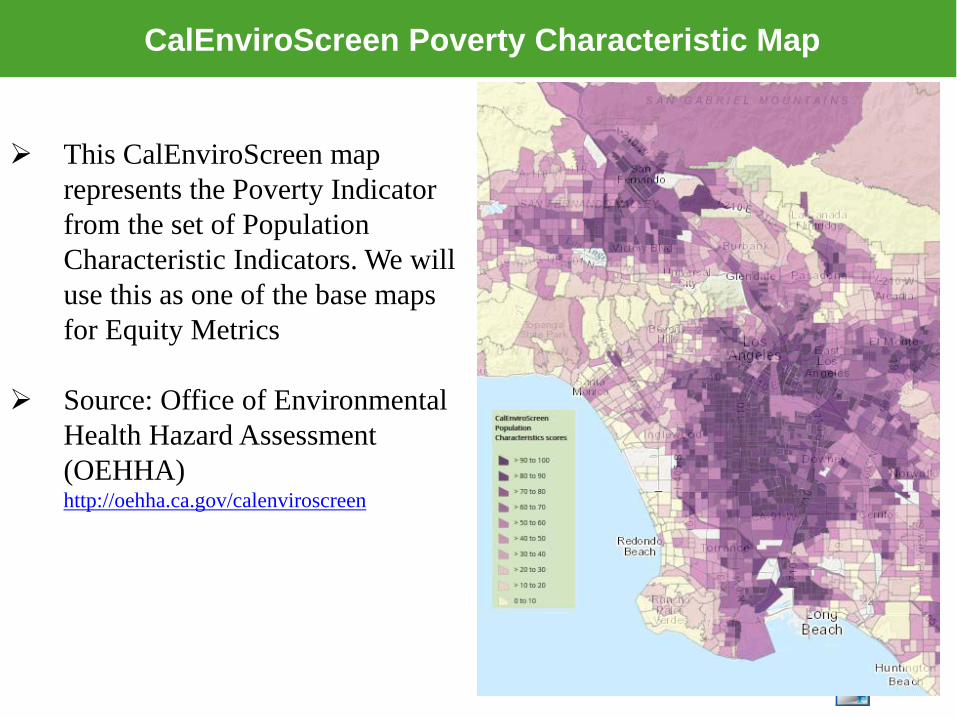
This CalEnviroScreen map
represents the Poverty Indicator from the set of Population Characteristic Indicators. We will use this as one of the base maps for Equity Metrics
Source: Office of Environmental
Health Hazard Assessment (OEHHA) http://oehha.ca.gov/calenviroscreen
Home Energy Improvement Program Cluster Map
7
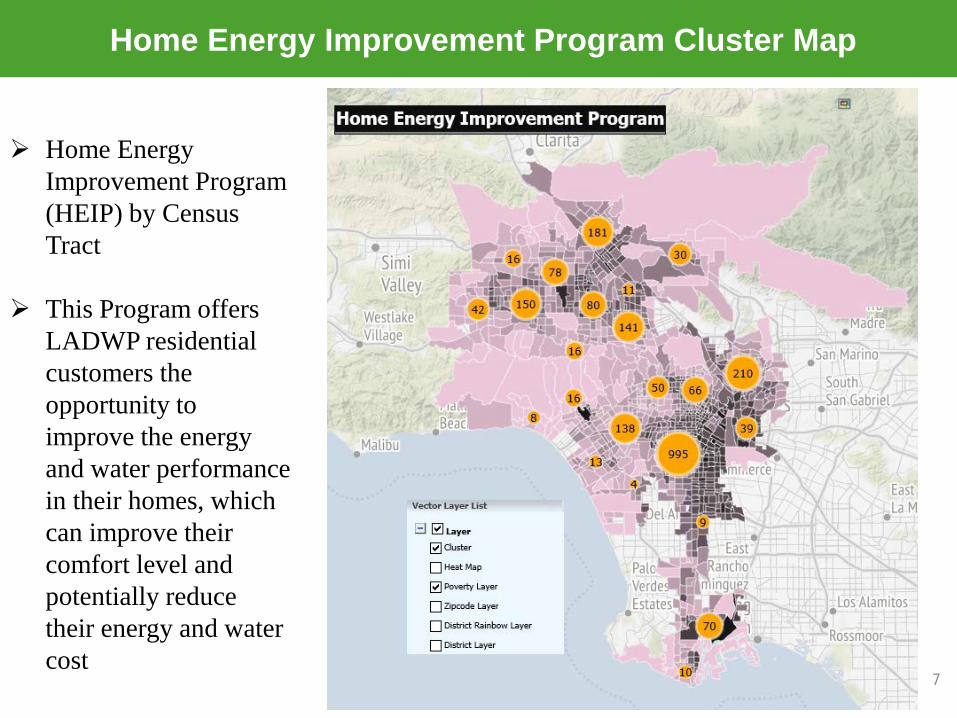
Home Energy Improvement Program (HEIP) by Census Tract
This Program offers LADWP residential customers the opportunity to improve the energy and water performance in their homes, which can improve their comfort level and potentially reduce their energy and water cost
Water Mainline Conditions & Planned Replacement Map
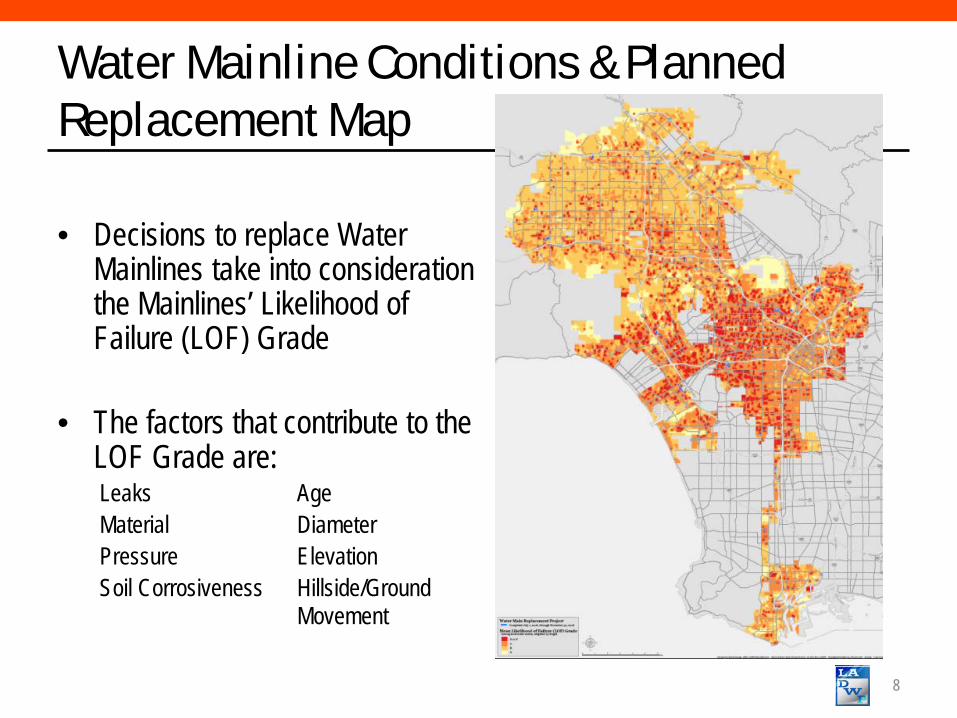
• Decisions to replace Water Mainlines take into consideration the Mainlines’ Likelihood of Failure (LOF) Grade
• The factors that contribute to the LOF Grade are: Leaks Age Material Diameter Pressure Elevation Soil Corrosiveness Hillside/Ground Movement
8
9
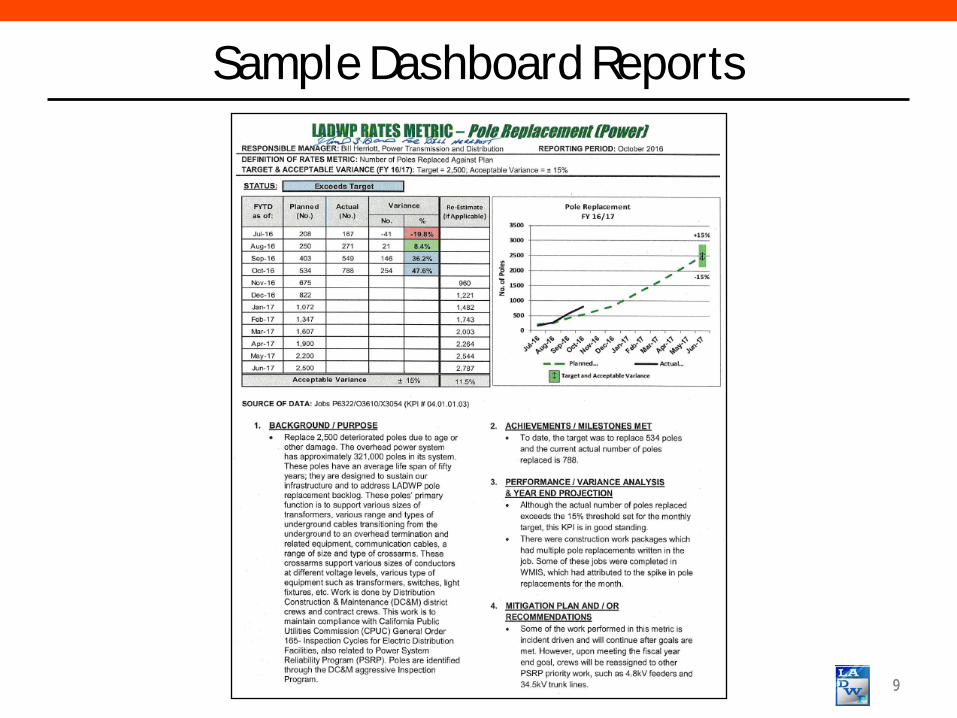
Sample Dashboard Reports
9
Residential Water and Power Reliability Core Area Example - Power Reliability
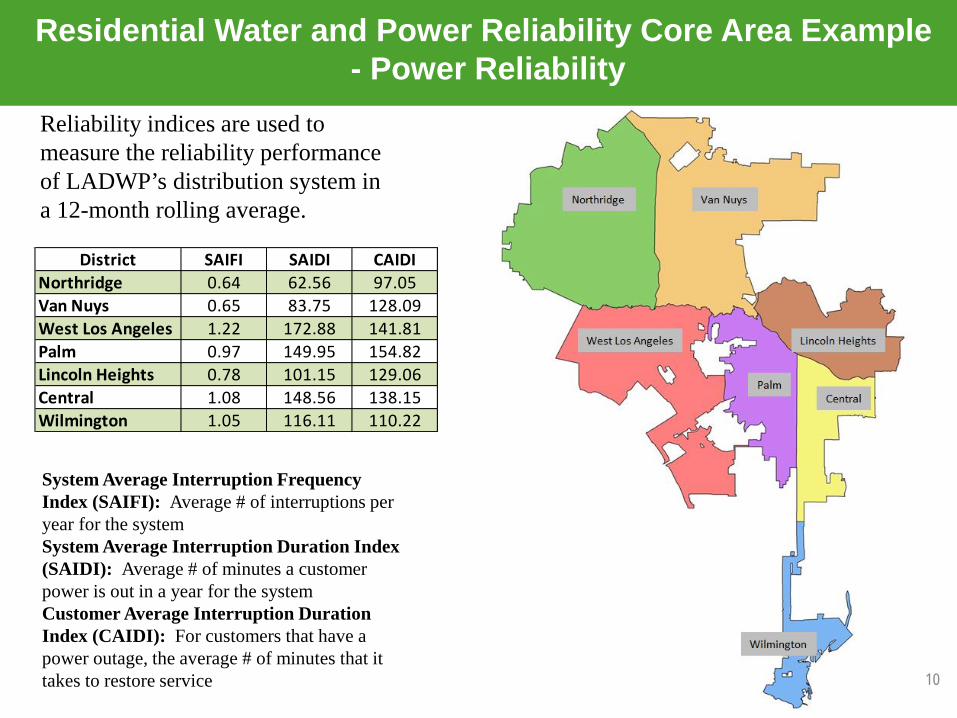
Reliability indices are used to measure the reliability performance of LADWP’s distribution system in a 12-month rolling average.
10
System Average Interruption Frequency Index (SAIFI): Average # of interruptions per year for the system System Average Interruption Duration Index (SAIDI): Average # of minutes a customer power is out in a year for the system Customer Average Interruption Duration Index (CAIDI): For customers that have a power outage, the average # of minutes that it takes to restore service
District SAIFI SAIDI CAIDINorthridge 0.64 62.56 97.05Van Nuys 0.65 83.75 128.09West Los Angeles 1.22 172.88 141.81Palm 0.97 149.95 154.82Lincoln Heights 0.78 101.15 129.06Central 1.08 148.56 138.15Wilmington 1.05 116.11 110.22
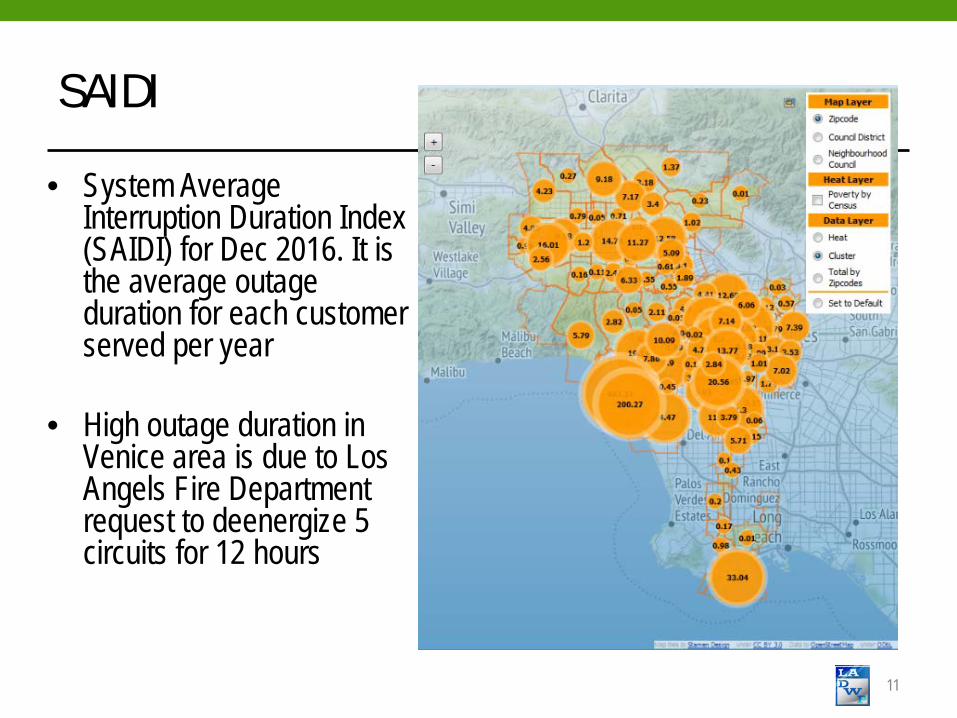
SAIDI • System Average
Interruption Duration Index (SAIDI) for Dec 2016. It is the average outage duration for each customer served per year
• High outage duration in Venice area is due to Los Angels Fire Department request to deenergize 5 circuits for 12 hours
11
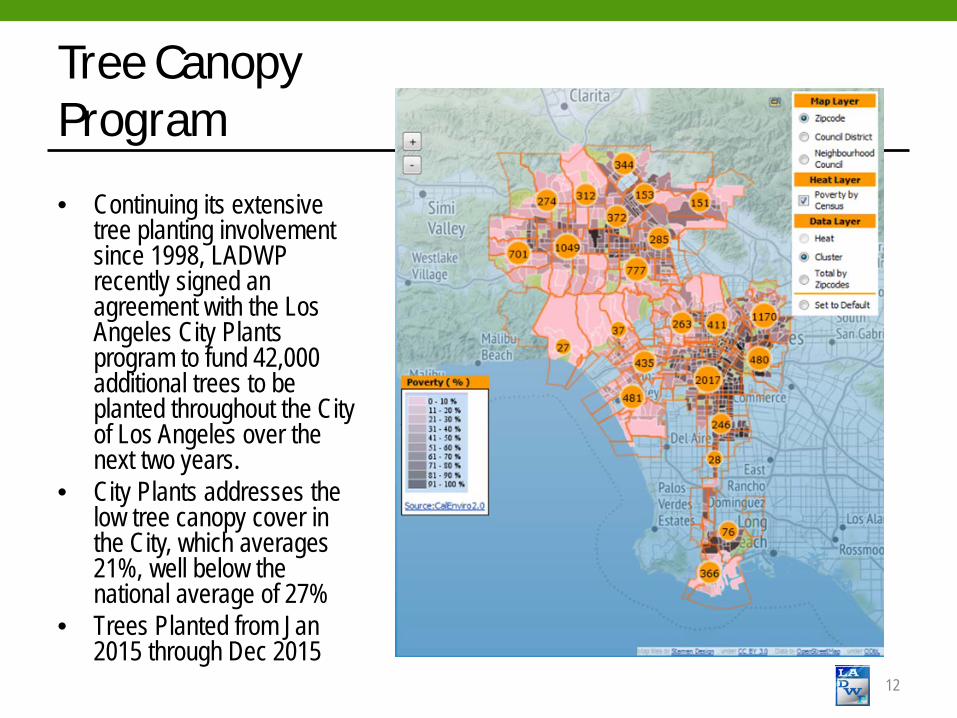
Tree Canopy Program • Continuing its extensive
tree planting involvement since 1998, LADWP recently signed an agreement with the Los Angeles City Plants program to fund 42,000 additional trees to be planted throughout the City of Los Angeles over the next two years.
• City Plants addresses the low tree canopy cover in the City, which averages 21%, well below the national average of 27%
• Trees Planted from Jan 2015 through Dec 2015
12
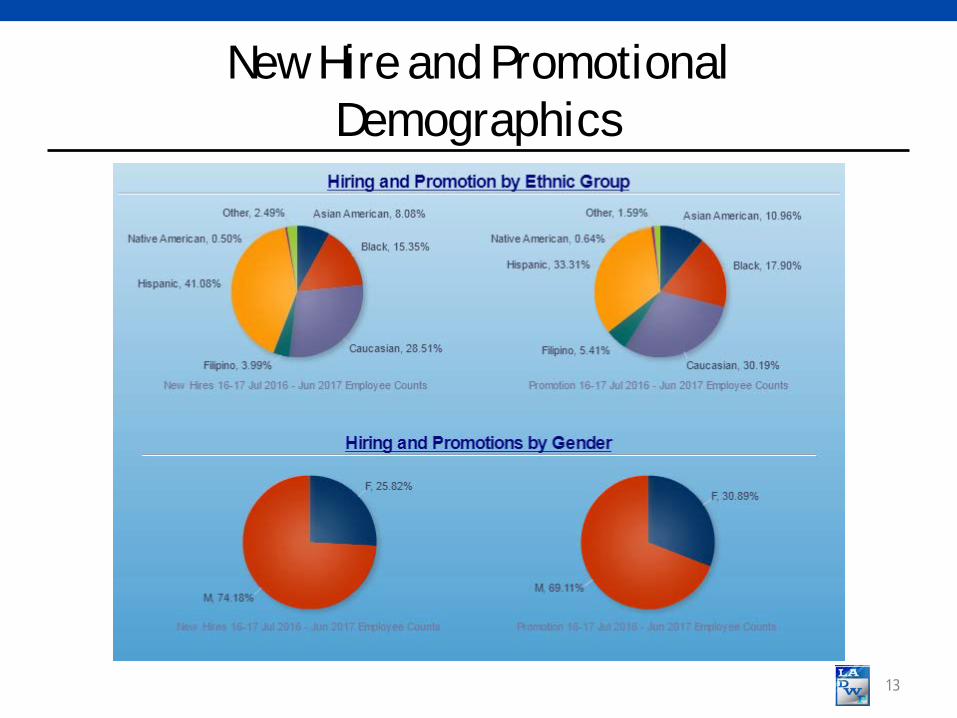
New Hire and Promotional Demographics
13