equity of access to maternal health care in the philippinesmindoro, oriental mindoro, palawan,...
TRANSCRIPT
Equity of Access to Maternal Health Care in the
Philippines
By
Regina Salve Baroma
Submitted to
Central European University
Department of Economics and Business
In partial fulfillment for the requirements for the degree of Master of Arts in
Economic Policy in Global Markets
Supervisor: Peter Mihályi
Budapest, Hungary 2018
CE
UeT
DC
olle
ctio
n

i
Abstract
In many developing countries, achieving inclusive growth is one of the major policy
concerns. In the Philippines, the wide disparity in the use of maternal health care services
among socio-economic groups, is one of the causes that constrained the country in achieving
its Millennium Development Goal (MDG) target in reducing the maternal mortality ratio by
three quarters until 2015. In this thesis, the sources of inequality in the utilization of maternal
health care, specifically in the use of facility-based deliveries were explored using a two-stage
regression procedure. The impacts of supply and demand side policy interventions in reducing
inequality were also illustrated through the Concentration Curve and Concentration Index. The
results show that income, household composition, parity, educational attainment, and health
insurance coverage are among the most important factors. Demand and supply side policy
interventions are both essential in improving the access among poor women and the results
show that their impact can be maximized if both policy interventions are implemented at the
same time.
CE
UeT
DC
olle
ctio
n

ii
Acknowledgements
I would like to express my sincerest gratitude towards my supervisor, Professor Peter
Mihályi for his guidance. I would also like to thank Zsolt Király. I would not have
accomplished this thesis without his patience and support.
CE
UeT
DC
olle
ctio
n

iii
Table of Contents
1. Introduction ..................................................................................................................................... 1
2. Review of Related Literature ........................................................................................................ 11
2.1 The Concept of Inclusiveness ............................................................................................... 11
2.2 Circumstance Factors Affecting Utilization of Maternal Health Care .................................. 12
2.3 Philippine Case Studies ......................................................................................................... 17
3. Methodology ................................................................................................................................. 20
3.1 Empirical Framework ........................................................................................................... 20
3.2 Data ....................................................................................................................................... 23
4. Results and Discussion ................................................................................................................. 29
4.1 Two-Stage Regression Model ............................................................................................... 29
4.2 Concentration Curve and Concentration Index ..................................................................... 34
4.3 Robustness Check ................................................................................................................. 36
4.4 Limitation of the Study ......................................................................................................... 36
5. Conclusion and Policy Proposals .................................................................................................. 38
References ............................................................................................................................................. 40
Appendixes ........................................................................................................................................... 43
CE
UeT
DC
olle
ctio
n

iv
List of Figures
Figure 1: GDP Growth, Poverty and Inequality, 2000-2016 .................................................................. 2
Figure 2: Place of Delivery, 2013 ........................................................................................................... 5
Figure 3: Person Providing Assistance during Delivery, 2013 ............................................................... 6
Figure 4: Distribution of Maternal Health Care Facilities, 2017 ............................................................ 7
Figure 5: Concentration Curve of Facility-Based Deliveries ................................................................ 35
CE
UeT
DC
olle
ctio
n
v
List of Tables
Table 1: Selected MDG Maternal Health Indicators ............................................................................... 4
Table 2: Number of Public Sector Health Professionals (per 100,000 population), 2008 ...................... 9
Table 3: Literature on Determinants of Maternal Health Care in the Philippines ................................ 17
Table 4: Descriptive Statistics of the Individual and Household Variables .......................................... 26
Table 5: Descriptive Statistics of the Ownership Structure at the Community Level .......................... 28
Table 6: Results from the Logit Model (1st Stage) ................................................................................ 32
Table 7: Results from the OLS Model (2nd Stage) ................................................................................ 34
CE
UeT
DC
olle
ctio
n

vi
Abbreviations
ARMM Autonomous Region of Muslim Mindanao
BHFS Bureau of Health Facilities and Services
CALABARZON Calamba, Laguna, Batangas, Rizal, Quezon
CAR Cordillera Administrative Region
CPH Census of Population and Housing
DOH Department of Health
DSWD Department of Social Welfare and Development
GDP Gross Domestic Product
HDI Human Development Index
HMO Health Maintenance Organization
LGU Local Government Unit
MDG Millennium Development Goals
MIMAROPA Marinduque, Occidental Mindoro, Oriental Mindoro, Palawan,
Romblon
NCR National Capital Region
NDHS National Demographic Health Survey
NHTS National Household Targeting System
OLS Ordinary Least Squared
PhilHealth Philippine Health Insurance Corporation
PhP Philippine Peso
PSA Philippine Statistics Authority
SDG Sustainable Development Goals
UN United Nations
USD United States Dollar
CE
UeT
DC
olle
ctio
n

1
1. Introduction
The Philippines is one of the biggest countries in Southeast Asia in terms of population
and land area. It is an archipelago comprised of 7,107 mostly uninhabited islands which are
categorized broadly into three major island groups: Luzon, Visayas and Mindanao and are
further subdivided into 17 regions and 81 provinces (Appendix 1). The population is estimated
at 102 million1.
Only 13% of the population lives in the National Capital Region (NCR)2, the rest is
widely dispersed across the 2,000 inhabited islands. The scattered population over such a wide
expanse of islands is one of the significant constraints in achieving economic and social
development simultaneously. As a result, the economic and human development varies widely
across regions. The NCR having the highest per capita income, has the highest Human
Development Index (HDI) and lowest poverty rate while the Autonomous Region in Muslim
Mindanao (ARMM) lags behind in all metrics. In per capita Gross Domestics Product (GDP)
terms, the difference between the two regions is 17 fold! (Appendix 2). By international
comparison, all regions are sizeable. E.g. in the poorest region of ARMM 3.7 million people
struggle for survival – this is the size of Bosnia and Herzegovina or Puerto Rico.
In many developing countries including the Philippines, achieving inclusive growth3 is
one of the major policy concerns. Despite the remarkable economic growth achieved in the
recent years, with an average of 5.2% GDP growth from 2000 to 2016, poverty rate was only
reduced from 24.9% to 21.6%. Similarly, inequality as measured by the Gini index, barely
1 2015 population projection based on the 2010 Census of Population and Housing (CPH)
conducted by the Philippine Statistics Authority (PSA). Source:
http://psa.gov.ph/statistics/census/projected-population. 2 The National Capital Region (NCR) is commonly known as Metro Manila or simply Manila. 3 The term “inclusive growth” was introduced by the widely disseminated work of Acemoglu
and Robinson’s Why Nations Fail (2012).
CE
UeT
DC
olle
ctio
n
2
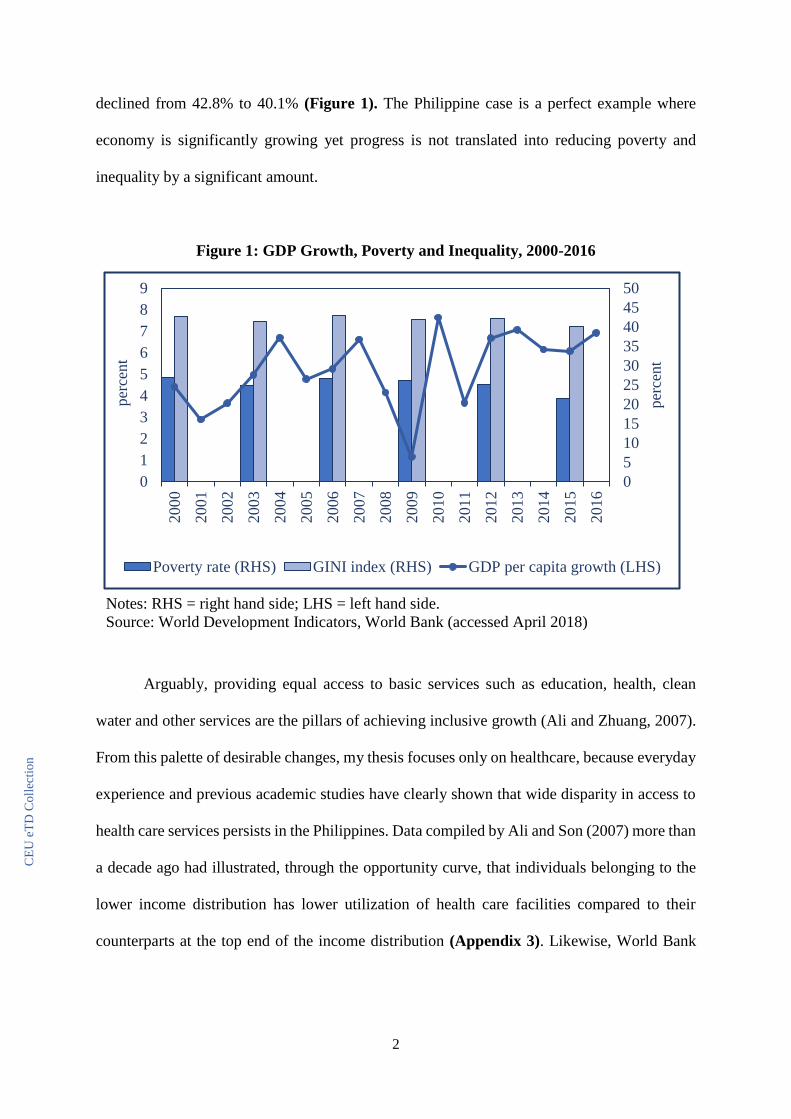
declined from 42.8% to 40.1% (Figure 1). The Philippine case is a perfect example where
economy is significantly growing yet progress is not translated into reducing poverty and
inequality by a significant amount.
Figure 1: GDP Growth, Poverty and Inequality, 2000-2016
Arguably, providing equal access to basic services such as education, health, clean
water and other services are the pillars of achieving inclusive growth (Ali and Zhuang, 2007).
From this palette of desirable changes, my thesis focuses only on healthcare, because everyday
experience and previous academic studies have clearly shown that wide disparity in access to
health care services persists in the Philippines. Data compiled by Ali and Son (2007) more than
a decade ago had illustrated, through the opportunity curve, that individuals belonging to the
lower income distribution has lower utilization of health care facilities compared to their
counterparts at the top end of the income distribution (Appendix 3). Likewise, World Bank
Notes: RHS = right hand side; LHS = left hand side.
Source: World Development Indicators, World Bank (accessed April 2018)
0
5
10
15
20
25
30
35
40
45
50
0
1
2
3
4
5
6
7
8
9
2000
2001
2002
2003
2004
2005
2006
2007
2008
2009
2010
2011
2012
2013
2014
2015
2016
per
cent
per
cent
Poverty rate (RHS) GINI index (RHS) GDP per capita growth (LHS)
CE
UeT
DC
olle
ctio
n

3
(2010) report pointed out that provision of health care services among regions vary widely,
both in terms of quantity and quality.
Under the 1987 Philippine Constitution, the government is mandated to provide
affordable and universal access to basic health care. The government is committed to narrow
the gap in the access to health care services in order to promote improvements in health
outcomes, such as further reductions in child and maternal mortality, prevalence of
malnutrition and the incidence of major diseases (DOH, 2012). In the last three decades,
various reforms were initiated to achieve this objective. Among them was the devolution of the
health service provision function to the Local Government Units (LGU) under the Local
Government Code in 1991. LGU’s were granted autonomy and responsibility with the aim that
it will establish a more effective and efficient provision and management of health care
services, as devolved function of service delivery is expected to result in a more responsive
and accountable local government (Grundy, et. al, 2003). In addition, the National Health
Insurance Act of 1995 was implemented to provide all citizens especially the poor with a health
insurance coverage to ensure equal utilization of health care services (Appendix 4).
Despite these efforts, some of the health outcomes, such as maternal health remain to
be meager. The Millennium Development Goal (MDG) target in reducing the maternal
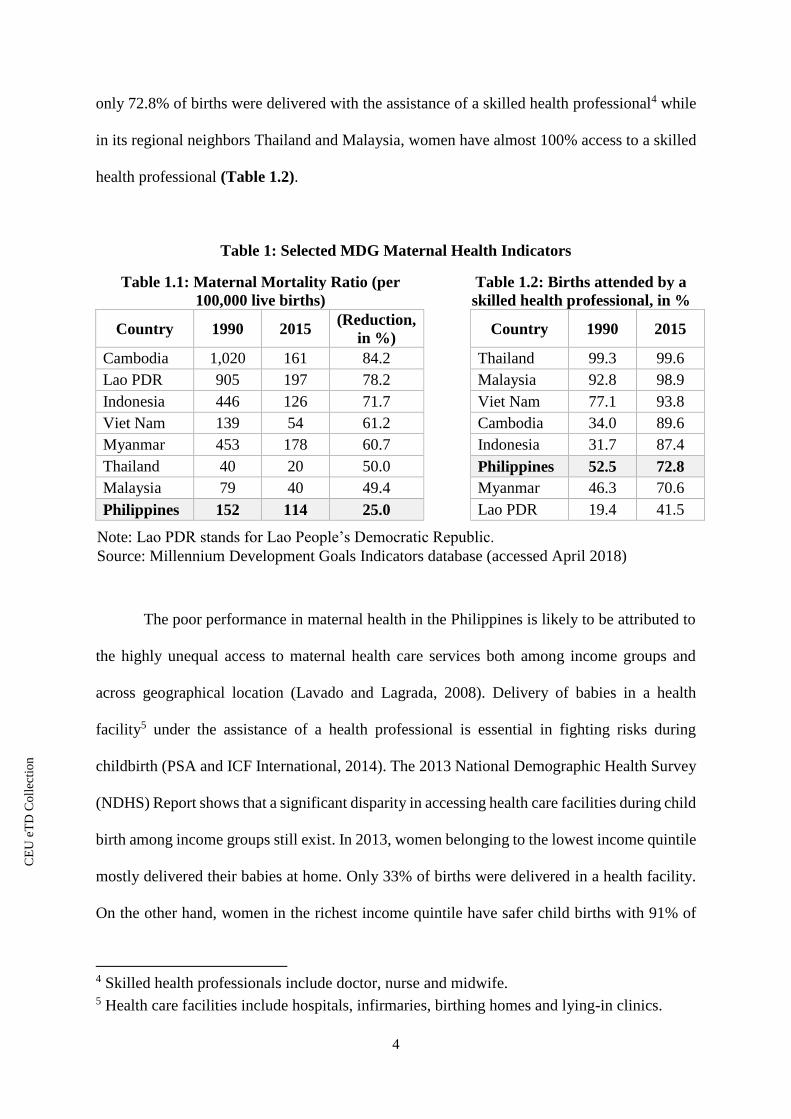
mortality ratio by three quarters between 1990 and 2015 was not achieved. Table 1.1 shows
that maternal mortality ratio in the Philippines was only reduced by 25%, from a 152 deaths
per 100,000 live births in 1990 to 114 deaths per 100,000 live births in 2015. This level is still
high considering the level of economic growth the country has achieved in the last decade.
Even though, Philippines is not the only country not to have achieved this target compared to
its middle income neighbors in Southeast Asia (only Cambodia and Lao PDR reached it), the
country’s performance is the poorest in reducing maternal mortality. In terms of achieving
universal access to reproductive health, Philippines also failed in achieving its target. In 2015,
CE
UeT
DC
olle
ctio
n
4
Note: Lao PDR stands for Lao People’s Democratic Republic.
Source: Millennium Development Goals Indicators database (accessed April 2018)
only 72.8% of births were delivered with the assistance of a skilled health professional4 while
in its regional neighbors Thailand and Malaysia, women have almost 100% access to a skilled
health professional (Table 1.2).
Table 1: Selected MDG Maternal Health Indicators
Table 1.1: Maternal Mortality Ratio (per
100,000 live births)
Table 1.2: Births attended by a
skilled health professional, in %
Country 1990 2015 (Reduction,
in %)
Country 1990 2015
Cambodia 1,020 161 84.2 Thailand 99.3 99.6
Lao PDR 905 197 78.2 Malaysia 92.8 98.9
Indonesia 446 126 71.7 Viet Nam 77.1 93.8
Viet Nam 139 54 61.2 Cambodia 34.0 89.6
Myanmar 453 178 60.7 Indonesia 31.7 87.4
Thailand 40 20 50.0 Philippines 52.5 72.8
Malaysia 79 40 49.4 Myanmar 46.3 70.6
Philippines 152 114 25.0 Lao PDR 19.4 41.5
The poor performance in maternal health in the Philippines is likely to be attributed to
the highly unequal access to maternal health care services both among income groups and
across geographical location (Lavado and Lagrada, 2008). Delivery of babies in a health
facility5 under the assistance of a health professional is essential in fighting risks during
childbirth (PSA and ICF International, 2014). The 2013 National Demographic Health Survey
(NDHS) Report shows that a significant disparity in accessing health care facilities during child
birth among income groups still exist. In 2013, women belonging to the lowest income quintile
mostly delivered their babies at home. Only 33% of births were delivered in a health facility.
On the other hand, women in the richest income quintile have safer child births with 91% of
4 Skilled health professionals include doctor, nurse and midwife. 5 Health care facilities include hospitals, infirmaries, birthing homes and lying-in clinics.
CE
UeT
DC
olle
ctio
n
5
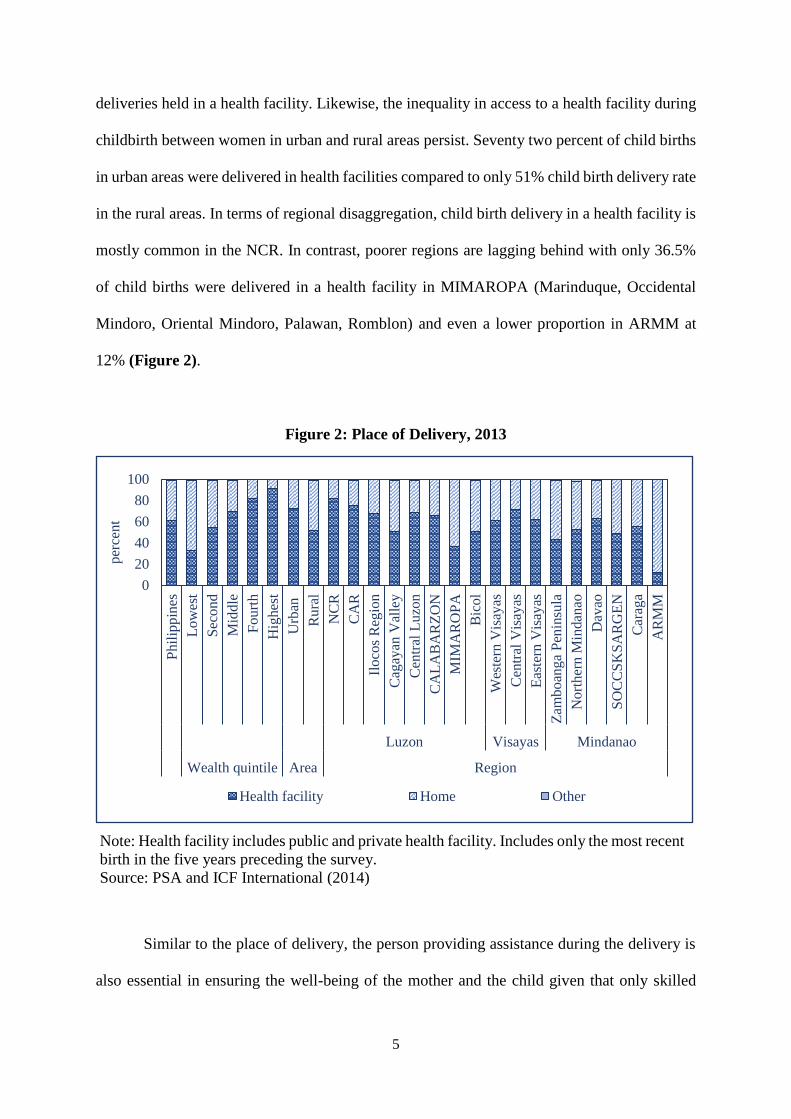
deliveries held in a health facility. Likewise, the inequality in access to a health facility during
childbirth between women in urban and rural areas persist. Seventy two percent of child births
in urban areas were delivered in health facilities compared to only 51% child birth delivery rate
in the rural areas. In terms of regional disaggregation, child birth delivery in a health facility is
mostly common in the NCR. In contrast, poorer regions are lagging behind with only 36.5%
of child births were delivered in a health facility in MIMAROPA (Marinduque, Occidental
Mindoro, Oriental Mindoro, Palawan, Romblon) and even a lower proportion in ARMM at
12% (Figure 2).
Figure 2: Place of Delivery, 2013
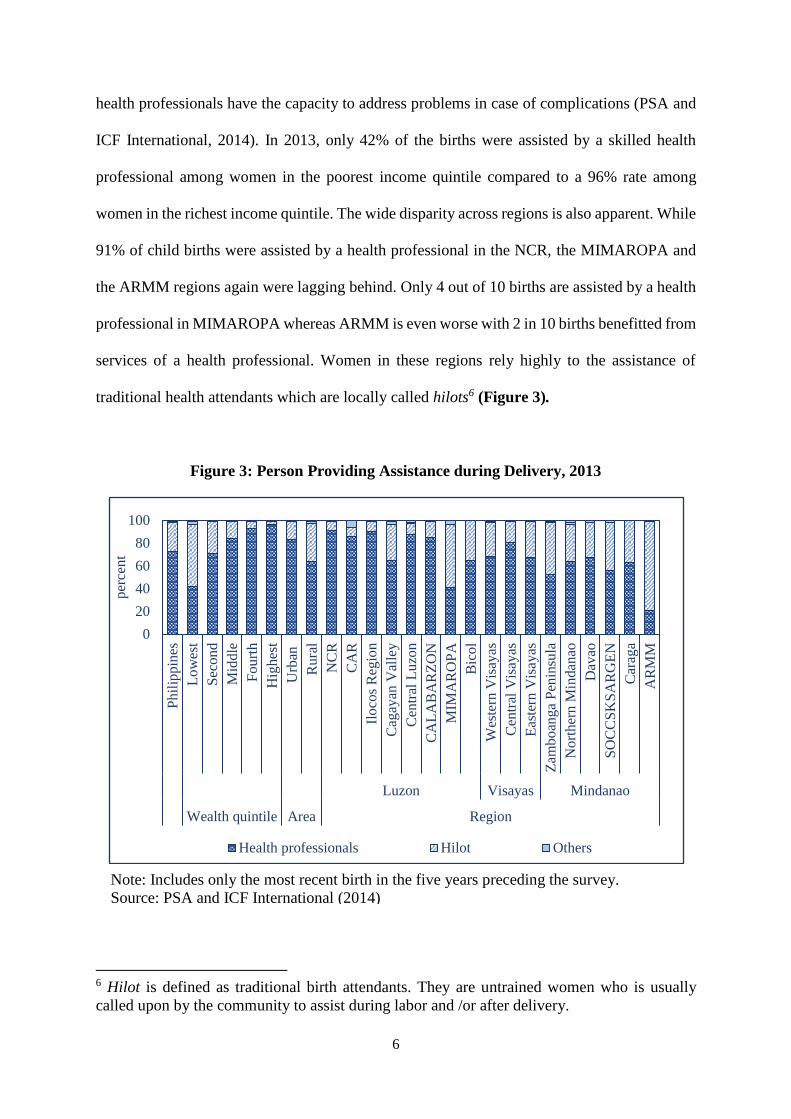
Similar to the place of delivery, the person providing assistance during the delivery is
also essential in ensuring the well-being of the mother and the child given that only skilled
0
20
40
60
80
100
Phil
ipp
ines
Lo
wes
t
Sec
ond
Mid
dle
Fourt
h
Hig
hes
t
Urb
an
Rura
l
NC
R
CA
R
Iloco
s R
egio
n
Cag
ayan
Val
ley
Cen
tral
Luzo
n
CA
LA
BA
RZ
ON
MIM
AR
OP
A
Bic
ol
Wes
tern
Vis
ayas
Cen
tral
Vis
ayas
Eas
tern
Vis
ayas
Zam
boan
ga
Pen
insu
la
Nort
her
n M
indan
ao
Dav
ao
SO
CC
SK
SA
RG
EN
Car
aga
AR
MM
Luzon Visayas Mindanao
Wealth quintile Area Region
per
cent
Health facility Home Other
Note: Health facility includes public and private health facility. Includes only the most recent
birth in the five years preceding the survey.
Source: PSA and ICF International (2014)
CE
UeT
DC
olle
ctio
n
6
health professionals have the capacity to address problems in case of complications (PSA and
ICF International, 2014). In 2013, only 42% of the births were assisted by a skilled health
professional among women in the poorest income quintile compared to a 96% rate among
women in the richest income quintile. The wide disparity across regions is also apparent. While
91% of child births were assisted by a health professional in the NCR, the MIMAROPA and
the ARMM regions again were lagging behind. Only 4 out of 10 births are assisted by a health
professional in MIMAROPA whereas ARMM is even worse with 2 in 10 births benefitted from
services of a health professional. Women in these regions rely highly to the assistance of
traditional health attendants which are locally called hilots6 (Figure 3).
Figure 3: Person Providing Assistance during Delivery, 2013
6 Hilot is defined as traditional birth attendants. They are untrained women who is usually
called upon by the community to assist during labor and /or after delivery.
0
20
40
60
80
100
Phil
ippin
es
Low
est
Sec
on
d
Mid
dle
Fourt
h
Hig
hes
t
Urb
an
Rura
l
NC
R
CA
R
Iloco
s R
egio
n
Cag
ayan
Val
ley
Cen
tral
Luzo
n
CA
LA
BA
RZ
ON
MIM
AR
OP
A
Bic
ol
Wes
tern
Vis
ayas
Cen
tral
Vis
ayas
Eas
tern
Vis
ayas
Zam
boan
ga
Pen
insu
la
No
rth
ern
Min
dan
ao
Dav
ao
SO
CC
SK
SA
RG
EN
Car
aga
AR
MM
Luzon Visayas Mindanao
Wealth quintile Area Region
per
cent
Health professionals Hilot Others
Note: Includes only the most recent birth in the five years preceding the survey.
Source: PSA and ICF International (2014)
)
CE
UeT
DC
olle
ctio
n
7
Prenatal and postnatal care are also important components of maternal health care.
Prenatal care helps diagnose early pregnancy-related problems while postnatal care prevents
after birth complications. In terms of prenatal and postnatal care use, inequality is also evident.
In NCR, 98.5% of women received prenatal care while ARMM has the lowest proportion at
65%. Similarly, 93% of women in NCR have at least one postnatal visit whereas only 23% of
women in ARMM visited a health facility for postnatal care (PSA and ICF International, 2014).
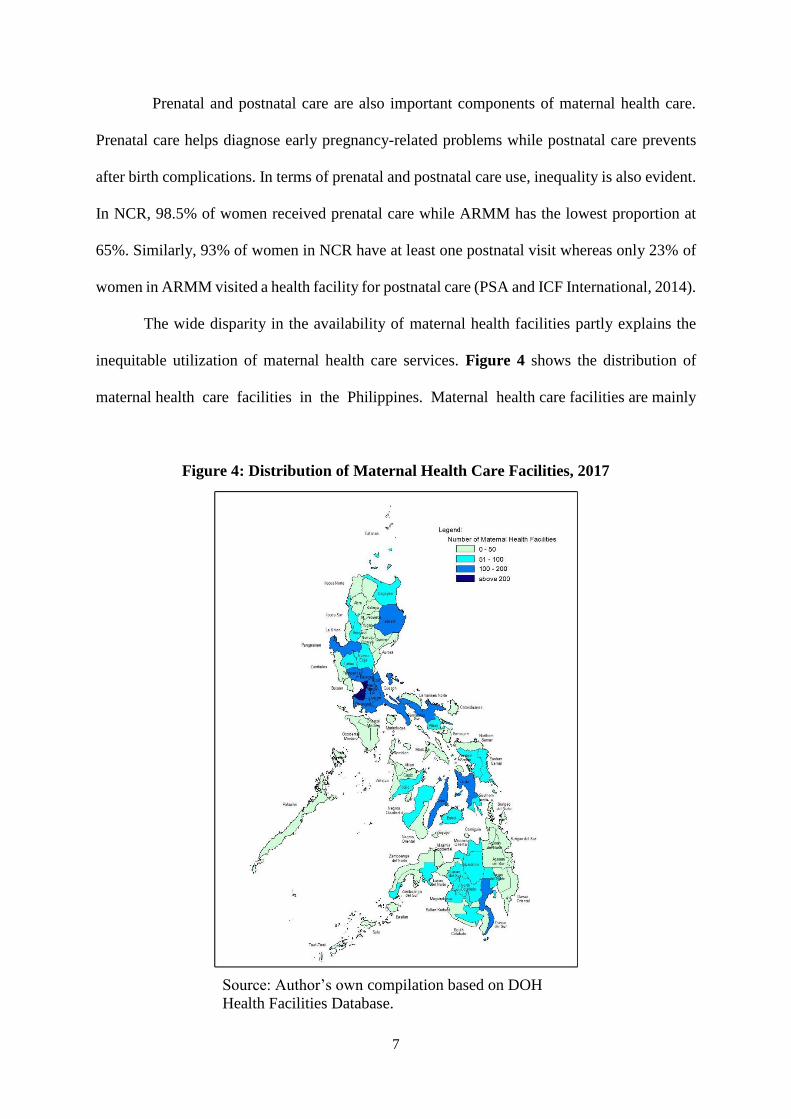
The wide disparity in the availability of maternal health facilities partly explains the
inequitable utilization of maternal health care services. Figure 4 shows the distribution of
maternal health care facilities in the Philippines. Maternal health care facilities are mainly
Figure 4: Distribution of Maternal Health Care Facilities, 2017
Source: Author’s own compilation based on DOH
Health Facilities Database.
CE
UeT
DC
olle
ctio
n

8
concentrated in the richer regions ⸺ NCR and its adjacent regions, Central Luzon and
CALABARZON (Calamba, Laguna, Batangas, Rizal, Quezon), as well as in Cebu and Davao
del Sur which are the key provinces in the Visayas and Mindanao. On the other hand, maternal
health facilities are scarce in MIMAROPA and ARMM. It has been previously established that
utilization of maternal health care has been low in these regions. On average, the closest
maternal health care facility of residents in NCR is less than 2 kilometers away, while in
MIMAROPA and ARMM, hospitals are farther away from their residences by 5 kilometers or
more7.
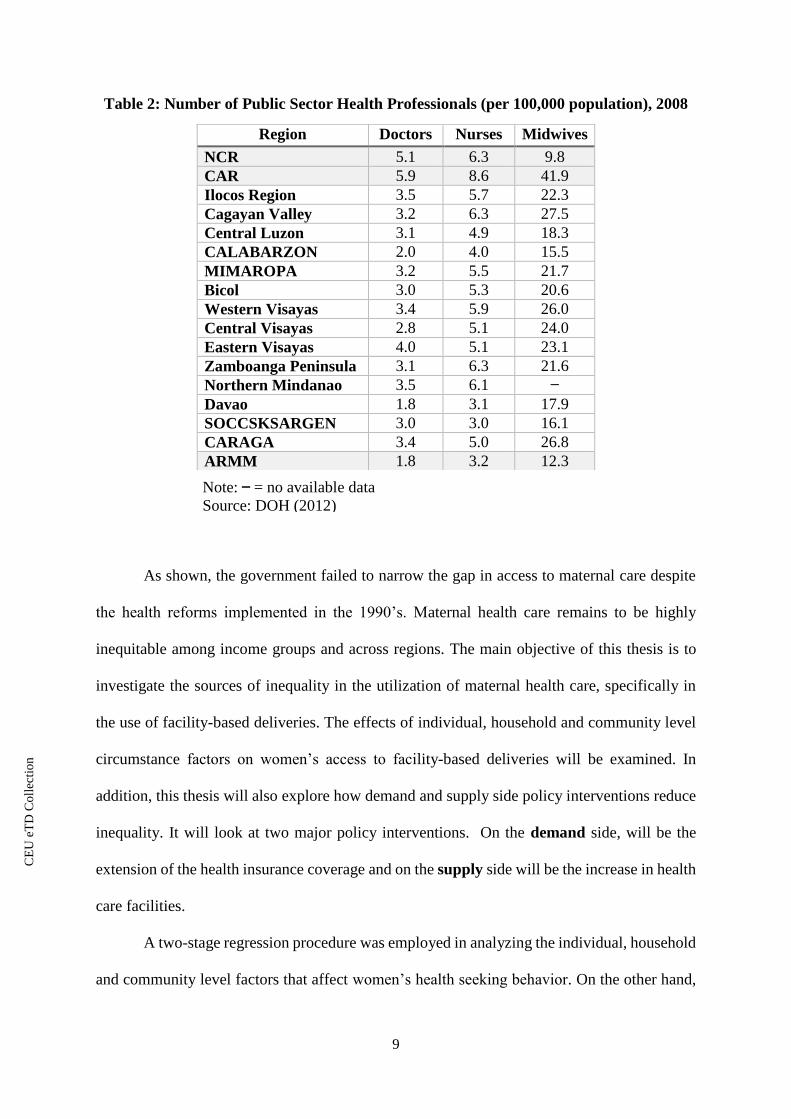
Similarly, health professionals are also unevenly distributed. Absence of doctors and
nurses in hard to reach rural areas is typical. Table 2 shows that the NCR and CAR (Cordillera
Administrative Region) has 5.1 and 5.9 public physicians per 100,000 population while
ARMM has only 1.8. The same trend can be observed in terms of nurses with NCR and CAR
leading with 6.3 and 8.6 public nurses per 100,000 population while ARMM has only 3.2.
Similarly, CAR has 41.9 midwives per 100,000 population and ARMM has only 12.3.
In terms of health insurance coverage, ARMM is also lagging. The result of the 2013
NDHS shows that while overall health insurance coverage, which includes maternal care and
newborn package (Appendix 5), remains to be low at 63%, coverage rate is even lower in
ARMM with 56% of the population are not covered by any health insurance provider8.
7 In the census, the exact distance in kilometers (kms) was not asked. Instead, the respondents
were asked to select from three categories: (1) 2 kms or less; (2) more than 2 kms but less than
5 kms; and (3) 5 kms or more. The gap in the distance may be more apparent had the exact
distance in kms was asked. Source: Author’s own calculation based on the 2010 CPH,
Barangay Schedule. 8 Both public and private health insurance providers are available in the Philippines. The public
provider is the Philippine Health Insurance Corporation (PhilHealth) where all regularly
employed individuals are covered, as required by the law. Most of the private companies avail
additional health insurance from private providers, called Health Maintenance Organizations
(HMO), to supplement the public health insurance coverage. Some of the self-employed
individuals purchase health insurance plans from HMO’s.
CE
UeT
DC
olle
ctio
n
9
Note: = no available data
Source: DOH (2012)
Table 2: Number of Public Sector Health Professionals (per 100,000 population), 2008
As shown, the government failed to narrow the gap in access to maternal care despite
the health reforms implemented in the 1990’s. Maternal health care remains to be highly
inequitable among income groups and across regions. The main objective of this thesis is to
investigate the sources of inequality in the utilization of maternal health care, specifically in
the use of facility-based deliveries. The effects of individual, household and community level
circumstance factors on women’s access to facility-based deliveries will be examined. In
addition, this thesis will also explore how demand and supply side policy interventions reduce
inequality. It will look at two major policy interventions. On the demand side, will be the
extension of the health insurance coverage and on the supply side will be the increase in health
care facilities.
A two-stage regression procedure was employed in analyzing the individual, household
and community level factors that affect women’s health seeking behavior. On the other hand,
Region Doctors Nurses Midwives
NCR 5.1 6.3 9.8
CAR 5.9 8.6 41.9
Ilocos Region 3.5 5.7 22.3
Cagayan Valley 3.2 6.3 27.5
Central Luzon 3.1 4.9 18.3
CALABARZON 2.0 4.0 15.5
MIMAROPA 3.2 5.5 21.7
Bicol 3.0 5.3 20.6
Western Visayas 3.4 5.9 26.0
Central Visayas 2.8 5.1 24.0
Eastern Visayas 4.0 5.1 23.1
Zamboanga Peninsula 3.1 6.3 21.6
Northern Mindanao 3.5 6.1
Davao 1.8 3.1 17.9
SOCCSKSARGEN 3.0 3.0 16.1
CARAGA 3.4 5.0 26.8
ARMM 1.8 3.2 12.3
CE
UeT
DC
olle
ctio
n
10
the impacts of supply and demand side policy interventions in reducing inequality were
illustrated using the Concentration Curve and Concentration Index. The results show that
income, household composition, parity, educational attainment, and health insurance coverage
are among the most important factors. Demand and supply side policy interventions are both
essential in improving the access among the poor women and the results show that their impact
can be maximized if both policy interventions are implemented at the same time.
This thesis is structured as follows. Chapter 2 reviews the related literature in measuring
inequality in access to maternal health care, as well as the literature on the determinants of
access to maternal health care. The methodology which includes the description of the
empirical framework and the data used in analyzing women’s health seeking behavior is
presented in Chapter 3. Chapter 4 reports the major findings of the empirical analysis and
Chapter 5 concludes and offers the policy proposal.
CE
UeT
DC
olle
ctio
n
11
2. Review of Related Literature
2.1 The Concept of Inclusiveness
To date, the concept of inclusive growth is not formally defined. However, according
to the various development policy statements, growth is considered to be inclusive if all the
members of the society have an equal access to the opportunities created by economic growth,
regardless of their circumstance. When a segment of the population is excluded to access this
opportunity, the growth process might turn out to be not inclusive and thus unsustainable in the
long run (Ali and Zhuang, 2007).
Ali and Son (2007) propose a method to define and measure inclusive growth through
the Social Opportunity Function. Growth is defined to be inclusive if it increases the Social
Opportunity Function, which depends on two factors: (i) average opportunities available to the
population, and (ii) how opportunities are shared among the population. This is illustrated
through the Opportunity Curve which plots the distribution of access to opportunities of a
particular service. A downward sloping opportunity curve suggests that there are more
opportunities available to the poor than to the non-poor, while in contrast, an upward sloping
opportunity curve implies that the non-poor benefits more from the opportunities available in
the society. This concept was applied to the access to health services in the Philippines for the
years 1998 and 2004. The result shows that access to health services favors the rich (Appendix
3).
Meanwhile, O’Donnel, et. al. (2008) recommends a method in measuring the inequality
in access to health care through the Concentration Curve and Concentration Index. The
Concentration Curve provides a picture of how access to health services differs across income
groups. It illustrates the cumulative share of access to health services against the cumulative
share of individuals ranked according to their living standard (i.e. lowest income to highest
income). If the Concentration Curve lies above the line of equality (45 degree line), it implies
CE
UeT
DC
olle
ctio
n

12
that the inequality in health care is pro-poor while it is pro-rich if the curve lies below the line
of equality. Nevertheless, if the Concentration Curve lies along the line of equality then it infers
that health care can be accessed equally by all members of the society. The Concentration Index
on the other hand, quantifies the magnitude of the inequality. It is measured as twice the area
between the Concentration Curve and the line of equality. A negative Concentration Index
suggests a pro-poor inequality, a positive value implies a pro-rich inequality and an index equal
to zero indicate the absence of inequality. Paredes (2018) plotted the Concentration Curves and
calculated the Concentration Indexes of access to prenatal care, caesarian section deliveries
and facility-based deliveries in the Philippines for the years 2008 and 2013 (Appendix 6). The
results show that while there is an improvement in the utilization of maternal health care
services from 2008 to 2013, usage is still highly concentrated among the rich.
The sources of inequality in access to opportunities, according to Roemer (2006),
results from the individual’s circumstance factors, individual’s effort or both. Circumstance
factors are aspects which an individual has no control. For instance, a woman’s access to
maternal health services may be limited due to her ethnicity, religion, or to the availability of
maternal health facilities in the area of her place of residence. Roemer (2006) suggests that as
the individual has no control of these circumstance factors, it should be resolved by a
government policy intervention. Thus, a successful inclusive growth policy includes strategies
that eliminate inequality that is due to circumstance factors and the inequality that remains
would only be due to the differences in individual’s effort.
2.2 Circumstance Factors Affecting Utilization of Maternal Health Care
Providing equal access to health which includes maternal care is one of the pillars of
inclusive growth. Maternal health care pertains to health of women during pregnancy, delivery
of the child and postnatal period. It is an important dimension of health, as the well-being of
mothers have a direct link to the health of the next generation (UN, 2009).
CE
UeT
DC
olle
ctio
n
13
The developing countries who have signed up to the MDG and now to the Sustainable
Development Goals (SDG), have continuously implemented various strategies in order to
achieve the targets in improving maternal health. These efforts have resulted in a remarkable
progress in the use of maternal health care and reduction of maternal mortalities at the
aggregate (nation-wide) level.9. At the same time, however, these achievements mask an
extensive inequality in the utilization of maternal health care services among socio-economic
and geographic location groups within a country (Hill et. al., 2007).
This inequality in access to maternal care among groups may be attributed to the
interplay of various circumstance factors. Alcock et. al. (2015) theorize that women follow a
complex process in their decision to utilize maternal health care services, depending on the
availability of health facilities, their economic capacity and their ability to employ their social
resources.
Sufficient and equally distributed maternal health care services with adequate
skilled health professionals is a key element in equal access to maternal health care. Lipton
(1977) argues that in many developing countries, provision of basic public services are usually
skewed in urban areas. For instance, health facilities and skilled health professionals are highly
concentrated in urban areas, leaving the population in the rural areas with limited health care
options. Heaton and Forste (2003) claim that limited number of health care facilities results in
a lower take up of maternal care. This is supported by the study conducted in Bangladesh where
results have showed that the long distance to the health facility limits its use (Anwar et. al.,
2004). Likewise, in rural areas in Tanzania, 84% of women who delivered their children at
home wanted to give birth in a health facility but was constrained by the distance and poor
9 Global births assisted by a skilled health professional increase substantially from 59% in 1990
to 71% in 2014. Subsequently, maternal mortality ratio declined by 45% worldwide (UN,
2015).
CE
UeT
DC
olle
ctio
n
14
transportation (Bicego et. al., 1997). Consequently, Gage (2007) suggests that an additional
maternal health care facility increases the utilization of maternal health care services. This is
not by chance, of course. In the case of skilled health professionals ⸺ doctors, nurses and
qualified people in general are following their own self-interests. Living and working in the
richer part of the country is far more attractive than moving into one of the poor regions. In a
democratic society, it is very difficult to incentivize the trained specialists to act against their
own interests. Furthermore, the experience of several countries show that if in a developing
country the government tries to use force and/or pressure to send people somewhere against
their wish, these specialist might choose to leave the country for good.
Moreover, the quality of maternal care facilities in place also matter. The lack of
confidence in the public health care system creates segmentation between the rich and the poor.
A study conducted in the Philippines by the Asian Development Bank (2007) shows that higher
income individuals prefer to use private health facilities as they are perceived to provide better
quality services. On the other hand, the population in the lower income groups who cannot
afford the high fees charged by private health providers are left with no option but to use public
health facilities, which are considered to have low quality.
Together with the delivery strategies of maternal health facilities, women’s maternal
health care seeking behavior is determined by their demographic and socio-economic
characteristics (Phillips et. al., 1998). Results from the previous studies have shown that the
interlinkage of myriad of circumstance factors, such as income, educational background, age,
culture, religion etc., have significant association on women’s decision to utilize maternal
health care services.
Income is found to be a major determinant in the uptake of maternal care services.
Income is needed to cover maternal health care cost as about 25% of countries worldwide still
CE
UeT
DC
olle
ctio
n

15
fail to provide free health care10. Also, even in countries that provide universal health care,
women are still exposed to out-of-pocket expenses, which may include transportation cost,
medicine, etc. Studies have shown that women at the top end of the income distribution are
more likely to have prenatal care, facility-based deliveries and postnatal care. Women in the
highest income quintile in Nigeria use health facility seven times more than their counterparts
in the lowest end of the income distribution (Ononokpono and Odimegwu, 2014) while in
Cambodia, women in the richest households utilize facility-based deliveries twelve times more
than the women in the poorest households (Chomat et. al., 2011).
Likewise, health insurance coverage increases the uptake of maternal care services.
Health insurance mitigates the out-of-pocket expenditures and catastrophic payments (Lagarde
and Palmer, 2011). Kibusi et. al. (2018) showed that women covered by a health insurance are
more likely to receive prenatal care and deliver their babies with the assistance from a skilled
health worker. Similarly, a study on the utilization of maternal care in Indonesia, Ghana and
Rwanda showed that health insurance has a positive impact on utilization of maternal care
although the effect is more apparent in the uptake of facility-based delivery than use of prenatal
care (Wang et. al., 2017). On the other hand, Gajate-Garrido and Ahiadeke (2015) find that
health insurance did not increase the quantity of prenatal and postnatal visits but rather it
encouraged women to seek for higher quality of maternal care services.
Correspondingly, women’s educational attainment also plays an important role in the
use of maternal health services. Women’s formal education has a strong correlation with
maternal health literacy. Thus, women with higher educational attainments are more likely to
utilize maternal care services (Anwar et. al., 2004; Alcock et. al., 2015; Greenaway et. al.,
2012; Goli et. al., 2017; Hossain, 2010). Similarly, the partner’s educational attainment
10 Source: The 2018 STC Health Index. http://globalresidenceindex.com/hnwi-index/health-
index/.
CE
UeT
DC
olle
ctio
n

16
augments the woman’s maternal care seeking behavior. The result from the cross-country study
conducted by Adjiwanou et. al. (2017) in Sub-Saharan Africa and Asia reports that women
with educated partners are 43% more likely to have at least four prenatal visits and 55% more
likely to give birth with the assistance of a skilled health professional compared to women with
uneducated spouses.
Women’s age and parity11 are also found to determine the use of maternal health
facilities. Women’s age appeared to have a positive effect while in contrast, parity have a
negative effect in the utilization of maternal care services (Alcock et. al., 2015; Anwar et. al.,
2004; Mekonnen and Mekonnen 2002,). Gabrysch and Campbell, (2009) posits that parity
influences the perceived pregnancy-related risks based on previous pregnancies. The negative
impact of parity in having a facility-based deliveries may be explained by the fact that women
who did not experience any complications in their previous deliveries provided them the
confidence to give birth at home.
On the other hand, the number of household members may limit or reinforce the use
of maternal health care. The dependent members (age less than five years old) of the household
could restrict the use of maternal health care as they may take the mother’s time and financial
resources. However, adult household members may encourage maternal health care use if they
serve as support, like in helping take care of the other children while the mother is in labor in
the health facility (Alcock et. al., 2015; Mekonnen and Mekonnen, 2002).
The present literature have also reported that religion, culture (such as caste system in
India, indigenous health care in Africa) and women’s autonomy affect women’s decision in
utilizing maternal care services (Alcock, 2015; Cheptum, 2014; Hossain, 2010; Mekonnen and
Mekonnen, 2002). But these factors will not be further expanded as these are outside the scope
of this thesis.
11 Parity is defined as the number times a woman has given birth.
CE
UeT
DC
olle
ctio
n

17
2.3 Philippine Case Studies
In the Philippines, various studies have been conducted with the objective to determine
the factors that contribute to the utilization of maternal health care. The results of these studies
is in parallel with the studies discussed in the previous section. The results show that higher
income, higher levels of education, residence in an urban location, have positive and significant
impacts in the utilization of maternal health care. While cost of transportation to maternity
health centers and lack of information are identified as some of the reasons for the lower uptake
of maternal health care services. A summary of the findings of these studies is presented in
Table 3.
Table 3: Literature on Determinants of Maternal Health Care in the Philippines
Studies Findings
Rogan, Shanna Elaine and Maria
Virginia Olveña. 2004. Factors
Affecting Maternal Health
Utilization in the Philippines
Trained prenatal care providers are being accessed
more by women with college education. Socio-
economic factors such as urbanity, age and parity are the
most prominent determinants of usage of postnatal
services.
Landicho, Nancy. 2006. Recent
Pregnancies of Filipino Mothers:
The Link Between Maternal Health
Status and Health Care Utilization
Women’s level of education and residential location
have a positive and significant influence in the
utilization of maternal health care. Maternal health care
seeking behavior however were indicated for curative
than for preventive purposes.
Lavado, Rouselle and Leizel
Lagrada. 2008. Are Maternal and
Child Care Programs Reaching the
Poorest Regions in the Philippines?
Utilization of maternal care has improved at the
national level. However, the variations in the utilization
of maternal care is prominent among the region and
income groups. Use of maternal care remains very low
among the poor.
Pambid, Racquel. 2015. Factors
Influencing Mothers’ Utilization of
Maternal and Child Care (MCC)
Services
Higher income and higher educational attainment of
women resulted in higher availment of maternal care
services.
Women who gave birth in a health facility are more
likely to avail of other maternal care services compared
to mothers who gave birth at home. In rural areas,
women availed more prenatal services than postnatal
services.
Lack of information is also seen as one of the reasons
for the low uptake of maternal health care services.
CE
UeT
DC
olle
ctio
n

18
Source: Author’s own compilation.
Studies Findings
Valera, Marian Theresia and
Denise Valerie Silfverberg. 2015.
Determinants Of Maternal Health
Care Utilization Among
Beneficiaries Of Conditional Cash
Incentives: Evidence From A Post-
Disaster Setting
The socio-demographic factors that affect the use of
prenatal care services are birth order of child and
women’s age at first pregnancy. Likewise, supply-side
factors such as availability of urinalysis services in
health centers, cost of transportation to the maternity
health centers are important determinants of utilization
of prenatal care services.
In addition the use of prenatal care services has a
significant effect in the utilization of facility-based
deliveries.
Paredes, Karlo Paolo. 2016.
Inequality in the Use of Maternal
and Child Health Services in the
Philippines: Do Pro-Poor Health
Policies Result in More Equitable
Use of Services?
Intake of maternal health care improved from 2008 to
2013. However, utilization of prenatal and delivery in a
health facility remain to be unequal with the poor having
less access.
Cananua-Labid, Sherrie Ann. 2017.
Predicting Antenatal Care
Utilization in the Philippines: A
CHAID Analysis
The location where women resides is found to be the
most important factor of prenatal care use. Women in
NCR, CAR, Ilocos Region, Cagayan Valley, Central
Luzon, CALABARZON, Bicol, Western and Central
Visayas, Davao and CARAGA are most likely to use
prenatal care than their counterparts in other regions.
Religion was also shown as a factor determining
prenatal care usage. Muslim women have lower uptake
of prenatal care compared to Christian women. Likewise
income and women’ educational attainment are found to
be significant factors in prenatal care use.
One of the limitations that is observed in these studies is that only the demand-side
factors were analyzed. The approach of these studies focused on identifying the pertinent
demographic and socio-economic characteristics that influence the maternal health care
seeking behavior of women. Supply-side factors such as the impact of the presence of maternal
health care facilities in the area of residence were not factored in.
Apart from identifying the key circumstance factors that affect women’s maternal
health seeking behavior, this thesis contributes to the present literature by providing an
understanding of the impact of health insurance coverage and the availability of maternal health
CE
UeT
DC
olle
ctio
n
19
facilities in explaining women’s decision to utilize facility-based deliveries. Further, this thesis
illustrates the results of policy interventions in reducing the inequality (due to differences in
circumstance factors) in access among the women population.
CE
UeT
DC
olle
ctio
n
20
3. Methodology
3.1 Empirical Framework
This thesis used two empirical frameworks. First, the two-stage regression procedure12,
was employed to analyze the effects of the “supply and demand side” circumstance factors. In
this step, the objective is to identify the relevant demographic, socio-economic, household and
community characteristics that affect women’s decision to have facility-based birth deliveries.
The main variable of interests are health insurance coverage and the availability of maternal
health facilities13.
Second, the Concentration Curve and the Concentration Index14 were adopted to
illustrate the effects of policy interventions on women’s decision to use health facilities. This
step aims to answer the following policy questions:
Will an increase in the number of maternal health centers increase the access of women
in the lower end of the income distribution?
Will a 100% health insurance coverage among the poor result in a significant increase
in the utilization of health facilities during child births?
12 The methodology is based from the Chapter on the Multivariate Analysis of Health Survey
Data (Chapter 10, pp. 115-128) of the World Bank’s technical guide, “Analyzing Health Equity
Using Household Survey Data” by O’Donnel et. al. (2008). 13 The data on the availability of maternal health facility is only available at the community-
level. Hence, the two-stage regression approach was adopted. According to O’Donnel et. al.
(2008), in a cross section analysis, if the community-level variables are estimated with the
individual-level variables, the community level variables will be perfectly correlated with the
unobservable community effects. Therefore, they suggested that a two-stage approach is
appropriate. In the first stage, estimates of the fixed effects is obtained from the fixed effects
model and in the second stage, the community effects estimates is regressed with the
community-level variables. This approach removes the bias of the community effects in the
first stage and the effect of the community-level variable to the outcome is analyzed in the
second stage. 14 The methodology is based from the Chapter on the Concentration Curve (Chapter 7, pp. 83-
92) and the Concentration Index (Chapter 8, pp. 95-106) of the World Bank’s technical guide,
“Analyzing Health Equity Using Household Survey Data” by O’Donnel et. al. (2008).
CE
UeT
DC
olle
ctio
n
21
The Concentration Curve was plotted using the cumulative share of access to facility-based
deliveries and the cumulative share of wealth quintile15. On the other hand, the Concentration
Index is calculated as twice the area between the Concentration Curve and the line of equality.
It is computed as follows:
𝐶𝑜𝑛𝑐𝑒𝑛𝑡𝑟𝑎𝑡𝑖𝑜𝑛 𝐼𝑛𝑑𝑒𝑥 = 2
𝜇 𝑐𝑜𝑣𝑎𝑟𝑖𝑎𝑛𝑐𝑒 (𝑦, 𝑤)
where y is the access to facility-based deliveries, μ is the mean of y and w is wealth quintile
(rank variable). To reiterate what was already mentioned in the previous chapter, a
Concentration Curve that lies above the line of equality signifies a pro-poor inequality while it
is pro-rich if the curve lies below and inequality does not exist if it lies along the equality line.
Accordingly, a negative Concentration Index suggests a pro-poor inequality, a positive value
implies a pro-rich inequality and an index equal to zero indicate the absence of inequality.
This section describes in further detail the methodologies used. In the first stage, a logit
probability regression model on women’s decision to have a facility-based delivery, with
community fixed effects, was estimated. The regression model is as follows:
Pr = (Y𝑖 = 1 | X𝑖 , C𝑖) = exp(α+ β1X𝑖+β2C𝑖)
1+exp(α+ β1X𝑖+β2C𝑖)
where the dependent variable Yi is a dummy variable that refers to the utilization of a health
facility of the ith woman. Yi takes a value of one if the woman utilized a health facility while it
takes a value of zero if not. The explanatory variables are Xi, which is a vector of individual
and household characteristics of the ith woman and Ci is a vector of community dummy
variables to represent the community fixed effects. α is the intercept and the β’s are the
15 Wealth quintile is based on the wealth index variable in the NDHS dataset, which is a factor
score that measures household’s living standard. It is derived using the principle component
analysis based on household ownership of selected consumer items such as televisions and
bicycles, materials used for roofs and walls of the house and type of water and sanitation
facilities. The wealth index is divided into five equal groups. The first quintile refers to the
households with the lowest living standards and the fifth quintile is the group with the highest
standard of living.
CE
UeT
DC
olle
ctio
n
22
coefficients of explanatory variables. The set of variables used will be discussed in the next
section.
After the first stage, each woman will have a predicted probability of their use of health
facilities during child birth. The average probabilities were calculated by wealth quintile and
were used to plot the Concentration Curve and to compute the Concentration Index. This serves
as the baseline Concentration Curve and Concentration Index.
In the second stage of the O’Donnel methodology, the marginal effects of the
community dummies were derived as follows:
ME = Pr (Y = 1 | ��, 𝐶𝑗 = 1) – Pr (Y = 1 | ��, 𝐶𝑗 = 0)
where ME is the marginal effect, X is a vector of the average values of the woman’s individual
and household characteristics and Cj is the community-level dummy of the jth community. The
derived marginal effects are then linked to the community-level variables. The premise is that
the marginal probability of utilizing health facilities is affected community-level factors.
Hence, an ordinary least squared (OLS) regression model is estimated as follows:
𝑀��𝑗 = α + β K𝑗 + ε𝑗
where MEj is the predicted marginal effect of province j, Kj is the vector of community-level
variables of province j, α is the intercept, β is the coefficient of the community-level variables
and ε is the error term.
The succeeding steps identifies the effects of policy interventions. For instance, if the
number of maternal health facilities is increased from Kj0 to Kj1, the change will result in a
change in the marginal effects of the community dummy variables, which is expressed as:
ΔME𝑗 = β(K𝑗1 − K𝑗0)
To estimate the impact of the policy intervention, the change in marginal effects (ΔME𝑗) is
plugged into the logit regression model estimated in the first stage. This will result in a new
CE
UeT
DC
olle
ctio
n

23
predicted probability of use of health facilities for each woman i in community j. The new
predicted probability is calculated as follows:
𝑃�� = (Y𝑖𝑗 = 1 | X𝑖𝑗 , C𝑖𝑗) = exp(α+ β1Xij+(β2j+ΔMEj)Cj))
1+ exp(α+ β1Xij+(β2j+ΔMEj)Cj))
The new predicted outcome is used to plot the new Concentration Curve and Concentration
Index. The difference between the baseline Concentration Curve (Index) and the new
Concentration Curve (Index) may be concluded as the effect of the policy intervention.
3.2 Data
In analyzing women’s maternal health-seeking behavior, this thesis used the 2013
Philippine NDHS, which is part of the worldwide program of the MEASURE Demographic
Health Surveys and is undertaken by the Philippine Statistics Authority (PSA) every five
years16. The 2013 NDHS is designed to provide variety of information on health-related topics
including maternal health17. It has 14,804 household and 16,155 individual women samples
which are representative both at the national and the regional levels.
Administrative data from the Department of Health (DOH) was also utilized. The DOH
Health Facility Database provides the list of maternal health facilities present in each province,
as of year 201718. The database contains information on the ownership classification19 and
license status20 of health facilities.
16 The 2013 NDHS microdata can be accessed through the DHS data repository:
www.dhsprogram.com. 17 The individual module contains the information on maternal health which was obtained from
women aged 15 to 49 years. 18 Ideally, the list of health facilities used should be as of year 2013, however due to data
constraints, 2017 list was used. 19 Health facilities are classified based on ownership as public or private. 20 Health facilities are mandated by the DOH to secure a license from the Bureau of Health
Facilities and Services (BHFS). The license is granted to health facilities who reached the
approved minimum standards.
CE
UeT
DC
olle
ctio
n
24
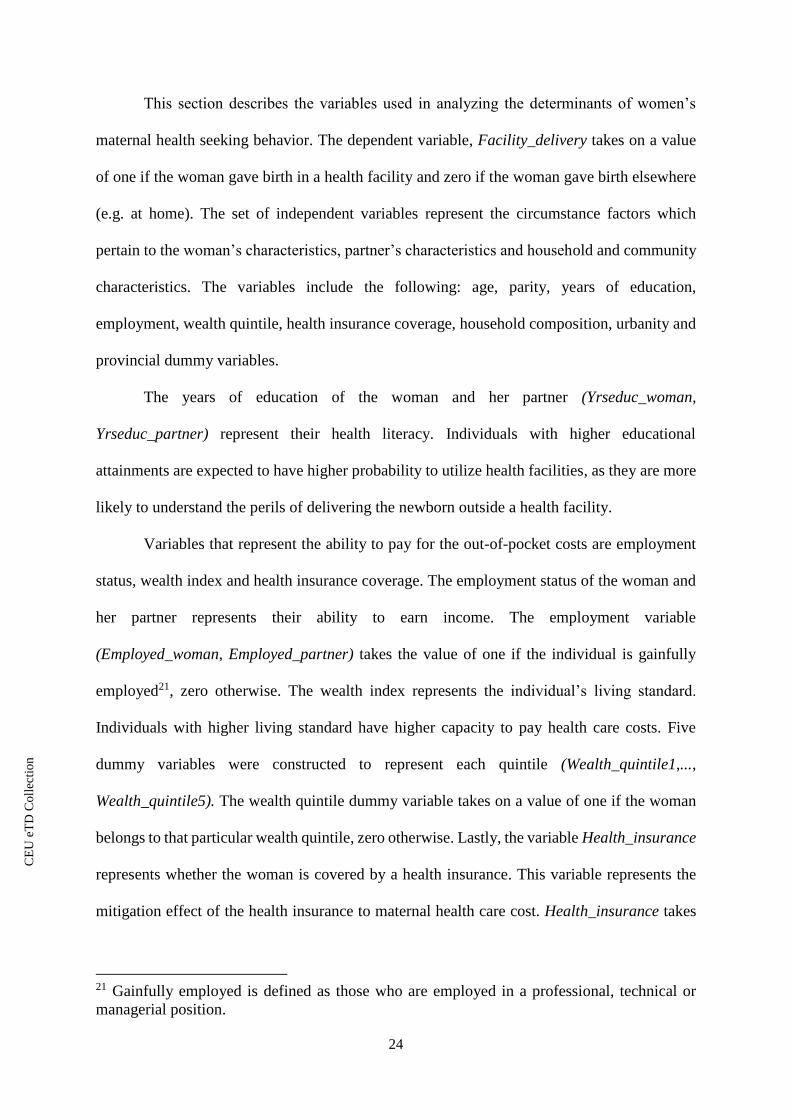
This section describes the variables used in analyzing the determinants of women’s
maternal health seeking behavior. The dependent variable, Facility_delivery takes on a value
of one if the woman gave birth in a health facility and zero if the woman gave birth elsewhere
(e.g. at home). The set of independent variables represent the circumstance factors which
pertain to the woman’s characteristics, partner’s characteristics and household and community
characteristics. The variables include the following: age, parity, years of education,
employment, wealth quintile, health insurance coverage, household composition, urbanity and
provincial dummy variables.
The years of education of the woman and her partner (Yrseduc_woman,
Yrseduc_partner) represent their health literacy. Individuals with higher educational
attainments are expected to have higher probability to utilize health facilities, as they are more
likely to understand the perils of delivering the newborn outside a health facility.
Variables that represent the ability to pay for the out-of-pocket costs are employment
status, wealth index and health insurance coverage. The employment status of the woman and
her partner represents their ability to earn income. The employment variable
(Employed_woman, Employed_partner) takes the value of one if the individual is gainfully
employed21, zero otherwise. The wealth index represents the individual’s living standard.
Individuals with higher living standard have higher capacity to pay health care costs. Five
dummy variables were constructed to represent each quintile (Wealth_quintile1,...,
Wealth_quintile5). The wealth quintile dummy variable takes on a value of one if the woman
belongs to that particular wealth quintile, zero otherwise. Lastly, the variable Health_insurance
represents whether the woman is covered by a health insurance. This variable represents the
mitigation effect of the health insurance to maternal health care cost. Health_insurance takes
21 Gainfully employed is defined as those who are employed in a professional, technical or
managerial position.
CE
UeT
DC
olle
ctio
n
25
on a value of one if the woman is covered by a health insurance, either as a paying member, a
beneficiary or an indigent member22, zero if not.
The continuous variables Hhmembers and Less5 represent the household composition.
It is expected that adult household members (Hhmembers) will have a reinforcement effect and
the members aged less than five years old (Less5) will have a diminishing effect to the use of
maternal health facilities. The remaining continuous variables, age and parity are also expected
to have contradicting impacts, with age having a positive effect while parity a negative effect
to the utilization facility-based deliveries.
The last set of explanatory variables include the 7923 province dummy variables
(NCR24, Abra, Agusan del Norte… Zamboanga Sibugay). The province dummies represent the
community fixed effects. It captures the unobservable community effects that were not
explained by the individual and household level characteristics included in the logit regression.
It takes on a value of one if the woman’s place of residence is in that particular province, zero
otherwise.
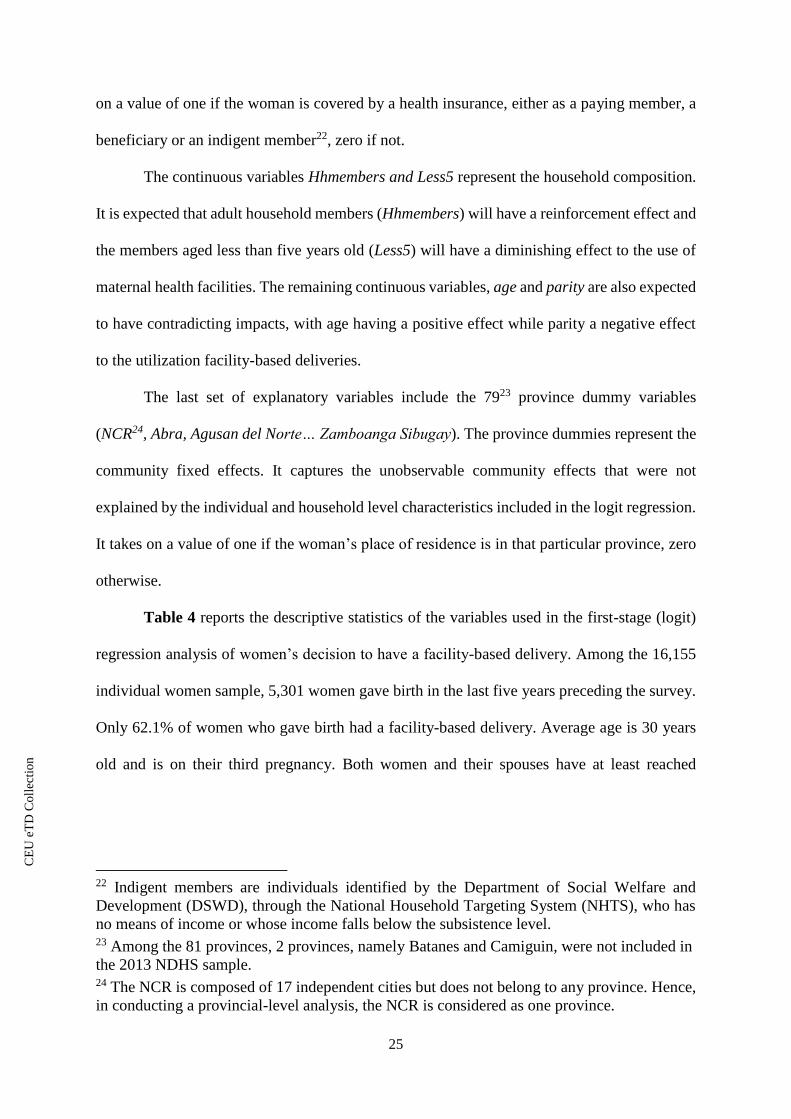
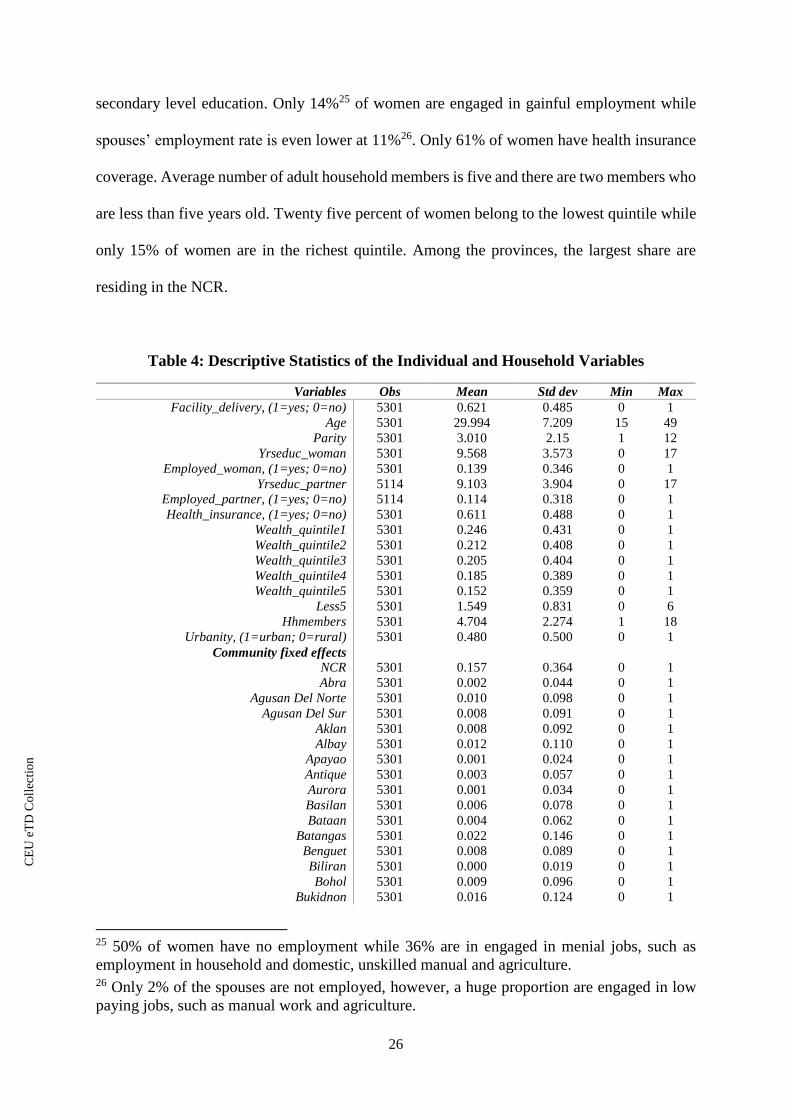
Table 4 reports the descriptive statistics of the variables used in the first-stage (logit)
regression analysis of women’s decision to have a facility-based delivery. Among the 16,155
individual women sample, 5,301 women gave birth in the last five years preceding the survey.
Only 62.1% of women who gave birth had a facility-based delivery. Average age is 30 years
old and is on their third pregnancy. Both women and their spouses have at least reached
22 Indigent members are individuals identified by the Department of Social Welfare and
Development (DSWD), through the National Household Targeting System (NHTS), who has
no means of income or whose income falls below the subsistence level. 23 Among the 81 provinces, 2 provinces, namely Batanes and Camiguin, were not included in
the 2013 NDHS sample. 24 The NCR is composed of 17 independent cities but does not belong to any province. Hence,
in conducting a provincial-level analysis, the NCR is considered as one province.
CE
UeT
DC
olle
ctio
n
26
secondary level education. Only 14%25 of women are engaged in gainful employment while
spouses’ employment rate is even lower at 11%26. Only 61% of women have health insurance
coverage. Average number of adult household members is five and there are two members who
are less than five years old. Twenty five percent of women belong to the lowest quintile while
only 15% of women are in the richest quintile. Among the provinces, the largest share are
residing in the NCR.
Table 4: Descriptive Statistics of the Individual and Household Variables
Variables Obs Mean Std dev Min Max
Facility_delivery, (1=yes; 0=no) 5301 0.621 0.485 0 1
Age 5301 29.994 7.209 15 49
Parity 5301 3.010 2.15 1 12
Yrseduc_woman 5301 9.568 3.573 0 17
Employed_woman, (1=yes; 0=no) 5301 0.139 0.346 0 1
Yrseduc_partner 5114 9.103 3.904 0 17
Employed_partner, (1=yes; 0=no) 5114 0.114 0.318 0 1
Health_insurance, (1=yes; 0=no) 5301 0.611 0.488 0 1
Wealth_quintile1 5301 0.246 0.431 0 1
Wealth_quintile2 5301 0.212 0.408 0 1
Wealth_quintile3 5301 0.205 0.404 0 1
Wealth_quintile4 5301 0.185 0.389 0 1
Wealth_quintile5 5301 0.152 0.359 0 1
Less5 5301 1.549 0.831 0 6
Hhmembers 5301 4.704 2.274 1 18
Urbanity, (1=urban; 0=rural) 5301 0.480 0.500 0 1
Community fixed effects
NCR 5301 0.157 0.364 0 1
Abra 5301 0.002 0.044 0 1
Agusan Del Norte 5301 0.010 0.098 0 1
Agusan Del Sur 5301 0.008 0.091 0 1
Aklan 5301 0.008 0.092 0 1
Albay 5301 0.012 0.110 0 1
Apayao 5301 0.001 0.024 0 1
Antique 5301 0.003 0.057 0 1
Aurora 5301 0.001 0.034 0 1
Basilan 5301 0.006 0.078 0 1
Bataan 5301 0.004 0.062 0 1
Batangas 5301 0.022 0.146 0 1
Benguet 5301 0.008 0.089 0 1
Biliran 5301 0.000 0.019 0 1
Bohol 5301 0.009 0.096 0 1
Bukidnon 5301 0.016 0.124 0 1
25 50% of women have no employment while 36% are in engaged in menial jobs, such as
employment in household and domestic, unskilled manual and agriculture. 26 Only 2% of the spouses are not employed, however, a huge proportion are engaged in low
paying jobs, such as manual work and agriculture.
CE
UeT
DC
olle
ctio
n
27
Variables Obs Mean Std dev Min Max
Bulacan 5301 0.029 0.169 0 1
Cagayan 5301 0.013 0.113 0 1
Camarines Norte 5301 0.006 0.077 0 1
Camarines Sur 5301 0.020 0.141 0 1
Capiz 5301 0.009 0.093 0 1
Catanduanes 5301 0.002 0.048 0 1
Cavite 5301 0.034 0.182 0 1
Cebu 5301 0.039 0.194 0 1
Compostela Valley 5301 0.006 0.078 0 1
Davao Del Norte 5301 0.013 0.115 0 1
Davao Del Sur 5301 0.029 0.167 0 1
Davao Oriental 5301 0.009 0.092 0 1
Dinagat Islands 5301 0.001 0.029 0 1
Eastern Samar 5301 0.004 0.065 0 1
Guimaras 5301 0.001 0.032 0 1
Ifugao 5301 0.001 0.037 0 1
Ilocos Norte 5301 0.004 0.065 0 1
Ilocos Sur 5301 0.008 0.087 0 1
Iloilo 5301 0.019 0.136 0 1
Isabela 5301 0.016 0.126 0 1
Kalinga 5301 0.001 0.035 0 1
La Union 5301 0.006 0.076 0 1
Laguna 5301 0.030 0.171 0 1
Lanao Del Norte 5301 0.015 0.122 0 1
Lanao Del Sur 5301 0.010 0.102 0 1
Leyte 5301 0.017 0.129 0 1
Maguindanao 5301 0.013 0.115 0 1
Masbate 5301 0.009 0.096 0 1
Misamis Occidental 5301 0.003 0.053 0 1
Misamis Oriental 5301 0.013 0.114 0 1
Mountain Province 5301 0.002 0.046 0 1
Negros Occidental 5301 0.028 0.164 0 1
Negros Oriental 5301 0.014 0.120 0 1
North Cotabato 5301 0.013 0.114 0 1
Northern Samar 5301 0.008 0.088 0 1
Nueva Ecija 5301 0.022 0.147 0 1
Nueva Vizcaya 5301 0.006 0.077 0 1
Occidental Mindoro 5301 0.006 0.075 0 1
Oriental Mindoro 5301 0.007 0.081 0 1
Palawan 5301 0.009 0.096 0 1
Pampanga 5301 0.019 0.137 0 1
Pangasinan 5301 0.027 0.163 0 1
Quezon 5301 0.021 0.143 0 1
Quirino 5301 0.003 0.058 0 1
Rizal 5301 0.027 0.162 0 1
Romblon 5301 0.003 0.052 0 1
Sarangani 5301 0.002 0.050 0 1
Samar 5301 0.005 0.070 0 1
Siquijor 5301 0.001 0.038 0 1
Sorsogon 5301 0.008 0.089 0 1
South Cotabato 5301 0.017 0.131 0 1
Southern Leyte 5301 0.004 0.059 0 1
Sultan Kudarat 5301 0.009 0.096 0 1
Sulu 5301 0.006 0.080 0 1
Surigao Del Norte 5301 0.007 0.083 0 1
Surigao Del Sur 5301 0.006 0.075 0 1
Tarlac 5301 0.013 0.113 0 1
Tawi-Tawi 5301 0.003 0.052 0 1
Zambales 5301 0.007 0.084 0 1
CE
UeT
DC
olle
ctio
n
28
Note: Obs=observations; std dev= standard deviation; min=minimum; max=maximum
Source: Author’s own computation based on the administrative data from the DOH.
Note: Standard error is stratification and cluster adjusted.
Obs=observations; std dev= standard deviation; min=minimum; max=maximum.
Source: Author’s own computation based on the 2013 NDHS.
Variables Obs Mean Std dev Min Max
Zamboanga Del Norte 5301 0.012 0.108 0 1
Zamboanga Del Sur 5301 0.026 0.160 0 1
Zamboanga Sibugay 5301 0.007 0.081 0 1
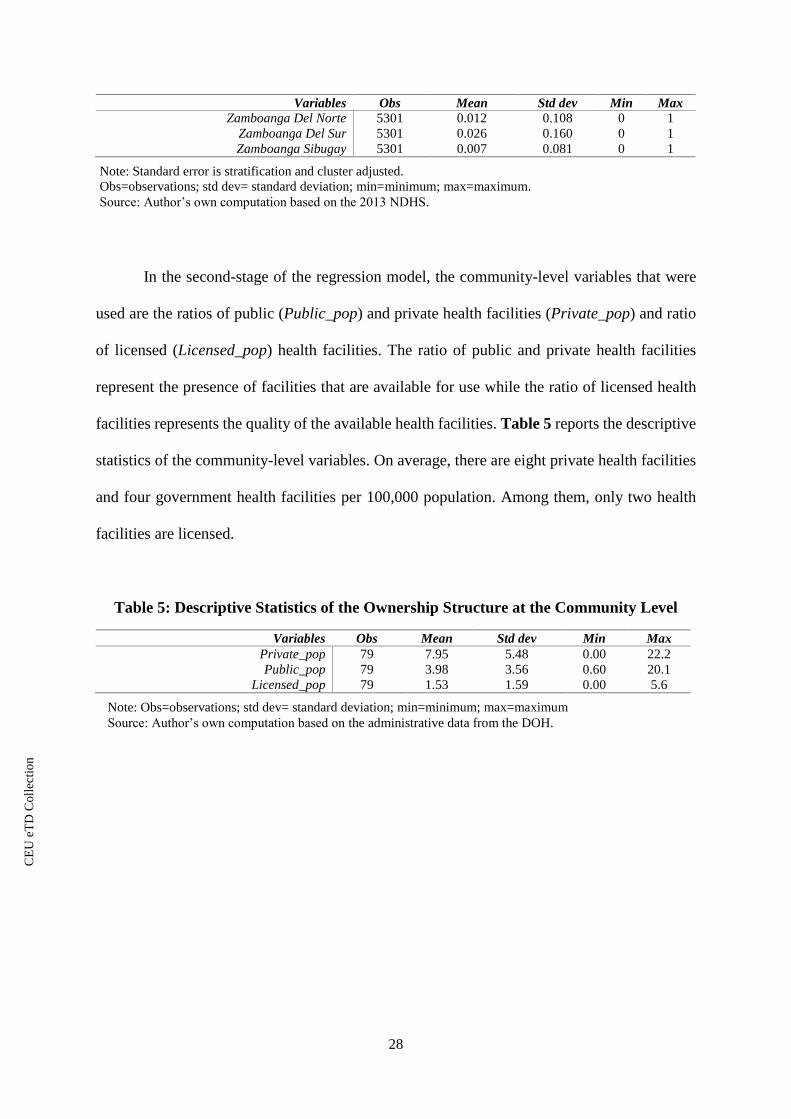
In the second-stage of the regression model, the community-level variables that were
used are the ratios of public (Public_pop) and private health facilities (Private_pop) and ratio
of licensed (Licensed_pop) health facilities. The ratio of public and private health facilities
represent the presence of facilities that are available for use while the ratio of licensed health
facilities represents the quality of the available health facilities. Table 5 reports the descriptive
statistics of the community-level variables. On average, there are eight private health facilities
and four government health facilities per 100,000 population. Among them, only two health
facilities are licensed.
Table 5: Descriptive Statistics of the Ownership Structure at the Community Level
Variables Obs Mean Std dev Min Max
Private_pop 79 7.95 5.48 0.00 22.2
Public_pop 79 3.98 3.56 0.60 20.1
Licensed_pop 79 1.53 1.59 0.00 5.6
CE
UeT
DC
olle
ctio
n

29
4. Results and Discussion
The objective of the empirical analysis is to identify the pertinent circumstance factors
that influence women’s health seeking behavior and to illustrate the effects of policy
interventions on equity. The results of the empirical analysis are discussed in this section.
4.1 Two-Stage Regression Model
The estimates from the logit regression (1st stage) model which examines the effects of
circumstance factors on women’s decision to utilize health facility during childbirth is
presented in Table 6. The second column shows the marginal effects on the probability of use
of a health facility and the third column reports the corresponding standard errors.
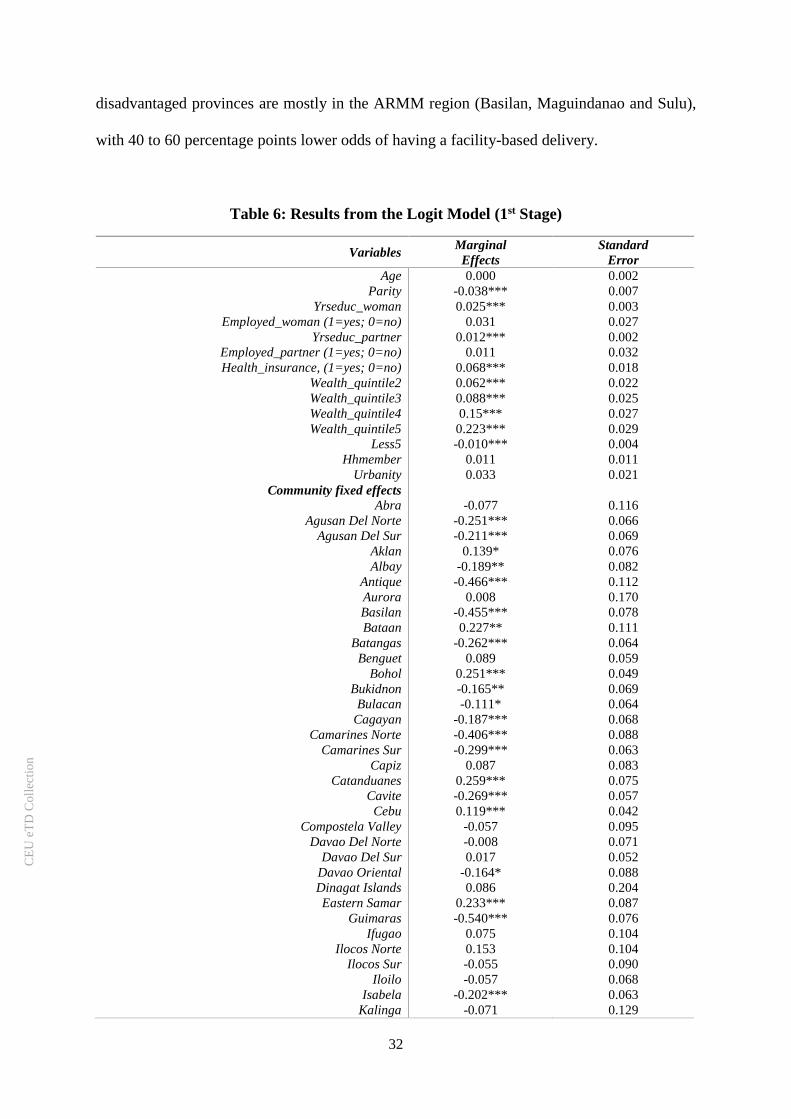
The results show that parity has a negative impact on having a facility-based delivery.
Women with more previous pregnancies are less likely to deliver in a health facility. This is in
parallel with the results of the previous studies. Women with more successful pregnancies in
the past may have lower perception of the risks involved during childbirths which may have
resulted in a lower usage of health facilities in their succeeding pregnancies. Alternatively, the
likelihood of women with higher parity to have children under five years old is high as the
average birth interval in the Philippines is only 35 months27, hence the negative impact may
also be due to the time and financial constraints the dependents pose on women.
Women with more dependents (members who are less than five years old) are less likely
to use health facilities. This therefore supports the latter premise that women with more
dependents are faced with time and financial constraints. For instance, in Agusan del Sur28, the
average fee of giving birth at home with an aid from a hilot only costs less than 1,000 PhP (≈
27 The birth interval value is based on the results of the 2013 NDHS. 28 Based on the 2013 NDHS, a huge percentage of women in Agusan del Sur gave birth at
home, which stands at 63%.
CE
UeT
DC
olle
ctio
n
30
20 USD29) while giving birth in a hospital costs 10,251 PhP (≈220 USD)30. With this large
gap, women with more dependents are faced with a huge opportunity cost in delivering their
babies in a hospital, as they can use the difference in cost in providing the needs of their other
dependents. Another explanation why women with more dependents may prefer to give birth
at home, aside from they do not have to leave their children at home with no one taking care
of them, hilots offer additional services such as taking care of their other children, washing
their clothes and even cooking for them (Sheker, 2011).
Education also appeared to be an important determinant of women’s maternal health
care seeking decision. Both women’s education and the education of their partners have shown
a positive significant impact in the use of facility-based deliveries. On average, women who
have higher formal education by 10 years have 25 percentage points higher probability of using
a health facility. The result shows that women’s literacy is augmented by their partner’s
education. Women with husbands who have higher education by 10 years have 12 percentage
points higher probability of having a facility-based delivery.
The wealth quintile index dummies are all significant in explaining the probability of
having a facility-based delivery. With the poorest quintile (wealth1) being the reference
category in the logit regression, women belonging in the higher quintiles (wealth2…wealth5)
have higher probability of using maternal health facilities by 6.2 to 22.3 percentage points,
compared to their counterparts in the lowest quintile. This supports that cost is an important
factor in utilizing health facilities. Poor women have less capacity to afford the delivery costs
in health facilities. This is in parallel with the response of women in the 2013 NDHS when
29 The exchange rate used is 1 USD = 47 Philippine pesos (PhP). Philippines official exchange
rate for the year 2016 (Source: World Development Indicators, World Bank) 30 The data on the costs of child birth deliveries are taken from a policy brief by Lavado (2010).
CE
UeT
DC
olle
ctio
n

31
asked as to the reason why they did not give birth in a health facility. The main reason cited
was because it “cost too much”31.
Health insurance mitigates the out-of-pocket cost to a certain extent, as women who are
covered by a health insurance is more likely to use health facilities by 6.8 percentage points.
The marginal effect however is relatively lower than the marginal effects of the wealth quintile
variables (wealth4 and wealth5). The lower marginal effect of insurance may be due to the low
amount of maternity benefits. The PhilHealth’s Maternity and Newborn package benefit for
the use of health facility and doctor’s fee only amounts to 6,500 PhP (≈140 USD) (Appendix
5). On the other hand, the average normal delivery in a public hospital costs 10,000 (≈20 USD)
to 30,000 (≈640 USD) and 30,000 to 100,000 (≈2,000 USD) PhP in private hospitals32. Hence,
even women who have health insurance, are still faced with quite a significant amount of out-
of-pocket cost, on top of other costs such as transportation, medicine, etc.
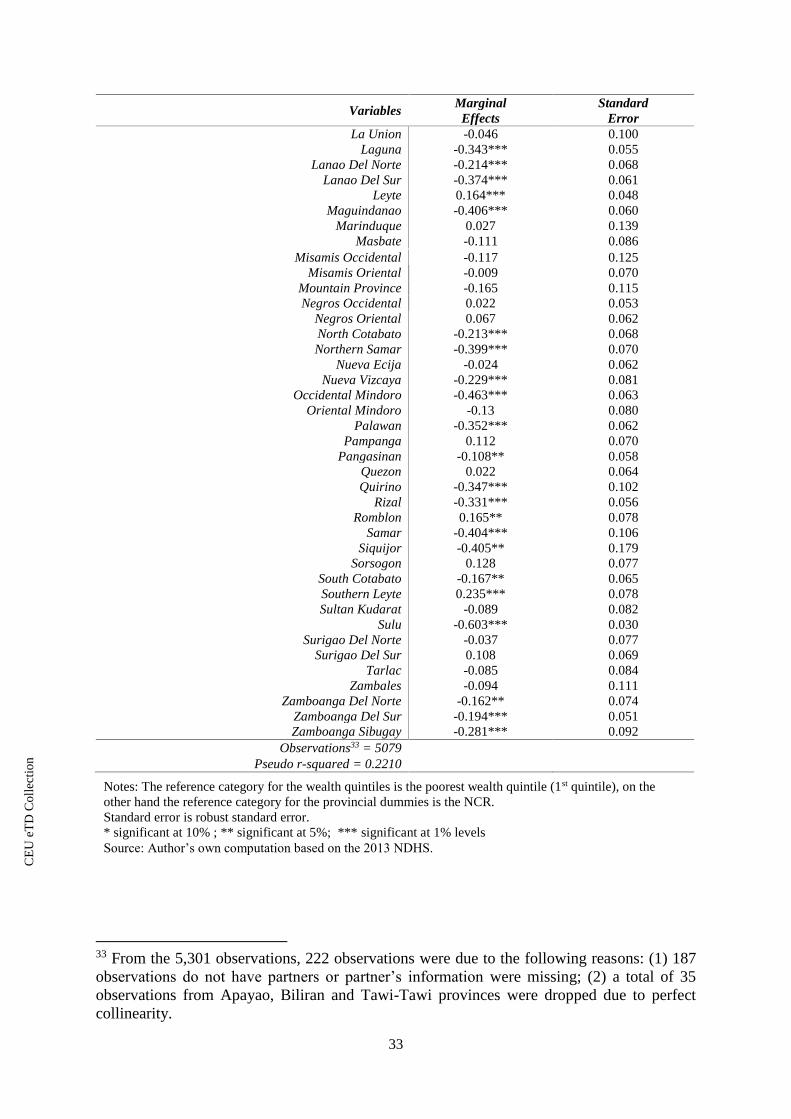
Likewise, the marginal effects of provincial dummies show that the community has a
significant impact in the health seeking behavior of women. With NCR as the reference
category in the logit regression, the result indicates that women who reside outside the NCR
are about 8 to 60 percentage points less likely to use health facilities, except the for eight
provinces in the Luzon and in the Visayas, which are Aklan, Bataan, Bohol, Catanduanes,
Cebu, Eastern Samar, Romblon, Southern Leyte. Unfortunately, these eight provinces do not
elicit a common characteristic aside from the broad geographic grouping. The most
31 In the 2013 NDHS, the top three reasons cited by women who did not deliver in a health
facility are as follows: 37% said that it “cost too much”, 32% considers it as “not necessary”
and 25% find the health facility “too far”. 32 The data on the costs of child birth deliveries in a health facility are taken from the
Infographic : How Much Pregnancy Really Costs in the Philippines.
https://www.ecomparemo.com/info/infographic-how-much-pregnancy-really-costs-in-the-
philippines/
CE
UeT
DC
olle
ctio
n
32
disadvantaged provinces are mostly in the ARMM region (Basilan, Maguindanao and Sulu),
with 40 to 60 percentage points lower odds of having a facility-based delivery.
Table 6: Results from the Logit Model (1st Stage)
Variables Marginal
Effects
Standard
Error
Age 0.000 0.002
Parity -0.038*** 0.007
Yrseduc_woman 0.025*** 0.003
Employed_woman (1=yes; 0=no) 0.031 0.027
Yrseduc_partner 0.012*** 0.002
Employed_partner (1=yes; 0=no) 0.011 0.032
Health_insurance, (1=yes; 0=no) 0.068*** 0.018
Wealth_quintile2 0.062*** 0.022
Wealth_quintile3 0.088*** 0.025
Wealth_quintile4 0.15*** 0.027
Wealth_quintile5 0.223*** 0.029
Less5 -0.010*** 0.004
Hhmember 0.011 0.011
Urbanity 0.033 0.021
Community fixed effects
Abra -0.077 0.116
Agusan Del Norte -0.251*** 0.066
Agusan Del Sur -0.211*** 0.069
Aklan 0.139* 0.076
Albay -0.189** 0.082
Antique -0.466*** 0.112
Aurora 0.008 0.170
Basilan -0.455*** 0.078
Bataan 0.227** 0.111
Batangas -0.262*** 0.064
Benguet 0.089 0.059
Bohol 0.251*** 0.049
Bukidnon -0.165** 0.069
Bulacan -0.111* 0.064
Cagayan -0.187*** 0.068
Camarines Norte -0.406*** 0.088
Camarines Sur -0.299*** 0.063
Capiz 0.087 0.083
Catanduanes 0.259*** 0.075
Cavite -0.269*** 0.057
Cebu 0.119*** 0.042
Compostela Valley -0.057 0.095
Davao Del Norte -0.008 0.071
Davao Del Sur 0.017 0.052
Davao Oriental -0.164* 0.088
Dinagat Islands 0.086 0.204
Eastern Samar 0.233*** 0.087
Guimaras -0.540*** 0.076
Ifugao 0.075 0.104
Ilocos Norte 0.153 0.104
Ilocos Sur -0.055 0.090
Iloilo -0.057 0.068
Isabela -0.202*** 0.063
Kalinga -0.071 0.129
CE
UeT
DC
olle
ctio
n
33
Notes: The reference category for the wealth quintiles is the poorest wealth quintile (1st quintile), on the
other hand the reference category for the provincial dummies is the NCR.
Standard error is robust standard error.
* significant at 10% ; ** significant at 5%; *** significant at 1% levels
Source: Author’s own computation based on the 2013 NDHS.
Variables Marginal
Effects
Standard
Error
La Union -0.046 0.100
Laguna -0.343*** 0.055
Lanao Del Norte -0.214*** 0.068
Lanao Del Sur -0.374*** 0.061
Leyte 0.164*** 0.048
Maguindanao -0.406*** 0.060
Marinduque 0.027 0.139
Masbate -0.111 0.086
Misamis Occidental -0.117 0.125
Misamis Oriental -0.009 0.070
Mountain Province -0.165 0.115
Negros Occidental 0.022 0.053
Negros Oriental 0.067 0.062
North Cotabato -0.213*** 0.068
Northern Samar -0.399*** 0.070
Nueva Ecija -0.024 0.062
Nueva Vizcaya -0.229*** 0.081
Occidental Mindoro -0.463*** 0.063
Oriental Mindoro -0.13 0.080
Palawan -0.352*** 0.062
Pampanga 0.112 0.070
Pangasinan -0.108** 0.058
Quezon 0.022 0.064
Quirino -0.347*** 0.102
Rizal -0.331*** 0.056
Romblon 0.165** 0.078
Samar -0.404*** 0.106
Siquijor -0.405** 0.179
Sorsogon 0.128 0.077
South Cotabato -0.167** 0.065
Southern Leyte 0.235*** 0.078
Sultan Kudarat -0.089 0.082
Sulu -0.603*** 0.030
Surigao Del Norte -0.037 0.077
Surigao Del Sur 0.108 0.069
Tarlac -0.085 0.084
Zambales -0.094 0.111
Zamboanga Del Norte -0.162** 0.074
Zamboanga Del Sur -0.194*** 0.051
Zamboanga Sibugay -0.281*** 0.092
Observations33 = 5079
Pseudo r-squared = 0.2210
33 From the 5,301 observations, 222 observations were due to the following reasons: (1) 187
observations do not have partners or partner’s information were missing; (2) a total of 35
observations from Apayao, Biliran and Tawi-Tawi provinces were dropped due to perfect
collinearity.
CE
UeT
DC
olle
ctio
n

34
Notes: Standard error is robust standard error.
* significant at 10%; ** significant at 5%; *** significant at 1% levels
Source: Author’s own computation based on the 2013 NDHS and administrative data from DOH.
The result of the OLS (2nd stage) regression model shows the positive impact of the
availability of public and private health facilities in the marginal effects of the province
dummies in the use of health facilities during childbirths. It implies that the presence of health
facilities is an important factor on women’s decision to have facility-based deliveries. This is
in congruence to the result of the 2013 NDHS where it reports that the third most cited reason
for not delivering in a health facility is due the distance. Twenty five percent of women who
gave birth at home find health facilities too far. The presence of health facilities in the area give
women more options with less travel time to get into to the health facility.
Table 7: Results from the OLS Model (2nd Stage)
Variables Coefficient Standard Error
Private_r 0.357* 0.206
Govt_r 0.637** 0.312
Licensed_r -1.430 0.712
Constant -0.793 0.307
Observations = 7634
r-squared = 0.1070
4.2 Concentration Curve and Concentration Index
To illustrate the impact of policy interventions in access to facility-based deliveries, the
following simulations were done. First, in provinces with a government health facility ratio
lower than the average, the ratio was increased to reach the average ratio. Second, the health
insurance coverage of poor women35 was increased to 100%. Lastly, the first and second policy
interventions were applied simultaneously. Figure 5 shows the movements of the
34 Five provinces were dropped due to Biliran and Camiguin are not in the 2013 NDHS sample
and Apayao, Biliran and Tawi-Tawi were dropped in the logit regression. 35 Poor women are defined as those who belong to the first and second wealth quintile.
CE
UeT
DC
olle
ctio
n

35
Concentrations Curves and the changes in the Concentration Indexes upon the imposition of
the different policy interventions.
Figure 5: Concentration Curve of Facility-Based Deliveries
The baseline Concentration Curve and Concentration Index suggest that a pro-rich
inequality exists in the use facility-based deliveries among women in the Philippines. The
results of the simulation exercise showed that increasing the government health facility ratios
and health insurance coverage have both resulted in an improvement in the access of facility-
based deliveries among women in the lower segment of the income distribution, as manifested
by the upward movements of the Concentration Curves. The baseline Concentration Curve
which is represented by the green line, both moved in the direction closer to the line of equality
(red line). The new Concentration Curves are represented by the yellow line (increase in health
facility ratios) and the cyan line (increase in insurance coverage). However, the improvement
0
20
40
60
80
100
0 1 2 3 4 5
cum
ula
tive
% f
acil
ity-b
ased
del
iver
ies
cumulative % population, ranked by wealth quintile
Baseline
(CI = 0.157)
Increase in health
facility ratio
(CI = 0.156)
Increase in health
insurance coverage
(CI = 0.153)
Increase in health
facility ratio and
health insurance
coverage
(CI = 0.109)
Note: CI = Concentration Index.
Source: Author’s own computation based on the 2013 NDHS.
CE
UeT
DC
olle
ctio
n

36
is meager as shown by the small reductions in the Concentration Indexes. It declined from a
baseline of 0.157 to 0.156 with the increase in health facility ratios and to 0.153 with the
increase in health insurance coverage.
Meanwhile, it is noteworthy that the equity impact of the interventions is much more
pronounced if they are implemented simultaneously. This is signified by the larger upward
movement of the Concentration Curve. After increasing the health facility ratios and the
insurance coverage at the same time, the baseline Concentration Curve (green line) moved
much closer to the line of equality as represented by the dark blue Concentration Curve.
Accordingly, the Concentration Index was significantly reduced to 0.109.
4.3 Robustness Check
Some robustness checks were done to see how consistent the estimated coefficients are.
The model was re-estimated using two age groups (Appendix 7). Theory suggests that the 15-
20 and 31 and above age groups have the highest pregnancy-related risks while the 21-30 age
group is the relatively safer group. However, there are only a few samples in the 15-20 age
group that’s why it was decided to be dropped in the robustness check.
The results show that the coefficients are quite stable in the 21-30 and 31 and above
age groups except for the partner’s education and quintile dummies. But, overall it can be
concluded that the coefficients from the re-estimations elicit the same trend with the regression
which uses the 15-49 age group.
4.4 Limitations of the Study
As presented in the first chapter, a wide disparity in access to maternal health care exists
among women by income groups and by region. The simulation exercise aims to illustrate how
supply and demand side policy interventions will reduce the inequality. However, the
Concentration Curve and the Concentration Index are tools that can only illustrate the
CE
UeT
DC
olle
ctio
n
37
(in)/equality among income groups. This thesis was not able to illustrate how policy
interventions reduce inequality among regions.
In addition, it would also be insightful to look at how access to facility-based deliveries
will improve among the women in poorer income groups or women in disadvantaged regions.
For instance, a simulation that will look at the effect of increasing the amount of the maternity
and newborn package from 6,500 PhP to a certain amount, say to 10,000 PhP (average cost of
delivering in a public health facility), in reducing inequality. However, due to data constraint,
this was not viable.
CE
UeT
DC
olle
ctio
n

38
5. Conclusion and Policy Proposals
The result of the two-stage regression model showed that individual, household and
community circumstance factors have a significant impact on the decision of women to utilize
health facilities. With this information at hand, further government interventions may be
implemented to encourage poor women to utilize facility-based deliveries. Parity, educational
attainment, dependent household members, health insurance coverage and wealth index are
found to be the most prominent determinants of women’s maternal health seeking behavior.
The negative impact of parity and the number of dependents on the use of health facilities may
support the promotion of family planning and birth spacing. On the other hand, the positive
impact of education on health facility utilization may encourage the government to target the
current information dissemination campaigns on the risks of childbirth to women who have
lower educational attainments. The campaign may be through media or through the barangay
health workers, whichever is deemed to be more effective in the community. The government
should continue its effort in providing free PhilHealth coverage among the poor as supported
by the positive impact of health insurance to health facility utilization. However, as the result
have shown, the low impact of health insurance in mitigating the out-of-pocket cost of
maternity care calls for an increase in the amount of PhilHealth’s maternity and newborn
package benefits. The amount of benefits should at least cover the entire health facility delivery
cost.
Moreover, the result of the simulation exercise illustrated that employing supply and
demand side interventions to the underprivileged segments of the population reduces
inequality. An increase in the number of public maternal health facilitates in areas where it is
lacking, incentivize women to give birth in a health facility, which may due to reductions in
travel time. On the other hand, provision of health insurance encourages women to use health
facilities it mitigates the cost. However, if these policy interventions are implemented
CE
UeT
DC
olle
ctio
n
39
separately, the impact may not be substantial (as shown by the first and second simulation
exercise). This may be attributed to the fact that a demand side intervention alone may be
constrained by supply side factors. For instance, providing sufficient health facilities may not
encourage a lot of poor women to utilize health facilities as they may simply cannot afford it.
On the other hand, if health insurance coverage is increased solely, the effect on the access of
poor women may also be small. Poor women may not be incentivized enough as it still means
for instance that they may still have to travel far to reach the nearest health facility.
This is what has happened in the Philippines, despite the substantial increase in the
PhilHealth’s indigent members starting year 2010, improvements in access to maternal health
care was meager (Paredes, 2016). The persistent inequality may be attributed to the fact that
the government may have put effort in providing the poor access to financial resources to afford
health care services, on the other side, the government is not providing sufficient health budget
leaving some rural health facilities lacking the necessary equipment and skilled health
personnel to have birth delivery services (Jara, 2017). Hence, a poor woman in the rural area
who has a health insurance coverage may want to give birth in a health facility but is
constrained as she still has to travel far.
Therefore, if the government wants to achieve a significant improvement in the
utilization of facility-based deliveries, supply side and demand side factors have to be
implemented simultaneously, as supported by the result of the third simulation exercise, where
the number of public health facilities and insurance coverage were increased at the same time.
CE
UeT
DC
olle
ctio
n

40
References
Acemoglu, Daron and James Robinson. 2012. Why Nations Fail The Origins of Power,
Prosperity, and Poverty. New York: Crown Publishers.
Adjiwanou, Vissého, Moussa Bougma, and Thomas LeGrand. 2017. The Effect of Partners'
Education on Women's Reproductive and Maternal Health in Developing Countries.
Social Science & Medicine. 2018(197): 104-115.
Alcock, Glyn, Sushmita Das, Neena Shah More, Ketaki Hate, Sharda More, Shanti Pantvaidya,
David Osrin, and Tanja AJ Houweling. 2015. Examining Inequalities in Uptake of
Maternal Health Care and Choice of Provider in Underserved Urban Areas of Mumbai,
India: A Mixed Methods Study. BMC Pregnancy Childbirth. 2015 (15): 231.
Ali, Ifzal and Hyun H. Son. 2007. Measuring Inclusive Growth. Asian Development Review.
24(1): 11-31.
Ali, Ifzal and Juzhong Zhuang. 2007. Inclusive Growth Toward a Prosperous Asia. ERD
Working Paper No.97. Manila, Asian Development Bank.
Anwar, A.T.M. Iqbal, Japhet Killewo, Mahbub-E-Elahi K Chowdhury, and Sushil Kanta
Dasgupta. 2004. Bangladesh: Inequalities in Utilization of Maternal Health Care
Services-Evidence from MATLAB. Health, Nutrition and Population (HNP)
Discussion Paper Reaching the Poor Program Paper No. 2. Washington, DC: The
World Bank.
Asian Development Bank (ADB). 2007. Philippines: Critical Development Constraints.
Country Diagnostics Studies. Manila: Asian Development Bank.
Bicego, George, Sian Curtis, Hendrik Raggers, Saidi Kapiga, and Sylvester Ngallaba. 1997.
Sumve Survey on Adult and Childhood Mortality, Tanzania, 1995: In-depth Study on
Estimating Adult and Childhood Mortality in Settings of High Adult Mortality.
Calverton, Maryland: Macro International Inc.
Cananua-Labid, Sherrie Ann. 2017. Predicting Antenatal Care Utilization in the Philippines: A
CHAID Analysis. A paper presented at the 2017 Cebu International Conference on
Studies in Arts, Social Sciences and Humanities, Cebu, Philippines, 26-27 January.
Cheptum, Joyce, Moses Gitonga, Ernest Mutua, Salome Mukui, James Ndambuki, and Winnie
Koima. 2014. Barriers to Access and Utilization of Maternal and Infant Health Services
in Migori, Kenya. Developing Country Studies. 4(15): 48-52.
Chomat, Anne Marie Belz, John Grundy, Sophal Oum, Odilia Bermudez. 2011. Determinants
of Utilisation of Intrapartum Obstetric Care Services in Cambodia, and Gaps in
Coverage. Glob Public Health. 6(8):890–905.
Department of Health (DOH). 2012. National Objectives for Health Philippines, 2011-2016.
Health Sector Reform Agenda Monograph No. 12. Manila.
______. Facilities Database. https://nhfr.doh.gov.ph/rfacilities2list.php.
eCompareMo.com. Infographic : How Much Pregnancy Really Costs in the Philippines.
https://www.ecomparemo.com/info/infographic-how-much-pregnancy-really-costs-in-
the-philippines/
Gabrysch S, Campbell O. Still too far to walk: Literature review of the determinants of delivery
service use. BMC Pregnancy Childbirth. 9(1):34.
Gage, Anastacia. 2007. Barriers to the Utilization of Maternal Health Care in Rural Mali. Social
Science & Medicine. 65(8) : 1666-1682.
Gajate-Garrido, Gissele and Clement Ahiadeke. 2015. The Effect of Insurance Enrollment on
Maternal and Child Healthcare Use The Case of Ghana. IFPRI Discussion Paper
01495. Washington, DC: International Food Policy Research Institute.
CE
UeT
DC
olle
ctio
n

41
Goli, Srinivas, Dipty Nawal, Anu Rammohan, and T.V. Sekher. 2017. Decomposing the
Socioeconomic Inequality in Utilization of Maternal Health Care Services in Selected
Countries of South Asia and Sub-Saharan Africa. J. Biosoc. Sci. 2017:1-21.
Greenaway, Emily Smith, Juan Leon, and David Baker. 2012. Understanding the Association
between Maternal Education and Use of Health Services in Ghana: Exploring the Role
of Health Knowledge. J Biosoc Sci. 44(6): 733–747.
Grundy, John, V Healy, L Gorgolon, L & E Sandig. 2003. Overview of Devolution of Health
Services in the Philippines. Rural and Remote Health. 3(2): 220.
Heaton, Tim and Renata Forste. 2003. Rural-Urban Differences in Child Growth and Survival
in Bolivia. Rural Sociology. 68 (3): 410-433.
Hill, Kenneth, Kevin Thomas, Carla AbouZahr, Neff Walker, Lale Say, Mie Inoue, Emi
Suzuki, and Maternal Mortality Working Group. 2007. Estimates of Maternal Mortality
Worldwide Between 1990 and 2005: An Assessment of Available Data. The Lancet.
370(9595): 1311–1319.
Hossain, Mohammad Iftekher. 2010. Inequality in the Utilization of Maternal Care and the
Impact of a Macroeconomic Policy: Evidence from Bangladesh. Health Econometrics
and Data Group Working Paper 10/08. York, England: University of York.
Jara, Eleanor. 2017. Duterte’s First Year: Philippine Health Agenda a ‘sham’.
https://www.rappler.com/views/imho/175296-duterte-first-year-philippine-health-
agenda. Kibusi, Stephen, Bruno Fokas Sunguya, Eunice Kimunai and Courtney Hines. 2018. Health
Insurance is Important in Improving Maternal Health Service Utilization in Tanzania—
analysis of the 2011/2012 Tanzania HIV/AIDS and Malaria Indicator Survey. BMC
Health Services Research. (2018):18-112.
Lagarde, Myleen and Natasha Palmer. 2011. The Impact of User Fees on Access to Health
Services in Low and Middle Income Countries. Cochrane Database of Systematic
Reviews (Online). 4.
Landicho, Nancy. 2006. Recent Pregnancies of Filipino Mothers: The Link between Maternal
Health Status and Health Care Utilization. Diliman, Quezon City: University of the
Philippines Population Studies.
Lavado, Rouselle and Leizel Lagrada. 2008. Are there regional Variations in the Utilization of
Maternal and Child Care Services Across Income Groups? Philippine Journal of
Development. 35 (2): 53-75.
Lavado, Rouselle. 2010. The Filipino Child. Global Study on Child Poverty and Disparities:
Philippines. UNICEF Policy Brief No. 1. Manila: UNICEF.
Lipton, Michael.1977. Why Poor People Stay Poor: Urban Bias in World Development.
Cambridge, MA:Harvard University Press.
Mekonnen, Yared, and Asnaketch Mekonnen. 2002. Utilization of Maternal Health Care
Services in Ethiopia. Calverton, Maryland, USA: ORC Macro.
O’Donnel, Owen, Eddy Van Doorslaer, Adam Wagstaff, and Magnus Lindelow. 2008.
Analyzing Health Equity Using Household Survey Data. Washington DC: World Bank.
Ononokpono, Dorothy and Clifford Odimegwu. 2014. Determinants of Maternal Health Care
Utilization in Nigeria: A Multilevel A.pproach. Pan Afr Med J. 18 (17): 1-2.
Pambid, Racquel. 2015. Factors Influencing Mothers’ Utilization of Maternal and Child Care
(MCC) Services. Asia Pacific Journal of Multidisciplinary Research. 3 (5): 16-28.
Paredes, Karlo Paolo. 2016. Inequality in the Use of Maternal and Child Health Services in the
Philippines: Do Pro-Poor Health Policies Result in More Equitable Use of Services?
International Journal for Equity in Health. 2016 (15):18.
Philippine Health Insurance Corporation. www.philhealth.gov.ph.
CE
UeT
DC
olle
ctio
n
42
Philippine Statistics Authority (PSA) and ICF International. 2014. Philippines National
Demographic Health Survey 2013. Manila Philippines and Rockville, Maryland, USA:
PSA and ICF International.
______.2016. Philippine Statistical Yearbook. Manila: Philippine Statistics Authority.
______. Family Income and Expenditure Survey Latest Release.
https://psa.gov.ph/sites/default/files/attachments/ird/pressrelease/tab4%265.pdf
______. Population Projection Statistics. http://psa.gov.ph/statistics/census/projected-
population.
______. Poverty Press Releases Data. http://psa.gov.ph/poverty-press-releases/data.
Phillips, Kathryn, Kathleen Morrison, Ronald Andersen, and Lu Ann Aday. 1998.
Understanding the Context of Health Care Utilization: Assessing Environmental and
Provider-Related Variables in the Behavioral Model of Utilization. Health Services
Research. 33(3): 571-596.
Roemer, John. 2006. Economic Development as Opportunity Equalization. Cowles Foundation
Discussion Paper No. 1583. New Haven: Yale University.
Rogan, Shanna Elaine and Maria Virginia Olveña. 2004. Factors Affecting Maternal Health
Utilization in the Philippines. A paper presented at the 9th National Convention on
Statistics (NCS), Manila, Philippines, 4-5 October.
Romualdez, Alberto Jr., Jennifer Frances dela Rosa, Jonathan David Flavier, Stella Luz A.
Quimbo, Kenneth Y. Hartigan-Go, Liezel P. Lagrada, and Lilibeth C. David. 2011. The
Philippines Health System Review. Health Systems in Transition. Geneva: World
Health Organization.
Sheker, Manini. 2011. Birth Attendants in the Philippines.
https://www.theguardian.com/journalismcompetition/birth-attendants-in-the-
philippines.
The DHS Program Demographic Health Surveys. DHS Dataset repository:
www.dhsprogram.com.
United Nations (UN). 2009. ‘All People Benefit’ When Maternal Health Care Is Improved,
Secretary-General Says, Marking Fifteenth Anniversary of Population and
Development Conference. A Press Release by the UN Secretary General.
https://www.un.org/press/en/2009/sgsm12539.doc.htm.
______. 2015. The Millennium Development Goals Report 2015. New York: United Nations.
Valera, Marian Theresia and Denise Valerie Silfverberg. 2015. Determinants of Maternal
Health Care Utilization Among Beneficiaries Of Conditional Cash Incentives:
Evidence From A Post-Disaster Setting. Manila: Philippine Institute for Development
Studies.
Wang, Wenjuan, Gheda Temsah, and Lindsay Mallick. 2017. The Impact of Health Insurance
on Maternal Health Care Utilization: Evidence from Ghana, Indonesia and Rwanda.
Health Policy and Planning. 2017 (32): 366–375.
World Bank. 2010. Philippines Fostering More Inclusive Growth Main Report. Manila: World
Bank Office Manila.
______. World Development Indicators. https://datacatalog.worldbank.org/dataset/world-
development-indicators.
CE
UeT
DC
olle
ctio
n

43
Appendixes
Appendix 1: The Map of the Philippines
Notes: NCR= National Capital Region; CAR= Cordillera Administrative Region (Abra, Apayao, Bengue, Ifugao, Kalinga,
Mountain Province); Ilocos Region (Ilocos Norte, Ilocos Sur, La Union, Pangasinan); Cagayan Valley (Batanes, Cagayan,
Isabela, Nueva Vizcaya, Quirino); Central Luzon (Aurora, Bataan, Bulacan, Nueva Ecija, Pampanga, Tarlac, Zambales);
CALABARZON (Calamba, Laguna, Batangas, Rizal, Quezon); MIMAROPA (Marinduque, Occidental Mindoro, Oriental
Mindoro, Palawan, Romblon); Bicol (Albay, Camarines Norte, Camarines Sur, Catanduanes, Masbate, Sorsogon); Western
Visayas (Aklan, Antique, Capiz, Negros Occidental, Guimaras, Iloilo); Central Visayas (Bohol, Cebu, Negros Oriental,
Siquijor); Eastern Visayas (Biliran, Eastern Samar, Leyte, Northern Samar, Southern Leyte, Western Samar); Zamboanga
Peninsula (Zamboanga del Norte, Zamboanga del Sur, Zamboanga City, Zamboanga Sibugay); Northern Mindanao
(Bukidnon, Camiguin, Lanao del Norte, Misamis Occidental, Misamis Oriental); Davao Region (Davao del Norte, Davao del
Sur, Davao Oriental, Compostela Valley, Davao Occidental); SOCCSKSARGEN (South Cotabato, Cotabato, Sultan Kudarat,
Sarangani plus General Santos City); CARAGA (Agusan del Norte, Agusan del Sur, Surigao del Norte, Surigao del Sur,
Dinagat Islands); ARMM= Autonomous Region of Muslim Mindanao (Basilan, Lanao del Sur, Maguindanao, Sulu, Tawi-
tawi).
Source: PSA and ICF International (2014)
CE
UeT
DC
olle
ctio
n
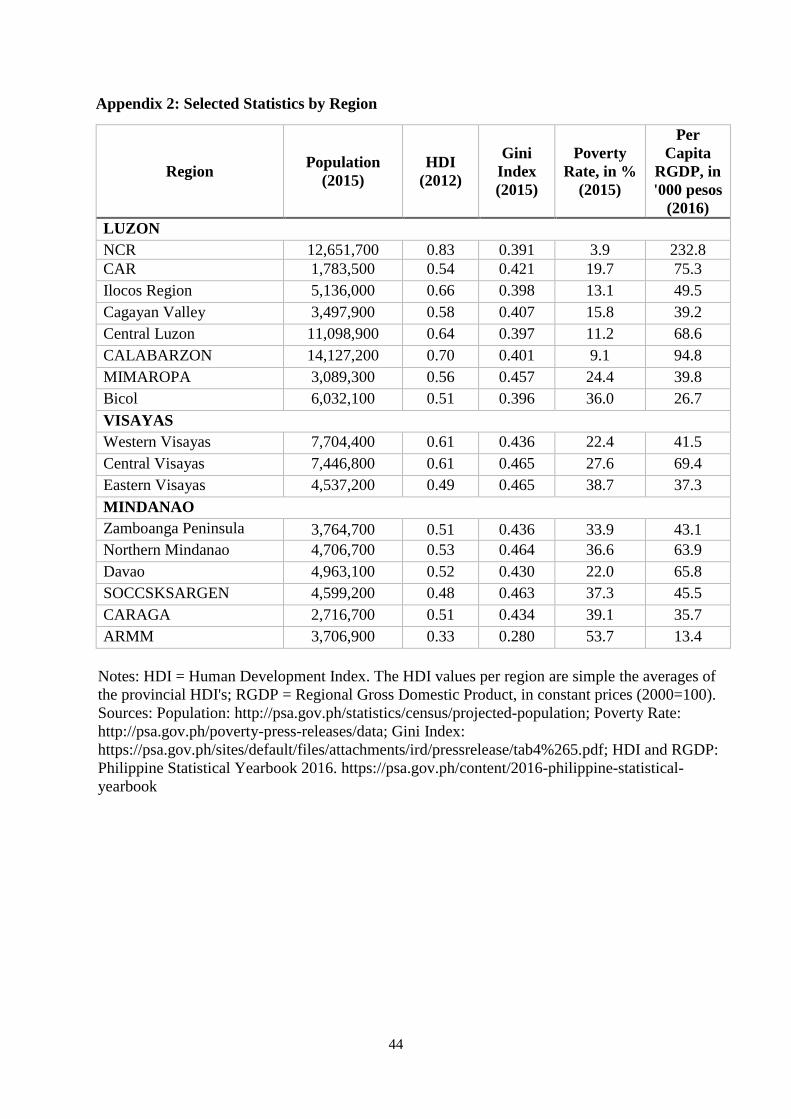
44
Appendix 2: Selected Statistics by Region
Region Population
(2015)
HDI
(2012)
Gini
Index
(2015)
Poverty
Rate, in %
(2015)
Per
Capita
RGDP, in
'000 pesos
(2016)
LUZON
NCR 12,651,700 0.83 0.391 3.9 232.8
CAR 1,783,500 0.54 0.421 19.7 75.3
Ilocos Region 5,136,000 0.66 0.398 13.1 49.5
Cagayan Valley 3,497,900 0.58 0.407 15.8 39.2
Central Luzon 11,098,900 0.64 0.397 11.2 68.6
CALABARZON 14,127,200 0.70 0.401 9.1 94.8
MIMAROPA 3,089,300 0.56 0.457 24.4 39.8
Bicol 6,032,100 0.51 0.396 36.0 26.7
VISAYAS
Western Visayas 7,704,400 0.61 0.436 22.4 41.5
Central Visayas 7,446,800 0.61 0.465 27.6 69.4
Eastern Visayas 4,537,200 0.49 0.465 38.7 37.3
MINDANAO
Zamboanga Peninsula 3,764,700 0.51 0.436 33.9 43.1
Northern Mindanao 4,706,700 0.53 0.464 36.6 63.9
Davao 4,963,100 0.52 0.430 22.0 65.8
SOCCSKSARGEN 4,599,200 0.48 0.463 37.3 45.5
CARAGA 2,716,700 0.51 0.434 39.1 35.7
ARMM 3,706,900 0.33 0.280 53.7 13.4
Notes: HDI = Human Development Index. The HDI values per region are simple the averages of
the provincial HDI's; RGDP = Regional Gross Domestic Product, in constant prices (2000=100).
Sources: Population: http://psa.gov.ph/statistics/census/projected-population; Poverty Rate:
http://psa.gov.ph/poverty-press-releases/data; Gini Index:
https://psa.gov.ph/sites/default/files/attachments/ird/pressrelease/tab4%265.pdf; HDI and RGDP:
Philippine Statistical Yearbook 2016. https://psa.gov.ph/content/2016-philippine-statistical-
yearbook
CE
UeT
DC
olle
ctio
n
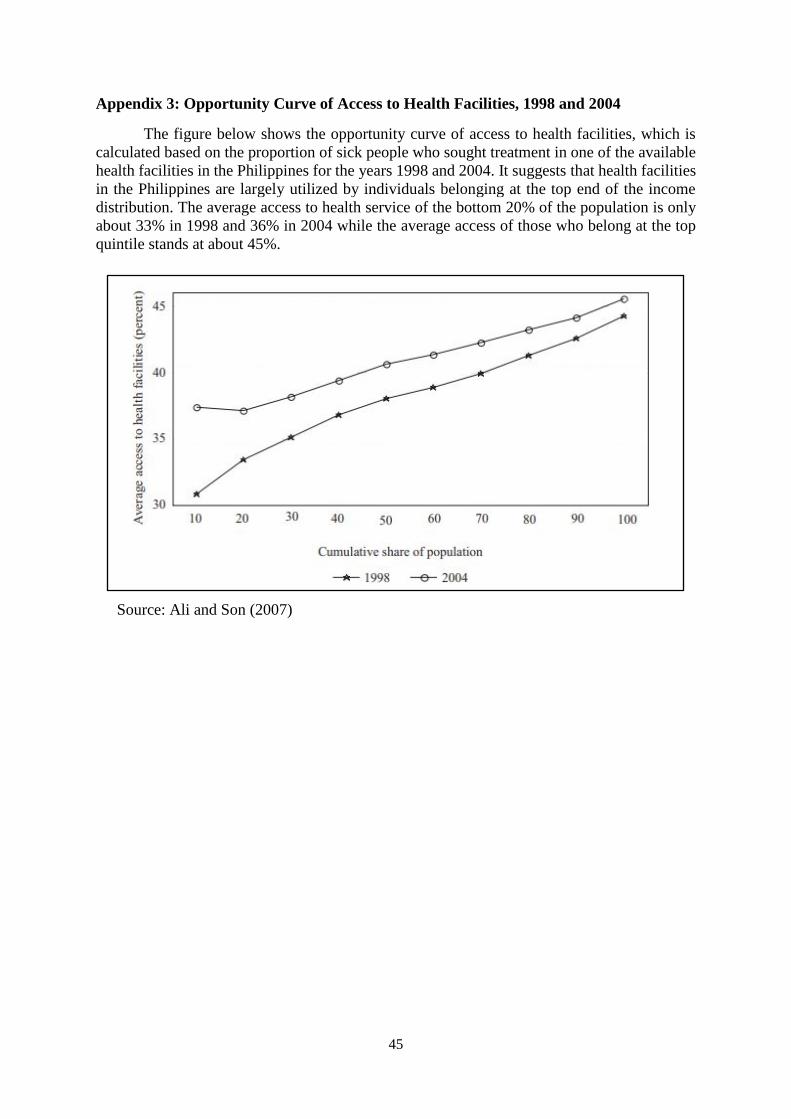
45
Appendix 3: Opportunity Curve of Access to Health Facilities, 1998 and 2004
The figure below shows the opportunity curve of access to health facilities, which is
calculated based on the proportion of sick people who sought treatment in one of the available
health facilities in the Philippines for the years 1998 and 2004. It suggests that health facilities
in the Philippines are largely utilized by individuals belonging at the top end of the income
distribution. The average access to health service of the bottom 20% of the population is only
about 33% in 1998 and 36% in 2004 while the average access of those who belong at the top
quintile stands at about 45%.
Source: Ali and Son (2007)
CE
UeT
DC
olle
ctio
n

46
Appendix 4: Principal Legislation in the Health Sector
Year Act
1954 Republic Act No. 1082 “Rural Health Act”
1957 Republic Act No. 1939 “Contributions for the Maintenance of Hospital
Beds”
1959 Republic Act No. 2382 “Medical Act”
1979 Adoption of primary health care (PHC)
1982 Executive Order 851 “Reorganizing the Ministry of Health, Integrating
the Components of Health Care Delivery into its Field Operations, and for
Other Purposes”
1987 Constitution of the Republic of the Philippines
1988 Republic Act No. 6675 “Generics Act”
1991 Republic Act No. 7160 “Local Government Code”
1994 Republic Act No. 7722 “Higher Education Act”
1995 Republic Act No. 7875 “National Health Insurance Act”
1997 Republic Act No. 8344 “An Act Prohibiting the Demand of Deposits or
Advance Payments for the Confinement or Treatment of Patients in
Hospitals and Medical Clinics in Certain Cases”
1999 Republic Act No. 7305 “Magna Carta for Public Health Workers”
2003 Republic Act No. 9184 “Government Procurement reform Act”
2004 National Health Insurance Act of 1995 amended to Republic Act No.
9241
2008 1988 Generics Act– amended to Republic Act No. 9502 “Cheaper and
Quality Medicines Act”
2010 Republic Act No. 7432 ‘Senior Citizens Act” – amended to Republic Act
No. 9994 “Expanded Senior Citizens Act”
CE
UeT
DC
olle
ctio
n

47
Appendix 5: PhilHealth’s Maternity Care Package and Newborn Care Package
Maternity Care Package
Who can avail Members and qualified Dependents
What services Prenatal care, delivery and postnatal care
Important
Features P1,500 prenatal care fee and P6,500 facility fee including professional fee
Inclusion Covers first 4 normal (uncomplicated) spontaneous deliveries. It should
be low risk at the start and throughout labor and delivery; infant in vertex
position; infant in 37 to 42 weeks AOG.
Exclusion 5th and subsequent deliveries are not covered and maternal conditions that
are considered high risk as enumerated in Circular 20, s 2008:
- Age less than 19y/o
- First pregnancy at the age of 35 or greater
- Multiple pregnancy
- Ovarian abnornality (ovarian cyst)
- Uterine abnormality (myoma uteri)
- Placental abnormality (placenta previa)
- Abnormal fetal presentation (ie breech)
- History of 3 or more abortions/miscarriage
- History of 1 stillbirth
- History of major obstetric/gynecologic surgical operations (ie CS,
uterine myomectomy)
- History of medical conditions (hypertension, pre-eclampsia, thyroid
disorder)
- Other risk factors that warrant
Newborn Care Package
Who can avail Qualified dependents (newborn) of members; No limit as to number of
births
What services Newborn care, screening tests – newborn screening and hearing,
Vaccination – hepatitis B and BCG and EINC protocol
Components
of Newborn
Care Package
Immediate drying of the newborn, early skin-to-skin contact, cord
clamping, non-separation of mother/baby for early breastfeeding
initiation, eye prophylaxis, Vitamin K administration, Weighing, BCG
Vaccination, Hepatitis B Vaccination, newborn Hearing Test, newborn
Screening Test
CE
UeT
DC
olle
ctio
n
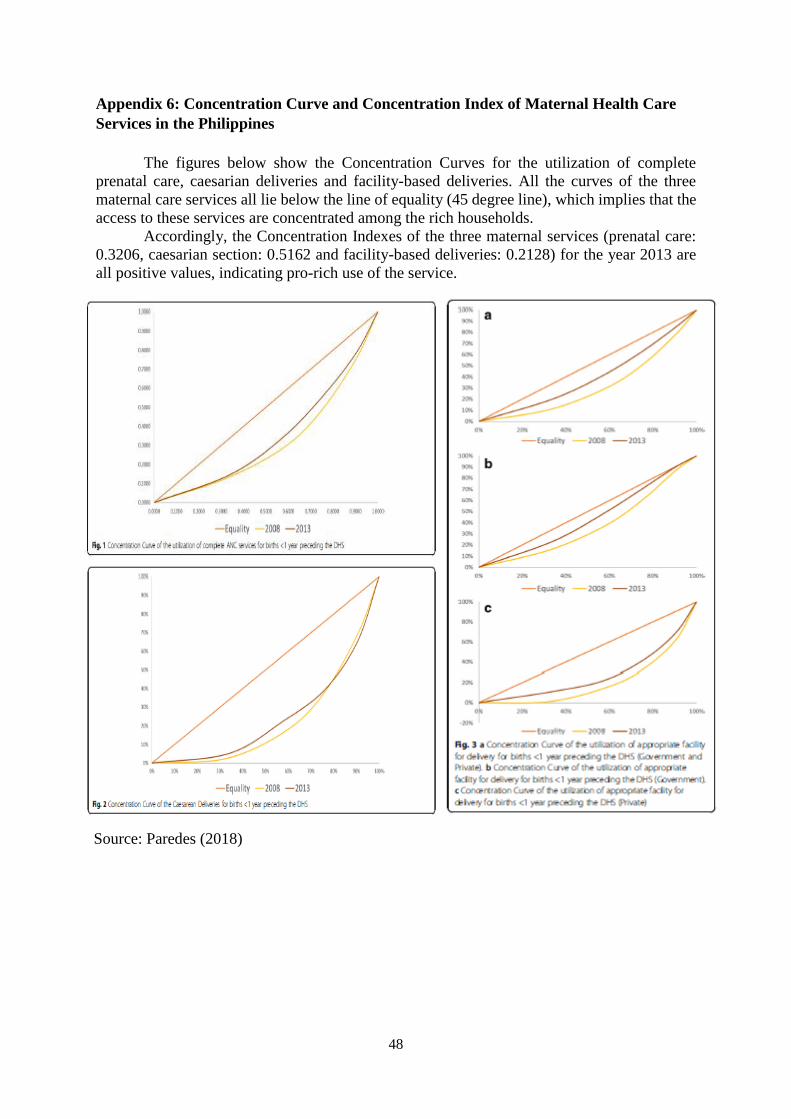
48
Appendix 6: Concentration Curve and Concentration Index of Maternal Health Care
Services in the Philippines
The figures below show the Concentration Curves for the utilization of complete
prenatal care, caesarian deliveries and facility-based deliveries. All the curves of the three
maternal care services all lie below the line of equality (45 degree line), which implies that the
access to these services are concentrated among the rich households.
Accordingly, the Concentration Indexes of the three maternal services (prenatal care:
0.3206, caesarian section: 0.5162 and facility-based deliveries: 0.2128) for the year 2013 are
all positive values, indicating pro-rich use of the service.
Source: Paredes (2018)
CE
UeT
DC
olle
ctio
n

49
Notes: The reference category for the wealth quintiles is the poorest wealth quintile (1st quintile).
Standard error is robust standard error.
* significant at 10% ; ** significant at 5%; *** significant at 1% levels
Source: Author’s own computation based on the 2013 NDHS.
Appendix 7: Robustness Check
20 to 30 yrs old 31 yrs old and above
Marginal
Effects
Standard
Error
Marginal
Effects
Standard
Error
Age -0.005 0.005 0.005 0.003
Parity -0.042*** 0.014 -0.044*** 0.009
Yrseduc_woman 0.024*** 0.005 0.031*** 0.005
Employed_woman (1=yes; 0=no) 0.053 0.041 0.014 0.038
Yrseduc_partner 0.021*** 0.004 0.004 0.005
Employed_partner (1=yes; 0=no) 0.017 0.047 0.030 0.044
Health_insurance, (1=yes; 0=no) 0.079*** 0.025 0.084*** 0.030
Wealth_quintile2 0.039 0.033 0.097*** 0.034
Wealth_quintile3 0.071* 0.037 0.105*** 0.039
Wealth_quintile4 0.133*** 0.040 0.175*** 0.042
Wealth_quintile5 0.175*** 0.045 0.256*** 0.0452
Less5 -0.000 0.017 -0.025 0.019
Hhmember 0.003 0.005 0.010 0.007
Urbanity 0.034 0.031 0.000 0.034
Province dummies Yes Yes
Observations 2348 2330
Pseudo r-squared 0.223 0.248
CE
UeT
DC
olle
ctio
n