equity researchrevenues greater than $21b by 2020 and adjusted diluted eps is expected to be float...
TRANSCRIPT

All Rights Reserved Celgene Equity Research
EQUITY RESEARCH ADNAN ALI ABBASI
*Target Price is for 12 months.
24 January 2017 Americas/United States
Industry: Biomedical & Genetics Sector: Healthcare
Celgene Corporation (NASDAQ: CELG)
ACCUMMULATE RECOMMENDATION / COMPANY UPDATE
Q3 FY16 & FY ’17 Guidance ■ Q3 Result and FY 16 revision: Celgene Pharmaceutical reported strong beat-and-
rise Q3 results with total revenue of $2,982.8 million vs. $2,334.1 million in Q3 of
FY 15, representing 28.4% YoY growth driven by Revlimid, Pomalyst/Imnovid and
Otezla. The GAAP Net Income was $171 million vs. GAAP Net loss of $34.1 million in
Q3 of FY 15. And the Adjusted net income for Q3 was $1,263million v $1,011million
for Q3 FY15. Celgene revised the financial guidance for FY16 from ~$11.0B to
~$11.2B (22% yoy) with upgrade in sales of Revlimid (~6.8B to ~$7.0B) due to label
expansion growth ■ FY 17 Guidance: The Company reaffirmed its FY 17 guidance across the board, with
revenue of $13.0B - $13.4B (+18%), EPS: $5.85- $6.21; non-GAAP EPS: $7.10-$7.25
(+21%). Boosted by sales of Revlimid: $8.0B-$8.3B, Pomalyst/Imnovid: ~$1.6B;
Otelza: $1.5B – 1.7B, Arabxane: $1.0B - ~ $1.2B. Non-GAAP EPS > $13.0 on
revenues greater than $21B by 2020 and adjusted diluted EPS is expected to be
float between ranges of $6.75 - $7.00. According to Morningstar Consensus
Estimate date, Annual Earnings Estimates with median of 6.93 will provide 18.7%
growth in 2017 along with 5Y growth forecast of 22.1% with forward P/E of 17.4% v
S&P 500 18.5%.
Year 12/14A 12/15A 12/16E 12/17E
GAAP EPS 2.39 1.94 3.29 5.48
P / E ratio 46.8 61.7 37.8 21
Revenue (US $m) 7670 9256 11200 13200
EV / Revenue (x) 12.98x 9.34x 8.60x 6.98x
EBITDA (US $m) 3986 4942 6650 7910
EV / EBITDA (x) 24.62x 17.31x 14.58x 11.7x
Number of shares (m) 775.2 93,572.00
8,196.00
Enterprise Value (US$ m)
Market Cap (US$ m)Source: Company datas and Ycharts.com
Figure 1 - CELG Stock Price Performance
About Celgene Corp.
Celgene Corporation, headquartered in Summit, NJ and was founded by David Stirling & Sol Barer in 1986, is an integrated global
biopharmaceutical company engaged primarily in the discovery, development and commercialization of innovative therapies for the
treatment of cancer and inflammatory diseases through next-generation solutions and Protein regulation.
Its targeting areas include intracellular signaling pathways, protein homeostasis and epigenetics in cancer and immune cells,
immunomodulation in cancer and autoimmune diseases and therapeutic application of cell therapies.
The company's products include Revlimid, Vidaza, Thalomid, Pomalyst/Imnovid, Abraxane, and Istodax.

All Rights Reserved Celgene Equity Research
Operations
Figure 2 – CELGENE Historical and Projected Revenue Mix by Product ($’000)
Source: Company data and Individual estimates on basis of Oppenheimer consensus
■ Q3 Results: For the quarter, revenue came in at $2.98B, beating market consensus estimate of 2.83B (4.7% Revenue surprise)
with 27.79% YoY Growth.
■ R&D treatment: Since Q3, CELG has acquired/collaborated with Anokion, Evotex and Acetylon Pharmaceuticals- which is seen as a
complicate deal as Acetylon plans to spin off some of its pipeline into a new company, Regeanancy Pharmaceuticals. However, failure
of Bird Bio deal, which revealed not to be successful regarding CAR-T and triggered CELG for taking over JUNO with $1B investment
(paid at premium and loss of this deal continue to effect GAAP EPS). Therefore, analysts need to see more success in such strategic
deals CELG is adopting, despite positive deals of Agios pharma’s (NASDAQ:AGIO) AG 221 and early 2016 Acquisition of Receptos. Not to
mention, according to the data, Celgene investment on R&D is double than other large biotech ($2B additional R&D expense than
average competitor)
■ Generics: Generics competition entering the market as early as FY 18, based on data, several companies have filled for
Abbreviated New Drug Application (ANDA) to FDA for approval of generic version of Abraxane or even Revlimid. Celgene has
followed it with an infringement lawsuits- decision pending.
■ Outlook: Company projecting total revenue of $21B by FY20, with more than 18 late stage trials due by 2018 which have potential to
add more than $10B in sales if FDA approvals are within projected timeline. These projected targets represent a 17% average annual
rate of revenue through 2020 and 22% for earnings over next 4 years. Accordance with Oppenheimer consensus, Celgene expects to
grow at 19% CARG per year for next five years, with product growth of 19.2% per year.

All Rights Reserved Celgene Equity Research
Figure 3 – Celgene Historical and Projected EBITDA and EBITDA Margins
Source: Company data, Goldman Stanley estimates.
■ Q3 Results: Celgene’s EBITDA for the Q3:16 ending on September 2016 was $501M with EBITDA for the TTM ending on
September was $3,661M. Celgene’s EBITDA margin sequentially deteriorated when comparing EBITDA to previous month (Q2
$993M v $501M Q3), highlighting the pull of 13.94% due to increase in costs and despite Revenue increase to 8.3% to $2.983M
for Q3. Moreover, it is essential to highlight that EDBITDA margin for Q3 was the lower than company average. Observing
Q3:2016 results within Major Pharmaceutical Preparation Industry, 39 other companies have achieved higher EBITDA Margin. ■ Outlook: While Celgene has higher margins than almost any other biotech/pharmaceutical company of its size- there will be
limited potential for margin expansion going forward, mostly caused by greater R&D spending as the company develops Revlimid
replacements along with various new candidates for trial tests, and ever-increasing sales along with marketing expenses as the
company hires more sales reps and raises average compensation.

All Rights Reserved Celgene Equity Research
Figure 4 – Revlimid and Otezla drug Historical & Projected Revenues
Source: Company data, Goldman Stanley estimates.
■ Q1 Results: Q3 starts with the same story regarding the monster performance of Revlimid, the sales for the drug
increased 30% YoY (11% Q/Q) to $1,891M, and were driven by rapidly increased duration of therapy and label
expansion (one-off Russian tender taken into account) in Multiple Myeloma (MM); pushing the FY16 sales expectations
to ~$7B. The biggest surprise was the gradual rise of Otezla drug, which brought in sales of $275M ((++9988%% yy//yy,, ++1144%%
QQ//QQ ggrroowwtthhss)),, and was primarily driven by market share growth in psoriasis indication; this is advantageous in coming
year as leading drug like Humira, Stelara and Enbrel are losing market share, while Otezla and Novartis’s Cosentyx are
growing market share rapidly. Hence, for the FY16, current trajectory suggests Otezla is anticipated to cross the $1B
mark ((uupp aa wwhhooppppiinngg 111166%%)).. It is essential to highlight that despite steady increase in prices for these drugs, the
company will out-perform the consensus expectations in FY16 based on this.
■ Outlook: Revlimid growth is expected to grow in Q4 and keeping that pace in FY17 with many drivers pushing the
revenue stream upward, such as a response from FDA on 24th February 2017 for approving Revlimid for use as a
maintenance treatment in NMDD patient after they receive an autologous stem-cell transplant (ASCT); adding $1B in
annualize sales. Positive trail results from Myeloma XI trail, staMINA trail & CONTINUMM trial will strengthen the
drug’s label- further boosting physician and patient confidence. Celgene expects to attain revenues worth of $1B to
$1.5B from Lymphoma segment by 2020, mostly contributed from Revlimid. While physician and consumer campaigns
continue to propel demand for Otezla in the U.S., the company is working on securing reimbursement in several key EU
markets. Otezla with aggressive pricing, relatively mild side effect profile, moderate efficacy and needy patients is
expected to bring in ~$1.5B to $1.7B in FY17.
■ Pricing: Price pushback might happen for Revlimid use in high-cost cancer therapies, which could change given that the
cost of these medicines has drawn the ire of cancer-care providers, including the highly regarded Memorial Sloan
Kettering Cancer Center, in the past. And Cowen & Co. reported last year that Revlimid’s price was increased 3% in June
FY15, 4% FY14 and 6.8% FY16. Henceforth, the gradual multiple increase could raise eyebrows in coming year.
However, such price increase is lower than the double-digit price surge that has captured significant media attention;
but, it's still more than double the rate of inflation for analysts and management to take into consideration.
0
2,000,000
4,000,000
6,000,000
8,000,000
10,000,000
12,000,000
14,000,000
16,000,000
18,000,000
Dec 31, 2014 Dec 31, 2015 Dec 31, 2016 Dec 31, 2017 Dec 31, 2018 Dec 31, 2019 Dec 31, 2020
Historical & Projected Revenue
OTEZLA®
REVLIMID®

All Rights Reserved Celgene Equity Research
Reports
Fundamental Analysis
Share Price Performance: CELG change in share price of 5.39% for the last 12 months is better than its peer median* according to the Historical price
data. However, the 30-day trajectory shows that CELG share price performance has struggled to keep the momentum with
4.59% changes that is below the peer median; suggesting that company’s recent performance has faded significantly relative
to competitors.
Figure 5: Celgene Median Share Price Performance
Figure 5 – Jazz Valuation Summary and Current Share Price
Source: Stock-analysis & historical data from Yahoo Finance (Graph made from Estimize)
CELG Outperforming profile relative to peers: Return on Equity
CELG achieved a better operating performance than the median of its selected peers with ROE TTM of 38.65% v Peer median of 12.6%, this
classifies CELG’s ROE being ranked higher than 96% of 862 Companies in the Global Biotechnology industry. And while ROE has increased to
38.65% from FY 15 25.75%, its peer median decreased during this period to 21.60% from 24.50%.
Price to Earnings P/E is trading lower than FY15 from 58.80 to 43.30 and industry average also fell to 26.19 from 38.67. However, P/E remains above the 2011
lowest level of 22.44.But the market still expects faster growth from it than those peers (P/E 43.30 v peer median of 26.19)

All Rights Reserved Celgene Equity Research
Earnings Leverage: CELG focusing on Long-term revenue streams With strong y/y change in revenues, CELG has managed to outperform its peers; however, its earnings growth has suffered: going below the peer
median. This highlights that CELG is more focused on attaining top-line revenues, with aim towards long-term goals. CELG is currently converting
1% change in revenue into -1.21% changes in annual earnings reported.
Figure 6: Celgene’s ratio comparison with competitors
Gross Margin & Pre-tax margin performance: CELG’s gross margin is its highest relative to the preceding years, with lowest being 85.99% in 2011. While Celgene’s gross margin
remained on the stable phase at 92.55% TTM, its peer median started to decrease to 81.34% from 82.59% during one year period.
CELG’s pre-tax margin, meanwhile, increased by 200bps from prior year’s low- however, it is still below its 5-year average pre-tax margin
of 27.84%. While CELG’s pre-tax margin went to 24.73% compare to 2015, the peer median also rose during this period to 23.70%
If the gross margin improved without causing significant impact on the deterioration of the working capital days, this will signifies that
company’s performance is a result of efficient delivery in marketplace
All Rights Reserved Celgene Equity Research
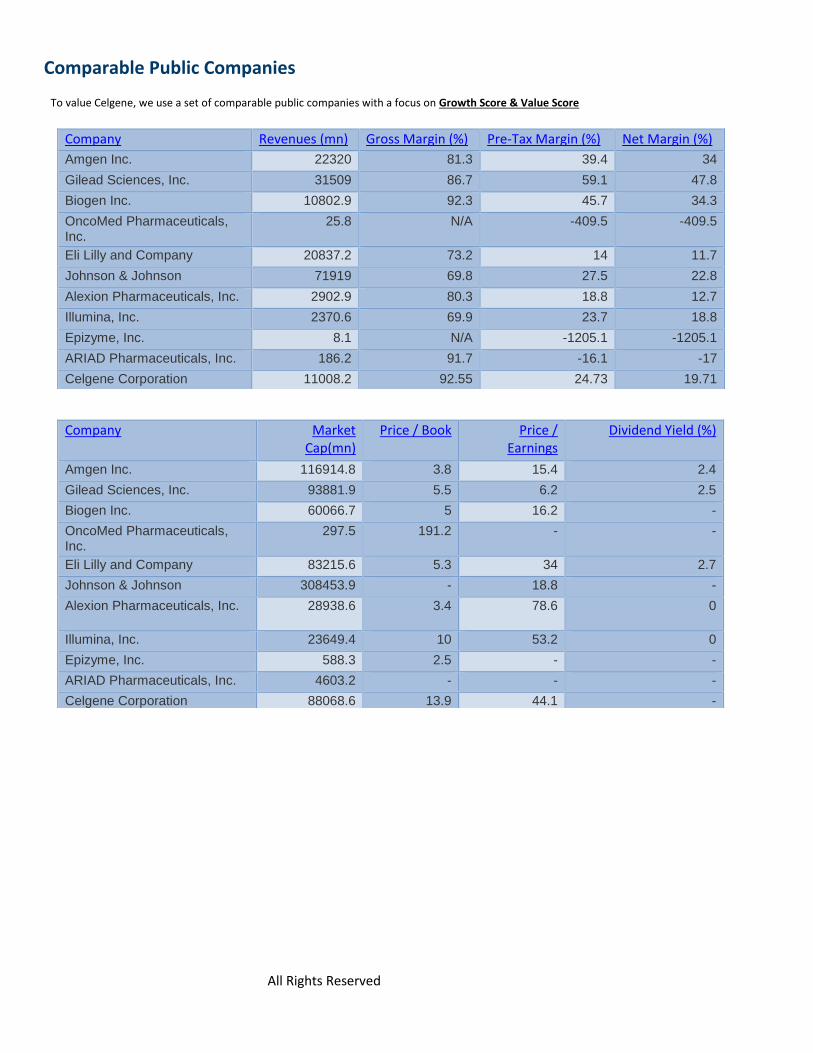
Comparable Public Companies
To value Celgene, we use a set of comparable public companies with a focus on Growth Score & Value Score
Company Revenues (mn) Gross Margin (%) Pre-Tax Margin (%) Net Margin (%)
Amgen Inc. 22320 81.3 39.4 34
Gilead Sciences, Inc. 31509 86.7 59.1 47.8
Biogen Inc. 10802.9 92.3 45.7 34.3
OncoMed Pharmaceuticals, Inc.
25.8 N/A -409.5 -409.5
Eli Lilly and Company 20837.2 73.2 14 11.7
Johnson & Johnson 71919 69.8 27.5 22.8
Alexion Pharmaceuticals, Inc. 2902.9 80.3 18.8 12.7
Illumina, Inc. 2370.6 69.9 23.7 18.8
Epizyme, Inc. 8.1 N/A -1205.1 -1205.1
ARIAD Pharmaceuticals, Inc. 186.2 91.7 -16.1 -17
Celgene Corporation 11008.2 92.55 24.73 19.71
Company Market Cap(mn)
Price / Book Price / Earnings
Dividend Yield (%)
Amgen Inc. 116914.8 3.8 15.4 2.4
Gilead Sciences, Inc. 93881.9 5.5 6.2 2.5
Biogen Inc. 60066.7 5 16.2 -
OncoMed Pharmaceuticals, Inc.
297.5 191.2 - -
Eli Lilly and Company 83215.6 5.3 34 2.7
Johnson & Johnson 308453.9 - 18.8 -
Alexion Pharmaceuticals, Inc. 28938.6 3.4 78.6 0
Illumina, Inc. 23649.4 10 53.2 0
Epizyme, Inc. 588.3 2.5 - -
ARIAD Pharmaceuticals, Inc. 4603.2 - - -
Celgene Corporation 88068.6 13.9 44.1 -

All Rights Reserved Celgene Equity Research
CELG: Top Peers Comparison Figure 7: Celgene share price movement with top 2 rivals

All Rights Reserved Celgene Equity Research
Precedent Transactions Analysis We do not view Precedent Transactions as a primary methodology for Celgene, but, nevertheless, the selected set is shown below:
The transactions below were selected based on their participants (i.e. biopharmaceutical companies), size (between $200 Million and
$10 Billion in LTM Revenue) or other factors.
($ in Millions except Per Share and Per Unit Data)
Source: Company data, SEC 14D-9 & 4-trader

All Rights Reserved Celgene Equity Research
Discounted Cash Flow (DCF) Analysis
Figure 8 – Projected Unlevered Cash Flow
Source: Company data, Goldman Stanley estimates.
Figure 8.1 – DCF: Revenue Exit Multiple- Calculation of Equity Waterfall
EQUITY WATERFALL COMPUTATION
Source: Company data, Goldman Stanley estimates.
FCF: Projected Unlevered Cash Flow ($'Mil)
16-Dec 17-Dec 18-Dec 19-Dec 20-Dec Terminal
EBITDA 6636 7810 8716 10045 11564 11564
D&A (549) (642) (744) (870) (1002) (316)
EBIT 6087 7168 7972 9175 10562 11248
Pro Forma Taxes (833) (981) (1091) (1255) (1445) (1539)
NOPAT 5254 6187 6881 7920 9117 9709
CapEx (222) (264) (275) (304) (330) (330)
NWC Investment (172) (202) (200) (246) (257) (86)
D&A 549 642 744 870 1002 316
Free Cash Flow 5409 6363 7150 8240 9532 9609
% Growth 18% 12% 15% 16% 1%
Model
Standard Low High Market
Enterprise Value
106,886
97,998
117,660 93,572
(+) Cash & Equivalents 5523 5523 5523 5523
(+) Investments & Other 1346 1346 1346 1346
(-) Debt (14,304) (14,304) (14,304) (14,304)
(-) Minority Interest & Other 0 0 0 0
(-) Preferred Stock 0 0 0 0
(-) Other 0 0 0 0
Value of Common Equity
99,451
90,563
110,225 86,137
(/) Shares Outstanding 766 766 766 766
Implied Stock Price
129.83
118.23
143.90 112.45
Upside/(Downside) 15.5% 5.1% 28.0%

All Rights Reserved Celgene Equity Research
Figure 8.2 – DCF: Gordon Growth Exit- Calculation of Equity Waterfall
EQUITY WATERFALL COMPUTATION
Assumptions:
■ Discount Rate: 12.20%, Standard WACC is selected along with High (11%) and Low (13%) rates & Beta 1.74
■ Terminal Value: Long-Term Free Cash Flow Growth Rate of 4.0%, or, alternatively, a Terminal Revenue Exit Multiple of 6.0x.
■ Other: Mid-Year Convention used, and FCF from Q1 stub period was subtracted from all calculations.
Model
Standard Low High Market
Enterprise Value 105,713
92,608
131,226 93,572
(+) Cash & Equivalents 5523 5523 5523 5523
(+) Investments & Other 1346 1346 1346 1346
(-) Debt (14,304) (14,304) (14,304) (14,304)
(-) Minority Interest & Other 0 0 0 0
(-) Preferred Stock 0 0 0 0
(-) Other 0 0 0 0
Value of Common Equity
98,278
85,173
123,791
86,137
(/) Shares Outstanding 766 766 766 766
Implied Stock Price
128.30
111.19
161.61
112.45
Upside/(Downside) 14.1% -1.1% 43.7%
All Rights Reserved Celgene Equity Research
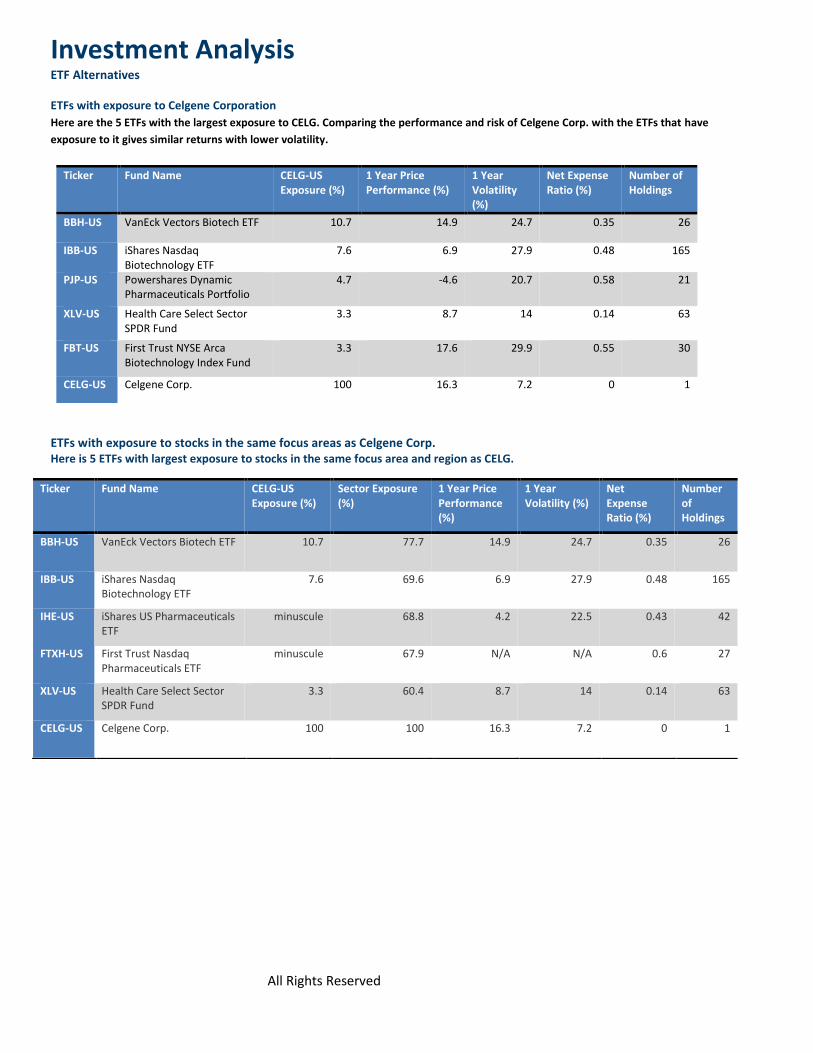
Investment Analysis
ETF Alternatives
ETFs with exposure to Celgene Corporation
Here are the 5 ETFs with the largest exposure to CELG. Comparing the performance and risk of Celgene Corp. with the ETFs that have
exposure to it gives similar returns with lower volatility.
ETFs with exposure to stocks in the same focus areas as Celgene Corp. Here is 5 ETFs with largest exposure to stocks in the same focus area and region as CELG.
Ticker Fund Name CELG-US Exposure (%)
1 Year Price Performance (%)
1 Year Volatility (%)
Net Expense Ratio (%)
Number of Holdings
BBH-US VanEck Vectors Biotech ETF 10.7 14.9 24.7 0.35 26
IBB-US iShares Nasdaq Biotechnology ETF
7.6 6.9 27.9 0.48 165
PJP-US Powershares Dynamic Pharmaceuticals Portfolio
4.7 -4.6 20.7 0.58 21
XLV-US Health Care Select Sector SPDR Fund
3.3 8.7 14 0.14 63
FBT-US First Trust NYSE Arca Biotechnology Index Fund
3.3 17.6 29.9 0.55 30
CELG-US Celgene Corp. 100 16.3 7.2 0 1
Ticker Fund Name CELG-US Exposure (%)
Sector Exposure (%)
1 Year Price Performance (%)
1 Year Volatility (%)
Net Expense Ratio (%)
Number of Holdings
BBH-US VanEck Vectors Biotech ETF 10.7 77.7 14.9 24.7 0.35 26
IBB-US iShares Nasdaq Biotechnology ETF
7.6 69.6 6.9 27.9 0.48 165
IHE-US iShares US Pharmaceuticals ETF
minuscule 68.8 4.2 22.5 0.43 42
FTXH-US First Trust Nasdaq Pharmaceuticals ETF
minuscule 67.9 N/A N/A 0.6 27
XLV-US Health Care Select Sector SPDR Fund
3.3 60.4 8.7 14 0.14 63
CELG-US Celgene Corp. 100 100 16.3 7.2 0 1

All Rights Reserved Celgene Equity Research
Investment Thesis and Risks
Potential Signals to Buy:
■ Revlimid Continues to Deliver: Celgene is working on expanding Revlimid’s label, with upcoming approvals in NDMM indication and
Phase III evaluation program in non-hodgkin lymphoma (NHL) which includes RELEVANCE and AUGMENT trials, with data to be
released in1H of 2017.
■ 2020 Outlook Maintained: Celgene has maintained its outlook for 2020. It continues to project net product sales above $20bn along
with adjusted earnings are expected to go beyond $13 per share. With 2017 through 2018 to be dominated by news related to its
pipeline and label expansion efforts.
■ Label Expansion & Pipeline Development Efforts Encouraging: Celgene is currently working on label expansion of drugs like
I. Pomalyst/Imnovid, which is being evaluated in multiple combination studies in relapsed/refractory MM and MOR-22 in multiple
clinical trials.
II. Abraxane, currently in various stages of evaluation for breast, pancreatic and non-small cell lung cancers (NSCLC) (in 2016,
about half of the total newly diagnosed pancreatic cancer patients in USA were put on Abraxane-gemcitabine combination
therapy) and Trial data due in 2017 for the studies in first-line therapy for stage IBB/IV Squamous NSCLC patients. Important to
mention that CEO confirmed that CELG will explore opportunities for ABRAXANE to be used in combination with checkpoint
inhibitors-this move could trigger sales growth in the coming years.
III. Future blockbuster drug, Otelza is being evaluated in phase III studies for Behçet’s disease, atopic dermatitis and expanded
indications in psoriatic arthritis and plaque psoriasis.
IV. Robust Pipeline: Potential future revenue drivers: Ozanimod & GED-0301 (Phase III-Chrohn’s disease, phase II-UC), CC-486
(phase III- high-risk MDS, Phase II-NSCLC), Enasidenib (phase III- relapsed/refractory AML- regulatory application filed in the
U.S.) and Luspatercept (phase III-lower-risk MDS and beta-thalassemia), CELMoDs (Cereblon E3 Ligase Modulation Drugs)- seen
as a drug to maintain market share for CELG in blood cancer and autoimmune therapies.
(a) Filed at least 8 Investigational New Drug (IND) or Clinical Trial Applications (CTA)
(b) Submission of an IND for a new CELMoD ® compound in patients with multiple myeloma
(c) Submission of an IND for EM901, a T-cell bi-specific antibody targeting BCMA in patients with multiple myeloma
■ Pursuing Deals & Acquisitions to Boost Pipeline: Celgene has been focused towards striking strategic deals to bolster its pipeline and
takeovers in the Q4 ensure investors regarding their long-term targets beyond 2020. The notable takeover includes:
I. Triphase Accelerator Corporate; acquired all assets to a brain-penetrant proteasome inhibitor
II. EngMab: added EM901, as T-cell bi-specific antibody targeting B-cell maturation antigen to Celgene pipeline
III. Quantical: acuquired full access to propriertary platform for the single-cell genomic analysis of human cancer

All Rights Reserved Celgene Equity Research
Investment Risks
The following represent the greatest risks to our investment thesis:
■ Over-Dependence on Revlimid: Depending on the Revlimid, despite its impressive sales number is a concern for Celgene with
lower-than expected sales of the drug will have an adverse impact on the growth prospects. The major caution for Revlimid is
patent war, as it is known that CELG settled Revlimid patent challenge with Allergan (NYSE:AGN) representing the Indian company
Natco. And it’s been known that Mylan (NASDAQ:MYL) has been in litigation with CELG to simply obtain the raw material for Revlimid,
lenalidomide, trial expected this year. Lastly, another Indian generic company, Dr. Reddy’s (NYSE:RDY), recently made filing with FDA for
making generic version of Revlimid. While Vidaza sales had been losing momentum by the 2013 entry of a generic competitor, along with
struggling performances of Thalomid and Istodax. And Abraxane sales are under-pressure due to a highly competitive US market for lung
and breast cancer therapy. Henceforth, such dependence on the Revlimid has its inherent risks.
■ High Competition in Target Markets: Despite placing its products in the highly lucrative markets, Celgene’s products face intense
competition in the market from both pharma and biotech companies along with specialty pharmaceutical firms. For instance,
hematology, oncology, inflammation and immunology markets are dominated by several household players like Johnson &
Johnson, Biogen, Bristol-Myers & Gilead.
■ Pipeline and Regulatory Setbacks: While the high risk is associated with clinical development, tougher regulations also make it
difficult to gain approvals for pipeline candidates. Thus, development and pipeline setbacks for late-stage pipeline candidates
would be a major disappointment for the company and have adverse impact on the shares. Below are the 5 notable setbacks
Celgene has suffered in its pipeline:
1. June 2016: Celgene decided not to seek for a marketing approval for an expanded label of Revlimid as maintenance treatment for
a certain type of DLBCL patients. This was based on the data from a phase III study, as no benefit was seen in the Revlimid arm
where overall survival is concerned
2. July 2014: The phase III POSTURE study on Otezla in the ankylosing spondylitis indication failed to meet the primary endpoint of
the study.
3. Q1 2013: the RESUME study, comparing Pomalyst to placebo in patients with myeloproliferative neoplasm-associated
myelofibrosis and severe anemia with RBC-transfusion dependence, failed to meet its primary endpoint.
4. June 2013: CELG suffered setback when it discountinued a phase II study evaluating the use of Revlimid as a first-line therapy in
elderly patients suffering from B-cell chronic myeloid leukemia.
5. November 2011: the MAINSAIL study was discontinued, as it was evaluating the use of Revlimid in patients with castrate-resistant
prostate-cancer.
Hence, with CELG currently having 17 studies in late-stage clinical trials, with most crucial for Ozanimod, which, if clinical
setbacks occur, it could damage CELG’s revenue as drug could reach peak sales from $4B to $6B (if approved).
■ Extremely Active Partnering Program: It is still somewhat unclear as how wisely it has been investing its funds. For instance, the
prominent bluebird bio deal few years ago was revealed to be rather unsuccessful regarding CAR-T, pushing CELG to acquire Juno
(NASDAQ: JUNO) for $1B investment mid-year 2016. Important to mention that CELG paid $93 per share for JUNO, which closed at
$19.78 (24/01/2017). Thus, analysts need to see enough success along the way to accept Celgene’s strategy.
All Rights Reserved Celgene Equity Research
Catalyst
1) Possible Revlimid Label Expansion: Soon The European Medicines Agency’s Committee for Medicinal Products for Human Use
(CHMP) will release its opinion on approval of Revlimid as monotherapy for the maintenance treatment of adult patients with newly
diagnosed MM who have undergone ASCT. Once approved, Revlimid will be the first and only maintenance treatment available for
these groups of patients. This will indeed contribute towards share price growth following Q4:16 earnings call.
2) Ozanimod’s Phase 3 clinical trials: The phase 3 trial SUNBEAM, which is evaluating CELG’s Ozanimod in patients with relapsing
multiple sclerosis (RMS) is expected in February along with data from the confirmatory Phase 3 RADIANCE trial expected next
quarter.
3) Donald Trump & Drug prices: As Donald Trump said during his Time magazine interview “I’m going to bring down drug prices. I don’t
like what has happened with drug prices”. However, it is important to highlight that price floor is an important foundation of a bullish
outlook for the biotechnology and pharmaceutical sectors. And according to the consensus in the wallstreet- Republican-controlled
Congress will remain highly skeptical of pushing towards any bill that can settle or manage biotech prices. But for next couple of
months, Biotech firms will keep an eye on Trump because any news of a sharp price increase can lead to a Twitter rant from the
President that can be vicious for any biotech firm also for overall sector. Hence increasing Celgene’s risk profile near-term, this can
create disturbance in the stock price movement.