· pdf fileequity research│june 1, 2016 asia pacific daily - 1 june 2016. equity research...
TRANSCRIPT

Equity research│June 1, 2016
Asia Pacific Daily - 1 June 2016
Equity Research Reports…
▌IDEA OF THE DAY | China/Hong Kong Strategy Note - The rationale behind continuous southbound inflow | P2 We have noticed continuous southbound inflow to H-shares via Stock Connect. We see three rationales behind the inflow: 1) incentive to position offshore assets to hedge currency risk, 2) attractive valuation and 3) anticipation of SZ-HK Connect. We maintain our positive market view on continuous southbound flow and a correction of previous overly-bearish sentiment. The southbound flow favors 1) HSBC, 2) large SOEs such as Chinese banks and China Mobile and 3) Tencent. ——————————————————————————————————————————————————————————————————————————————————————— ▌REGIONAL / ASEAN / APAC Plantations (NEUTRAL) - Malaysia raises biodiesel mandates | P3 ——————————————————————————————————————————————————————————————————————————————————————— ▌China/Hong Kong Environmental (OVERWEIGHT) - Minimum utilisation hours set for renewables | P4 ——————————————————————————————————————————————————————————————————————————————————————— ▌India Mphasis (HOLD, tp:Rs500.00▲) - Improving growth outlook priced in | P5 Tata Motors (REDUCE, tp:Rs340.00▲) - Short-term relief in 4QFY16 | P6 ——————————————————————————————————————————————————————————————————————————————————————— ▌Indonesia Strategy Note - CIMB Portfolio Tracker – May 2016 | P7 ——————————————————————————————————————————————————————————————————————————————————————— ▌South Korea Hyundai Mipo Dockyard (ADD, tp:W140,000.00) - STX windfall – full consolidation ahead | P8 Kolon Industries (ADD, tp:W83,000.00) - Asia NDR feedback: All eyes on CPI | P9 ——————————————————————————————————————————————————————————————————————————————————————— ▌Malaysia 7-Eleven Malaysia Holdings Berhad (HOLD, tp:RM1.44) - Growth priced in | P10 Asia File Corporation (ADD▲, tp:RM5.14) - 4QFY16 results: Profit margin expansion | P11 Astro Malaysia (ADD, tp:RM3.36) - A good start to the year | P12 AWC Berhad (ADD, tp:RM1.13) - Plumbing TRX | P13 Malaysian Resources Corp (ADD, tp:RM1.32▼) - A toned-down quarter | P14 Media Chinese Int'l (REDUCE, tp:RM0.64) - In need of new growth drivers | P15 Muhibbah Engineering (ADD, tp:RM2.96▼) - More than meets the eye | P16 QL Resources (ADD, tp:RM5.05) - Growing but underwhelmed expectations | P17 SBC Corp (ADD, tp:RM1.20▼) - 4QFY16 results: No approvals yet for JQ | P18 Banks (OVERWEIGHT) - Apr 16 tracker – still holding tight to asset quality | P19 ——————————————————————————————————————————————————————————————————————————————————————— ▌Philippines Philippine Long Distance Tel (HOLD, tp:PHP1,832.00) - Splitting the spectrum | P20 ——————————————————————————————————————————————————————————————————————————————————————— ▌Singapore Cache Logistics Trust (HOLD, tp:S$0.94) - Caught in a cauldron | P21 Sembcorp Industries (ADD, tp:S$3.10) - Europe NDR – scenario planning for marine | P22 ——————————————————————————————————————————————————————————————————————————————————————— ▌Taiwan First Financial (ADD▲, tp:NT$18.50▲) - Better off | P23 Technology - Overall (NEUTRAL) - Computex 2016 snapshot | P24 ——————————————————————————————————————————————————————————————————————————————————————— ▌Thailand Bangkok Chain Hospital (HOLD▲, tp:THB11.20▲) - 1st price hike after two years | P25
Showcasing CIMB Research Ideas
IND: Mitra Keluarga Karyasehat 30/05 A healthy prognosis >PDF
———————————————————————————————————————————————————————————————————————————————————
IND: Strategy Note 27/05 How to position if tax amnesty is passed..>PDF
———————————————————————————————————————————————————————————————————————————————————
TW: Test & Assembly 26/05 The curtain drops but a window opens..>PDF
———————————————————————————————————————————————————————————————————————————————————
TW: Semiconductor 25/05 Recovery likely a moderate one, but the..>PDF
———————————————————————————————————————————————————————————————————————————————————
SIN: Cityneon Holdings 24/05 The era of superheroes >PDF
Regional Equity Research Contacts
Kenneth NG, CFA Head of Research T: (65) 6210 8610 E: [email protected]
———————————————————————————————————————————————————————————————————————————————————
Show Style "View Doc Map"
CIMB Conference / Events |
CIMB Malaysia Consumer Corporate Day 01 June 2016, Malaysia, Kuala Lumpur
———————————————————————————————————————————————————————————————————————————————————
CIMB 10th Annual Indonesia Conference 08-12 August 2016, Bali
———————————————————————————————————————————————————————————————————————————————————
IMPORTANT DISCLOSURES, INCLUDING ANY REQUIRED RESEARCH CERTIFICATIONS, ARE PROVIDED AT THE END OF THIS REPORT. IF THIS REPORT IS DISTRIBUTED IN THE UNITED STATES IT IS DISTRIBUTED BY CIMB SECURITIES (USA), INC. AND IS CONSIDERED THIRD-PARTY AFFILIATED RESEARCH.
Powered by the EFA Platform
China, Hong Kong│Equity research│May 31, 2016
Strategy Note
IMPORTANT DISCLOSURES, INCLUDING ANY REQUIRED RESEARCH CERTIFICATIONS, ARE PROVIDED AT THE END OF THIS REPORT. IF THIS REPORT IS DISTRIBUTED IN THE UNITED STATES IT IS DISTRIBUTED BY CIMB SECURITIES (USA), INC. AND IS CONSIDERED THIRD-PARTY AFFILIATED RESEARCH.
Powered by the EFA Platform
China, Hong Kong Strategy The rationale behind continuous southbound inflow
We have noticed continuous southbound inflow to H-shares via Stock Connect. ■ We see three rationales behind the inflow: 1) incentive to position offshore assets to ■hedge currency risk, 2) attractive valuation and 3) anticipation of SZ-HK Connect.
We maintain our positive market view on continuous southbound flow and a ■correction of previous overly-bearish sentiment.
The southbound flow favors 1) HSBC, 2) large SOEs such as Chinese banks and ■China Mobile and 3) Tencent.
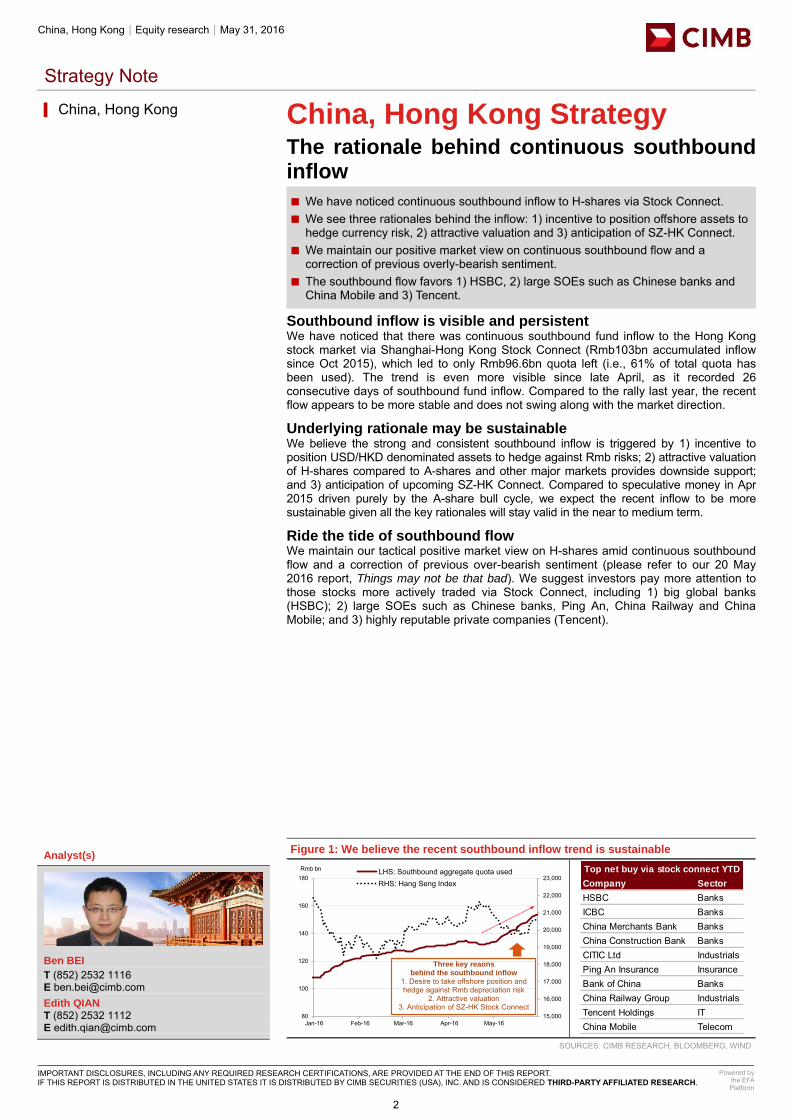
Southbound inflow is visible and persistent We have noticed that there was continuous southbound fund inflow to the Hong Kong stock market via Shanghai-Hong Kong Stock Connect (Rmb103bn accumulated inflow since Oct 2015), which led to only Rmb96.6bn quota left (i.e., 61% of total quota has been used). The trend is even more visible since late April, as it recorded 26 consecutive days of southbound fund inflow. Compared to the rally last year, the recent flow appears to be more stable and does not swing along with the market direction.
Underlying rationale may be sustainable We believe the strong and consistent southbound inflow is triggered by 1) incentive to position USD/HKD denominated assets to hedge against Rmb risks; 2) attractive valuation of H-shares compared to A-shares and other major markets provides downside support; and 3) anticipation of upcoming SZ-HK Connect. Compared to speculative money in Apr 2015 driven purely by the A-share bull cycle, we expect the recent inflow to be more sustainable given all the key rationales will stay valid in the near to medium term.
Ride the tide of southbound flow We maintain our tactical positive market view on H-shares amid continuous southbound flow and a correction of previous over-bearish sentiment (please refer to our 20 May 2016 report, Things may not be that bad). We suggest investors pay more attention to those stocks more actively traded via Stock Connect, including 1) big global banks (HSBC); 2) large SOEs such as Chinese banks, Ping An, China Railway and China Mobile; and 3) highly reputable private companies (Tencent).
[ X ]
Figure 1: We believe the recent southbound inflow trend is sustainable
SOURCES: CIMB RESEARCH, BLOOMBERG, WIND
▎China, Hong Kong
Analyst(s)
Ben BEI
T (852) 2532 1116 E [email protected] Edith QIAN T (852) 2532 1112 E [email protected]
15,000
16,000
17,000
18,000
19,000
20,000
21,000
22,000
23,000
80
100
120
140
160
180
Jan-16 Feb-16 Mar-16 Apr-16 May-16
Rmb bn LHS: Southbound aggregate quota usedRHS: Hang Seng Index
Three key reaons behind the southbound inflow
1. Desire to take offshore position and hedge against Rmb depreciation risk
2. Attractive valuation 3. Anticipation of SZ-HK Stock Connect
Company Sector
HSBC BanksICBC BanksChina Merchants Bank BanksChina Construction Bank BanksCITIC Ltd IndustrialsPing An Insurance InsuranceBank of China BanksChina Railway Group IndustrialsTencent Holdings ITChina Mobile Telecom
Top net buy via stock connect YTD
2
Commodities│ASEAN│Equity research
Sector Flash Note
IMPORTANT DISCLOSURES, INCLUDING ANY REQUIRED RESEARCH CERTIFICATIONS, ARE PROVIDED AT THE END OF THIS REPORT. IF THIS REPORT IS DISTRIBUTED IN THE UNITED STATES IT IS DISTRIBUTED BY CIMB SECURITIES (USA), INC. AND IS CONSIDERED THIRD-PARTY AFFILIATED RESEARCH.
Powered by the EFA Platform
Plantations Malaysia raises biodiesel mandates
Malaysia has agreed to raise the biodiesel blend for the transport sector to B10 and ■implement B7 in the industrial sector progressively, starting 1 Jun 2016.
The government estimates that this will raise biodiesel consumption to 709k tonnes. ■ This is mildly positive for regional planters and Malaysian biodiesel producers. ■Maintain Neutral and an average CPO price of RM2,450 per tonne for 2016.
Malaysia agrees to B10 for transport and B7 for industrial sector ● The Government of Malaysia has agreed to strengthen the biodiesel programme by
increasing the blend for the transport sector to B10 (blend of 10% palm methyl ester with 90% petroleum diesel) and implementing the B7 programme (blend of 7% palm methyl ester with 93% petroleum diesel) in the industrial sector (commercial and power generation sectors).
All diesel sold at retail pumps will be B10 starting Jun 2016 ● The government has revealed that both programmes will be implemented
progressively beginning in Jun 2016. All diesel sold at the retail pumps nationwide will be B10 effective Jun 2016. The B7 programme will be introduced for the first time in the industrial sector. However, it is not clear from the statement if B7 will be implemented fully or progressively starting 1 Jun 2016.
This will raise biodiesel consumption to 709,000 tonnes per annum ● The implementation of B10 for the transport sector and B7 for the industrial sector is
expected to contribute to annual consumption of 709,000 tonnes of biodiesel in Malaysia and lead to savings of 820m litres of diesel as well as 2.16m tonnes of carbon dioxide equivalent annually.
Stakeholders have been consulted on the higher biodiesel blend ● The government has conducted a series of stakeholders’ engagement with transport
sector representatives, petroleum companies and biodiesel producers on its plans to raise the biodiesel blend. In addition, the Federation of Malaysian Manufacturers (FMM), representing the industrial sector, was also consulted.
Projected potential biodiesel consumption lower than expected ● We are not surprised by the government’s move to raise the biodiesel blend as this
has been hinted before. However, we are slightly surprised by the government’s estimate that the higher biodiesel blend will only raise Malaysia’s biodiesel consumption to 709,000 tonnes. This is 34% lower compared to our calculation of 1.08m tonnes of biodiesel usage based on previous statistics provided.
● This also suggests that biodiesel consumption in Malaysia may increase by only 23% (or 134,000 tonnes) compared to the previous practice of the B7 blend for the transport sector, which was estimated to have absorbed 575,000 tonnes of biodiesel. We suspect the more conservative figure provided for biodiesel consumption could be due to lower diesel usage in Malaysia, following the removal of fuel subsidies.
Positive for CPO price but… ● This development is positive for CPO prices. However, the incremental demand for
palm oil is not as significant compared to earlier expectations at around 139,000 tonnes per annum or 0.7% of Malaysia’s 2016 palm oil output. Assuming the biodiesel mandates lead to a take-up of 709,000 tonnes of biodiesel uptake in 2016, it will only represent around 3.6% of Malaysia’s estimated CPO output and utilise 28% of total installed biodiesel capacity in Malaysia of approximately 2.5m tonnes.
● This is not as aggressive compared to Indonesia’s biodiesel targets of B20 (or 20% biodiesel blend) which is expected to raise biodiesel usage in Indonesia to 2.35m in 2016, representing around 7-8% of the country’s total CPO output. In view of our preliminary calculation that this policy will have only a marginal positive impact on incremental demand, we have kept our average CPO price forecast unchanged at RM2,450 per tonne for 2016 and RM2,600 for 2017.
Impact on planters and biodiesel players in Malaysia ● We are of the view that the higher biodiesel mandate will be mildly positive for
biodiesel producers in Malaysia (Sime, FGV, KLK, GENP and Wilmar) and CPO producers. However, this could be slightly negative for consumers who may have to fork out slightly higher retail diesel prices (which incorporates the blended biodiesel costs). Maintain Neutral with AALI, GENP and First Resources as our top picks.
▎ASEAN May 31, 2016 - 6:40 PM
Neutral (no change)
Highlighted companies
Astra Agro Lestari ADD, TP Rp17,000, Rp14,925 close
Astra Agro is our top pick among the Indonesian planters due to its strong corporate governance and attractive valuation.
First Resources Ltd ADD, TP S$1.98, S$1.61 close
Our preferred pick in Singapore for its superiour output growth prospects against peers, and low cost of production.
Genting Plantations ADD, TP RM11.80, RM10.62 close
We like its young estates, solid balance sheet and strong management.
Summary valuation metrics
Analyst(s)
Ivy NG Lee Fang, CFA
T (60) 3 2261 9073 E [email protected]
P/E (x) Dec-16F Dec-17F Dec-18F
Astra Agro Lestari 14.00 11.23 9.49 First Resources Ltd 21.94 10.74 8.78 Genting Plantations 36.74 21.86 19.21
P/BV (x) Dec-16F Dec-17F Dec-18F
Astra Agro Lestari 1.77 1.61 1.45 First Resources Ltd 1.76 1.58 1.40 Genting Plantations 1.84 1.73 1.62
Dividend Yield Dec-16F Dec-17F Dec-18F
Astra Agro Lestari 2.47% 1.68% 2.40%First Resources Ltd 1.37% 2.79% 3.41%Genting Plantations 0.67% 1.12% 1.27%
3

Consumer Discretionary│Hong Kong│Equity research│May 31, 2016
Sector Note
IMPORTANT DISCLOSURES, INCLUDING ANY REQUIRED RESEARCH CERTIFICATIONS, ARE PROVIDED AT THE END OF THIS REPORT. IF THIS REPORT IS DISTRIBUTED IN THE UNITED STATES IT IS DISTRIBUTED BY CIMB SECURITIES (USA), INC. AND IS CONSIDERED THIRD-PARTY AFFILIATED RESEARCH.
Powered by the EFA Platform
Environmental Minimum utilisation hours set for renewables
NEA has released the 2016 minimum utilisation hours for wind and solar power. ■ Nine provinces have the minimum wind power utilisation hours set at significant ■premium over the actuals in 2015
Datang Renewable may see 100% jump in FY16 net profit if effectively executed. ■ Huaneng Renewables and Longyuan may also see 12-23% earnings increase. ■ We reiterate Overweight call and Huaneng Renewables as top pick. ■
NEA sets minimum utilisation hours for wind and solar power Today, the National Energy Administration (NEA) has released further details about the Guaranteed Purchase of Renewable Power announced in Mar 2016. The 2016 minimum wind power utilisation hours of nine provinces are set at 1,800-2,000 hours and minimum solar power utilisation hours of eleven provinces are set at 1,300-1,500 hours. These minimum hours are applicable to 2016 and will be revised in the future.
Minimum utilisation hours at huge premium to hours in 2015 We believe this is positive for wind power producers. The minimum utilisation hours for wind power are at a significant premium over the utilisation hours achieved in 2015. Provinces with high premium include Gansu (52%), Jilin (26%), Heilongjiang (22-25%), Xinjiang (15-21%) and Ningxia (15%). These provinces suffered from severe power curtailment last year.
Datang Renewable’s FY16 earnings may double Datang Renewable (1798 HK, HOLD) is a key beneficiary as 65% of its FY16 wind power production is located in the nine provinces. We estimate that if the minimum utilisation hours are effectively executed, Datang Renewable would see an 8% increase in wind power generation and 100% increase in its FY16 net profit.
Huaneng Renewables would see 23% lift in FY16 net profit Huaneng Renewables (958 HK, ADD) has exposure in six of the nine provinces, which account for 54% of its wind power production in FY16. The effective execution of the minimum utilisation hours would lift its FY16 net profit by 23%. Longyuan’s (916 HK, ADD) FY16 net profit would be lifted by only 12% as it also has earnings contribution from coal-fired power.
Reiterate Overweight sector call There are uncertainties as to whether the minimum utilisation hours can be effectively executed, and if not whether the compensation can be satisfactorily received by the renewable energy producers. However, we still expect meaningful rebound in the utilisation hours of the three listed wind power producers. We reiterate our Overweight sector call and Huaneng Renewables as our top pick due to its potential earnings rebound and attractive FY16 P/E of 8.8x.
[ X ]
Figure 1: Minimum wind power utilisation hours set by NEA for 2016
SOURCES: CIMB RESEARCH, NEA
▎Hong Kong
Overweight (no change) Highlighted companies
China Longyuan Power ADD, TP HK$8.70, HK$5.34 close
Longyuan is the largest wind power producer in China, with a geographically diversified portfolio. We expect Longyuan to continue to add new capacity of 2-3GW p.a. in FY16-18.
Huaneng Renewables ADD, TP HK$3.70, HK$2.36 close
Huaneng Renewables is the wind power flagship arm of Huaneng Group and has expanded rapidly in the last few years. We think it is a beneficiary of the reduction in wind power curtailment in Inner Mongolia.
Summary valuation metrics
Analyst(s)
Keith LI
T (852) 2532 1110 E [email protected]
Minimum wind power 2015 wind power Upside/
Province utilisation hour utilisation hour (downside)
Hebei 2000 1808 10.6%Shanxi 1900 1697 12.0%Inner Mongolia 1,900-2,000 1865 1.9-7.2%Liaoning 1850 1780 3.9%Jilin 1800 1430 25.9%Heilongjiang 1,850-1,900 1520 21.7-25.0%Gansu 1800 1184 52.0%Ningxia 1850 1614 14.6%Xinjiang 1,800-1,900 1571 14.6-20.9%
P/E (x) Dec-16F Dec-17F Dec-18F
China Longyuan Power 8.76 7.46 6.57 Huaneng Renewables 8.83 7.12 5.93
P/BV (x) Dec-16F Dec-17F Dec-18F
China Longyuan Power 0.88 0.80 0.73 Huaneng Renewables 0.98 0.88 0.78
Dividend Yield Dec-16F Dec-17F Dec-18F
China Longyuan Power 2.28% 2.68% 3.04%Huaneng Renewables 1.81% 2.25% 2.70%
4

IT Services│India│Equity research│May 31, 2016
Company Note
IMPORTANT DISCLOSURES, INCLUDING ANY REQUIRED RESEARCH CERTIFICATIONS, ARE PROVIDED AT THE END OF THIS REPORT. IF THIS REPORT IS DISTRIBUTED IN THE UNITED STATES IT IS DISTRIBUTED BY CIMB SECURITIES (USA), INC. AND IS CONSIDERED THIRD-PARTY AFFILIATED RESEARCH.
Powered by the EFA Platform
MphasiS Improving growth outlook priced in
Mphasis’s 1.6% qoq decline in US$ revenues was higher than our expectation but ■HP channel revenue decline was lower than our forecast.
EBIT margin in 4QFY16 was better than expected. ■ HP channel sales likely to stabilise post completion of Blackstone deal by 2QFY17. ■ FY16 recurring net profit was above, at 102% of our forecast, due to higher-than-■expected margins. We raise our FY17-FY18F EPS by 3-6%.
Maintain Hold. Our target price is based on 1-year forward P/E of 12x. ■4QFY16 sales continued to dip; smaller decline in HP channel Post the 3.4% qoq dip in US$ sales (ex-forex) in 3Q, revenues fell 1.6% in 4Q. This was largely led by a qoq decline in digital risk due to a subdued performance by its project-based business. Revenues in HP channel declined by 1.2% qoq, the lowest decline rate in the last 19 quarters. Based on our estimates, growth in the direct international market (ex-digital risk) was ~3% which is healthy given the seasonal softness.
EBIT margins better than expected EBIT margin rose 108bp qoq to 14.3% vs. our expectation of a 30bp+. This was led by lower cost of revenues (with 2.2% dip in manpower costs) while SG&A cost rose to 12.1% vs. 11.3% in 3Q. With one-time charge of Rs316m (US$4.7m) in 4Q for future years’ losses in the domestic ATM business, it expects 60-70bp margin improvement in 1QFY17. It raised its EBIT guidance to 14-16% (albeit for 1HFY17) from 13-15%.
Blackstone Group deal likely to result in business stability… Blackstone Group recently said it plans to buy a majority stake in Mphasis from its parent HP, followed by an open offer at Rs457.5/share. This has resulted in changes to MSA with HP with minimum sales guarantee of US$990m over five years along with a preferred partner status to Mphasis (binding only post required regulatory approvals). This indicates US$198m yearly run rate (current US$220m). It will lead to stable/improving sales from HP and direct channel (with Blackstone’s large investee portfolio of 80 companies) after the deal is approved.
…but portfolio-related business risks remain However, business risks persist as: i) the announcement by HP-CSC for a merger of some IT services may result in lower outsourcing to partners given their combined large scale in global delivery locations (incl. India), ii) high project base revenues in digital risk (though worst of the decline is now behind) and risk of increasing mortgage rates in the US, and iii) increasing competitive pressures in the crowded BFSI sector, its only high focus non-HP business, and impact from any macro issues on discretionary projects.
Maintain Hold Despite the likely improvement in revenue predictability, we maintain Hold given the recent share price spike and other business risks. Our revised target price is based on 1-year forward P/E of 12x (up from 11x due to improving earnings visibility) and set at close to its 1-3 year mean. We expect a dividend announcement for FY16 before the AGM (likely in Sep) as no dividend was announced with the 4Q results. Key risk to our view include any faster and bigger-than-expected revenue ramp-up in HP channel.
▎India
HOLD (no change) Consensus ratings*: Buy 11 Hold 10 Sell 7
Current price: Rs506.3 Target price: Rs500.0 Previous target: Rs425.0
Up/downside: -1.2% CIMB / Consensus: 2.1%
Reuters: MBFL.BO Bloomberg: MPHL IN Market cap: US$1,584m Rs106,409m Average daily turnover: US$1.68m Rs112.1m Current shares o/s: 210.2m Free float: 39.5% * Source: Bloomberg Key changes in this note
FY17F US$ Revenue decreased by 0.8%. FY17F EPS increased by 3.2%. FY18F EPS increased by 5.8%.
Source: Bloomberg
Price performance 1M 3M 12M Absolute (%) 4.3 20.4 36.9 Relative (%) -0.1 4.2 40.9
Major shareholders % held EDS Group Companies 60.5 Aberdeen and related entities 6.4 LIC of India 1.6
Analyst(s)
Sandeep SHAH
T (91) 22 6602 5159 E [email protected]
[ X ]
SOURCE: COMPANY DATA, CIMB FORECASTS
Financial Summary Mar-15A Mar-16A Mar-17F Mar-18F Mar-19F
Revenue (Rsm) 57,949 60,879 62,236 68,231 74,801Net Profit (Rsm) 6,746 6,694 7,818 8,798 9,549Core EPS (Rs) 32.25 34.46 37.19 41.83 45.39Core EPS Growth (9.0%) 6.8% 7.9% 12.5% 8.5%FD Core P/E (x) 15.81 14.80 13.75 12.27 11.36Price To Sales (x) 1.84 1.75 1.71 1.56 1.42DPS (Rs) 16.00 17.23 18.59 20.91 22.69Dividend Yield 3.16% 3.40% 3.67% 4.13% 4.48%EV/EBITDA (x) 9.71 9.06 8.02 6.81 5.95P/FCFE (x) 10.44 NA 17.75 15.98 13.45Net Gearing (39.9%) (43.0%) (47.4%) (51.9%) (55.9%)P/BV (x) 1.94 1.82 1.73 1.63 1.54ROE 12.8% 12.8% 13.0% 13.9% 14.2%% Change In Core EPS Estimates 3.25% 5.78%CIMB/consensus EPS (x) 0.98 0.98
95.0
111.7
128.3
145.0
350
400
450
500
Price Close Relative to SENSEX (RHS)
1234
Jun-15 Sep-15 Dec-15 Mar-16
Vol m
5

Autos│India│Equity research│May 31, 2016
Company Note
IMPORTANT DISCLOSURES, INCLUDING ANY REQUIRED RESEARCH CERTIFICATIONS, ARE PROVIDED AT THE END OF THIS REPORT. IF THIS REPORT IS DISTRIBUTED IN THE UNITED STATES IT IS DISTRIBUTED BY CIMB SECURITIES (USA), INC. AND IS CONSIDERED THIRD-PARTY AFFILIATED RESEARCH.
Powered by the EFA Platform
Tata Motors Short-term relief in 4QFY16
■ Consolidated 4QFY16 EPS surged 60% qoq to Rs13.5, beating our estimate by 15%, due to lower depreciation and interest cost. EBITDA was in line.
■ Doubling of JLR’s China PAT qoq impressive; we raise JLR’s FY17-18 PAT by 2-7%. ■ We lift our consolidated FY17-18 EPS forecasts by 2-5% to factor in the strong
4QFY16, but await for sustained recovery of stand-alone entity to profitability. ■ Notwithstanding the strong 4QFY16, Tata faces risks of weakening product mix,
volatility at Brexit, and peaking global car demand. Maintain Reduce.
EBITDA margin recovers after dipping for five consecutive quarters JLR’s IGAAP EBITDA rose 20% yoy and qoq to £1.1bn, as EBITDA margin rose 70bp yoy and 110bp qoq to 16.1%, the first yoy increase since 2QFY15. Adjusted for £166m one-off costs, EBITDA would have been £1.26bn, beating our estimate by 20%. Sharp improvement in working capital (£1.16bn) and China JV profit (+123% qoq to £49m) were impressive, but management guides caution on both fronts.
Consolidated EBITDA in line At the standalone level, the company returned to a PBT profit of Rs682m, thanks to a 400bp qoq dip in raw material cost. EBITDA jumped 80% qoq to Rs10.7bn, 12% higher than our estimate. Consolidated EBITDA rose 34.7% yoy and 21.7% to Rs124.6bn, in line with our estimate but 25% higher than Bloomberg consensus. However, due to lower interest and depreciation expenses, normalised PAT was at Rs45.7bn (+60% qoq), surprising us on the upside by 15%.
JLR profit upgrade by 2-7% Good response to the new Jaguar crossover, F-Pace, is encouraging. However, the yoy decline in JLR’s most profitable segment, Range Rover and Range Rover Sport, in 4QFY16 (Fig 6) is a concern. The much awaited Jaguar XE launch in the US may further dilute JLR’s product mix and profitability especially as the US car market seems to be weakening. As such, we upgrade JLR’s PAT by only 2-7% for FY17-18, even as we build in EBIDTA margin of 15.6% on the back of strong sales volume CAGR of 17%.
Consolidated FY17-18 EPS raised by 2-5% For the standalone entity, we raise our FY17-18 EPS estimates by 2% on back of the recovery in light commercial vehicle (LCV) sales, and foresee EBITDA margin pressure in FY18F due to emission upgrade costs. As for the consolidated entity, we marginally raise our EBITDA forecast for FY17-18 and factor in the lower depreciation seen in 4QFY16 leading to EPS upgrades. Working capital surprises are subject to new product success and strong demand, which may be difficult to sustain in the coming quarters, in our view.
Reduce rating maintained Tata’s sharp bounce back in recent months has priced in its 4QFY16 sales volume and margin recovery. As the weakness of JLR’s premium SUV portfolio and new products will likely dilute its margin, we see unfavourable risk reward at current stock price, especially in view of peaking global car demand and Brexit volatility. We keep our non-consensus Reduce rating with a higher SOP-based target price as we roll forward our valuation; JLR still valued at 2x EV/EBITDA.
▎India
REDUCE (no change) Consensus ratings*: Buy 43 Hold 4 Sell 1
Current price: Rs459.7 Target price: Rs340.0 Previous target: Rs289.1
Up/downside: -26.0% CIMB / Consensus: -24.2%
Reuters: TAMO.BO Bloomberg: TTMT IN Market cap: US$22,139m Rs1,487,019m Average daily turnover: US$48.00m Rs3,942m Current shares o/s: 3,396m Free float: 67.0% * Source: Bloomberg Key changes in this note
FY17-18F Revenue cut by 1-4%. FY17-18F EPS increased by 2-5%.
Source: Bloomberg
Price performance 1M 3M 12M Absolute (%) 12.6 53.4 -4.6 Relative (%) 8.5 37.5 -0.4
Major shareholders % held Tata Group 33.0 LIC 6.9 ICICI Pru Life 2.3
Analyst(s)
Pramod AMTHE
T (91) 22 6602 5167 E [email protected]
[ X ]
SOURCE: COMPANY DATA, CIMB FORECASTS
Financial Summary Mar-15A Mar-16A Mar-17F Mar-18F Mar-19F
Revenue (Rsm) 2,627,963 2,752,785 3,090,166 3,803,908 4,417,343Operating EBITDA (Rsm) 421,460 396,390 478,483 587,559 674,103Net Profit (Rsm) 139,863 110,238 138,133 170,672 201,126Core EPS (Rs) 44.11 33.08 40.68 50.26 59.23Core EPS Growth 0.0% (25.0%) 23.0% 23.6% 17.8%FD Core P/E (x) 10.42 13.89 11.30 9.15 7.76DPS (Rs) 0.00 0.20 3.00 4.00 5.00Dividend Yield 0.00% 0.04% 0.65% 0.87% 1.09%EV/EBITDA (x) 4.70 4.72 3.81 2.96 2.17P/FCFE (x) 64.93 NA 29.66 13.07 5.61Net Gearing 73.2% 37.0% 26.7% 15.2% (8.4%)P/BV (x) 2.77 1.93 1.67 1.42 1.21ROE 24.6% 16.4% 15.9% 16.8% 16.8%% Change In Core EPS Estimates 4.49% 2.28%CIMB/consensus EPS (x) 0.93 0.94
65.073.081.089.097.0105.0
250300350400450500
Price Close Relative to SENSEX (RHS)
50
100
150
Jun-15 Sep-15 Dec-15 Mar-16
Vol m
6

Indonesia│Equity research│May 31, 2016
Strategy Note
IMPORTANT DISCLOSURES, INCLUDING ANY REQUIRED RESEARCH CERTIFICATIONS, ARE PROVIDED AT THE END OF THIS REPORT. IF THIS REPORT IS DISTRIBUTED IN THE UNITED STATES IT IS DISTRIBUTED BY CIMB SECURITIES (USA), INC. AND IS CONSIDERED THIRD-PARTY AFFILIATED RESEARCH.
Powered by the EFA Platform
Indonesia Strategy CIMB Portfolio Tracker – May 2016
CIMB Portfolio lost 1.3% mom in May, underperforming JCI by 0.4%%. Last minute ■selling of BMRI and ACES roiled our portfolio. YTD it returned 6.6% vs. JCI’s 4.4%.
It was a volatile May with foreigners leading the selling until the last week of May ■when mood brightened despite the higher probability of an FFR hike in summer.
Lacking corporate news, FFR and Brexit decisions may cloud market sentiment in ■Jun, while the passing of tax amnesty could just cheer it up.
We expect tax amnesty to be positively decided, hence we rotate to laggards and ■cyclicals.
The selling mood eases… CIMB portfolio declined -1.3% mom in May against the benchmark JCI’s -0.9%. It gained 6.6% YTD vs. JCI’s 4.4%. In May, the key outperformers were the infra, property/construction and consumer sectors. The key underperformers were commodities and basic materials, the latter being led by INTP.
…despite higher chances of a summer Fed Funds Rate (FFR) hike The mood turned cheerier towards month-end, despite the higher probability of a summer FFR hike. Bank shares tumbled initially, made a mini U-turn, and ended withaggregate losses of only -0.7% mom. Foreigners turned net buyers of US$89m in the fourth week of May, trimming its net sold to US$17m for the month (vs. +US$22m in Apr, with YTD net buy of +US$320m). The key outperformers in CIMB’s portfolio were TLKM, WSKT and PWON, while the key underperformers were BMRI, INTP and ACES.
Which shall triumph in Jun: external or internal drivers? The external risks are the FFR decision in mid-Jun and Brexit referendum on 23 Jun. Judging by the calmer mood at end-May, the former is possibly priced in, though the market is arguably still complacent over the latter. Internally, the tax amnesty’s fate is the game changer. Meanwhile, macro indicators point to further stabilisation of the current account deficit (CAD) and inflation. Expect more stimulus from the government and BI equally to further boost growth.
Putting more weight on laggards and cyclicals In our view, tax amnesty shall: 1) be passed by end-Jul at the latest, with newsflow turning more supportive in Jun; 2) lift local consumer’s sentiment and the capital market’s mood. This forms basis of our view that underperformers and cyclicals mighthence see better days. Such and valuations underpin our reshuffling: 1) replacing INTP with SMGR; 2) INDF with BSDE; 3) cut WSKT, replace with laggards and cheaper PTPP and WIKA; 4) trim defensive HMSP, cut expensive SCMA while adding BSDE, PTPP and WIKA to the balance.
The new metrics After the adjustments, the weighted average of CIMB’s portfolio valuation is 17.4x forward P/E, about in line with market valuations (including HMSP) of 16.9x forward P/E. The adjusted portfolio’s beta is relatively unchanged at 1.2. The weighted forward ROE is 30% vs. JCI’s 17% against the weighted-average cost of equity estimate of 19%.
[ X ]
Figure 1: CIMB Portfolio has outperformed JCI by 2.8% YTD
SOURCES: CIMB RESEARCH, COMPANY
▎Indonesia
CIMB portfolio outperformed JCI by 0.2% in May
Change in weighting
Analyst(s)
Erwan TEGUH T (62) 21 3006 1720 E [email protected] Peter P. SUTEDJA, CFA T (62) 21 3006 1726 E [email protected]
9698
100102104106108110112
CIMB Portfolio JCI
-1.2%
-1.0%
-0.8%
-0.6%
-0.4%
-0.2%
0.0%
0.2%
0.4%
0.6%
0.8%
-4.5%
-4.0%
-3.5%
-3.0%
-2.5%
-2.0%
-1.5%
-1.0%
-0.5%
0.0%
0.5%
1.0%
30-Apr-16 14-May-16 28-May-16
Outperform (Underperform) - RHS
CIMB Portfolio
JCI
Old weight New weight NoteHMSP 8% 7%SMGR 0% 6% AdditionBSDE 0% 5% AdditionPTPP 0% 3% AdditionWIKA 0% 3% AdditionINTP 6% 0% DroppedWSKT 4% 0% DroppedINDF 4% 0% DroppedSCMA 2% 0% Dropped
7
Shipbuilding│South Korea│Equity research
Company Flash Note
IMPORTANT DISCLOSURES, INCLUDING ANY REQUIRED RESEARCH CERTIFICATIONS, ARE PROVIDED AT THE END OF THIS REPORT. IF THIS REPORT IS DISTRIBUTED IN THE UNITED STATES IT IS DISTRIBUTED BY CIMB SECURITIES (USA), INC. AND IS CONSIDERED THIRD-PARTY AFFILIATED RESEARCH.
Powered by the EFA Platform
Hyundai Mipo Dockyard STX windfall – full consolidation ahead
STX has filed for court receivership on 30 May. We see consolidation rapidly picking ■up pace for PCs, along with the recent acquisition deal failure of SPP Shipbuilding.
We think 25-30 units of STX’s orders could be cancelled (of a total 54 units in the ■backlog), and potentially redirected to HMD at a firm newbuild price and 5-7% OPM.
We maintain our Add recommendation and SOP-based target price of W140,000. ■
Why we believe patience will be rewarded ● According to FSS disclosure, STX O&S officially filed for court receivership on 30 May.
While the final outcome is subject to the Central District Court’s decision, we expect STX’s major newbuild activities to come to a halt in the near term (except for those ships targeting imminent delivery). This event also follows the recently failed deal between SPP and SM Group, foreshadowing another potential consolidation, in our view.
● As contracts typically entail clauses related to liquidation damage and counterparty risks, we see growing cancellation risks to STX’s current order book, as owners will be exempt from cancellation charges and refund-guarantee loans remain valid.
● STX’s previous contracts will sequentially be redirected to HHI Group, in our view, especially for those from tier-1 owners (who previously placed orders to STX), which look set to undergo renegotiation of contract terms for new vessel spectrum.
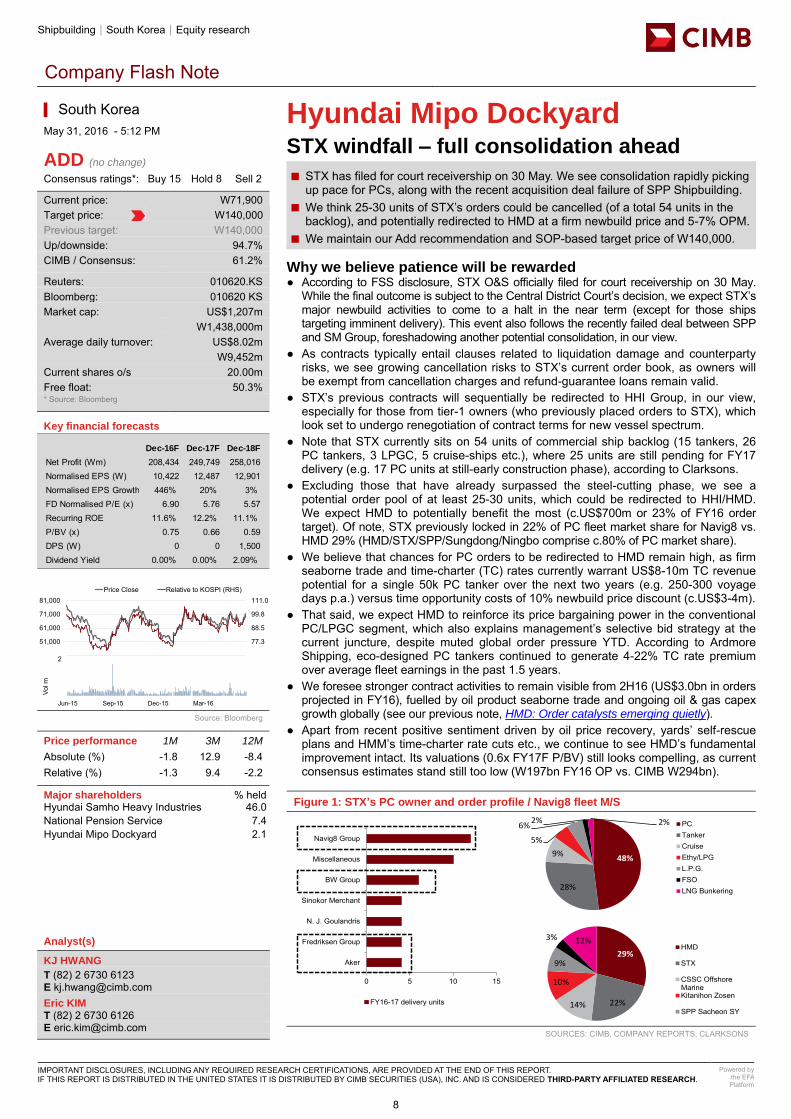
● Note that STX currently sits on 54 units of commercial ship backlog (15 tankers, 26 PC tankers, 3 LPGC, 5 cruise-ships etc.), where 25 units are still pending for FY17 delivery (e.g. 17 PC units at still-early construction phase), according to Clarksons.
● Excluding those that have already surpassed the steel-cutting phase, we see a potential order pool of at least 25-30 units, which could be redirected to HHI/HMD. We expect HMD to potentially benefit the most (c.US$700m or 23% of FY16 order target). Of note, STX previously locked in 22% of PC fleet market share for Navig8 vs. HMD 29% (HMD/STX/SPP/Sungdong/Ningbo comprise c.80% of PC market share).
● We believe that chances for PC orders to be redirected to HMD remain high, as firm seaborne trade and time-charter (TC) rates currently warrant US$8-10m TC revenue potential for a single 50k PC tanker over the next two years (e.g. 250-300 voyage days p.a.) versus time opportunity costs of 10% newbuild price discount (c.US$3-4m).
● That said, we expect HMD to reinforce its price bargaining power in the conventional PC/LPGC segment, which also explains management’s selective bid strategy at the current juncture, despite muted global order pressure YTD. According to Ardmore Shipping, eco-designed PC tankers continued to generate 4-22% TC rate premium over average fleet earnings in the past 1.5 years.
● We foresee stronger contract activities to remain visible from 2H16 (US$3.0bn in orders projected in FY16), fuelled by oil product seaborne trade and ongoing oil & gas capex growth globally (see our previous note, HMD: Order catalysts emerging quietly).
● Apart from recent positive sentiment driven by oil price recovery, yards’ self-rescue plans and HMM’s time-charter rate cuts etc., we continue to see HMD’s fundamental improvement intact. Its valuations (0.6x FY17F P/BV) still looks compelling, as current consensus estimates stand still too low (W197bn FY16 OP vs. CIMB W294bn).
Figure 1: STX’s PC owner and order profile / Navig8 fleet M/S
SOURCES: CIMB, COMPANY REPORTS, CLARKSONS
48%
28%
9%
5%
6%2% 2% PC
TankerCruiseEthy/LPGL.P.G.FSOLNG Bunkering
0 5 10 15
Aker
Fredriksen Group
N. J. Goulandris
Sinokor Merchant
BW Group
Miscellaneous
Navig8 Group
FY16-17 delivery units
29%
22%14%
10%
9%
3% 12%HMD
STX
CSSC OffshoreMarineKitanihon Zosen
SPP Sacheon SY
▎South Korea May 31, 2016 - 5:12 PM
ADD (no change) Consensus ratings*: Buy 15 Hold 8 Sell 2
Current price: W71,900 Target price: W140,000 Previous target: W140,000
Up/downside: 94.7% CIMB / Consensus: 61.2%
Reuters: 010620.KS Bloomberg: 010620 KS Market cap: US$1,207m W1,438,000m Average daily turnover: US$8.02m W9,452m Current shares o/s 20.00m Free float: 50.3% * Source: Bloomberg Key financial forecasts
Source: Bloomberg Price performance 1M 3M 12M
Absolute (%) -1.8 12.9 -8.4 Relative (%) -1.3 9.4 -2.2
Major shareholders % held Hyundai Samho Heavy Industries 46.0 National Pension Service 7.4 Hyundai Mipo Dockyard 2.1
Analyst(s)
KJ HWANG
T (82) 2 6730 6123 E [email protected] Eric KIM T (82) 2 6730 6126 E [email protected]
Dec-16F Dec-17F Dec-18F
Net Profit (Wm) 208,434 249,749 258,016Normalised EPS (W) 10,422 12,487 12,901Normalised EPS Growth 446% 20% 3%FD Normalised P/E (x) 6.90 5.76 5.57Recurring ROE 11.6% 12.2% 11.1%P/BV (x) 0.75 0.66 0.59DPS (W) 0 0 1,500Dividend Yield 0.00% 0.00% 2.09%
66.0
77.3
88.5
99.8
111.0
41,000
51,000
61,000
71,000
81,000Price Close Relative to KOSPI (RHS)
1
1
2
Jun-15 Sep-15 Dec-15 Mar-16
Vol m
8

Chemicals - Others│South Korea│Equity research
Company Flash Note
IMPORTANT DISCLOSURES, INCLUDING ANY REQUIRED RESEARCH CERTIFICATIONS, ARE PROVIDED AT THE END OF THIS REPORT. IF THIS REPORT IS DISTRIBUTED IN THE UNITED STATES IT IS DISTRIBUTED BY CIMB SECURITIES (USA), INC. AND IS CONSIDERED THIRD-PARTY AFFILIATED RESEARCH.
Powered by the EFA Platform
Kolon Industries Asia NDR feedback: All eyes on CPI
We found that investors were keen on the potential of CPI film which seems to be ■the only one that passed the quality standard of its prospective customer.
The management reassured investors on the company’s commitment to capacity ■expansion for its core products that are seeing sustained margin improvements.
Upside risks: expansion announcement and introduction of foldable mobile devices. ■
Key takeaways We hosted an Asia NDR with management of Kolon Industries (KI). Key takeaways include: 1) further margin improvement potential of tyre cord upon competitor’s change in pricing policy; 2) volume expansion of airbag fabric after completion of manufacturing plant in Mexico; 3) further capacity expansion plans on key industrial materials products; and 4) development stage of colourless polyimide (CPI) film and its potential as the protective cover for foldable and unbreakable mobile devices.
All eyes on CPI film ● Most investors were keen to learn more on the potential of CPI film given its potential
as the key to enable foldable mobile devices. More interestingly, KI claimed that only its CPI film passed the quality standard of its largest prospective customer. We believe that KI’s continued efforts on developing the product since 2005 and working with the customer in the past three years have helped the company to come up with light transmission rate close to c.94-95% level vs. competitors at 87-89% (Mar 2015).
Company’s plans for the CPI film ● The company was not able to share potential price range, volume or margin given
that CPI film is not yet mass produced (previously produced on order of customers at a lab). Also, the company expects its production yield to be low in the initial production stage starting from Jun. However, the management guided that unit price would be higher than Gorilla Glass and current pilot capacity will be sufficient to meet demand for the first generation of foldable mobile phone in 2017.
Upcoming capacity expansion plans ● The management also highlighted its growth potential from capacity expansion for: 1)
polyester tyre cord in Vietnam (adding c.20% to current capacity); 2) air bag fabric in China and Mexico (2H16); 3) de-bottlenecking aramid production (additional 60% capacity); 4) participation in equity raising by subsidiary Kolon Plastic (138490 KS, N/R) for a new engineering plastic (POM) plant in joint venture with BASF (BAS GR, N/R); and 5) mass production line of CPI film that will increase its capacity by fivefold.
Re-iterate Add ● Maintain Add, with a target price of W83k based on an SOP valuation which implies
10x 2016 P/E. We think the company could re-rate on potential key catalysts, including: 1) further improvement in industrial materials margins; 2) official announcement of capacity expansion plans and 3) introduction of foldable mobile devices adopting KI’s CPI film. Key risks include slowdown in auto parts including tyres, earlier than expected technological advancement in CPI film of competitors.
Figure 1: We think current prices of protective film for smartphones may serve as a guideline to the price range of KI’s CPI film
NOTE: BASED ON LOWEST PRICE ON KOREA NAVER SHOPPING PRICE COMPARISON FOR PROTECTIVE FILM OF
IPHONE 6S FRONT DISPLAY (4.7 INCH) / ASSUME USDKRW=1,180 / SOURCES: CIMB, NAVER SHOPPING
HohooSky Digital
Glass protectorTraum
NewPlus
OHI
Araree ProtectM Glass Gorilla
Iloome Korea
SuperF
LuvN
Liphobia
ProtectM Guard BP
ViewfineProtectM Embo Matt
0
5
10
15
20
25
30
35
90% 91% 92% 93% 94% 95% 96% 97% 98% 99% 100%
(US$)
(Transparency rate)
More than 100% price premium forhigh quality protective cover based on Gorilla Glass overaverage products
(Note: PET-based cover in blue, glass-based cover in red)
▎South Korea May 31, 2016 - 6:00 PM
ADD (no change) Consensus ratings: Buy 11 Hold 0 Sell 0
Current price: W69,200 Target price: W83,000 Previous target: W83,000
Up/downside: 19.9% CIMB / Consensus: -10.2%
Reuters: 120110.KS Bloomberg: 120110 KS Market cap: US$1,459m W1,738,331m Average daily turnover: US$6.37m W7,409m Current shares o/s 25.10m Free float: 61.3% Key financial forecasts
Source: Bloomberg Price performance 1M 3M 12M
Absolute (%) -1 3 3.7 Relative (%) -0.5 -0.5 9.9
Major shareholders % held Kolon Corp, etc 33.7 National Pension Service 12.2 KB Asset Management 6.4
Analyst(s)
TJ OK
T (82) 2 6730 6134 E [email protected]
Dec-16F Dec-17F Dec-18F
Net Profit (Wb) 230.5 260.8 279.3Normalised EPS (W) 9,181 10,390 11,124Normalised EPS Growth 13.2% 7.1%FD Normalised P/E (x) 8.51 7.52 7.02Recurring ROE 12.2% 12.3% 12.0%P/BV (x) 0.86 0.77 0.72DPS (W) 900 1,000 1,100Dividend Yield 1.30% 1.45% 1.59%
81.0
93.9
106.7
119.6
46,000
56,000
66,000
76,000
Price Close Relative to KOSPI (RHS)
200
400
600
Jun-15 Sep-15 Dec-15 Mar-16
Vol t
h
9

Retail│Malaysia│Equity research│May 31, 2016
Company Note
IMPORTANT DISCLOSURES, INCLUDING ANY REQUIRED RESEARCH CERTIFICATIONS, ARE PROVIDED AT THE END OF THIS REPORT. IF THIS REPORT IS DISTRIBUTED IN THE UNITED STATES IT IS DISTRIBUTED BY CIMB SECURITIES (USA), INC. AND IS CONSIDERED THIRD-PARTY AFFILIATED RESEARCH.
Powered by the EFA Platform
7-Eleven Malaysia Holdings Berhad Growth priced in
■ We maintain our neutral stance on 7-Eleven’s earnings prospects. ■ Gunning ahead with plans to increase store count and refurbish its stores in 2016. ■ Maintain Hold, with unchanged 12-month target price of RM1.36. We prefer Bison,
which trades at a more attractive valuation. ■ Upside risks include stronger-than-expected consumer sentiment and the continuity
of its franchise scheme. ■ Downside risks include increased competition from domestic and foreign players.
1Q16 results briefing We attended 7-Eleven’s 1Q16 analyst briefing earlier today. It was chaired by CEO Mr Gary Brown. There were no major surprises but management pointed out that it had deliberately held back its store expansion during the quarter as the group did not want to complicate the implementation of its new IT system. Nonetheless, it emphasised that its expansion plants are back on track. The topics discussed mainly revolved around the group’s 1Q16 performance and its key strategies for 2016.
GP margin expanded due to improved product mix Recall that 7-Eleven’s 1Q16 revenue increased 4.2% yoy while core net profit grew 10.8% yoy to RM15.9m. The stronger topline growth was mainly driven by new stores (net seven stores for 1Q16) and improved product mix. Its GP margin also grew 0.4% yoy to 30.4%, mainly coming from higher sales of its health and beauty products (+9% yoy) and good coffee sales (which typically carry higher margins).
Other key briefing highlights 1) Tobacco sales has not bounced back (down 15-20% yoy) vs. previous years given the significant hike in selling prices last year; 2) expansion and refurbishment plans are on track for the year despite the intentional slow down in store expansion in 1Q16; and 3) 7-Eleven is positive on its long-term partnership with Brahim’s to manufacture ready-to-eat (RTE) products under its “Fresh to Go” house brand. It is currently removing smaller suppliers and will eventually push more for Brahim’s food manufacturing.
Maintain Hold call; target price stays at RM1.44 While we like the group’s healthy expansion and refurbishment plans so far, we believe these have already been factored into its share price. As such, we make no changes to our call and target price. Our target price is still based on CY17F P/E of 23.6x (20% premium over its global peer average). We prefer Bison Consolidated (BISON MK, Add, TP: RM1.80) in the convenience store sector given its healthy 3-year earnings CAGR of 27% and undemanding valuations.
▎Malaysia
HOLD (no change) Consensus ratings*: Buy 0 Hold 3 Sell 2
Current price: RM1.36 Target price: RM1.44 Previous target: RM1.44
Up/downside: 5.5% CIMB / Consensus: 0.3%
Reuters: SEM.KL Bloomberg: SEM MK Market cap: US$386.9m RM1,593m Average daily turnover: US$0.15m RM0.59m Current shares o/s: 1,233m Free float: 49.0% * Source: Bloomberg Key changes in this note
No changes.
Source: Bloomberg
Price performance 1M 3M 12M Absolute (%) -2.2 -6.2 -20.9 Relative (%) 0.4 -4.7 -14.2
Major shareholders % held Berjaya Retail 51.0 Genesis Investment 6.8 Smallcap world fund 6.2
Analyst(s)
Kristine WONG
T (60) 3 2261 9085 E [email protected]
[ X ]
SOURCE: COMPANY DATA, CIMB FORECASTS
Financial Summary Dec-14A Dec-15A Dec-16F Dec-17F Dec-18F
Revenue (RMm) 1,893 2,006 2,226 2,543 2,882Operating EBITDA (RMm) 117.0 122.9 133.0 153.2 169.5Net Profit (RMm) 57.01 55.80 63.95 74.89 82.90Core EPS (RM) 0.046 0.045 0.052 0.061 0.067Core EPS Growth 10.1% (2.1%) 14.6% 17.1% 10.7%FD Core P/E (x) 29.44 30.06 26.23 22.40 20.23DPS (RM) 0.051 0.051 0.031 0.036 0.040Dividend Yield 3.75% 3.75% 2.29% 2.68% 2.97%EV/EBITDA (x) 12.32 12.67 11.50 9.75 8.51P/FCFE (x) NA 35,689 25 21 17Net Gearing (100%) (71%) (83%) (89%) (98%)P/BV (x) 7.10 9.86 9.47 8.10 6.98ROE 36.8% 27.5% 36.8% 39.0% 37.1%CIMB/consensus EPS (x) 0.98 0.98 0.97
79.0
89.0
99.0
109.0
1.300
1.500
1.700
1.900Price Close Relative to FBMKLCI (RHS)
2468
Jun-15 Sep-15 Dec-15 Mar-16
Vol m
10

Retail│Malaysia│Equity research│May 31, 2016
Company Note
IMPORTANT DISCLOSURES, INCLUDING ANY REQUIRED RESEARCH CERTIFICATIONS, ARE PROVIDED AT THE END OF THIS REPORT. IF THIS REPORT IS DISTRIBUTED IN THE UNITED STATES IT IS DISTRIBUTED BY CIMB SECURITIES (USA), INC. AND IS CONSIDERED THIRD-PARTY AFFILIATED RESEARCH.
Powered by the EFA Platform
Asia File Corporation 4QFY16 results: Profit margin expansion
At 98% of our full-year forecast, Asia File’s FY3/16 net profit was in line with our ■expectations.
9 sen final DPS was declared for 4Q. In FY16, total DPS of 16 sen was declared, ■above our 13 sen forecast.
Management focused on profit margin expansion in FY16. ■ RM135m (US$33m) net cash or RM0.70 net cash per share at end-FY16. ■ Upgrade from Hold to Add. ■
FY16 net profit up 54% yoy FY16 revenue growth was only 0.6% yoy but net profit growth was higher at 54% yoy. The higher net profit was mainly due to wider profit margins. FY16 EBITDA margin was 26% compared to 18% in FY15. Final DPS of 9 sen was declared, above our expectation of 13 sen. Total DPS of 16 sen was declared in FY16.
Forex loss in 4QFY16 Given the strong ringgit environment in 4QFY16, the company posted a RM2.8m (US$6.9m) forex loss during the quarter. However, the ringgit has started to show weakness against major currencies since Apr this year. For FY16, the company recorded RM6.2m (US$1.4m) forex gain.
Europe is still main revenue contributor Asia File’s main market is still Europe and the UK, which contributed more than 65% of the group’s revenue in FY16. The group’s second-largest market was Malaysia, which contributed less than 10% of FY16 sales.
Consolidation phase in the past year After purchasing overseas assets in the past few years, Asia File has been consolidating its business in the past year. Management’s main focus this financial year was profit margin expansion, as quarterly revenue stabilised at the RM90m-100m (US$42-46m) levels. The company achieved higher profit margin in FY16 mainly through better production efficiency and more favourable product mix.
Cash-rich balance sheet At end-Mar, the company’s balance sheet was in net cash position of RM135m (US$33m) or 70 sen net cash per share. The strong balance sheet would allow the company to acquire any of its financially-troubled competitors, if the opportunity arises.
Upgrade from Hold to Add We maintain FY17-18 EPS and introduce FY19 EPS. Our target price is unchanged at 10.8x CY17 P/E (10% discount to sector target P/E of 12x in order to reflect its small free float and market cap). After the 20% share price correction in Mar, Asia File’s valuation is now attractive at less than 10x CY17 P/E. As such, we upgrade the stock from Hold to Add. Re-rating catalysts include continued profit margin expansion and undemanding stock valuations. Risk is sharp slowdown in Europe’s economy.
▎Malaysia
ADD (previously HOLD) Consensus ratings: Buy 0 Hold 1 Sell 0
Current price: RM4.27 Target price: RM5.14 Previous target: RM5.14
Up/downside: 20.4% CIMB / Consensus: 0.0%
Reuters: AFCB.KL Bloomberg: AF MK Market cap: US$198.6m RM819.8m Average daily turnover: US$0.02m RM0.10m Current shares o/s: 180.5m Free float: 28.7% Key changes in this note
Introduced FY19 EPS.
Source: Bloomberg
Price performance 1M 3M 12M Absolute (%) -2.5 -13.7 25.6 Relative (%) 0.3 -12 32.6
Major shareholders % held Prestige Elegance S/B 47.2 Amanah Raya Trustee 24.1
Analyst(s)
Nigel FOO
T (60) 3 2261 9069 E [email protected]
[ X ]
SOURCE: COMPANY DATA, CIMB FORECASTS
Financial Summary Mar-15A Mar-16A Mar-17F Mar-18F Mar-19F
Revenue (RMm) 381.0 389.9 405.5 425.8 442.8Operating EBITDA (RMm) 71.3 84.6 95.7 102.7 108.2Net Profit (RMm) 50.20 76.60 82.95 86.90 91.25Core EPS (RM) 0.28 0.35 0.39 0.42 0.44Core EPS Growth (16.9%) 24.7% 12.3% 7.9% 5.7%FD Core P/E (x) 15.35 12.31 10.96 10.16 9.61DPS (RM) 0.11 0.16 0.16 0.16 0.16Dividend Yield 2.58% 3.75% 3.75% 3.75% 3.75%EV/EBITDA (x) 9.61 7.82 6.55 5.64 4.86P/FCFE (x) 36.70 27.66 16.14 12.44 11.42Net Gearing (18.5%) (21.4%) (25.7%) (31.1%) (36.0%)P/BV (x) 1.67 1.51 1.37 1.25 1.13ROE 11.3% 12.9% 13.1% 12.9% 12.3%% Change In Core EPS Estimates 0% 0%CIMB/consensus EPS (x) 1.18 1.15
92
119
145
172
2.80
3.80
4.80
5.80Price Close Relative to FBMKLCI (RHS)
1
2
3
Jun-15 Sep-15 Dec-15 Mar-16
Vol m
11

TV - Satellite│Malaysia│Equity research│May 31, 2016
Company Note
IMPORTANT DISCLOSURES, INCLUDING ANY REQUIRED RESEARCH CERTIFICATIONS, ARE PROVIDED AT THE END OF THIS REPORT. IF THIS REPORT IS DISTRIBUTED IN THE UNITED STATES IT IS DISTRIBUTED BY CIMB SECURITIES (USA), INC. AND IS CONSIDERED THIRD-PARTY AFFILIATED RESEARCH.
Powered by the EFA Platform
Astro Malaysia A good start to the year
Astro posted a good set of results, as 1QFY17 net profit was broadly in line at 28% ■of our and Bloomberg consensus FY1/17 estimates.
Core EPS rose 6.5% yoy in 1QFY17 due to stronger TV and radio adex growth, ■lower depreciation charges and higher finance income.
Astro is exploring potential price revision for its sports package subs in 2HFY17. ■ It declared an interim DPS of 3 sen, which was in line with our expectations. ■ Maintain Add and target price. Astro remains our top pick due to its dominant market ■position and lower sensitivity to adex volatility.
1QFY17 results broadly in line Revenue in 1QFY17 increased by 2.5% yoy, driven by advertising revenue that rose from RM132m (US$32.1m) in 1QFY16 to RM150m (US$36.5m) in 1QFY17 and robust home shipping sales that surged 74% yoy. Overall, Astro posted higher 1QFY17 core net profit of RM179m (US$43.6m), up 6.5% yoy, after adjusting for unrealised forex gain.
NJOI to drive new subscribers growth At end-Apr 2016, Astro had reached 69% of Malaysian TV households with over 3.5m pay-TV subs. While NJOI (subscription-free satellite TV service) customers contribute lower ARPU, they present a huge base of 1.4m potential customers who could switch to the pay-TV platform. Astro targets to add 250k NJOI customers in FY17. Management said that 33k NJOI customers switched over to the pay-TV platform in FY16.
Aspiring to be platform-agnostic provider Astro aspires to be a platform-agnostic content provider in order to stay relevant and capture the shift in content consumption from TV to online. Astro has launched an online video service called “Tribe” in its bid to extend its customer reach beyond Malaysia, following its launch in Indonesia. Management is targeting launch Tribe service in Philippines in 2HFY17 following its recent tie-up with Globe Telecom.
Potential price revision in 2HFY17 Pay-TV ARPU fell by 0.3% qoq in 1QFY17. Management attributed the decline to churn from low-paying subs, with monthly ARPU of below RM60. Management maintains its ARPU guidance of RM100 for FY17. We have assume an ARPU of RM100 in FY17 and RM102 in FY18. Astro is planning to carry out price revision for its sports package subs in 2HFY17, partly to offset the rising content cost for sports programmes.
Astro Go Shop on track to break even in FY17 The home shopping segment posted 74% yoy revenue growth in 1QFY17, driven by increase in products sold. It also posted yoy lower loss before tax of RM2.9m (US$700k) in 1QFY17 versus RM4.1m (US$1m) in 1QFY16. We expect home shipping segment to break even at pretax level this year driven by stronger sales.
Maintain Add and target price Maintain Add with an unchanged DCF-based target price of RM3.36. Astro remains our sector top pick due to its defensive earnings and dominant market position (69% household penetration at end-Apr 2016). Rising ARPU from value-added services and stronger home shopping contribution are potential catalysts. Key risks to our Add call are decline in premium subs base and higher-than-expected content cost.
▎Malaysia
ADD (no change) Consensus ratings*: Buy 14 Hold 11 Sell 1
Current price: RM2.76 Target price: RM3.36 Previous target: RM3.36
Up/downside: 21.6% CIMB / Consensus: 5.0%
Reuters: ASTR.KL Bloomberg: ASTRO MK Market cap: US$3,480m RM14,366m Average daily turnover: US$1.43m RM5.75m Current shares o/s: 5,202m Free float: 41.5% * Source: Bloomberg Key changes in this note
No changes.
Source: Bloomberg
Price performance 1M 3M 12M Absolute (%) -0.4 1.1 -11.5 Relative (%) 2.4 2.8 -4.5
Major shareholders % held Astro Networks (M) Sdn Bhd 42.4 Pantai Cahaya Bulan Ventures 8.3 All Asia Media Equities 7.8
Analyst(s)
Mohd Shanaz NOOR AZAM
T (60) 3 2261 9078 E [email protected]
[ X ]
SOURCE: COMPANY DATA, CIMB FORECASTS
Financial Summary Jan-15A Jan-16A Jan-17F Jan-18F Jan-19F
Revenue (RMm) 5,231 5,475 5,633 6,028 6,276Operating EBITDA (RMm) 1,808 1,941 1,791 1,836 1,916Net Profit (RMm) 519.4 615.3 629.9 698.8 761.6Core EPS (RM) 0.10 0.12 0.12 0.13 0.15Core EPS Growth 16.0% 18.5% 2.4% 10.9% 9.0%FD Core P/E (x) 27.62 23.31 22.77 20.53 18.83DPS (RM) 0.11 0.12 0.12 0.13 0.15Dividend Yield 3.99% 4.29% 4.39% 4.87% 5.31%EV/EBITDA (x) 9.13 9.03 9.78 9.45 9.01P/FCFE (x) 10.10 13.13 22.72 16.79 17.02Net Gearing 301% 516% 518% 495% 485%P/BV (x) 20.67 23.88 23.88 23.88 23.88ROE 79% 95% 105% 116% 127%% Change In Core EPS Estimates 0% 0% 0%CIMB/consensus EPS (x)
80.0
86.7
93.3
100.0
106.7
2.30
2.50
2.70
2.90
3.10
Price Close Relative to FBMKLCI (RHS)
5101520
Jun-15 Sep-15 Dec-15 Mar-16
Vol m
12

Ind Goods & Services│Malaysia│Equity research
Company Flash Note
IMPORTANT DISCLOSURES, INCLUDING ANY REQUIRED RESEARCH CERTIFICATIONS, ARE PROVIDED AT THE END OF THIS REPORT. IF THIS REPORT IS DISTRIBUTED IN THE UNITED STATES IT IS DISTRIBUTED BY CIMB SECURITIES (USA), INC. AND IS CONSIDERED THIRD-PARTY AFFILIATED RESEARCH.
Powered by the EFA Platform
AWC Berhad Plumbing TRX
■ AWC wins RM18.15m plumbing contract in TRX. ■ This is a positive surprise and improves AWC’s earnings visibility in FY06/17-18. ■ Maintain EPS forecasts and Add rating, with an unchanged SOP-based target price.
Potential catalysts are special dividends and more contract wins.
QDT wins plumbing works for Signature Tower, TRX ● AWC’s plumbing subsidiary, QDT, was awarded an RM18.15m (US$4.4m) plumbing
contract for Signature Tower at the Tun Razak Exchange (TRX). Signature Tower is being developed by the Mulia Group of Indonesia and will be TRX’s tallest building. The building is a Prime Grade A office tower comprising a 92-storey office tower with a five-storey office annex.
A positive surprise ● This is a positive surprise to us and improves AWC’s earnings visibility in FY17-18.
The 28-month contract will commence immediately, with a targeted completion date of 15 Sep 2018. We had assumed RM20m in contract wins for QDT in FY06/17 in our EPS forecasts. This win means that 90% of our contract win estimate has been fulfilled. As the job commences immediately, there is scope for upside surprises to earnings in FY17 if QDT wins more jobs.
Firing on all cylinders ● We view the recent pullback in AWC’s share price as an excellent buying opportunity.
The strong 3Q16 results, special dividends and the high-profile TRX contract win for Signature Tower are expected to boost AWC’s execution credibility in the eyes of investors. AWC also recently secured a 3-year RM7m maintenance contract for Menara Felda.
QDT and STREAM are high-margin businesses ● Apart from the concession business, QDT and STREAM are highly profitable
businesses for AWC given the niche markets they operate in respectively. We estimate QDT’s pretax margins to be 15% and STREAM’s 22%. AWC has an estimated tenderbook of c.RM400m (US$98m) across the various divisions: 1) facilities (RM120m), 2) STREAM (RM90m), 3) M&E/HVAC (RM150M), and 4) plumbing (RM30m).
Still cheap at 9.3x FY17 P/E; 4.7x ex-cash P/E ● We maintain our Add rating on AWC with an unchanged SOP-based target price of
RM1.13. The stock is attractively valued at 9.3x FY17 P/E and FY17F ex-cash P/E of 4.7x. Key risks to the achievement of our target price include project execution and delays.
Figure 1: Net profit to take off from FY16 (RM m)
SOURCES: CIMB, COMPANY REPORTS
0.000
5.000
10.000
15.000
20.000
25.000
0.050.0
100.0150.0200.0250.0300.0
2012 2013 2014 2015 2016F 2017F 2018FRevenue Net profit
▎Malaysia May 31, 2016 - 7:44 AM
ADD (no change) Consensus ratings*: Buy 1 Hold 0 Sell 0
Current price: RM0.70 Target price: RM1.13 Previous target: RM1.13
Up/downside: 60.9% CIMB / Consensus: -0.3%
Reuters: AWCF.KL Bloomberg: AWCF MK Market cap: US$43.58m RM179.4m Average daily turnover: US$1.33m RM5.32m Current shares o/s 256.0m Free float: 66.0% * Source: Bloomberg Key financial forecasts
Source: Bloomberg Price performance 1M 3M 12M
Absolute (%) 18.6 60.9 94.4 Relative (%) 21.2 62.4 101.1
Major shareholders % held Dato' Ahmad Kabeer 34.0
Analyst(s)
Marcus CHAN, CFA
T (60) 3 2261 9070 E [email protected]
Jun-16F Jun-17F Jun-18F
Net Profit (RMm) 15.05 19.34 21.56Core EPS (RM) 0.063 0.076 0.084Core EPS Growth 75.6% 20.8% 11.5%FD Core P/E (x) 11.19 9.27 8.31Recurring ROE 15.6% 17.9% 17.8%P/BV (x) 1.77 1.57 1.40DPS (RM) 0.020 0.025 0.030Dividend Yield 2.86% 3.57% 4.29%
75
135
195
255
0.23
0.43
0.63
0.83Price Close Relative to FBMKLCI (RHS)
20
40
60
Jun-15 Sep-15 Dec-15 Mar-16
Vol m
13

Construction│Malaysia│Equity research│May 31, 2016
Company Note
IMPORTANT DISCLOSURES, INCLUDING ANY REQUIRED RESEARCH CERTIFICATIONS, ARE PROVIDED AT THE END OF THIS REPORT. IF THIS REPORT IS DISTRIBUTED IN THE UNITED STATES IT IS DISTRIBUTED BY CIMB SECURITIES (USA), INC. AND IS CONSIDERED THIRD-PARTY AFFILIATED RESEARCH.
Powered by the EFA Platform
Malaysian Resources Corp A toned-down quarter
■ Annualised 1Q16 core net profit made up 16% of our and 17% of consensus full-year numbers. The results were below expectations due to slow progress billings.
■ Construction margins remain depressed even though revenue shot up 69% yoy. ■ Core property development earnings surged in 1Q16, and could remain robust in
future quarters. Management targets RM1bn (US$250m) sales in 2016. ■ Management has turned aggressive in pursuing new larger-value infra jobs. ■ Job wins remain key catalysts and could surprise on the upside. Add retained.
1Q16 below expectations MRCB’s annualised 1Q16 core net profit made up 16-17% of our and consensus full-year forecasts. While 1Q is traditionally weaker, the 1Q16 results were still below expectations due to weaker progress billings for construction, though this was partially offset by still-robust margins for property. Prevailing construction EBIT margin was lower than the 2% achieved in 1Q15, even though construction revenue jumped 69% yoy. The absence of any gains from property asset sale also dampened the 1Q16 numbers.
Aggressive sales target amidst a challenging market MRCB achieved total sales of RM850m (US$212m) in FY15. The group targets RM1bn (US$250m) total property sales in 2016, but we believe there could be downside if new property launches and progress billings remain weak in 2H16. The RM1.5bn (US$374m) total unbilled sales as at end-1Q16 could largely mitigate any downside. The group has lined up RM2.2bn (US$549m) worth of launches this year, to be driven by Sentral Suites, Menara MRCB, Prima Homes, and Bandar Iskandar.
PDP for Kwasa Damansara township Recent positive news was that MRCB has been appointed the Project Delivery Partner (PDP) to develop the main infrastructure for the new Kwasa Damansara township. MRCB will earn a PDP fee based on 5% of the RM2.2bn (US$549m) development cost. We have not factored in the RM20m-40m estimated PDP fees into our EPS forecasts given the limited visibility on the timing of the new earnings flow.
Still an execution year The group’s strategy this year continues to be on execution, mainly for phase 1 of the Bukit Jalil Sport Complex refurbishment/privatisation deal. Overall, the over RM600m in potential new funds from its 20% share placement will largely be earmarked to fund this venture. The 1st tranche of the placement deal had raised RM109m as at end May, with the remaining tranche to be finalised in the next six months. We continue to expect earnings contribution from Bukit Jalil to flow through no sooner than FY18.
Add retained; Job flow prospects still look buoyant We cut our FY16-18 EPS to factor in slower progress billings and lower construction margins. Our RNAV-based target price, still pegged to 30% RNAV discount, dips as we update for balance sheet items. Key downside risk is sustained soft margins for construction and weaker property market. Even with a c.RM4bn outstanding order book (including Kwasa’s infra portion), MRCB’s strategy is to go aggressive on tenders for incoming infrastructure projects. Job wins are likely catalysts in the medium term.
▎Malaysia
ADD (no change) Consensus ratings*: Buy 6 Hold 4 Sell 0
Current price: RM1.16 Target price: RM1.32 Previous target: RM1.40
Up/downside: 13.8% CIMB / Consensus: -15.7%
Reuters: MYRS.KL Bloomberg: MRC MK Market cap: US$531.6m RM2,188m Average daily turnover: US$0.45m RM1.78m Current shares o/s: 1,783m Free float: 34.9% * Source: Bloomberg Key changes in this note
FY16F EPS cut by 10% FY17F EPS cut by 12%. FY18F EPS cut by 13%
Source: Bloomberg
Price performance 1M 3M 12M Absolute (%) -4.1 2.7 -7.9 Relative (%) -1.3 4.4 -0.9
Major shareholders % held EPF 38.3 Gapurna Sdn Bhd 16.7 Lembaga Tabung Haji 10.1
Analyst(s)
Sharizan ROSELY
T (60) 3 2261 9077 E [email protected]
[ X ]
SOURCE: COMPANY DATA, CIMB FORECASTS
Financial Summary Dec-14A Dec-15A Dec-16F Dec-17F Dec-18F
Revenue (RMm) 1,515 1,697 1,884 2,014 2,154Operating EBITDA (RMm) 110.1 159.9 234.5 255.9 283.1Net Profit (RMm) 136.5 330.4 97.4 111.5 131.6Core EPS (RM) 0.033 0.081 0.042 0.039 0.046Core EPS Growth 146% (48%) (7%) 18%FD Core P/E (x) 35.09 14.25 34.03 29.73 25.19DPS (RM) 0.025 0.025 0.030 0.030 0.030Dividend Yield 2.16% 2.16% 2.59% 2.59% 2.59%EV/EBITDA (x) 46.18 29.65 22.85 23.23 20.87P/FCFE (x) 7.52 NA NA 56.99 36.66Net Gearing 181% 155% 154% 153% 152%P/BV (x) 1.30 1.15 1.91 1.93 1.94ROE 3.61% 8.58% 5.52% 6.45% 7.68%% Change In Core EPS Estimates (9.8%) (11.9%) (13.1%)CIMB/consensus EPS (x) 0.95 0.70 0.72
67.0
80.3
93.7
107.0
120.3
0.70
0.90
1.10
1.30
1.50
Price Close Relative to FBMKLCI (RHS)
10
20
30
Jun-15 Sep-15 Dec-15 Mar-16
Vol m
14

Media - Integrated│Malaysia│Equity research│May 31, 2016
Company Note
IMPORTANT DISCLOSURES, INCLUDING ANY REQUIRED RESEARCH CERTIFICATIONS, ARE PROVIDED AT THE END OF THIS REPORT. IF THIS REPORT IS DISTRIBUTED IN THE UNITED STATES IT IS DISTRIBUTED BY CIMB SECURITIES (USA), INC. AND IS CONSIDERED THIRD-PARTY AFFILIATED RESEARCH.
Powered by the EFA Platform
Media Chinese Int'l In need of new growth drivers
■ Management maintains its cautious outlook for FY17 due to ongoing economic uncertainties in its key operating markets.
■ Challenging outlook for travel segment due to weaker consumer sentiment in Hong Kong, rising competition and safety concerns.
■ We like the effort to grow its online platform but the potential earnings impact may be too small to offset the decline in the traditional print segment.
■ Maintain Reduce and RM0.64 target price, based on 9x CY17F P/E. ■ Switch to Astro for better exposure to the media sector and lower sensitivity to adex.
No surprises from 4QFY16 results briefing MCIL held its 4QFY16 results briefing this morning for approximately 15 analysts and fund managers, hosted by group CEO Francis Tiong and Executive Director Patrick Leong. There were no surprises from the briefing as management reiterated its cautious outlook given the poor consumer sentiment in Malaysia following the goods and services tax (GST) implementation, and soft advertising environment in Hong Kong.
Expect another challenging year in FY17 In addition, management expects FY17 to be another challenging year for the group amidst the soft advertising environment both in the domestic and international markets. We agree with management as we expect consumer sentiment to stay weak for the remaining of 2016, and this could be a de-rating catalyst. We forecast flat adex growth in FY17 and 3% growth in FY18. However, we expect MCIL’s print adex to contract by 3-5% in FY17-18 due to the structural shift from print to digital platforms.
Muted prospects for travel segment Following the strong travel segment performance in FY16, management expects a more challenging outlook for the segment in FY17 in view of the weaker consumer sentiment in Hong Kong, coupled with rising competition from the online segment and safety concerns due to increasing terrorist activities globally.
Growing its digital platform Nevertheless, we are encouraged by the positive traction from its e-commerce portal “LogOn”, for which it has successful acquired 1.4k merchants as at Mar 2016. Management also plans to launch two new mobile applications for healthcare and event directory providers in Hong Kong. While we like the effort to grow its online business, we remains wary of its monetisation strategy as the potential earnings impact from digital may be too small to offset the decline in the traditional print segment.
Maintain Reduce and target price We maintain our Reduce rating and RM0.64 target price, based on 9x CY17F P/E, 40% discount to our target market P/E of 15x. While the stock offers attractive FY17/18 dividend yields of 5.7%/5.8%, we prefer Astro for greater exposure to the media sector due to its defensive earnings structure and lower sensitivity to adex. Key upside risks to our Reduce call are stronger adex recovery and pick-up in travel package sales.
▎Malaysia
REDUCE (no change) Consensus ratings*: Buy 1 Hold 1 Sell 1
Current price: RM0.74 Target price: RM0.64 Previous target: RM0.64
Up/downside: -13.6% CIMB / Consensus: -0.7%
Reuters: MDCH.KL Bloomberg: MCIL MK Market cap: US$301.3m RM1,240m Average daily turnover: US$0.05m RM0.22m Current shares o/s: 1,687m Free float: 45.1% * Source: Bloomberg Key changes in this note
No changes.
Source: Bloomberg
Price performance 1M 3M 12M Absolute (%) 1.4 12.2 18.5 Relative (%) 4 13.7 25.2
Major shareholders % held Tan Sri Datuk Tiong Hiew King 50.0 EPF 4.9
Analyst(s)
Mohd Shanaz NOOR AZAM
T (60) 3 2261 9078 E [email protected]
[ X ]
SOURCE: COMPANY DATA, CIMB FORECASTS
Financial Summary Mar-15A Mar-16A Mar-17F Mar-18F Mar-19F
Revenue (RMm) 1,675 1,362 1,376 1,403 1,424Operating EBITDA (RMm) 277.0 205.4 207.4 211.6 208.8Net Profit (RMm) 122.6 104.0 117.3 119.7 117.0Core EPS (RM) 0.090 0.066 0.069 0.071 0.069Core EPS Growth (15.0%) (26.6%) 5.0% 2.1% (2.3%)FD Core P/E (x) 8.15 11.11 10.58 10.36 10.60DPS (RM) 0.029 0.043 0.042 0.043 0.043Dividend Yield 3.96% 5.87% 5.67% 5.79% 5.90%EV/EBITDA (x) 4.74 5.67 5.40 5.11 4.98P/FCFE (x) 7.25 7.28 11.38 12.01 11.90Net Gearing 5.8% (11.4%) (15.6%) (18.8%) (21.9%)P/BV (x) 1.52 1.49 1.41 1.34 1.28ROE 18.7% 13.5% 13.7% 13.3% 12.3%% Change In Core EPS Estimates 0% 0% 0%CIMB/consensus EPS (x) 3.66 3.73
86.0
97.3
108.5
119.8
131.0
0.400
0.500
0.600
0.700
0.800Price Close Relative to FBMKLCI (RHS)
1
2
3
Jun-15 Sep-15 Dec-15 Mar-16
Vol m
15

Construction│Malaysia│Equity research│May 31, 2016
Company Note
IMPORTANT DISCLOSURES, INCLUDING ANY REQUIRED RESEARCH CERTIFICATIONS, ARE PROVIDED AT THE END OF THIS REPORT. IF THIS REPORT IS DISTRIBUTED IN THE UNITED STATES IT IS DISTRIBUTED BY CIMB SECURITIES (USA), INC. AND IS CONSIDERED THIRD-PARTY AFFILIATED RESEARCH.
Powered by the EFA Platform
Muhibbah Engineering More than meets the eye
Annualised 1Q16 core net profit was largely in line at 91-95% of our and consensus’ ■full-year numbers. We expect stronger quarters ahead.
Strong turnaround in infra; 154% yoy surge in earnings in 1Q16. ■ Shipyard/vessel building division is seeing signs of recovery, with new contracts in ■the pipeline. Capacity still below its peak.
Rapid contracts are likely to make a comeback with larger value jobs. ■ Positive 2H16 outlook with scope for earnings expansion. Add maintained. ■
1Q16 results in line – stronger quarters ahead Annualised 1Q16 core net profit made up 95% of our full-year forecast and 91% of the consensus number. The results were broadly in line, with strong turnaround numbers for the infra segment where pretax profit jumped 154% yoy on the back accelerated billings for specialised projects in Rapid. We expect stronger quarters ahead, with the shipyard segment beginning to recover, and the 21%-owned Cambodian airport concession on track to contributing an all-time high associate profit in FY16.
Contract flows YTD decent; more wins in 2H16? We retain our targeted RM800m worth of new contracts for FY16. YTD, the RM157m total wins (based on effective JV stakes) was relatively small, but margins are likely to be lucrative. With ample capacity to take on highway jobs, Muhibbah has tendered for at least two packages for the Dash and Suke highways. We continue to expect recovery in order flows from Petronas’s Rapid, as higher-value jobs relevant to Muhibbah’s track record could be up for awards. Outstanding order book stands at RM2.1bn (US$522m).
Shipyard division on the road to recovery? There already signs of a recovery for the group’s shipbuilding division, which has a track record of building vessels at its yard in Telok Gong, Klang, before orders deteriorated due to the slump in offshore oil & gas activities. The group recently won a maiden vessel order for the Malaysian Marine Department worth RM92m. We think this could be the start of more new orders from other non-oil & gas clients. The group’s vessel building capacity has more room for upside in 2016 and could turn around in 2017.
Private placement in the works The 10% share placement would raise as much as RM111m in proceeds, based on a hypothetical issue price of RM2.32/share (2.11% discount to 5-day VWAMP). 75% of the amount will be utilised to partially repay debt while the balance is earmarked for working capital. We estimate up to a 7% dilution to our current RNAV of RM4.23/share, and 5-7% dilution to FY16-18F EPS after taking into account interest income from the proceeds and the enlarged share base. The placement is targeted to complete by 4Q16.
Positive 2H16 outlook; maintain Add Muhibbah remains our top mid-cap sector pick. We retain our FY16-18 EPS forecasts but cut our RNAV-based target price as we update for the lower market cap of Favelle Favco (cranes business). We continue to peg our target price to a 30% discount to RNAV, which implies an attractive upside of 35%. Key medium term catalysts include a pickup in infra wins and a recovery in order flow for the shipyard division driven by new prospects from the non-oil & gas space, in our view. Downside risk is delays in job wins.
▎Malaysia
ADD (no change) Consensus ratings*: Buy 6 Hold 0 Sell 0
Current price: RM2.19 Target price: RM2.96 Previous target: RM3.03
Up/downside: 35.2% CIMB / Consensus: -1.4%
Reuters: MUHI.KL Bloomberg: MUHI MK Market cap: US$251.3m RM1,034m Average daily turnover: US$0.32m RM1.28m Current shares o/s: 469.2m Free float: 72.5% * Source: Bloomberg Key changes in this note
No changes
Source: Bloomberg
Price performance 1M 3M 12M Absolute (%) -6.8 -4 -9.5 Relative (%) -4.2 -2.5 -2.8
Major shareholders % held Mac Ngan Boon 17.0 Lembaga Tabung Haji 10.6
Analyst(s)
Sharizan ROSELY
T (60) 3 2261 9077 E [email protected]
[ X ]
SOURCE: COMPANY DATA, CIMB FORECASTS
Financial Summary Dec-14A Dec-15A Dec-16F Dec-17F Dec-18F
Revenue (RMm) 1,693 1,599 1,988 2,187 2,406Operating EBITDA (RMm) 170.3 185.8 248.4 273.2 253.9Net Profit (RMm) 81.6 85.6 98.7 112.8 129.6Core EPS (RM) 0.17 0.18 0.21 0.24 0.28Core EPS Growth (4.2%) 4.9% 15.3% 14.4% 14.8%FD Core P/E (x) 12.59 12.01 10.42 9.11 7.93DPS (RM) 0.040 0.050 0.055 0.060 0.060Dividend Yield 1.83% 2.28% 2.51% 2.74% 2.74%EV/EBITDA (x) 9.65 8.58 6.43 5.69 5.96P/FCFE (x) 3.11 3.48 3.19 2.46 2.32Net Gearing 73.8% 65.0% 59.0% 51.9% 45.6%P/BV (x) NA NA NA 38.90 10.57ROE 13.5% 13.3% 15.2% 16.9% 18.3%% Change In Core EPS Estimates 0% 0% 0%CIMB/consensus EPS (x) 0.96 0.95 0.94
74.0
90.7
107.3
1.50
2.00
2.50
Price Close Relative to FBMKLCI (RHS)
2
4
6
Jun-15 Sep-15 Dec-15 Mar-16
Vol m
16

Food & Beverages│Malaysia│Equity research│May 31, 2016
Company Note
IMPORTANT DISCLOSURES, INCLUDING ANY REQUIRED RESEARCH CERTIFICATIONS, ARE PROVIDED AT THE END OF THIS REPORT. IF THIS REPORT IS DISTRIBUTED IN THE UNITED STATES IT IS DISTRIBUTED BY CIMB SECURITIES (USA), INC. AND IS CONSIDERED THIRD-PARTY AFFILIATED RESEARCH.
Powered by the EFA Platform
QL Resources Growing but underwhelmed expectations
QL’s FY16 core net profit of RM192m was below our and consensus expectations. ■ MPM segment posted strong FY16 revenue and PBT growth of 14% and 29%, ■respectively.
We make no changes to our earnings forecasts for now, pending a meeting with the ■management.
Maintain Add with unchanged target price of RM5.05. ■ Key re-rating catalysts include additional earnings contribution from new ventures ■and capacity growth in its existing businesses.
FY16 core net profit below expectations QL’s 4QFY3/16 revenue rose 16.2% to RM768.9m (US$184.5m) while core net profit was flattish at RM38.1m (US$9.1m; -0.7% yoy). FY16 core net profit rose 5.4% yoy to RM192m (US$46.1m), with revenue rising 5.5% to RM2.8bn. FY16 earnings were below expectations, accounting for 93% of our full-year forecast and 92% of consensus. The miss mainly came from weaker-than-expected contributions from its integrated livestock farming (ILF) and palm oil activities (POA). A solid year for MPM QL’s marine product manufacturing (MPM) segment posted healthy FY16 revenue and pretax profit growth of 14% and 29% yoy, respectively. We understand that this was mostly driven by the increased sales volume from the exports of its fish products as a result of the weaker RM as well as improved fish catch on the back of the El Nino weather effect and lower fish operating costs. POA lower due to lower CPO price and lower produced FFB POA segment’s 3QFY3/16 revenue rose 2% yoy but PBT still dropped 25% yoy to RM0.9m. Cumulatively, FY16 revenue and core net profit both fell 10% and 18% yoy, respectively, due to lower processed FFB at its Sabah palm oil unit, lower CPO price (FY16: RM2,132/mt vs. FY15: RM2,285/mt) as well as weaker contributions from its associate (Boilermech). Weaker ILF results due to El Nino and lower egg prices While ILF’s FY16 sales increased by 5% yoy to RM1.7bn, PBT slid 29% yoy to RM103.9m. Earnings were mostly hit by: 1) the El Nino impact on farm productivity; 2) lower egg prices in Peninsular Malaysia; 3) lower faming efficiency in Indonesia’s poultry unit due to challenging farming conditions (i.e. disease control and “day-old-chicks” over production) and; 4) loss of contribution from the disposal of stake in Lay Hong in FY15. Maintain Add with unchanged TP of RM5.05 We maintain our earnings forecasts following the release of its full-year numbers and pending our meeting with the management later this week. We also introduce FY19F numbers. Our Add call is retained with an unchanged target price of RM5.05, based on 23x CY17 P/E (in line with sector average P/E). Potential re-rating catalysts include strong earnings growth from new ventures and capacity expansion in its existing businesses. Key downside risk to our view includes volatile commodity prices.
▎Malaysia
ADD (no change) Consensus ratings: Buy 2 Hold 7 Sell 1
Current price: RM4.43 Target price: RM5.05 Previous target: RM5.05
Up/downside: 14.1% CIMB / Consensus: 12.5%
Reuters: QRES.KL Bloomberg: QLG MK Market cap: US$1,343m RM5,529m Average daily turnover: US$0.85m RM3.37m Current shares o/s: 1,248m Free float: 39.0% Key changes in this note
No change.
Source: Bloomberg
Price performance 1M 3M 12M
Absolute (%) 1.4 0 11 Relative (%) 4 1.5 17.7
Major shareholders % held CBG Holdings 38.7 Farsathy Holdings 11.2 Juw Teck Cheah 0.8
Analyst(s)
Kristine WONG
T (60) 3 2261 9085 E [email protected]
[ X ]
SOURCE: COMPANY DATA, CIMB FORECASTS
Financial Summary Mar-15A Mar-16A Mar-17F Mar-18F Mar-19F
Revenue (RMm) 2,708 2,853 3,124 3,434 3,709Operating EBITDA (RMm) 338.1 372.8 450.6 502.6 540.8Net Profit (RMm) 191.4 192.0 245.6 283.8 316.7Core EPS (RM) 0.15 0.15 0.20 0.23 0.25Core EPS Growth 14.5% 4.9% 27.9% 15.6% 11.6%FD Core P/E (x) 30.20 28.79 22.51 19.48 17.46DPS (RM) 0.043 0.043 0.055 0.064 0.071Dividend Yield 0.96% 0.97% 1.24% 1.44% 1.60%EV/EBITDA (x) 18.21 16.48 13.57 12.01 10.65P/FCFE (x) 95.99 36.63 26.68 24.64 10.45Net Gearing 37.1% 32.4% 26.8% 19.6% 5.4%P/BV (x) 3.88 3.53 3.17 2.84 2.54ROE 13.5% 12.8% 14.9% 15.4% 15.4%% Change In Core EPS Estimates 0.077% 0.067%CIMB/consensus EPS (x) 1.02 1.06
96.0102.0108.0114.0120.0126.0
3.703.904.104.304.504.70
Price Close Relative to FBMKLCI (RHS)
2
4
6
Jun-15 Sep-15 Dec-15 Mar-16
Vol m
17

Property Devt & Invt│Malaysia│Equity research│May 31, 2016
Company Note
IMPORTANT DISCLOSURES, INCLUDING ANY REQUIRED RESEARCH CERTIFICATIONS, ARE PROVIDED AT THE END OF THIS REPORT. IF THIS REPORT IS DISTRIBUTED IN THE UNITED STATES IT IS DISTRIBUTED BY CIMB SECURITIES (USA), INC. AND IS CONSIDERED THIRD-PARTY AFFILIATED RESEARCH.
Powered by the EFA Platform
SBC Corp 4QFY16 results: No approvals yet for JQ
At 72% of our full-year forecast, SBC’s FY3/16 core net profit was below our ■expectations mainly due to cost overrun.
No approvals yet from Sabah state government for seafront Jesselton Quay project. ■ Targets to launch high-end Bangsar project in Aug this year. ■ Our property analyst expects the domestic property market to recover in 2HCY16 ■onwards.
Maintain Add, as SBC’s share price is trading at a huge discount to RNAV/share. ■FY16 net profit down 23% yoy While FY16 revenue was down by 1.4% yoy to RM150m (US$37m), net profit was down by a sharper 23% yoy mainly due to cost overrun. Final DPS of 0.46 sen was declared, below our 1.0 sen forecast.
No approvals yet for Jesselton Quay It has been more than two years since SBC signed a JV with Suria Capital to develop the Jesselton Quay (JQ) project in Kota Kinabalu. The company is still waiting for approvals from the Sabah state government. Progress has been slow for JQ, mainly due to land issues and problems coordinating with neighbouring sites. We are hopeful that approvals for JQ will be obtained by the end of CY16.
Plans to launch Bangsar project in Aug SBC targets to launch its high-end Kapas Bangsar development project in Aug this year. The project’s expected gross development value (GDV) is at least RM100m (US$22m). In addition, the company aims to launch the DexPad projects. We estimate outstanding sales around RM150m (US$37m) at end-FY16. The company needs to boost sales of new launches. We believe that the company is looking to launch new projects for its associate Batang Kali development, focusing on medium-cost housing projects.
Property market recovery in 2HCY16 onwards? Our property analyst continues to anticipate recovery in Malaysian property sales in 2HCY16, driven by better economic outlook and higher consumer confidence. Outlook for the Sabah property market is similar. We expect a strong 2HCY16 outlook for property sales, particularly residential developments with selling prices below RM1m (US$0.24m). In our view, buyers today are not speculators but genuine homebuyers.
0.4x net gearing SBC’s net debt position was RM83m (US$20m) or 0.4x net gearing at end-Mar 2016. SBC’s net debt would have been much lower were it not for the RM50m (US$12m) yoy decline in payables at end-Mar. Operational cash flow should improve once the company launches the JQ project.
Maintain Add We cut FY17/18 EPS by 44%/38% to reflect greater cost pressure and slower sales outlook. We also introduced our FY19 estimates. Our target price falls to RM1.20, based on unchanged 70% discount to revised RNAV/share. After taking into account latest net debt levels and landbank, our RNAV/share falls from RM4.40 to RM4.02. Potential re-rating catalysts are approvals for JQ and recovery in the domestic property market in the later part of this year. Risks are continued soft sales of new launches.
▎Malaysia
ADD (no change) Consensus ratings: Buy 1 Hold 0 Sell 0
Current price: RM0.70 Target price: RM1.20 Previous target: RM1.32
Up/downside: 71.4% CIMB / Consensus: -9.1%
Reuters: SIAH.KL Bloomberg: SBC MK Market cap: US$39.80m RM164.3m Average daily turnover: US$0.01m RM0.04m Current shares o/s: 234.9m Free float: 61.6% Key changes in this note
None.
Source: Bloomberg
Price performance 1M 3M 12M Absolute (%) 0 -0.7 -28.2 Relative (%) 2.8 1 -21.2
Major shareholders % held Sia Teong Heng 38.4
Analyst(s)
Nigel FOO
T (60) 3 2261 9069 E [email protected]
[ X ]
SOURCE: COMPANY DATA, CIMB FORECASTS
Financial Summary Mar-15A Mar-16A Mar-17F Mar-18F Mar-19F
Total Net Revenues (RMm) 149.3 150.7 265.0 298.6 320.0Operating EBITDA (RMm) 18.70 16.90 32.68 41.67 44.98Net Profit (RMm) 18.20 13.60 28.08 34.99 37.87Core EPS (RM) 0.08 0.07 0.12 0.15 0.16Core EPS Growth (48.0%) (9.8%) 61.4% 24.6% 8.2%FD Core P/E (x) 8.52 9.45 5.86 4.70 4.34DPS (RM) 0.010 0.010 0.010 0.010 0.010Dividend Yield 1.43% 1.43% 1.43% 1.43% 1.43%EV/EBITDA (x) 6.81 4.54 4.66 3.77 3.21P/FCFE (x) NA 4.59 NA NA NANet Gearing 19.1% 6.8% 25.7% 26.3% 23.0%P/BV (x) 0.43 0.42 0.40 0.37 0.35ROE 5.12% 4.50% 7.01% 8.22% 8.33%% Change In Core EPS Estimates (43.5%) (37.9%)CIMB/consensus EPS (x) 0.57 0.62
71.0
78.8
86.6
94.3
102.1
0.600
0.700
0.800
0.900
1.000
Price Close Relative to FBMKLCI (RHS)
1
2
3
Jun-15 Sep-15 Dec-15 Mar-16
Vol m
18

Financial Services│Malaysia│Equity research│May 31, 2016
Sector Note
IMPORTANT DISCLOSURES, INCLUDING ANY REQUIRED RESEARCH CERTIFICATIONS, ARE PROVIDED AT THE END OF THIS REPORT. IF THIS REPORT IS DISTRIBUTED IN THE UNITED STATES IT IS DISTRIBUTED BY CIMB SECURITIES (USA), INC. AND IS CONSIDERED THIRD-PARTY AFFILIATED RESEARCH.
Powered by the EFA Platform
Banks Apr 16 tracker – still holding tight to asset quality
The GIL ratio was sustained at an all-time low of 1.6% in Apr 16. ■ Loan growth inched down from 6.4% yoy in Mar 16 to 6.3% yoy in Apr 16. ■ The momentum for household and business loans also moderated marginally in Apr. ■ Loan applications and approvals fell by 6% and 17.2% yoy, respectively, in Apr. ■ We maintain our Overweight stance on banks, premised on the expected recovery ■in EPS growth in 2016 as well as compelling valuations and dividend yields.
Still successful in containing the GIL Notwithstanding the numerous headwinds on banks’ asset quality, the industry’s gross impaired loan (GIL) ratio was still sustained at an all-time low of 1.6% in Apr 16 (since Mar 15). Loan loss coverage inched down from 94.3% in Mar 16 to 93.9% in Apr 16. The stable GIL ratio thus far gives us the comfort that the ratio would not spike in 2016. We expect to the ratio to rise from 1.6% in Dec 15 to 1.8% in Dec 16.
Weak loan growth… The industry’s mom loan growth stalled for the second month in Apr 16, leading to a slight moderation in yoy loan growth from 6.4% in Mar 16 to 6.3% in Apr 16. The major loan segments eased marginally – from 6.4% yoy in Mar 16 to 6.3% yoy in Apr 16 for household loans, and from 5.2% yoy to 5% yoy for business loans. We anticipate a recovery in loan growth in 2H16, on the back of an expected better GDP growth, to achieve our projected loan growth of 7-8% for 2016.
…to be cushioned by greater focus on margins Despite the slower loan growth, we think that banks’ net interest income growth would not weaken (compared to 2015) due to their increased focus on improving margins. Following the stiff competition last year, we believe that the fixed-deposit rates have peaked, even though they would remain high. The recent increase in the base rates of Public Bank and Hong Leong Bank would also help to improve their lending yields.
Lower leading loan indicators Both of the industry’s loan applications and approvals fell in Apr 16, by 6% and 17.2% yoy respectively. This represents a downward reversal of a 1.1% yoy increase for applications in Mar 16, but a narrowing of the decline in approvals from 23.4% yoy in Mar 16. The Apr 16 indicators were affected by the declines in the auto and property loan segments. Meanwhile, the approvals for working capital (WC) loans grew at a healthy 11.7% yoy but the applications of WC loans slid by 2.3% yoy in Apr 16.
Staying Overweight We retain our Overweight call on banks, premised on the potential re-rating catalysts of an expected recovery in EPS growth in 2016 and attractive valuation/dividend yields for most banks. Despite the weaker loan growth, we believe that banks will post stronger EPS growth in 2016, underpinned by smaller margin contractions and a narrower increase in overheads.
[ X ]
Figure 1: Banking system’s total loans and yoy growth
SOURCES: BANK NEGARA MALAYSIA
▎Malaysia
Overweight (no change) Highlighted companies
Malayan Banking Bhd ADD, TP RM10.60, RM8.23 close
We like Maybank for its extensive regional network and presence in under-penetrated markets like Indonesia and the Philippines. It is also ranked among the top three in most market segments in Malaysia.
Public Bank Bhd HOLD, TP RM19.15, RM19.12 close
Public Bank is one of the most consistent players in terms of loan growth. Although it is guiding for a slowdown in loan momentum from 11.6% in 2015 to 8-9% in 2016, this would still be above our projected 7-8% for the industry.
RHB Capital Bhd ADD, TP RM8.00, RM6.10 close
We see better prospects for RHB Capital’s earnings in the longer term catalysed by (1) the benefits from its IGNITE 17 transformation programme, and (2) the drive for regional expansion.
Summary valuation metrics
Analyst(s)
Winson NG, CFA
T (60) 3 2261 9071 E [email protected]
4%
5%
6%
7%
8%
9%
10%
11%
12%
600,000
700,000
800,000
900,000
1,000,000
1,100,000
1,200,000
1,300,000
1,400,000
1,500,000
Apr-14 Jul-14 Oct-14 Jan-15 Apr-15 Jul-15 Oct-15 Jan-16 Apr-16
%RM m
Loans yoy growth
P/E (x) Dec-16F Dec-17F Dec-18F
Malayan Banking Bhd 11.38 10.01 9.22 Public Bank Bhd 14.33 13.08 11.91 RHB Capital Bhd 9.02 8.31 7.38
P/BV (x) Dec-16F Dec-17F Dec-18F
Malayan Banking Bhd 1.38 1.32 1.26 Public Bank Bhd 2.11 1.90 1.71 RHB Capital Bhd 0.80 0.75 0.69
Dividend Yield Dec-16F Dec-17F Dec-18F
Malayan Banking Bhd 6.42% 7.29% 7.91%Public Bank Bhd 3.14% 3.44% 3.78%RHB Capital Bhd 3.32% 3.61% 4.07%
19

Telco - Integrated│Philippines│Equity research
Company Flash Note
IMPORTANT DISCLOSURES, INCLUDING ANY REQUIRED RESEARCH CERTIFICATIONS, ARE PROVIDED AT THE END OF THIS REPORT. IF THIS REPORT IS DISTRIBUTED IN THE UNITED STATES IT IS DISTRIBUTED BY CIMB SECURITIES (USA), INC. AND IS CONSIDERED THIRD-PARTY AFFILIATED RESEARCH.
Powered by the EFA Platform
Philippine Long Distance Tel Splitting the spectrum
PLDT and Globe to jointly acquire a 100% equity interest in Vega Telecom of San ■Miguel Corporation, which was valued at Php52.8bn.
The deal enables direct access to the various radio frequencies of Vega and ■removes the overhang of the entrance of a third player into the telco market.
To partially fund the acquisition, TEL sold its 25% stake in Beacon to Metro Pacific. ■
Existing duopoly buys out potential third player ● PLDT and Globe disclosed that they will each be acquiring a 50% equity interest in
Vega Telecom (VTI), which has an estimated equity value of Php52.8bn. VTI’s various assets (i.e. frequencies, licenses, permits) will be equally split by the two, enabling them to accelerate the rollout for their data requirements and incrementally widen coverage and increase efficiency of their network utilization.
Implications of the deal ● Due to the incremental build-up in data frequencies, PLDT indicated that it will raise
its capex requirements by Php4.6bn (US$100m), bringing the full-year figure to roughly Php47.6bn (up 11% from the initial Php43.0bn). The company has already spent Php14.6bn in 1Q16. We continue to believe that capex will remain at elevated levels in the medium term.
Funding mix ● The company will be financing the deal through new debt, free cash, and a portion of
the sale of its 25% equity stake in Beacon to Metro Pacific (MPI). This transaction was valued at Php26.2bn where Php17.0bn will be paid upfront with the remaining Php9.2bn to be spread out in four years. Post-transaction, PLDT will have a 25% stake in Beacon, which translates to an 8.74% stake in Meralco.
Cautious outlook ● Despite the removal of the overhang of the entrance of a third player, we remain
cautious on the medium-term outlook of PLDT. As a result of the new assets, the company will be incurring higher depreciation expense as well as additional financing costs with the new debt. Furthermore, we estimate the selldown in PLDT’s Beacon stake will reduce its share in equity net earnings by about Php1.0bn.
Forecasts under review ● We are currently reviewing our PLDT forecasts taking into account the impact of the
aforementioned events. We maintain our Hold rating with a sum-of the parts (SOP) valuation of Php1,832, which implies a forward P/E valuation of 14.7x, in line with its seven-year historical average.
Figure 1: Transaction consideration
SOURCES: CIMB, COMPANY REPORTS
in Php billions Vega Bow Arken Brightshare Total
Equity Interest 52.08 0.58 0.19 52.85Assumed Liabilities 17.02 0.12 0.02 17.16Total Consideration 69.1 0.7 0.21 70.0150% share 34.6 0.4 0.1 35.0
PLDT's 50% equity interest 26.43
Assumed Liabilties 8.58
PLDT's total consideration 35.01
▎Philippines May 31, 2016 - 9:38 AM
HOLD (no change) Consensus ratings: Buy 7 Hold 9 Sell 4
Current price: PHP1,901 Target price: PHP1,832 Previous target: PHP1,832
Up/downside: -3.7% CIMB / Consensus: -1.6%
Reuters: TEL.PS Bloomberg: TEL PM Market cap: US$8,790m PHP410,722m Average daily turnover: US$7.49m PHP349.8m Current shares o/s 218.6m Free float: 53.9% Key financial forecasts
Source: Bloomberg Price performance 1M 3M 12M
Absolute (%) 10.7 3.9 -31.6 Relative (%) 6.4 -8 -30.1
Major shareholders % held First Pacific Company Limited 25.6 NTT Group 24.3
Analyst(s)
Jose-Paolo FONTANILLA
T (63) 2 888 7118 E [email protected] Marc Christopher ESPINO T (63) 2 888 5817 E [email protected]
Dec-16F Dec-17F Dec-18F
Net Profit (PHPm) 27,127 26,968 27,660Core EPS (PHP) 125.5 124.8 128.0Core EPS Growth (23.0%) (0.6%) 2.6%FD Core P/E (x) 15.32 15.41 15.02Recurring ROE 23.3% 21.9% 21.3%P/BV (x) 3.45 3.27 3.10DPS (PHP) 93.07 92.52 94.89Dividend Yield 4.90% 4.87% 4.99%
57.0
73.7
90.3
107.0
1,400
1,900
2,400
2,900
Price Close Relative to PCOMP (RHS)
200400600800
Jun-15 Sep-15 Dec-15 Mar-16
Vol t
h
20

REIT│Singapore│Equity research
Company Flash Note
IMPORTANT DISCLOSURES, INCLUDING ANY REQUIRED RESEARCH CERTIFICATIONS, ARE PROVIDED AT THE END OF THIS REPORT. IF THIS REPORT IS DISTRIBUTED IN THE UNITED STATES IT IS DISTRIBUTED BY CIMB SECURITIES (USA), INC. AND IS CONSIDERED THIRD-PARTY AFFILIATED RESEARCH.
Powered by the EFA Platform
Cache Logistics Trust Caught in a cauldron
Received an originating summons from Schenker to essentially make an application ■for the renewal of lease at Schenker Megahub @ ALPS.
We deem that CACHE is caught in a cauldron; we see more downside vs. upside. ■ Reiterate Hold with rising uncertainty on lease renewals. ■
Received an originating summons from Schenker ● CACHE has received an origination summons from Schenker Singapore (Schenker)
in relation to the Schenker Megahub at 51 Alps Avenue, which is located in Airport Logistics Park of Singapore (ALPS). Essentially, Schenker is seeking CACHE to make an application for its lease at Megahub to be renewed.
Background of Schenker Megahub ● CACHE is currently master leasing Megahub to C&P Land (C&P), a subsidiary of
C&P Holdings (controlling shareholder of CWT). In turn, C&P has leased out the property to Schenker under an anchor lease agreement. Schenker is the ultimate end-user of the property. Both the master and anchor leases expire on 31 Aug 16.
● Schenker has informed C&P that it intends to renew the anchor lease agreement for another five years, at a rental rate pre-agreed between C&P and Schenker when the anchor lease was entered into on 8 Jun 05. However, C&P deems that Schenker does not have a valid option to renew. The pre-agreed rental rate is below the current market rate.
● As a result, Schenker is seeking to bind the anchor lease agreement to CACHE such that Schenker could essentially renew the lease at the pre-agreed rate.
Caught in a cauldron ● CACHE views that it is not a party to the anchor lease agreement. ● In the worst-case scenario that the court rules in favour of Schenker, and that the pre-
agreed rental is applied, we estimate that our FY17 DPU could see 6% downside. We believe that the pre-agreed rental rate could be in the range of S$0.55 psf pm, while we have modelled in a rate of S$1.55 psf pm for Schenker Megahub in FY17.
● CACHE has guided that its proforma DPU for 1Q16 could be 1.89 Scts vs. actual 1Q16 DPU of 2.039 Scts (c.7% downside).
● In addition, CACHE could book a de-valuation loss of c.S$43m for Schenker Megahub (lower underlying income). It guided that its proforma NTA as at 1Q16 would be S$0.83/unit vs. actual NTA of S$0.88/unit (c.6% downside).
● Notwithstanding the above, C&P can renew the master lease or deliver vacant possession of megahub upon expiry of the master lease agreement. If C&P does not renew the master lease and fails to deliver vacant possession of the property, CACHE is able to claim against C&P for double the amount of rent payable over the holding period OR damages arising as a result of Schenke remaining on the property.
● Given that Schenker Megahub is one of the largest freight and logistics property in ALPS (gfa: c.440k sq ft), we view that it is not easy for Schenker to entirely vacate the property.
Reiterate Hold with rising uncertainty on lease renewals ● While there could be several discrete outcomes from Schenker Megahub (from worst-
case scenario to renewal of master lease agreement), it is evident to us that the net result would be lower property yields, given the challenging industry landscape.
● We reiterate Hold with rising uncertainty on lease renewals. About 11% of CACHE’s GRI is up for renewal in 2016. Downside risk could come from worse-than-expected renewals.
Figure 1: Property details – Schenke Megahub
SOURCES: CIMB, COMPANY REPORTS
▎Singapore May 31, 2016 - 5:21 PM
HOLD (no change) Consensus ratings*: Buy 5 Hold 3 Sell 1
Current price: S$0.86 Target price: S$0.94 Previous target: S$0.94 Up/downside: 9.7% CIMB / Consensus: 6.5%
Reuters: CALT.SI Bloomberg: CACHE SP Market cap: US$557.2m S$769.7m Average daily turnover: US$1.36m S$1.85m Current shares o/s 893.5m Free float: 95.3% * Source: Bloomberg Key financial forecasts
Source: Bloomberg Price performance 1M 3M 12M Absolute (%) -0.6 1.8 -25.9 Relative (%) 0.9 -3.1 -8.3
Major shareholders % held BNY Mellon 8.5 CWT Ltd 4.4 Capital Group 4.3
Analyst(s)
YEO Zhi Bin T (65) 6210 8669 E [email protected] LOCK Mun Yee T (65) 6210 8606 E [email protected]
Dec-16F Dec-17F Dec-18FNet Profit (S$m) 59.90 63.73 67.30Core EPS (S$) 0.067 0.071 0.074Core EPS Growth 6.53% 5.63% 4.83%FD Core P/E (x) 12.88 12.19 11.63NorEPSAdCoEPSgrNormRecurring ROE 7.64% 8.17% 8.66%P/BV (x) 0.99 1.00 1.01DPS (S$) 0.079 0.080 0.083Dividend Yield 9.24% 9.29% 9.62%
85.089.093.097.0101.0105.0
0.7000.8000.9001.0001.1001.200
Price Close Relative to FSSTI (RHS)
5
10
Jun-15 Sep-15 Dec-15 Mar-16
Vol m
21

Conglomerate│Singapore│Equity research
Company Flash Note
IMPORTANT DISCLOSURES, INCLUDING ANY REQUIRED RESEARCH CERTIFICATIONS, ARE PROVIDED AT THE END OF THIS REPORT. IF THIS REPORT IS DISTRIBUTED IN THE UNITED STATES IT IS DISTRIBUTED BY CIMB SECURITIES (USA), INC. AND IS CONSIDERED THIRD-PARTY AFFILIATED RESEARCH.
Powered by the EFA Platform
Sembcorp Industries Europe NDR – scenario planning for marine
During our UK/Amsterdam NDR, investors were largely concerned about SMM’s ■cashflow management and impact on SCI’s dividend.
Privatisation of SMM is not accretive now and rights issuance may not be necessary ■if the yard is able to manage cash receipts from customers in 2016.
SCI’s focus is to ensure successful execution of new projects in India and China and ■be selective on new M&As, preserving funds to help SMM if need arises.
Maintain Add and SOP-based target price of S$3.10. ■
Scenario planning in Marine ● Privatisation of Sembcorp Marine may not be earnings accretive for SCI given the
challenging order momentum in the near-term. 2017 could be an inflexion point for SMM if oil prices rebound above US$60/bbl before major capex spending resumes.
● Meanwhile, the yard is diversifying its product offerings to floating production (SSP) and modular LNG terminal (Gravifloat). Order size could range from US$200m to US$1bn. We keep our S$1.5bn order target for 2016.
● Rights issuance may not be required if SMM manages to collect final payments from project deliveries. The recent transfer of jack-up from troubled Hercules Offshore to Maersk Drilling provided slight relief on cashflow as SMM will receive US$196m for the final 80% payment.
● Including this, we estimate SMM to receive c.S$1.3bn (US$1bn) in FY16 from the deliveries of CJ70 for Noble (US$460m), Denorske platform (US$145m), FPSOs for Libra and Modec (totaling US$160m). Net gearing could improve to 0.7x by end-16 (1Q16: 1.15x).
● Risk of impairment for new Brazilian yard is not imminent as SMM could be one of the few surviving yards after other local yards pulled out of the sector. The group still hopes to resume building three to four drillships for Petrobras. SMM may also securitise some of the contentious non-Petrobras rigs to ease its cashflows.
India – limiting exposure ● In our view, SCI could be capping its exposure from India to 30% of utilities earnings
by FY18, starting with c.10% in FY16. The end game for India is to spin off/list when the plants are stabilised.
● Sembcorp Gayatri Power (SGP) has been qualified as an L1 bidder (cheapest tariffs) for a long-term PPA for Andhra Pradesh for c.500MW. The finalisation of the PPA hinges on the debt restructuring scheme, UDAY (Ujwal DISCOM Assurance Yojana) Scheme to turnaround highly indebted state power distribution companies in India. SGP could sell into the spot market to commission the plant in 4Q16.
Singapore’s hope is in the long-term depletion of piped natural gas ● The overcapacity situation in Singapore could bottom by 2017, one year after the last
addition (Hyflux’ 411MW power plant) was commissioned, in our view. ● The gradual depletion of natural gas fields in Sumatra, Indonesia (Indonesia supplies
c.60% of gas to Singapore) could partially resolve the gas oversupply situation in Singapore which caused aggressive new power planting in the recent years.
● Partial shut-down of loss-making gencos could also see consolidation of supply.
Maintain Add and target price of S$3.10 ● Current valuation implies that utilities business is trading at 0.5x CY16 P/BV, which is
undemanding vs. its ROE of 7%. This is also below regional water and power peers average of 1.3x with similar returns. Catalysts could come from stronger earnings from India and oil price recovery. Downside risks from execution failure in India.
Figure 1: SOP valuation
SOURCES: CIMB, COMPANY REPORTS
Valuation basis
Value
($m)
Per
share
(S$)
Current
Implied
per share
(S$)
Implied
value
(S$'m)
FY16 FY17 FY16 FY17
Sembcorp Marine At S$0.90 target price 1,165 0.65 1.13 2,026
UtilitiesDCF (WACC 6%, LTG 2%), 9x CY17earnings 3,555 1.97 1.26 2,274 326 395 7.0 5.8
Industrial parks and other biz At book value 813 0.45 0.45 813Total 5,533 3.10 2.84 5,113
Utilities profit
(S'm)
Implied P/E
(x)
▎Singapore May 31, 2016 - 6:02 PM
ADD (no change) Consensus ratings*: Buy 11 Hold 3 Sell 4
Current price: S$2.83 Target price: S$3.10 Previous target: S$3.10
Up/downside: 9.6% CIMB / Consensus: -0.3%
Reuters: SCIL.SI Bloomberg: SCI SP Market cap: US$3,662m S$5,058m Average daily turnover: US$14.04m S$19.18m Current shares o/s 1,785m Free float: 50.0% * Source: Bloomberg Key financial forecasts
Source: Bloomberg Price performance 1M 3M 12M
Absolute (%) -2.1 5.6 -32 Relative (%) -0.6 0.7 -14.4
Major shareholders % held Temasek Holdings 49.5
Analyst(s)
LIM Siew Khee
T (65) 6210 8664 E [email protected]
Dec-16F Dec-17F Dec-18F
Net Profit (S$m) 504.4 528.4 599.2Core EPS (S$) 0.28 0.29 0.33Core EPS Growth 182% 5% 13%FD Core P/E (x) 10.10 9.64 8.50Recurring ROE 7.65% 7.64% 8.24%P/BV (x) 0.75 0.71 0.68DPS (S$) 0.10 0.11 0.12Dividend Yield 3.66% 3.84% 4.35%
75.0
89.0
103.0
1.90
2.90
3.90
Price Close Relative to FSSTI (RHS)
5101520
Jun-15 Sep-15 Dec-15 Mar-16
Vol m
22
Banks│Taiwan│Equity research│May 31, 2016
Company Note
IMPORTANT DISCLOSURES, INCLUDING ANY REQUIRED RESEARCH CERTIFICATIONS, ARE PROVIDED AT THE END OF THIS REPORT. IF THIS REPORT IS DISTRIBUTED IN THE UNITED STATES IT IS DISTRIBUTED BY CIMB SECURITIES (USA), INC. AND IS CONSIDERED THIRD-PARTY AFFILIATED RESEARCH.
Powered by the EFA Platform
First Financial Better off
First FHC’s 1Q16 net profit of NT$4.43bn (US$136m, +8% yoy) formed 27% of our ■FY16 forecast, driven by improved PPOP and reduced provisions.
Offsetting a tapering credit cycle, NIM widened on mounting FX spread and ■improved LDR, but likely to contract in 2H16 on further rate cuts.
Fee expanding on bancassurance and syndication loans. ■ Credit costs to normalise. Intact solvency. No recapitalisation needed. ■ Upgrade to Add on sustained topline and above-average earnings. ■
1Q16: driven by improved bank earnings Slightly better than expected, First FHC’s 1Q16 net profit of NT$4.43bn (US$136m, +12% qoq, +8% yoy vs. industry average of -37% yoy) formed 27% of our FY16 forecast. The earnings momentum came from First Bank, which posted 1Q16 net profit of NT$4.81bn (+18% qoq, +17% yoy), driven by 1) strong pre-provision operating profit (PPOP, +18% qoq, +23% yoy) due to improved investment income (including dividends of NT$560m from Taiwan High Speed Rail Corp.) and 2) reduced provisions (-25% qoq).
Widening NIM offset stagnant loan growth; strong bancassurance Despite a tapering credit cycle (-0.5% qoq) dragged by FX/SME lending, NIM rose further (+1bp qoq) thanks to mounting FX spread (+16bp) and improved LDR (77.3% in 1Q16), leading net interest income to rise 2% yoy in 1Q16. Total net fees grew 19% yoy (Fig 5), driven by wealth management, especially bancassurance (+92% yoy) due to low interest rates and First Bank’s immense distribution network. Loan-related fees also rose 81% yoy on sustained demand for large corporate loans (Fig 4).
Outlook: recovering corporate loans; continued fee expansion Management guided for total loan growth of 3-3.5% in FY16, driven by large corporate loans and sustained funding demand from overseas branches/subsidiaries. NIM contraction (-3bp) could arrive in 2H16 given local rate cuts. Management estimates 15% yoy growth in net fees, driven by bancassurance and syndication loans.
Credit costs to normalise; no fund-raising needed in the near term Total NPL ratio remained stable at 0.19% and reserve coverage stood at 692% at end-1Q16. Annualised credit cost ended at 6bp despite the increased NPL influx (0.1% of total loans, resulting from some SME loans and exposure to certain touch panel maker, Fig 11). Management guided for normalising credit cost through FY16 as nearly 90% of the legacy bad debt has been provisioned. The recapitalisation in 3Q15 raised the group capital adequacy ratio to 146% and banking Tier 1 ratio to 11.3% at end-1Q16.
Raise EPS and target price; upgrade to Add We raise our FY16/17F EPS by 8%/10% to factor in higher fees/investment returns and derive a higher SOP-based target price of NT$18.5. We forecast First FHC’s PPOP will grow 5-8% and EPS by 7-11% in FY16-18F. Currently at 0.9-1x FY16 P/BV, the stock has outperformed peers due to its superior earnings progress. We see further share price upside given its sustained fee momentum, which should support is topline amid a downturn. Potential downside risks are market volatility and macro deterioration.
▎ Taiwan
ADD (previously HOLD) Current price: NT$16.50 Target price: NT$18.50 Previous target: NT$16.30
Up/downside: 12.1% Reuters: 2892.TW Bloomberg: 2892 TT Market cap: US$5,794m NT$189,108m Average daily turnover: US$8.75m NT$292.3m Current shares o/s 8,956m Free float: 70.0% Key changes in this note
FY16F net fees raised by 7%. FY16F EPS increased by 8%. FY16F ROE lifted to 9.25%.
Source: Bloomberg Price performance 1M 3M 12M
Absolute (%) 4.4 6.5 -4.6 Relative (%) 2.5 5.0 7.4
Analysts
Nora HOU
T (886) 2 8729 8373 E [email protected] Michael CHEN T (886) 2 8729 8379 E [email protected]
[ X ]
SOURCES: COMPANY DATA, CIMB FORECASTS
Financial Summary Dec-14A Dec-15A Dec-16F Dec-17F Dec-18F
Net Interest Income (NT$m) 28,229 28,444 28,748 29,564 30,503Total Non-Interest Income (NT$m) 11,968 12,165 13,328 14,468 15,608Operating Revenue (NT$m) 40,198 40,609 42,076 44,032 46,111Total Provision Charges (NT$m) (3,933) (506) (559) (457) (484)Net Profit (NT$m) 14,085 16,006 17,752 18,984 20,256Normalised EPS (NT$) 1.23 1.40 1.55 1.66 1.77Normalised EPS Growth 29.4% 13.6% 10.9% 6.9% 6.7%FD Normalised P/E (x) 10.49 10.68 10.65 9.96 9.34DPS (NT$) 0.70 0.95 1.01 1.08 1.15Dividend Yield 4.24% 5.76% 6.10% 6.53% 6.96%BVPS (NT$) 13.43 16.37 17.07 17.81 18.61P/BV (x) 1.23 1.01 0.97 0.93 0.89ROE 9.53% 9.35% 9.25% 9.48% 9.69%% Change In Normalised EPS Estimates 7.72% 9.61%Normalised EPS/consensus EPS (x) 1.13 1.17 1.21
98.0100.8103.6106.4109.2112.0
13.0014.0015.0016.0017.0018.00
Price Close Relative to TAIEX (RHS)
50
100
150
Jun-15 Sep-15 Dec-15 Mar-16
Vol m
23

Technology│Taiwan│Equity research│May 31, 2016
Sector Note
IMPORTANT DISCLOSURES, INCLUDING ANY REQUIRED RESEARCH CERTIFICATIONS, ARE PROVIDED AT THE END OF THIS REPORT. IF THIS REPORT IS DISTRIBUTED IN THE UNITED STATES IT IS DISTRIBUTED BY CIMB SECURITIES (USA), INC. AND IS CONSIDERED THIRD-PARTY AFFILIATED RESEARCH.
Powered by the EFA Platform
Technology – Overall Computex 2016 snapshot
Despite the hot weather, 2016 Computex is a cold event. The only bright spot is ■Asustek’s new robot product (Zenbo) and ZenFone 3.
Most PC brands are focused on similar areas such as (1) VR, (2) Gaming and (3) ■IoT/Cloud. However, we do not see much differentiation among brands.
We cut our 2016 global PC shipment forecast to -7.6% yoy (from -6.3%) on weak ■recovery and less attractive products compared to smartphones.
We advise investors to avoid stocks with high PC exposure. Our top picks remain ■Advantech in the PC space and Largan in the smartphone space.
The future seems still far away Computex 2016 is being held in Taipei during 31 May to 4 Jun. While pre-registered international buyers rose 3.8% yoy (15.5 thousand people), the number of exhibitors declined by 5.7% yoy - only 1,602 companies in 2016. Computex 2016 is focused on (1) Internet of things (IoT), (2) visual reality (VR), (3) gaming PC, (4) Artificial Intelligence (AI) and robots. Besides gaming PC, other applications are still at initial stages and offer limited contribution for PC brands in the near term.
Asustek is the key focus Asustek is the key focus in Computex 2016 in the absence of Apple, Lenovo, HP and Dell. Meanwhile, we hardly saw any differentiated elements in Acer’s products. Asustek showcased three ZenFone 3 models with impressive industrial designs and cameras. Its new robot product (Zenbo) is another bright spot. Despite limited functionalities, the ASP of US$599 is more affordable than Pepper (US$2,000).
Impact of Computex is diminishing In the absence of HP, Dell, Lenovo and Apple, along with fewer applications or impressive products, the impact of Computex is diminishing. While Asustek launched several impressive NB products such as the ZenBook 3, most people were still gathered around the smartphone space. PC brands are trying to expand their exposure to high margin or high growth areas such as IoT, VR or gaming PC, but we see limited differentiation among the brands.
Price and applications are still key for VR demand take-off Virtual reality (VR) is another key area with high growth expectations. In terms of hardware, HTC’s Vive is probably the most impressive product in the VR space so far, in our view. However, in both VR and IoT, Taiwanese hardware companies have limited exposure to software or platform. In addition, given the current VR products still need high-end PCs to support (US$1,000-2,000), the total cost (PC plus VR) could be around US$1,800-2,500 which might limit the users to heavy gamers only.
Increasing TAM from new applications, but still at infancy stage Both MTK and ASE showcased their abilities in providing solutions for smart home devices which tap into a lot of sensor units, while RLTK rolled out automotive products with connectivity features by leveraging its existing resources. We saw many VR devices being introduced to test the waters, which we deem positive as it may fasten the upgrades for display, GPU, time controllers, computing and connectivity. However, we believe it will take a long time until a killer product/platform comes to stage.
No excitement in Computex We do expect Taiwanese fabless and OSAT companies to benefit somewhat from the IoT market growth going forward, but we do not expect the topline and bottomline contributions to be material in the near term. On the PC side, with weak demand recovery and limited contribution from high-growth areas, we advise investors to avoid stocks with high PC exposure. Our top picks remain only Advantech in the PC space and Largan in the smartphone space in view of incremental camera upgrades.
[ X ]
▎Taiwan
Neutral (no change)
Analyst(s)
Felix PAN
T (886) 2 8729 8386 E [email protected] Peter CHAN T (886) 2 8729 8377 E [email protected] James TAN T (886) 2 8729 8378 E [email protected]
24

Hospitals│Thailand│Equity research│May 31, 2016
Company Note
IMPORTANT DISCLOSURES, INCLUDING ANY REQUIRED RESEARCH CERTIFICATIONS, ARE PROVIDED AT THE END OF THIS REPORT. IF THIS REPORT IS DISTRIBUTED IN THE UNITED STATES IT IS DISTRIBUTED BY CIMB SECURITIES (USA), INC. AND IS CONSIDERED THIRD-PARTY AFFILIATED RESEARCH.
Powered by the EFA Platform
Bangkok Chain Hospital 1
st price hike after two years
BCH management plans to raise its lab fees and medicine prices by 10% on 1 Jun. ■ Management expects World Medical Centre (WMC) to continue to see higher ■revenues qoq in 2Q16.
It added 45,000 social security patients in 1Q16, +6% qoq, which is impressive. ■ Raise FY16-18 EPS forecasts by 8-12% due to price hikes and higher SSS patients. ■ Our target price is lifted to THB11.2 (35x CY17F P/E, +0.5 s.d. above 5-year mean) ■from THB8.70 (30x CY17F P/E, 5-year mean). Upgrade from Reduce to Hold.
10% hike on lab fees and medicines In an analysts meeting today, BCH’s CEO Dr Chalerm Harnphanich announced that it plans to increase its lab fees and medicines by 10% on 1 Jun, the first increase in two years. Since other mid-to-high end hospitals have been raising prices more aggressively than BCH over the past few years, we do not expect BCH’s price increases to have much impact on its cash patient volume.
WMC’s take-off still on track Management expects WMC revenues to continue increasing qoq in 2Q16, which is impressive, given that 2Q is typically weaker than 1Q. 2H is normally stronger than 1H. The increase in WMC revenues could be attributed to new flows of Qatar patients, return of Chinese patients after Chinese New Year and higher patients’ illness intensity, especially among Middle East patients.
Impressive increase in Social Security Scheme (SSS) patients With strong Kasemrad brand, BCH could add about 45,000 SSS patients in 1Q16, +6% qoq which is quite impressive. BCH is still the biggest private hospital group that serves SSS patients, who in turn contribute about one-third of BCH’s revenues. With more SSS quota for existing hospitals and new quotas for new hospitals, we expect BCH to continue to do well in this segment over the next few years.
Gradual expansion over the next few years BCH currently has 11 hospitals with more than 2,000 beds. It plans to add three greenfield hospitals and expand capacity of two existing hospitals over the next few years. The expansion would cost about THB1.6bn (US$43m) which can be easily financed by its internal cashflows. Therefore, there is no concern on this front.
Upgrade to Hold with a new THB11.2 target price With price hikes and higher SSS patients, we revise up our forecasts by 8-12% for CY16-18. With lower downside risk on WMC’s failed take off, our target price is lifted to THB11.2 now based on 35x CY17F P/E, +0.5 s.d. above 5-year mean from previous THB8.70, its 5-year mean. We upgrade our call from Reduce to Hold. Downside risk could still come from disappointing WMC performance, while new groups of foreign patients would add more upside.
▎Thailand
HOLD (previously REDUCE) Consensus ratings*: Buy 7 Hold 4 Sell 5
Current price: THB11.00 Target price: THB11.20 Previous target: THB8.70
Up/downside: 1.8% CIMB / Consensus: 0.8%
Reuters: BCH.BK Bloomberg: BCH TB Market cap: US$767.7m THB27,431m Average daily turnover: US$2.64m THB93.11m Current shares o/s: 2,494m Free float: 38.2% * Source: Bloomberg Key changes in this note
FY16F EPS increased by 8%. FY17F EPS increased by 12.5%. FY18F EPS increased by 11%.
Source: Bloomberg
Price performance 1M 3M 12M Absolute (%) 6.8 10 57.1 Relative (%) 5.4 3.1 61.9
Major shareholders % held Harnphanich family 49.8 BGH 1.5
Analyst(s)
Kasem PRUNRATANAMALA, CFA
T (66) 2 657 9221 E [email protected]
[ X ]
SOURCE: COMPANY DATA, CIMB FORECASTS
Financial Summary Dec-14A Dec-15A Dec-16F Dec-17F Dec-18F
Revenue (THBm) 5,301 5,766 6,487 7,200 7,776Operating EBITDA (THBm) 1,422 1,471 1,693 1,902 2,082Net Profit (THBm) 521.9 527.2 676.3 801.9 918.7Core EPS (THB) 0.21 0.21 0.27 0.32 0.37Core EPS Growth (19.7%) 1.0% 28.3% 18.6% 14.6%FD Core P/E (x) 52.56 52.03 40.56 34.21 29.86DPS (THB) 0.12 0.12 0.14 0.16 0.18Dividend Yield 1.09% 1.09% 1.23% 1.46% 1.67%EV/EBITDA (x) 22.08 21.56 18.83 17.05 15.63P/FCFE (x) NA 58.1 131.9 93.2 97.5Net Gearing 73.6% 75.8% 70.5% 70.9% 63.2%P/BV (x) 6.63 6.29 5.84 5.38 4.94ROE 12.9% 12.4% 14.9% 16.4% 17.2%% Change In Core EPS Estimates 8.4% 12.5% 11.2%CIMB/consensus EPS (x) 0.98 0.99 0.97
84
114
144
174
5.80
7.80
9.80
11.80Price Close Relative to SET (RHS)
20
40
60
Jun-15 Sep-15 Dec-15 Mar-16
Vol m
25

Asia Pacific Daily│Equity research│June 1, 2016
REGIONAL SECTOR HEADS
KJ KWANG Ivy NG, CFA Raymond YAP, CFA Offshore & Marine Plantations Transportation +82 (2) 6730 6123 +60 (3) 2261 9073 +60 (3) 2261 9072 [email protected] [email protected] [email protected]
COUNTRY HEADS OF RESEARCH
Ivy NG, CFA Bertram LAI Eric LIN Erwan TEGUH Pramod AMTHE Malaysia (Deputy Head) Hong Kong/China Taiwan Indonesia India +60 (3) 2261 9073 +852 2532 1111 +886 (2) 8729 8380 +62 (21) 3006 1720 +91 (22) 6602-5167 [email protected] [email protected] [email protected] [email protected] [email protected] Dohoon LEE Kenneth NG, CFA Kasem PRUNRATANAMALA, CFA South Korea Singapore Thailand +82 (2) 6730 6121 +65 6210 8610 +66 (2) 657 9221 [email protected] [email protected] [email protected] Michael KOKALARI, CFA Jose Paolo Deogracias Fontanilla Yolan SEIMON Vietnam Philippines Sri Lanka +84 907 974408 +63 (2) 888 7118 +94 (11) 2306273 [email protected] [email protected] [email protected] Coverage via partnership arrangement with Coverage via partnership arrangement with SB Equities John Keells Stock Brokers
7
26

Asia Pacific Daily│Equity research│June 1, 2016
DISCLAIMER WJV#05
The content of this report (including the views and opinions expressed therein, and the information comprised therein) has been prepared by and belongs to CIMB save that (i) if it is a report written by the analyst(s) of John Keells Stock Brokers (“John Keells”), it belongs to John Keells; (ii) if it is a report written by the analyst(s) of SB Equities Inc (“SBE”), it belongs to SBE; and (iii) if it is a report written by the analyst(s) of Morgans Financial Limited (“Morgans”), it belongs to Morgans. This report is distributed by CIMB and in respect of sections of the report relating to (i), (ii) and/or (iii) aforesaid, it is distributed pursuant to an arrangement between John Keells, SBE and Morgans respectively and none of the aforesaid parties is an affiliate of CIMB. This report is not directed to, or intended for distribution to or use by, any person or entity who is a citizen or resident of or located in any locality, state, country or other jurisdiction where such distribution, publication, availability or use would be contrary to law or regulation. By accepting this report, the recipient hereof represents and warrants that he is entitled to receive such report in accordance with the restrictions set forth below and agrees to be bound by the limitations contained herein (including the “Restrictions on Distributions” set out below). Any failure to comply with these limitations may constitute a violation of law. This publication is being supplied to you strictly on the basis that it will remain confidential. No part of this report may be (i) copied, photocopied, duplicated, stored or reproduced in any form by any means or (ii) redistributed or passed on, directly or indirectly, to any other person in whole or in part, for any purpose without the prior written consent of CIMB. The information contained in this research report is prepared from data believed to be correct and reliable at the time of issue of this report. CIMB, John Keells, SBE and/or Morgans, as the case may be, may or may not issue regular reports on the subject matter of this report at any frequency and may cease to do so or change the periodicity of reports at any time. None of CIMB, John Keells, SBE or Morgans is under any obligation to update this report in the event of a material change to the information contained in this report. None of CIMB, John Keells, SBE or Morgans has any and none of them will accept any, obligation to (i) check or ensure that the contents of this report remain current, reliable or relevant, (ii) ensure that the content of this report constitutes all the information a prospective investor may require, (iii) ensure the adequacy, accuracy, completeness, reliability or fairness of any views, opinions and information, and accordingly, CIMB, John Keells, SBE and Morgans and their respective affiliates and related persons (and their respective directors, associates, connected persons and/or employees) shall not be liable in any manner whatsoever for any consequences (including but not limited to any direct, indirect or consequential losses, loss of profits and damages) of any reliance thereon or usage thereof. In particular, CIMB, John Keells, SBE and Morgans disclaim all responsibility and liability for the views and opinions set out in this report. Unless otherwise specified, this report is based upon reasonable sources. Such sources will, unless otherwise specified, for market data, be market data and prices available from the main stock exchange or market where the relevant security is listed, or, where appropriate, any other market. Information on the accounts and business of company(ies) will generally be based on published statements of the company(ies), information disseminated by regulatory information services, other publicly available information and information resulting from our research. Whilst every effort is made to ensure that statements of facts made in this report are accurate, all estimates, projections, forecasts, expressions of opinion and other subjective judgments contained in this report are based on assumptions considered to be reasonable as of the date of the document in which they are contained and must not be construed as a representation that the matters referred to therein will occur. Past performance is not a reliable indicator of future performance. The value of investments may go down as well as up and those investing may, depending on the investments in question, lose more than the initial investment. No report shall constitute an offer or an invitation by or on behalf of CIMB, John Keells, SBE or Morgans or their respective affiliates to any person to buy or sell any investments. CIMB, John Keells, SBE and/or Morgans and/or their respective affiliates and related companies, their directors, associates, connected parties and/or employees may own or have positions in securities of the company(ies) covered in this research report or any securities related thereto and may from time to time add to or dispose of, or may be materially interested in, any such securities. Further, CIMB, John Keells, SBE and/or Morgans and/or their respective affiliates and related companies do and seek to do business with the company(ies) covered in this research report and may from time to time act as market maker or have assumed an underwriting commitment in securities of such company(ies), may sell them to or buy them from customers on a principal basis and may also perform or seek to perform significant investment banking, advisory, underwriting or placement services for or relating to such company(ies) as well as solicit such investment, advisory or other services from any entity mentioned in this report. CIMB, John Keells, SBE and/or Morgans and/or their respective affiliates may enter into an agreement with the company(ies) covered in this report relating to the production of research reports. CIMB, John Keells, SBE and/or Morgans may disclose the contents of this report to the company(ies) covered by it and may have amended the contents of this report following such disclosure. The analyst responsible for the production of this report hereby certifies that the views expressed herein accurately and exclusively reflect his or her personal views and opinions about any and all of the issuers or securities analysed in this report and were prepared independently and autonomously. No part of the compensation of the analyst(s) was, is, or will be directly or indirectly related to the inclusion of specific recommendations(s) or view(s) in this report. The analyst(s) who prepared this research report are prohibited from receiving any compensation, incentive or bonus based on specific investment banking transactions or for providing a specific recommendation for, or view of, a particular company. Information barriers and other arrangements may be established where necessary to prevent conflicts of interests arising. However, the analyst(s) may receive compensation that is based on his/their coverage of company(ies) in the performance of his/their duties or the performance of his/their recommendations and the research personnel involved in the preparation of this report may also participate in the solicitation of the businesses as described above. In reviewing this research report, an investor should be aware that any or all of the foregoing, among other things, may give rise to real or potential conflicts of interest. Additional information is, subject to the duties of confidentiality, available on request. The term “John Keells Stock Brokers” shall, unless the context otherwise requires, mean each of John Keells Stock Brokers and its affiliates, subsidiaries and related companies. The term “SB Equities Inc.” shall, unless the context otherwise requires, mean each of SB Equities Inc. and its affiliates, subsidiaries and related companies. The term “Morgans Financial Limited” shall, unless the context otherwise requires, mean each of Morgans Financial Limited and its affiliates, subsidiaries and related companies. The term “CIMB” shall denote, where appropriate, the relevant entity distributing or disseminating the report in the particular jurisdiction referenced below, or, in every other case, CIMB Group Holdings
8
27

Asia Pacific Daily│Equity research│June 1, 2016
Berhad ("CIMBGH") and its affiliates, subsidiaries and related companies.
Country CIMB Entity Regulated by Hong Kong CIMB Securities Limited Securities and Futures Commission Hong Kong India CIMB Securities (India) Private Limited Securities and Exchange Board of India (SEBI) Indonesia PT CIMB Securities Indonesia Financial Services Authority of Indonesia Malaysia CIMB Investment Bank Berhad Securities Commission Malaysia Singapore CIMB Research Pte. Ltd. Monetary Authority of Singapore South Korea CIMB Securities Limited, Korea Branch Financial Services Commission and Financial Supervisory Service Taiwan CIMB Securities Limited, Taiwan Branch Financial Supervisory Commission Thailand CIMB Securities (Thailand) Co. Ltd. Securities and Exchange Commission Thailand
Information in this report is a summary derived from individual research reports. As such, readers are directed to the individual research report or note to review the individual Research Analyst’s full analysis of the subject company. Important disclosures relating to the companies that are the subject of research reports published by CIMB, John Keells, SBE or Morgans, as the case may be, and the proprietary position by each of them and shareholdings of its Research Analysts’ who prepared the report in the securities of the company(s) are available in the individual research report. This report does not purport to contain all the information that a prospective investor may require. CIMB, John Keells, SBE and Morgans and their respective affiliates do not make any guarantee, representation or warranty, express or implied, as to the adequacy, accuracy, completeness, reliability or fairness of any such information and opinion contained in this report. None of CIMB, John Keells, SBE, Morgans and their respective affiliates and related persons shall be liable in any manner whatsoever for any consequences (including but not limited to any direct, indirect or consequential losses, loss of profits and damages) of any reliance thereon or usage thereof. This report is general in nature and has been prepared for information purposes only. It is intended for circulation amongst CIMB and its affiliates’ clients generally and does not have regard to the specific investment objectives, financial situation and the particular needs of any specific person who may receive this report. The information and opinions in this report are not and should not be construed or considered as an offer, recommendation or solicitation to buy or sell the subject securities, related investments or other financial instruments or any derivative instrument, or any rights pertaining thereto. Investors are advised to make their own independent evaluation of the information contained in this research report, consider their own individual investment objectives, financial situation and particular needs and consult their own professional and financial advisers as to the legal, business, financial, tax and other aspects before participating in any transaction in respect of the securities of company(ies) covered in this research report. The securities of such company(ies) may not be eligible for sale in all jurisdictions or to all categories of investors.
Australia : The distribution of this report is not an offer to buy or sell to any person within or outside Australia or a solicitation to any person within or outside of Australia to buy or sell any instrument described herein. This report is being issued outside Australia to a limited number of institutional investors and may not be provided to any person other than the original recipient and may not be reproduced or used for any other purposes. Canada: This research report has not been prepared in accordance with the disclosure requirements of Dealer Member Rule 3400 – Research Restrictions and Disclosure Requirements of the Investment Industry Regulatory Organization of Canada. For any research report distributed by CIBC, further disclosures related to CIBC conflicts of interest can be found at https://researchcentral.cibcwm.com . China: For the purpose of this report, the People’s Republic of China (“PRC”) does not include the Hong Kong Special Administrative Region, the Macau Special Administrative Region or Taiwan. The distributor of this report has not been approved or licensed by the China Securities Regulatory Commission or any other relevant regulatory authority or governmental agency in the PRC. This report contains only marketing information. The distribution of this report is not an offer to buy or sell to any person within or outside PRC or a solicitation to any person within or outside of PRC to buy or sell any instruments described herein. This report is being issued outside the PRC to a limited number of institutional investors and may not be provided to any person other than the original recipient and may not be reproduced or used for any other purpose. France: Only qualified investors within the meaning of French law shall have access to this report. This report shall not be considered as an offer to subscribe to, or used in connection with, any offer for subscription or sale or marketing or direct or indirect distribution of financial instruments and it is not intended as a solicitation for the purchase of any financial instrument. Germany: This report is only directed at persons who are professional investors as defined in sec 31a(2) of the German Securities Trading Act (WpHG). This publication constitutes research of a non-binding nature on the market situation and the investment instruments cited here at the time of the publication of the information. The current prices/yields in this issue are based upon closing prices from Bloomberg as of the day preceding publication. Please note that neither the German Federal Financial Supervisory Agency (BaFin), nor any other supervisory authority exercises any control over the content of this report. Hong Kong: This report is issued and distributed in Hong Kong by CIMB Securities Limited (“CHK”) which is licensed in Hong Kong by the Securities and Futures Commission for Type 1 (dealing in securities), Type 4 (advising on securities) and Type 6 (advising on corporate finance) activities. Any investors wishing to purchase or otherwise deal in the securities covered in this report should contact the Head of Sales at CIMB Securities Limited. The views and opinions in this research report are of CIMB, John Keells, SBE or Morgans, as the case may be, as of the date hereof and are subject to change. If the Financial Services and Markets Act of the United Kingdom or the rules of the Financial Conduct Authority apply to a recipient, our obligations owed to such recipient therein are unaffected. CHK has no obligation to update its opinion or the information in this research report. This publication is strictly confidential and is for private circulation only to clients of CHK. India: This report is issued and distributed in India by CIMB Securities (India) Private Limited (“CIMB India”) which is registered with the National Stock Exchange of India Limited and BSE Limited as a trading and clearing member under the Securities and Exchange Board of India (Stock
9
28

Asia Pacific Daily│Equity research│June 1, 2016
Brokers and Sub-Brokers) Regulations, 1992. In accordance with the provisions of Regulation 4(g) of the Securities and Exchange Board of India (Investment Advisers) Regulations, 2013, CIMB India is not required to seek registration with the Securities and Exchange Board of India (“SEBI”) as an Investment Adviser. CIMB India is registered with SEBI as a Research Analyst pursuant to the SEBI (Research Analysts) Regulations, 2014 ("Regulations"). This report does not take into account the particular investment objectives, financial situations, or needs of the recipients. It is not intended for and does not deal with prohibitions on investment due to law/jurisdiction issues etc. which may exist for certain persons/entities. Recipients should rely on their own investigations and take their own professional advice before investment. The report is not a “prospectus” as defined under Indian Law, including the Companies Act, 2013, and is not, and shall not be, approved by, or filed or registered with, any Indian regulator, including any Registrar of Companies in India, SEBI, any Indian stock exchange, or the Reserve Bank of India. No offer, or invitation to offer, or solicitation of subscription with respect to any such securities listed or proposed to be listed in India is being made, or intended to be made, to the public, or to any member or section of the public in India, through or pursuant to this report. The research analysts, strategists or economists principally responsible for the preparation of this research report are segregated from the other activities of CIMB India and they have received compensation based upon various factors, including quality, accuracy and value of research, firm profitability or revenues, client feedback and competitive factors. Research analysts', strategists' or economists' compensation is not linked to investment banking or capital markets transactions performed or proposed to be performed by CIMB India or its affiliates. Indonesia: This report is issued and distributed by PT CIMB Securities Indonesia (“CIMBI”). The views and opinions in this research report are our own as of the date hereof and are subject to change. If the Financial Services and Markets Act of the United Kingdom or the rules of the Financial Conduct Authority apply to a recipient, our obligations owed to such recipient therein are unaffected. CIMBI has no obligation to update its opinion or the information in this research report. Neither this report nor any copy hereof may be distributed in Indonesia or to any Indonesian citizens wherever they are domiciled or to Indonesian residents except in compliance with applicable Indonesian capital market laws and regulations. This research report is not an offer of securities in Indonesia. The securities referred to in this research report have not been registered with the Financial Services Authority (Otoritas Jasa Keuangan) pursuant to relevant capital market laws and regulations, and may not be offered or sold within the territory of the Republic of Indonesia or to Indonesian citizens through a public offering or in circumstances which constitute an offer within the meaning of the Indonesian capital market law and regulations. Ireland: CIMB is not an investment firm authorised in the Republic of Ireland and no part of this document should be construed as CIMB acting as, or otherwise claiming or representing to be, an investment firm authorised in the Republic of Ireland. Malaysia: This report is issued and distributed by CIMB Investment Bank Berhad (“CIMB”) solely for the benefit of and for the exclusive use of our clients. If the Financial Services and Markets Act of the United Kingdom or the rules of the Financial Conduct Authority apply to a recipient, our obligations owed to such recipient therein are unaffected. CIMB has no obligation to update, revise or reaffirm its opinion or the information in this research reports after the date of this report. New Zealand: In New Zealand, this report is for distribution only to persons who are wholesale clients pursuant to section 5C of the Financial Advisers Act 2008. Singapore: This report is issued and distributed by CIMB Research Pte Ltd (“CIMBR”). CIMBR is a financial adviser licensed under the Financial Advisers Act, Cap 110 (“FAA”) for advising on investment products, by issuing or promulgating research analyses or research reports, whether in electronic, print or other form. Accordingly CIMBR is a subject to the applicable rules under the FAA unless it is able to avail itself to any prescribed exemptions. Recipients of this report are to contact CIMB Research Pte Ltd, 50 Raffles Place, #19-00 Singapore Land Tower, Singapore in respect of any matters arising from, or in connection with this report. CIMBR has no obligation to update its opinion or the information in this research report. This publication is strictly confidential and is for private circulation only. If you have not been sent this report by CIMBR directly, you may not rely, use or disclose to anyone else this report or its contents. If the recipient of this research report is not an accredited investor, expert investor or institutional investor, CIMBR accepts legal responsibility for the contents of the report without any disclaimer limiting or otherwise curtailing such legal responsibility. If the recipient is an accredited investor, expert investor or institutional investor, the recipient is deemed to acknowledge that CIMBR is exempt from certain requirements under the FAA and its attendant regulations, and as such, is exempt from complying with the following : (a) Section 25 of the FAA (obligation to disclose product information); (b) Section 27 (duty not to make recommendation with respect to any investment product without having a reasonable basis where you may be reasonably expected to rely on the recommendation) of the FAA; (c) MAS Notice on Information to Clients and Product Information Disclosure [Notice No. FAA-N03]; (d) MAS Notice on Recommendation on Investment Products [Notice No. FAA-N16]; (e) Section 36 (obligation on disclosure of interest in securities), and (f) any other laws, regulations, notices, directive, guidelines, circulars and practice notes which are relates to the above, to the extent permitted by applicable laws, as may be amended from time to time, and any other laws, regulations, notices, directive, guidelines, circulars, and practice notes as we may notify you from time to time. In addition, the recipient who is an accredited investor, expert investor or institutional investor acknowledges that a CIMBR is exempt from Section 27 of the FAA, the recipient will also not be able to file a civil claim against CIMBR for any loss or damage arising from the recipient’s reliance on any recommendation made by CIMBR which would otherwise be a right that is available to the recipient under Section 27 of the FAA, the recipient will also not be able to file a civil claim against CIMBR for any loss or damage arising from the recipient’s reliance on any recommendation made by CIMBR which would otherwise be a right that is available to the recipient under Section 27 of the FAA. South Korea: This report is issued and distributed in South Korea by CIMB Securities Limited, Korea Branch (“CIMB Korea”) which is licensed as a cash equity broker, and regulated by the Financial Services Commission and Financial Supervisory Service of Korea. In South Korea, this report is for distribution only to professional investors under Article 9(5) of the Financial Investment Services and Capital Market Act of Korea
10
29

Asia Pacific Daily│Equity research│June 1, 2016
(“FSCMA”). Spain: This document is a research report and it is addressed to institutional investors only. The research report is of a general nature and not personalised and does not constitute investment advice so, as the case may be, the recipient must seek proper advice before adopting any investment decision. This document does not constitute a public offering of securities. CIMB is not registered with the Spanish Comision Nacional del Mercado de Valores to provide investment services. Sweden: This report contains only marketing information and has not been approved by the Swedish Financial Supervisory Authority. The distribution of this report is not an offer to sell to any person in Sweden or a solicitation to any person in Sweden to buy any instruments described herein and may not be forwarded to the public in Sweden. Switzerland: This report has not been prepared in accordance with the recognized self-regulatory minimal standards for research reports of banks issued by the Swiss Bankers’ Association (Directives on the Independence of Financial Research). Taiwan: This research report is not an offer or marketing of foreign securities in Taiwan. The securities as referred to in this research report have not been and will not be registered with the Financial Supervisory Commission of the Republic of China pursuant to relevant securities laws and regulations and may not be offered or sold within the Republic of China through a public offering or in circumstances which constitutes an offer or a placement within the meaning of the Securities and Exchange Law of the Republic of China that requires a registration or approval of the Financial Supervisory Commission of the Republic of China. Thailand: This report is issued and distributed by CIMB Securities (Thailand) Company Limited (“CIMBS”) based upon sources believed to be reliable (but their accuracy, completeness or correctness is not guaranteed). The statements or expressions of opinion herein were arrived at after due and careful consideration for use as information for investment. Such opinions are subject to change without notice and CIMBS has no obligation to update its opinion or the information in this research report. If the Financial Services and Markets Act of the United Kingdom or the rules of the Financial Conduct Authority apply to a recipient, our obligations owed to such recipient are unaffected. CIMB Securities (Thailand) Co., Ltd. may act or acts as Market Maker, and issuer and offerer of Derivative Warrants and Structured Note which may have the following securities as its underlying securities. Investors should carefully read and study the details of the derivative warrants in the prospectus before making investment decisions. AAV, ADVANC, AMATA, ANAN, AOT, AP, BA, BANPU, BBL, BCP, BDMS, BEAUTY, BEC, BEM, BH, BJCHI, BLA, BLAND, BTS, CBG, CENTEL, CHG, CK, CKP, CPALL, CPF, CPN, DELTA, DTAC, EARTH, EGCO, EPG, GL, GLOW, GPSC, GUNKUL, HANA, HMPRO, ICHI, INTUCH, IRPC, ITD, IVL, JAS, KBANK, KCE, KKP, KTB, KTC, LH, LHBANK, LPN, M, MAJOR, MINT, PLANB, PLAT, PS, PTG, PTT, PTTEP, PTTGC, QH, ROBINS, RS, S, SAMART, SAMTEL, SAWAD, SCB, SCC, SCCC, SCN, SGP, SIRI, SPALI, SPCG, STEC, STPI, SVI, TASCO, TCAP, THAI, THCOM, TICON, TISCO, TMB, TOP, TPIPL, TRUE, TTA, TTCL, TTW, TU, UNIQ, UV, VGI, VNG, WHA, WORK. Corporate Governance Report: The disclosure of the survey result of the Thai Institute of Directors Association (“IOD”) regarding corporate governance is made pursuant to the policy of the Office of the Securities and Exchange Commission. The survey of the IOD is based on the information of a company listed on the Stock Exchange of Thailand and the Market for Alternative Investment disclosed to the public and able to be accessed by a general public investor. The result, therefore, is from the perspective of a third party. It is not an evaluation of operation and is not based on inside information. The survey result is as of the date appearing in the Corporate Governance Report of Thai Listed Companies. As a result, the survey result may be changed after that date. CIMBS does not confirm nor certify the accuracy of such survey result.
Score Range: 90 - 100 80 - 89 70 - 79 Below 70 or No Survey Result Description: Excellent Very Good Good N/A
United Arab Emirates: The distributor of this report has not been approved or licensed by the UAE Central Bank or any other relevant licensing authorities or governmental agencies in the United Arab Emirates. This report is strictly private and confidential and has not been reviewed by, deposited or registered with UAE Central Bank or any other licensing authority or governmental agencies in the United Arab Emirates. This report is being issued outside the United Arab Emirates to a limited number of institutional investors and must not be provided to any person other than the original recipient and may not be reproduced or used for any other purpose. Further, the information contained in this report is not intended to lead to the sale of investments under any subscription agreement or the conclusion of any other contract of whatsoever nature within the territory of the United Arab Emirates. United Kingdom: The distribution of this report is not an offer to buy or sell to any person within or outside the United Kingdom or a solicitation to any person within or outside of the United Kingdom to buy or sell any instruments described herein. This report is being issued outside the United Kingdom and to a limited number of institutional investors and may not be provided to any person other than the original recipient and may not be reproduced or used for any other purpose. United States: This research report is distributed in the United States of America by CIMB Securities (USA) Inc, a U.S. registered broker-dealer and a related company of CIMB Research Pte Ltd, CIMB Investment Bank Berhad, PT CIMB Securities Indonesia, CIMB Securities (Thailand) Co. Ltd, CIMB Securities Limited, CIMB Securities (India) Private Limited, and is distributed solely to persons who qualify as “U.S. Institutional Investors” as defined in Rule 15a-6 under the Securities and Exchange Act of 1934. This communication is only for Institutional Investors whose ordinary business activities involve investing in shares, bonds, and associated securities and/or derivative securities and who have professional experience in such investments. Any person who is not a U.S. Institutional Investor or Major Institutional Investor must not rely on this communication. The delivery of this research report to any person in the United States of America is not a recommendation to effect any transactions in the securities discussed herein, or an endorsement of any opinion expressed herein. CIMB Securities (USA) Inc, is a FINRA/SIPC member and takes responsibility for the content of this report. For further information or to place an order in any of the above-mentioned securities please contact a registered representative of CIMB Securities (USA) Inc. Other jurisdictions: In any other jurisdictions, except if otherwise restricted by laws or regulations, this report is only for distribution to professional, institutional or sophisticated investors as defined in the laws and regulations of such jurisdictions.
11
30

Asia Pacific Daily│Equity research│June 1, 2016
Corporate Governance Report of Thai Listed Companies (CGR). CG Rating by the Thai Institute of Directors Association (Thai IOD) in 2015, Anti-Corruption Progress Indicator 2015. AAV – Very Good, 3B, ADVANC – Excellent, 3A, AEONTS – Good, 1, AMATA – Very Good, 2, ANAN – Very Good, 3A, AOT – Very Good, 2, AP - Good, 3A, ASK – Very Good, 3B, ASP – Very Good, 4, BANPU – Very Good, 4, BAY – Very Good, 4, BBL – Very Good, 4, BCH – not available, no progress, BCP - Excellent, 5, BEM – not available, no progress, BDMS – Very Good, 3B, BEAUTY – Good, 2, BEC - Good, 3B, BH - Good, 2, BIGC - Excellent, 3A, BJC – Good, 1, BLA – Very Good, 4, 1, BTS - Excellent, 3A, CBG – Good, 1, CCET – not available, 1, CENTEL – Very Good, 3A, CHG – Good, 3B, CK – Excellent, 3B, COL – Very Good, 3A, CPALL – Good, 3A, CPF – Very Good, 3A, CPN - Excellent, 5, DELTA - Very Good, 3A, DEMCO – Very Good, 3A, DTAC – Excellent, 3A, EA – not available, 3A, ECL – Good, 4, EGCO - Excellent, 4, EPG – not available, 3B, GFPT - Very Good, 3A, GLOBAL – Very Good, 2, GLOW - Good, 3A, GPSC – not available, 3B, GRAMMY - Excellent, 3B, GUNKUL – Very Good, 1, HANA - Excellent, 4, HMPRO - Excellent, 3A, ICHI – Very Good, 3A, INTUCH - Excellent, 4, ITD – Good, 1, IVL - Excellent, 4, JAS – not available, 3A, JASIF – not available, no progress, JUBILE – Good, 3A, KAMART – not available, no progress, KBANK - Excellent, 4, KCE - Excellent, 4, KGI – Good, 4, KKP – Excellent, 4, KSL – Very Good, 2, KTB - Excellent, 4, KTC – Very Good, 3A, LH - Very Good, 3B, LPN – Excellent, 3A, M - Good, 2, MAJOR - Good, 1, MAKRO – Good, 3A, MALEE – not available, 2, MBKET – Good, 2, MC – Very Good, 3A, MCOT – Excellent, 3A, MEGA – Very Good, 2, MINT - Excellent, 3A, MTLS – Good, 2, NYT – Good, no progress, OISHI – Very Good, 3B, PLANB – Good, 3B, PS – Excellent, 3A, PSL - Excellent, 4, PTT - Excellent, 5, PTTEP - Excellent, 4, PTTGC - Excellent, 5, QH – Very Good, 2, RATCH – Excellent, 3A, ROBINS – Excellent, 3A, RS – Very Good, 1, SAMART - Excellent, 3B, SAPPE - Good, 3B, SAT – Excellent, 5, SAWAD – Good, 1, SC – Excellent, 3B, SCB - Excellent, 4, SCBLIF – not available, no progress, SCC – Excellent, 5, SCN – Good, 1, SCCC - Good, 3A, SIM - Excellent, 3B, SIRI - Good, 1, SPALI - Excellent, 3A, SPRC – not available, no progress, STA – Very Good, 1, STEC – Very Good, 3B, SVI – Very Good, 3A, TASCO – Very Good, 3A, TCAP – Very Good, 4, THAI – Very Good, 3A, THANI – Very Good, 5, THCOM – Excellent, 4, THRE – Very Good, 3A, THREL – Very Good, 3A, TICON – Very Good, 3A, TISCO - Excellent, 4, TK – Very Good, 3B, TKN – not available, no progress, TMB - Excellent, 4, TPCH – Good, 3B, TOP - Excellent, 5, TRUE – Very Good, 2, TTW – Very Good, 2, TU – Very Good, 3A, UNIQ – not available, 2, VGI – Excellent, 3A, WHA – Good, 3A, WORK – not available, no progress.
Comprises level 1 to 5 as follows: Level 1: Committed Level 2: Declared Level 3: Established (3A: Established by Declaration of Intent, 3B: Established by Internal Commitment and Policy) Level 4: Certified Level 5: Extended.
CIMB Recommendation Framework Stock Ratings Definition: Add The stock’s total return is expected to exceed 10% over the next 12 months. Hold The stock’s total return is expected to be between 0% and positive 10% over the next 12 months. Reduce The stock’s total return is expected to fall below 0% or more over the next 12 months. The total expected return of a stock is defined as the sum of the: (i) percentage difference between the target price and the current price and (ii) the forward net dividend yields of the stock. Stock price targets have an investment horizon of 12 months.
Sector Ratings Definition: Overweight An Overweight rating means stocks in the sector have, on a market cap-weighted basis, a positive absolute
recommendation. Neutral A Neutral rating means stocks in the sector have, on a market cap-weighted basis, a neutral absolute
recommendation. Underweight An Underweight rating means stocks in the sector have, on a market cap-weighted basis, a negative absolute
recommendation.
Country Ratings Definition: Overweight An Overweight rating means investors should be positioned with an above-market weight in this country relative to
benchmark. Neutral A Neutral rating means investors should be positioned with a neutral weight in this country relative to benchmark. Underweight An Underweight rating means investors should be positioned with a below-market weight in this country relative to
benchmark.
12
31