equity trading practices and market structure: assessing...
TRANSCRIPT

Financial Markets, Institutions & Instruments, vol.4, no. 4, (November 1995)
Equity Trading Practices and Market Structure:Assessing Asset Managers’ Demand for Immediacy
by
Nicholas Economides*Professor of EconomicsStern School of Business
New York University
and
Robert A. Schwartz**Professor of Finance and Economics
and Yamaichi Faculty FellowStern School of Business
New York University
* Tel. (212) 998-0864, Fax (212) 995-4218, e-mail: [email protected],http://edgar.stern.nyu.edu/networks/electron.html
** Tel. (212) 998-0344, Fax (212) 995-4233, e-mail: [email protected]
We thank Paul Davies, Eric Fisher, and Jim Mueller for helpful comments. Financial supportfrom the New York University Salomon Center and TraderForum is gratefully acknowledged.An early draft of this paper, "Making the Trade: Equity Trading Practices and Market Structure -1994," was distributed by Institutional Investor for its TraderForum Research Service.

Abstract
This paper summarizes the responses to a questionnaire sent to equity traders through
TraderForum of the Institutional Investor. The respondents manage in total a very significant
percentage of equity assets under management in the United States. The focus of the questions
was the extent of the demand for immediate execution of orders. We found that the majority of
traders are willing to trade patiently if this reduces execution costs. Many traders indicate that
they frequently delay trades to obtain better prices. Most respondents indicate that they are
typically given more than a day to implement a large order, that they typically break up more
than 20% of their large orders for execution over time, and that they regularly take more than
a day for a large order that has been broken into lots to be executed completely. There is a
generally positive view of alternative electronic trading systems, such as Instinet and Investment
Technology Group’s POSIT. The key motives for trading on these systems are reduced market
impact, lower spreads, better liquidity, and anonymity. The respondents indicate that the key
changes that would make alternative electronic systems more attractive are an increase in
execution rates and more convenient times of trading. The responses to the survey also show that
alternative electronic systems would be used more if the traders did not have soft dollar
arrangements.
i

Equity Trading Practices and Market Structure:Assessing Asset Managers’ Demand for Immediacy
1. Introduction
Practitioners and students of the securities markets widely assume that traders demand
immediate execution of their orders. Indeed, a major function of traditional broker/dealer firms
is to provide the services that result in trades being made quickly. In volatile markets, an
advantage of trading quickly is that opportunity costs (i.e., the risk of an asset’s price "getting
away" before a portfolio decision is implemented) are reduced. However, higher direct costs
(i.e., market impact, bid-ask spreads, commissions, and other transaction costs) are generally
incurred when fast executions are obtained. Little information exists about the relative
importance professional asset managers attach to these two types of costs, and about the tradeoffs
they are willing to make between them. The current survey is motivated by this lack of
information.
The results show that experienced participants often do not trade with maximum possible
speed so as to "nail down" a price, and that they do commonly work their orders patiently over
time. However, the very dynamics of the continuous market appear to induce a demand to trade
quickly. Based on the survey responses, we conclude that traders would be even more willing
to forgo immediacy of execution if, by so doing, their direct costs of transacting could be further
reduced.
Consequently, the survey findings have a major implication for market structure. Asset
managers should be given the opportunity to delay their orders until predetermined points in time
at which they may trade with each other at reduced trading cost. The incorporation of an
electronic call market would provide the requisite environment. A call market is an environment
that enables buyers and sellers to meet at pre-determined points in time. We have elsewhere
considered the desirability of holding an electronic call three times a day, along with continuous
trading.1 The call environment would provide a useful pricing device for the broad market,
while resulting in lower transaction costs (bid-ask spread and market impact) for individual
participants.
In recent years, increasing numbers of institutional investors are breaking out of traditional
molds to explore various proprietary trading systems (PTS). With the exception of Instinet’s
continuous market, the PTSs are crossing networks (e.g. Instinet’s after hours cross and
Investment Technology Group Inc.’s POSIT system) and call markets that are capable of
independent price discovery (e.g. the Arizona Stock Exchange’s AZX system). Nevertheless,
immediacy continues to be a major service provided by market centers such as the New York
Stock Exchange (NYSE) and Nasdaq. These market centers operate on the assumption that
participants want instant access to the market, and that they are willing to pay the price for
trading with immediacy.
However, little empirical evidence exists on asset managers’ demand for immediacy. To
assess this demand, 825 questionnaires were mailed to traders of managed equity funds, and 150
responses were received. These respondents represent approximately $1.5 trillion in equity assets
under management. In broad sweep, the responses to the survey suggest that buy-side
participants do trade patiently in an attempt to control execution costs. The key results include:
• Two-thirds of the respondents indicated that they are willing to trade patiently to reduceexecution costs (Table 2).
1 See Economides and Schwartz (1995).
2
• Nearly half say they frequently do delay trades in an effort to obtain better prices (Table 3).
• One-third would regularly or frequently accept a trading delay of one hour for a $50 stock ifthey could save 25¢ per share in trading costs (Table 4).
• Nearly a quarter would regularly or frequently accept a trading delay of three hours for a $50stock if they could save 25¢ per share in trading costs (Table 5).
• About one in five would regularly or frequently accept a trading delay of one hour for a $50stock if they could gain anonymity on a trade of 10,000 shares or more (Table 6).
• Nearly two-thirds regularly or frequently use limit orders (Table 8).
• One-third report that 20% or more of their orders for a stock are larger than the stock’s averagedaily trading volume (Table 15).
• More than two-thirds typically give more than one day to implement a large order for a smallcap stock (Table 16).
• More than half typically give more than one day to implement a large order for a large capstock (Table 16).
• Approximately three out of five break up at least 20% of their orders for 100,000 shares ormore for execution over a series of trades (Table 17).
• Close to half report that they regularly or frequently take more than one day to completelyexecute a large order broken into lots (Table 18).
The picture that emerges is that immediacy is not commonly demanded by buy-side
participants, and that executions for large orders are generally not realized within brief periods
of time (a few hours or less). Respondents appear to be less concerned about trading quickly than
about controlling execution costs, the loss of anonymity, and the information leakage that occurs
when an intermediary is contacted. Understanding this is essential for making proper decisions
with regard to the structure and regulation of our security markets.
We do not claim that immediacy is never demanded. For specific institutions and specific
situations, the advantages of rapid trading may indeed outweigh the costs involved. Our
objective, however, is not to assess the intensity with which most asset managers, or even the
3

representative asset manager, demands immediacy. Rather, we wish to determine whether or not
a meaningful number do handle a substantial proportion of their orders patiently because
immediacy is costly.
The paper is organized as follows. Section 2 discusses the relationship between market
structure and the demand for immediacy. In this section we also present our reasons for
believing that immediacy is not universally demanded. Section 3 discusses the respondents
willingness to accept trading delays. In section 4, we present findings regarding trading practices,
order size, and transaction costs. In section 5, we discuss attitudes towards the use of alternative
electronic trading systems. Section 6 discusses the sample of respondents and their reasons for
trading. Section 7 discusses the differences between active and passive traders in their responses
to the questionnaire. Section 8 contains our concluding remarks. The Appendix presents the
distributed questionnaire.
2. Market Structure and the Demand for Immediacy: A Review of the
Issues
An understanding of participants demand for immediacy is key to designing the trading
structure of a securities market. In this section we review alternative market structures, consider
the relationship between market structure and the demand for immediacy, and briefly review the
literature. A major choice in trading design is between a continuous market and a call market.
A continuous market is open for an extended span of time; e.g., at the New York Stock Exchange
trading begins at 9:30 and continues until the 4 p.m. close. During this period, trades are made
any time two contra-side orders cross in price. The continuous market can be a dealer market
4

(quote-driven) or an agency/auction market (order-driven). Nasdaq in the U.S. and SEAQ in the
U.K. are dealer markets. Examples of the agency/auction market include the New York Stock
Exchange, the Paris Bourse, the Toronto Stock Exchange, and the Tokyo Stock Exchange.2
The continuous market has been widely studied by academic researchers. Much of the
microstructure literature has focused on the dealer market. Early analyses include Garman
(1976), Ho and Stoll (1980), Amihud and Mendelsohn (1980), and Mildenstein and Schleef
(1983).3 An analysis of the agency/auction market is provided in Cohen, Maier, Schwartz, and
Whitcomb (1986) and Schwartz (1991).4
In contrast with a continuous market, orders are batched in a call market for simultaneous,
multilateral execution at a single price, the value that maximizes the number of shares that trade
at the call. Examples of call markets include the opening procedure on most electronic
exchanges (e.g., Toronto’s CATS, Paris’s CAC, and Tokyo’s CORES), and on non-electronic
exchanges such as the NYSE. Pure electronic call markets include the Tel Aviv Stock Exchange,
the Bolsa Mexicana’s Intermediate Market, the Arizona Stock Exchange, and the Paris Borse (for
less liquid issues). Previously, non-electronic calls existed in Tel Aviv, Paris, and roughly 100
years ago at the NYSE. Call markets have received significantly less attention than continuous
markets in the academic literature. Studies of the call market include Cohen and Schwartz
(1989), Economides and Schwartz (1995), Schwartz (1996), and Amihud and Mendelson (1985).
2 Continuous markets may also include a dealer, such as the specialist on the New YorkStock Exchange.
3 For further discussion and references, see Schwartz (1991).
4 Further references are provided in both of these books.
5

In comparison with continuous trading, the call market has distinct advantages as a trading
environment. These include enhanced price discovery, elimination of the bid-ask spread, reduced
market impact of large orders, superior handling of limit orders and, in general, easier order
handling and better market surveillance.5 An often-noted disadvantage of call market trading
is that it does not provide immediate access to the market over an extended period of time.
However, this is not a problem if call market trading is integrated with continuous trading.6
Nevertheless, if multiple calls are held during a trading day, one might question whether or not
a sufficient number of participants will postpone their orders so that the intraday calls may be
viable. Traders will postpone orders or not depending on their demand for immediacy and on
the price of immediacy in a continuous market.
Clearly the sell side of the market has a vested interest in supplying immediacy. It is
difficult in a continuous market for ultimate buyers and sellers to find each other quickly without
the services of broker/dealers. However, when a meeting point in time is pre-specified (i.e., the
time of a call), buyers and sellers can more easily find each other without the services of
intermediaries. The key question is, "are buy-side traders willing to wait?"
We anticipate that an appreciable number of them will answer "yes". Certainly, the pace
with which trading progresses in a continuous market is not in harmony with the pace with which
the underlying investment decisions are commonly made.7 Institutional decision making with
respect to fundamental information takes time. Investment decisions commonly involve
5 For further discussion, see Economides and Schwartz (1995).
6 For further discussion of the integration of call and continuous trading see Handa andSchwartz (1996), Economides and Heisler (1995).
7 The pace of trading in a continuous market has accelerated with the application ofinformation technology.
6
information gathering and analysis, and the entire process can take place over a period of several
days. But once a decision has been made, an order is typically brought to a continuous trading
environment that accentuates the importance of minutes and even seconds. Time is suddenly of
the essence. Is it likely that the value of a decision made over a period of a day or more can
decay within the span of an hour or less? Or, is the demand for immediacy generated
endogenously by the dynamics of the continuous market? Certainly part of the demand for
immediacy comes from the price dynamics of the continuous market. Rapid trading may be
motivated by knowledge of the order flow and by charting signals.
Regarding the fundamental determinants of share value, we distinguish two types of
information release: natural (e.g. an earthquake or fire) and managed (e.g. an unemployment or
earnings report). The introduction of a call market would enable the pace at which managed
information is released and portfolio decisions are made to be better harmonized with the pace
at which trading is pursued. That is, both news releases and institutional investor portfolio
decisions could be timed with reference to the schedule of the calls.
The conventional wisdom is that immediacy is provided by a continuous market. On the
contrary, the continuous market may actually make it more difficult for institutional investors to
execute large orders at reasonable cost by the end of a trading day. Data collected by the Plexus
Group indicate that roughly 67% of the orders given to buy-side trading desks are for more than
half of the stocks’ average daily trading volumes, and 40% of the orders are for more than the
total average daily trading volume for the stocks.8 Orders of this size cannot be traded quickly
8 See Wagner and Edwards, (1993).
7

in the continuous market at acceptable levels of cost. The reality is that immediacy is not always
obtained in a continuous market.
It is also conventionally believed that intermediaries provide buy-side participants with
anonymity vis-a-vis each other. And they do. However, buy-side participants are increasingly
concerned about the loss of anonymity tosell-sidebroker/dealers. It is also becoming apparent
that anonymity can be provided by an electronic trading system, and it certainly is characteristic
of call market trading. We expect that buy-side participants will be willing to forsake immediacy
for disintermediation and anonymity.
All things considered, picture an institutional investor who makes a portfolio decision at
2 p.m. when a market call is scheduled for the 4 p.m. close. The investor could avoid paying
the price of intermediation and immediacy by waiting two hours and trading at lower cost at the
4 p.m. close. By waiting, he or she has effectively unbundled the act of "trading" from the
"immediacy" of the trade. If enough participants do this, they will naturally meet without the
assistance of intermediaries, and the intra-day calls will be viable.
3. Respondents’ Willingness to Accept a Trading Delay
The archetypal role of a dealer is to provide the liquidity that enables investors to trade
with immediacy. "Immediacy," however, is a vague concept. For retail-sized orders, it could
mean the ability to trade within a few minutes. Large institutional orders, however, would incur
unacceptably large execution costs (bid-ask spread plus market impact) if executed so quickly.
An asset manager seeking to buy 100,000 shares of a stock that on average trades 200,000 shares
a day, might consider an execution obtained within an hour or even a day to be immediate. This
8

section of the paper contains our findings with regard to various issues concerning the patience
with which a respondent is willing to seek a trade.
The first issue we address concerns the meaning of immediacy itself: how quickly must
a trade be made to be considered immediate? Respondents were also asked what they would be
willing to pay for immediacy, and how frequently they do in fact delay a trade in an attempt to
obtain a better price. Respondents were also asked about their willingness to accept a trading
delay to reduce their trading costs or to gain anonymity. The extent to which index options
and/or futures are used so that shares may be traded more patiently in the cash market, and the
frequency with which limit orders are used also are reported here.
Time In Which You Consider A Trade To Be Immediate
With regard to the meaning of immediacy, we asked respondents if they would consider
a trade to be immediate if it executed within a stated period of time (Table 1). The majority
(71%) answered that a trade must be realized in under 10 minutes to be considered immediate.
Only 3% answered "within 2 hours," and 6% said "within one day."
TABLE 1Time In Which You Consider A Trade To Be Immediate
9

Number of Respondents Percentage of Respondents
Under 10 Minutes 107 71.3
1 Hour 22 14.7
2 Hours 4 2.7
1 Day 9 6.0
Other 7 4.7
No Answer 1 0.7
Willingness To Trade Patiently To Reduce Execution Costs
Having established a sense of what the respondents consider "immediacy" to be, the
questionnaire asked about the respondents’ willingness to trade patiently if their execution costs
could be reduced by doing so (Table 2). A total of 67% indicated that they would be willing or
very willing to delay a trade if it reduced their costs. Only 8% said they would not be willing.
TABLE 2Willingness To Trade Patiently To Reduce Execution Costs
Number of Respondents Percentage of Respondents
5 (Very Willing) 51 34.0
4 50 33.3
3 34 22.7
2 6 4.0
1 (Not at All Willing) 6 4.0
No Answer 3 2.0
The Frequency With Which A Trade Is Delayed To Obtain A PriceMore Favorable Than The Current Market Price
10

Willingness is one thing; the perception of how frequently a trade is delayed is another.
Therefore, the questionnaire asked how frequently traders in fact delay a trade in an attempt to
obtain a price that is more favorable than the price currently prevailing on the market (Table 3).
The vast majority (77%) of respondents said they delay trades in hopes of finding a better price
for 25-75% of their trades. Only 11% said they "never" or "rarely" delay a trade for a better
price. The preponderance of the respondents perceive it desirable to trade patiently.
TABLE 3The Frequency With Which A Trade Is Delayed To ObtainA Price More Favorable Than The Current Market Price
Number of Respondents Percentage of Respondents
Never 3 2.0
Rarely (1-24% Trades) 14 9.3
Sometimes (25-49% of Trades) 62 41.3
Regularly (50-74% of Trades) 53 35.3
Frequently (75-100% of Trades) 16 10.7
Don’t Know/Not Sure 1 0.7
No Answer 1 0.7
Willingness To Accept A Trading Delay Of One Hour For A $50 StockIf You Could Save 25¢ Per Share In Trading Costs
Evidence on the demand for immediacy was also obtained by asking respondents whether
they would be willing to accept a trading delay of one hour if, by so doing, they could decrease
trading costs by 25¢ a share for a $50 stock (Table 4). One in four respondents said they would
"rarely" or "never" delay a trade for an hour to reduce costs. On the other hand, more than half
said they would be willing to delay a trade to reduce costs on some or all of their trades.
11

TABLE 4Willingness To Accept A Trading Delay Of One Hour For A $50 StockIf You Could Save 25¢ Per Share In Trading Costs
Number of Respondents Percentage of Respondents
Never 24 16.0
Rarely (1-24% Trades) 13 8.7
Sometimes (25-49% of Trades) 29 19.3
Regularly (50-74% of Trades) 22 14.7
Frequently (75-100% of Trades) 27 18.0
Don’t Know/Not Sure 19 12.7
No Answer 16 10.7
Willingness To Accept A Trading Delay Of 3 Hours For A $50 StockIf You Could Save 25¢ Per Share In Trading Costs
Traders were then asked if they would accept a delay of three hours for the same cost
savings. One in three respondents said they would rarely, if ever, delay a trade three hours. On
the other hand, an appreciable subset (23%) said they would accept a three-hour delay regularly
or frequently to save 25 cents per share for a $50 stock.
TABLE 5Willingness To Accept A Trading Delay Of 3 Hours For A $50 StockIf You Could Save 25¢ Per Share In Trading Costs
Number of Respondents Percentage of Respondents
12

Never 35 23.3
Rarely (1-24% Trades) 27 18.0
Sometimes (25-49% of Trades) 17 11.3
Regularly (50-74% of Trades) 16 10.7
Frequently (75-100% of Trades) 18 12.0
Don’t Know/Not Sure 18 12.0
No Answer 19 12.7
Willingness To Accept A One Hour Trading DelayTo Gain Anonymity On A Trade Of 10,000 Shares Or More
Respondents were also asked if they would delay a trade of 10,000 shares or more for one
hour if, by so doing, they could gain anonymity (Table 6). Slightly less than half of the
respondents said they would "rarely" or "never" delay a trade for an hour to gain anonymity. But
19% said they would do so "regularly" or "frequently." This indicates that an appreciable subset
of participants commonly do not seek to trade immediately to preserve anonymity.
TABLE 6Willingness To Accept A One Hour Trading DelayTo Gain Anonymity On A Trade Of 10,000 Shares Or More
Number Percentage of Respondents
13

Never 40 26.7
Rarely (1-24% Trades) 34 22.7
Sometimes (25-49% of Trades) 20 13.3
Regularly (50-74% of Trades) 13 8.7
Frequently (75-100% of Trades) 15 10.0
Don’t Know/Not Sure 19 12.7
No Answer 9 6.0
How Frequently You Wait More Than One Day Before Acquiring Or Selling Shares InThe Cash Market If You Have Used Index Options And/Or Futures To Trade Quickly
One way to delay trading in the cash market is to trade a derivative contract to establish
a position that is then converted into shares over time. Table 7 shows the responses from those
that indicated that they use index options and/or futures to reduce their need to execute trades
quickly in the cash market. These respondents were asked the frequency with which they would
wait more than a day before acquiring or selling the desired shares in the cash market. A total
of 46% said they rarely or never wait. On the other hand, a significant number (27%) said they
"frequently" waited.
TABLE 7How Frequently You Wait More Than One Day Before Acquiring Or Selling Shares In TheCash Market If You Have Used Index Options And/Or Futures To Trade Quickly
Number of Respondents Percentage of Respondents
14

Never 12 36.4
Rarely (1-24% Trades) 3 9.1
Sometimes (25-49% of Trades) 4 12.1
Regularly (50-74% of Trades) 2 6.1
Frequently (75-100% of Trades) 9 27.3
No Answer 3 9.1
How Often Do You Use Limit Orders, Market Orders, And More
In Table 8, we report on the frequency of the use of limit orders, market orders,
percentage orders, and basket orders. As expected, market, limit, and not held orders are all
widely used, and in roughly similar amounts. Basket orders and index options/futures are not
used very much.
Perhaps the most interesting finding is the extent to which limit orders are used: 52% of
the respondents said they used them on at least half of their trades. The use of limit orders is
essential to an order driven market. The dynamics of price behavior apparently compensates
traders sufficiently for placing limit orders. Traders are explicitly not demanding or paying for
immediacy when they use limit orders in seeking to trade.
15

TABLE 8How Often Do You Use The Following:
Never 1-24% ofTrades
25-49% ofTrades
50-74% ofTrades
75-100%of Trades
Don’tKnow
NA9
LimitOrders
1.3 14.7 30.0 29.3 22.7 0 2.0
MarketOrders 6.0 24.0 22.7 26.7 17.3 0 3.3
Not HeldOrders 4.0 14.0 29.3 22.0 26.7 0 4.0
PercentageOrders 46.0 32.7 14.7 2.7 0 0.7 3.3
Baskets 69.3 22.0 3.3 0 2.0 0 3.3
IndexOptions/Futures
70.7 12.7 8.0 2.7 2.7 0 3.3
4. Trading Practices, Order Size, and Transaction Costs
Trading practices, order size, and costs shed further light on the willingness of the
respondents to trade patiently. The first question raised is the importance of the major costs of
these three categories: the opportunity cost of missing a price, market impact, and commissions.
Reasons to execute a trade quickly include the volatility of prices, the possible mispricing of
stocks, and the prevention of front running. The costs associated with limit orders (e.g., the risk
of non-execution and the difficulty of withdrawing limit orders quickly) also impact the decision
to trade quickly. Respondents were further questioned as to their concern about information
9 The indication NA stands for "No Answer".
16

leakage when a broker is called, and about the frequency with which they demand capital from
a broker for a block order. Attitudes toward costs are also reflected in the respondents’ answer
to one other question, "How frequently do you decide not to adjust your portfolio because the
market is too illiquid?"
Concerning the size of their orders, respondents were asked about the frequency with
which an order for a stock is larger than the stock’s average daily trading volume, the time
commonly given by portfolio managers to implement large orders, and the frequency with which
large orders are broken up for execution over time. They were further questioned about the
frequency with which it takes more than one day for a large order broken into lots to execute
completely. Lastly, the questionnaire asked about the times of the day when the traders most
prefer and least prefer to place their orders.
How Important Are The Following Costs?
Regarding the costs of trading, our findings on the importance of three major components
(the opportunity costs of missing a price, market impact, and commissions) are summarized in
Table 9. The opportunity costs of missing a price are rated the most important cost by 55% of
traders, followed by market impact, which is rated the most important cost by 41% of traders.
Commissions are important to only 3% of the respondents.
17

TABLE 9How Important Are The Following Costs?
Percentage of Respondents Indicating Particular Cost as
Most Important Neutral Least Important No Answer
Opportunity Costs ofMissing A Price 54.7 36.0 6.0 3.3
Market Impact 40.7 51.3 6.7 1.3
Commissions 3.3 9.3 84.7 2.7
What Are The Most Important And Second Most Important FactorsThat May Cause You To Want To Execute A Trade Quickly?
Table 10 summarizes the most important and second most important factors that may
cause traders to want to execute a trade quickly. The most important factor is "because prices
are volatile and the risk of waiting is too great" - 48% of respondents said this was the most
important factor, and 32% said it was the second most important factor. Fewer indicated that the
prevention of front-running was a factor: 11% indicated it was the most important factor, and
another 26% indicated it was the second most important factor. Interestingly, only 23% said that
the most important factor was that other traders will realize that the stock is overpriced or
underpriced, and 21% indicated this was the second most important factor. To the extent that
trading is motivated by news and not just the assessment of existing information, this number
would be expected to be higher.
18

TABLE 10What Are The Most Important And Second Most Important FactorsThat May Cause You To Want To Execute A Trade Quickly?10
Most Important Factor Second Most Important Factor
Because Prices Are Volatileand the Risk of Waiting is Too
Great
72
48.0%
48
32.0%
Because you Think OtherTraders Will Realize the Stockis Overpriced or Underpriced
35
23.3%
32
21.3%
Opportunity Costs34
22.7%
47
31.3%
To Prevent Other TradersFrom Front-Running Your
Order
17
11.3%
39
26.0%
Other15
10.0%
5
3.3%
No Answer1
0.7%
8
5.3%
What Do You Consider The Most Important And The Second Most ImportantDrawbacks Of Using Limit Orders?
When asked what they consider the most important drawback of using limit orders (Table
11), most of the respondents (70%) stated that the most important factor is the risk of non-
execution. An additional 22% checked a closely related factor: limit orders may cause you to
miss a favorable market movement. Only 4% indicated that the drawback is that the limit orders
10 Note that columns in this table add to more than 100% because some respondents havechecked more than one category.
19

may be difficult to withdraw quickly. This is not surprising, given that the professional buy-side
traders keep current about market events, and that order handling procedures are rapid. The
response here is consistent with the previously discussed finding that price volatility is the most
important motivation for trading quickly (see Table 10).
TABLE 11What Do You Consider The Most Important And The Second Most Important DrawbacksOf Using Limit Orders? 11
Most Important Factor(Percentages)
Second Most Important Factor(Percentages)
Risk of Non-execution 69.7 16.7
May Cause you to Miss aFavorable Market
Movement22.0 38.6
May Create CompetitiveDisadvantages 15.9 19.7
Gives Free Optionsto the Dealer 10.6 15.9
May be Difficult toWithdraw Quickly 3.8 11.4
Non-immediate Execution 2.3 18.9
Cost/opportunity Cost 0.8 0.8
Concern About Information Leakage When A Broker Is Called
A willingness to delay a trade on the part of roughly a third of the respondents in order
to achieve anonymity is evidenced by the responses reported in Table 6. Anonymity may be
valued by buy-side participants because of the adverse price impact that can occur when news
gets out that they are seeking to trade. To assess this, respondents were asked how concerned
11 Note that columns add to more than 100% because some respondents have checked morethan one category.
20

they are about information leakage after they have called a broker to make a trade. The results
are reported in Table 12. A total of 45% indicated they were concerned about information
leakage.
TABLE 12Concern About Information Leakage When A Broker Is Called
Number of Respondents Percentage of Respondents
5 (Very Concerned) 46 30.7
4 22 14.7
3 (Neutral) 47 31.3
2 15 10.0
1 (Not Concerned) 18 12.0
No Answer 2 1.3
Frequency With Which Capital Is Demanded FromA Broker For Transactions of 10,000 Shares Or More
Two primary functions of intermediaries are (i) to help a customer find the counterpart
to a trade (i.e., act as a broker), and (ii) to provide capital as the counterpart in a trade (i.e., act
as a dealer). For a customer who is concerned about information leakage, a strong motive must
exist for contacting the intermediary in the first place. Accordingly, the survey asked about the
frequency with which the respondents demand capital from their brokers for transactions of
10,000 shares or more. The results are reported in Table 13. Approximately three out of four
respondents said they rarely, if ever, demand capital from their brokers. Only 7% said they
regularly or frequently demand broker capital. Presumably this means that the role of
intermediaries in finding the other side of a trade is more important than their role in providing
capital.
21

TABLE 13Frequency With Which Capital Is Demanded FromA Broker For Transactions of 10,000 Shares Or More
Number of Respondents Percentage of Respondents
Never 31 20.7
Rarely (1-24% Trades) 80 53.3
Sometimes (25-49% of Trades) 22 14.7
Regularly (50-74% of Trades) 5 3.3
Frequently (75-100% of Trades) 5 3.3
Don’t Know/Not Sure 4 2.7
No Answer 3 2.0
How Frequently Do You Decide Not To Adjust Your Portfolio Because The Market Is Too Illiquid?
A total of 16% of the traders do not adjust their portfolio 10-19% of the time because the market
is too illiquid (Table 14). Almost twice as many do not adjust their portfolio for the same reason 1-9%
of the time. In both cases, active traders are more likely not to adjust their portfolios than passive traders.
TABLE 14How Frequently Do You Decide Not To Adjust Your PortfolioBecause The Market Is Too Illiquid?
Never 1-9% 10-19% 20% ormore
Don’tKnow
No Answer
Active Traders27
22.7%40
33.6%
17
14.3%
5
4.2%
24
20.2%
6
5.0%
Passive Traders9
37.5%
6
25.0%
1
4.2%
1
4.2%
7
29.2%
0
0.0%
All Respondents37
24.7%
47
31.3%
24
16.0%
6
4.0%
34
22.7
8
5.3%
Frequency With Which Your Order For A Stock
22

Is Larger Than The Stock’s Average Daily Trading Volume
If the order is large relative to average daily trading volume, it may not be possible to
execute the order entirely in a very short period of time without incurring an unacceptably high
execution cost. As noted above, Wayne Wagner and Mark Edwards found that 66% of the orders
in Plexus Group’s data set exceed half of the stock’s average daily trading volume, and that 40%
of the orders exceed the stock’s total average daily trading volume.
The respondents were asked the frequency with which their orders for a stock are larger
than the stock’s average daily trading volume (Table 15). Almost a third of the respondents
answered that 20% or more of their orders are this large.
TABLE 15Frequency With Which Your Order For A StockIs Larger Than The Stock’s Average Daily Trading Volume
Number of Respondents Percentage of Respondents
Never 5 3.3
1-9% of Orders 51 34.0
10-19% of Orders 33 22.0
20% or More of Orders 49 32.7
Don’t Know/Not Sure 8 5.3
No Answer 4 2.7
Time Typically Given By Portfolio Manager To Trader To ImplementA Large Order (25% Of Average Daily Trading Value Or More)
In light of the size of institutional orders relative to average daily trading volume, the
questionnaire asked about the time a portfolio manager might typically give a trader to implement
an order (Table 16). For small cap stocks, less than 1% answered "one hour or less," and 69%
23

answered "one day" or longer. For large cap stocks, 5% answered "one hour or less," and 59%
answered "one day" or longer. This finding reinforces the impression that asset managers do not
attempt to implement their trading decisions within brief intervals of time.
TABLE 16Time Typically Given By Portfolio Manager To Trader To ImplementA Large Order (25% Of Average Daily Trading Value Or More)
Small Cap Stock Large Cap Stock
Number ofRespondents
Percentage ofRespondents
Number ofRespondents
Percentage ofRespondents
1 Hour or Less 1 0.7 7 4.7
More Than 1 Hr,Less Than 1 Day 5 3.0 22 14.7
1 Day 15 10.0 43 28.7
2-3 Days 40 26.7 29 19.3
More Than 3Days 49 32.7 16 10.7
No Time Limits 25 16.7 20 13.3
Other 5 3.3 5 3.3
No Answer 10 6.6 8 5.3
Frequency With Which Large Orders (100,000 Shares Or More) Are Broken
24
Into Smaller Lots For Separate Executions Over An Extended Period Of Time.
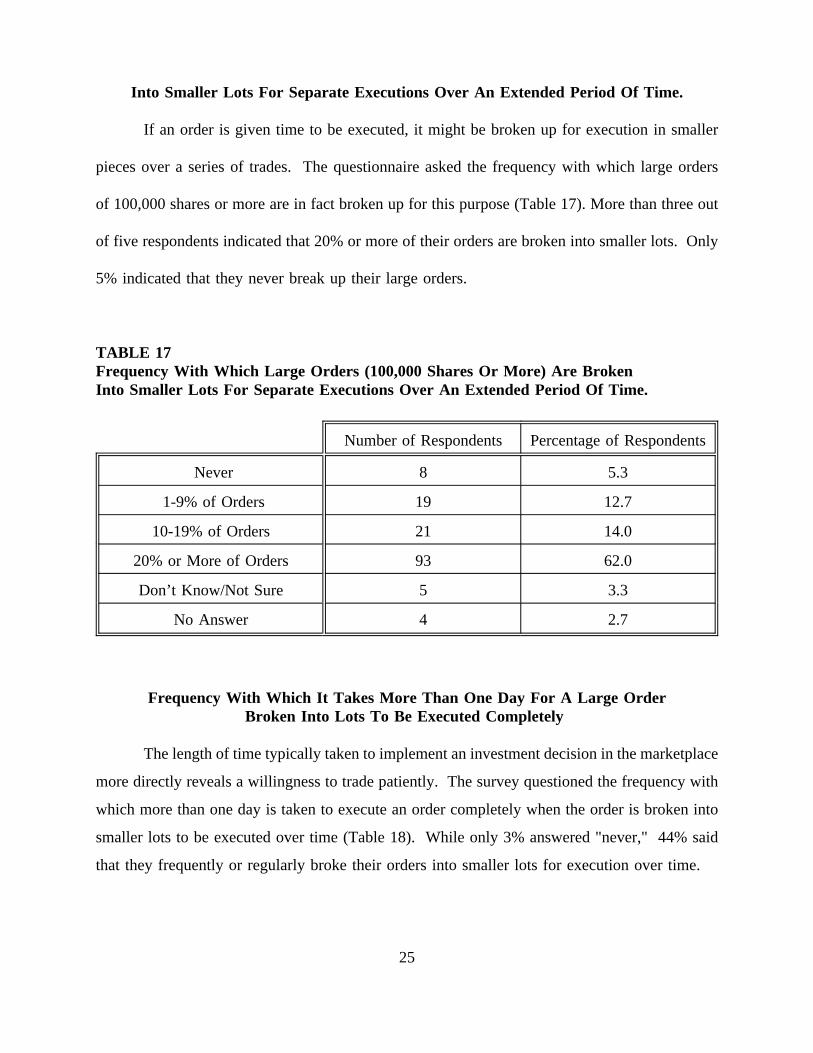
If an order is given time to be executed, it might be broken up for execution in smaller
pieces over a series of trades. The questionnaire asked the frequency with which large orders
of 100,000 shares or more are in fact broken up for this purpose (Table 17). More than three out
of five respondents indicated that 20% or more of their orders are broken into smaller lots. Only
5% indicated that they never break up their large orders.
TABLE 17Frequency With Which Large Orders (100,000 Shares Or More) Are BrokenInto Smaller Lots For Separate Executions Over An Extended Period Of Time.
Number of Respondents Percentage of Respondents
Never 8 5.3
1-9% of Orders 19 12.7
10-19% of Orders 21 14.0
20% or More of Orders 93 62.0
Don’t Know/Not Sure 5 3.3
No Answer 4 2.7
Frequency With Which It Takes More Than One Day For A Large OrderBroken Into Lots To Be Executed Completely
The length of time typically taken to implement an investment decision in the marketplace
more directly reveals a willingness to trade patiently. The survey questioned the frequency with
which more than one day is taken to execute an order completely when the order is broken into
smaller lots to be executed over time (Table 18). While only 3% answered "never," 44% said
that they frequently or regularly broke their orders into smaller lots for execution over time.
25

TABLE 18Frequency With Which It Takes More Than One Day For A Large OrderBroken Into Lots To Be Executed Completely
Number of Respondents Percentage of Respondents
Never 5 3.3
Rarely (1-24% Trades) 15 10.0
Sometimes (25-49% of Trades) 31 20.7
Regularly (50-74% of Trades) 29 19.3
Frequently (75-100% of Trades) 37 24.7
Don’t Know/Not Sure 17 11.3
No Answer 16 10.7
When Do You Prefer To Place Your Orders?
Turning to the question of when orders are placed, the respondents expressed clear
preferences for trading at different times during the day (Table 19). Traders preferred the half
hour just following market opening to the actual market opening: 44% said that 9:31-10:00
a.m.was their most preferred time to place an order, compared to 27% who most preferred the
actual market opening. Traders also preferred the half-hour period immediately prior to market
close as compared to the actual closing time: 23% said the 3:31-3:59 period was "most
preferred," compared to 8% who most preferred the actual closing time to place their orders. The
survey did not ask for the reasons behind these preferences. Presumably, the uncertainty
concerning price determination at the open lead many to prefer the 9:31-10:00 a.m. period; and
the uncertainty concerning price, and perhaps the ability to trade at all, caused many of them to
find the close least preferable, and the 3.31-3:59 period less preferable than the 9:31-10:00
period.
26

Recognizing that the periods are not of equal length, one might expect from the responses
that the pattern of trading over the day would be "U" shaped, as indeed it has been observed to
be by, for instance, McInish and Wood (1990).12 The questionnaire did not ask, however, the
frequency with which orders were delayed so that their arrival might be harmonized with the time
of the day the respondent felt to be most desirable.
TABLE 19When Do You Prefer To Place Your Orders?
Most Prefer Neutral Least Prefer No Answer
At Market Opening 27.3 24.0 44.0 4.7
9:31-10:00 44.0 37.3 12.0 6.7
10:01-12:00 50.7 38.7 5.3 5.3
12:01-3:30 37.3 48.7 8.0 6.0
3:31-3:59 22.7 38.0 32.0 7.3
At Market Close 8.0 14.0 71.3 6.7
5. The Use of Alternative Electronic Trading Systems
The emergence of alternative electronic markets in recent years has given buy-side traders new
opportunities to receive timely executions at reasonable cost. Respondents were asked about the frequency
with which they use these systems (e.g. NYSE after hours Sessions 1 and 2, Instinet’s crossing session
and continuous market, POSIT’s crossing sessions and AZX’s call market), and their motives for using
them (e.g. lower trading costs, the ability to trade anonymously). The respondents also were asked whether
or not they felt the benefits of electronic trade execution outweigh the disadvantages, how satisfied they
are with the alternative systems, and what would get them to use the alternative systems more (e.g., if they
12 See McInish and Wood (1990).
27

gave higher execution rates, if they allowed trading at more convenient times, and if the respondents’ did
not have soft dollar arrangements).
How Often Do You Use The Following Alternative Electronic Trading Systems?
Table 20 shows that use of the alternative systems is limited. Use of these systems is
similar for Listed and for NASD stocks, except for Instinet’s continuous market which is used
more for NASD stocks.
TABLE 20How Often Do You Use The Following Alternative Electronic Trading Systems?
Never 1-9% 10-19% 20-29% 30% ormore
Don’tKnow
NA13
Listed Stocks
NYSE Session 1 86.7 6.7 0.7 0.7 1.3 1.3 2.7
NYSE Session 2 90.0 4.7 0 0 0 2.0 3.3
Instinet Crossing 63.3 22.7 2.7 2.0 5.3 0.7 3.3
POSIT 60.0 22.7 4.7 3.3 5.3 1.3 2.7
AZX 78.7 13.3 0 1.3 2.0 0.7 4.0
Instinet Continuous 52.7 28.0 4.7 6.7 4.0 0.7 3.3
NASD Stocks
Instinet Crossing 62.7 16.7 6.7 4.7 5.3 0 4.0
POSIT 62.7 20.7 3.3 3.3 4.7 0.7 4.7
AZX 78.0 12.0 0 1.3 2.0 0.7 6.0
Instinet Continuous 49.7 14.7 11.3 6.0 14.7 0 4.0
13 The indication NA stands for "No Answer".
28

Motives For Trading On The Electronic Systems
Of particular interest are the respondents’ motives for trading on electronic systems
(Table 21). The considerations that were rated "important" are: reduced market impact (47%),
lower bid-ask spreads (47%), better liquidity (41%), lower general transaction cost (39%), the
ability to trade anonymously (38%), and the ability to have greater control of the negotiation
process (33%).
TABLE 21Motives For Trading On The Electronic Systems:
Number of Respondents WhoRated Motive Important
Percentage of RespondentsWho Rated Motive Important
Reduced Market Impact 71 47.3
Lower Spread Costs 71 47.3
Better Liquidity 61 40.7
Lower TransactionCosts
59 39.3
Trade Anonymously 57 38.0
Greater Control ofNegotiation Process 49 32.7
Time Savings 6 4.0
Other Motives 7 4.7
What Effect Does The Anonymity Offered By ElectronicTrading Systems Have On Your Execution Ability?
Nearly half of the traders expressed the opinion that the anonymity offered by the
alternative electronic trading systems improves their execution ability (Table 22). Less than 1%
think that it worsens it. On the other hand, 34.0% of the respondents said they did not know
what the effect would be or they did not answer the question.
29
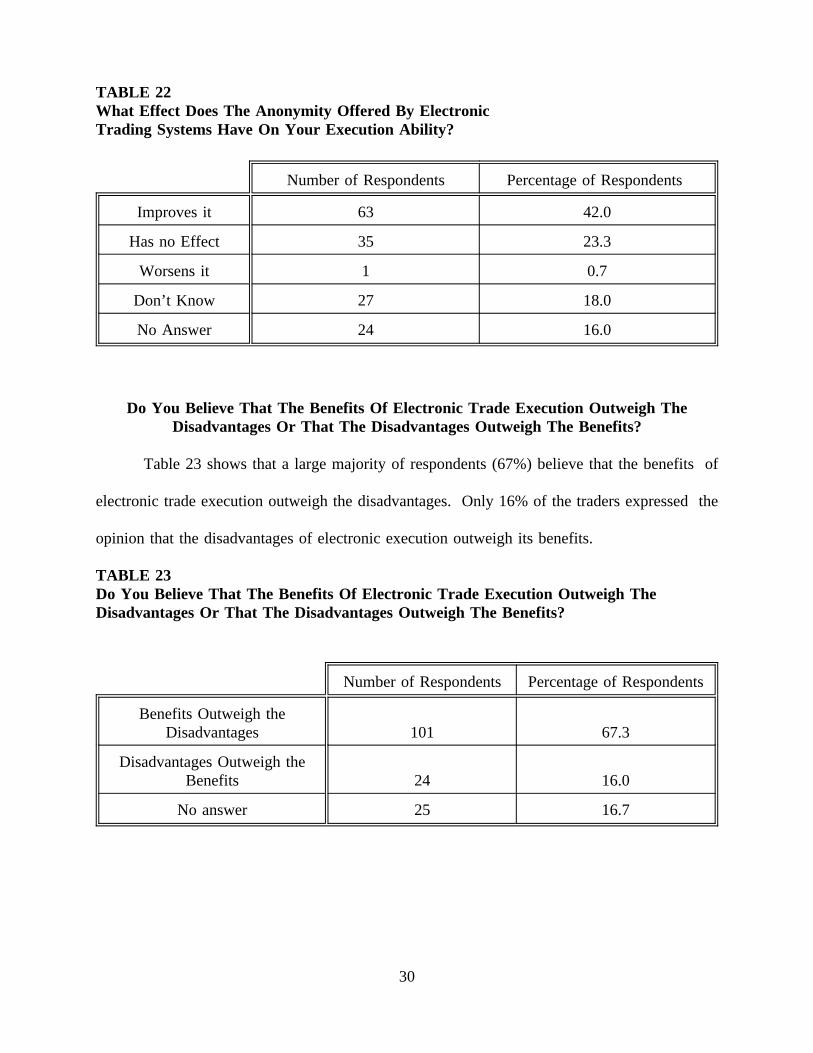
TABLE 22What Effect Does The Anonymity Offered By ElectronicTrading Systems Have On Your Execution Ability?
Number of Respondents Percentage of Respondents
Improves it 63 42.0
Has no Effect 35 23.3
Worsens it 1 0.7
Don’t Know 27 18.0
No Answer 24 16.0
Do You Believe That The Benefits Of Electronic Trade Execution Outweigh TheDisadvantages Or That The Disadvantages Outweigh The Benefits?
Table 23 shows that a large majority of respondents (67%) believe that the benefits of
electronic trade execution outweigh the disadvantages. Only 16% of the traders expressed the
opinion that the disadvantages of electronic execution outweigh its benefits.
TABLE 23Do You Believe That The Benefits Of Electronic Trade Execution Outweigh TheDisadvantages Or That The Disadvantages Outweigh The Benefits?
Number of Respondents Percentage of Respondents
Benefits Outweigh theDisadvantages 101 67.3
Disadvantages Outweigh theBenefits 24 16.0
No answer 25 16.7
30
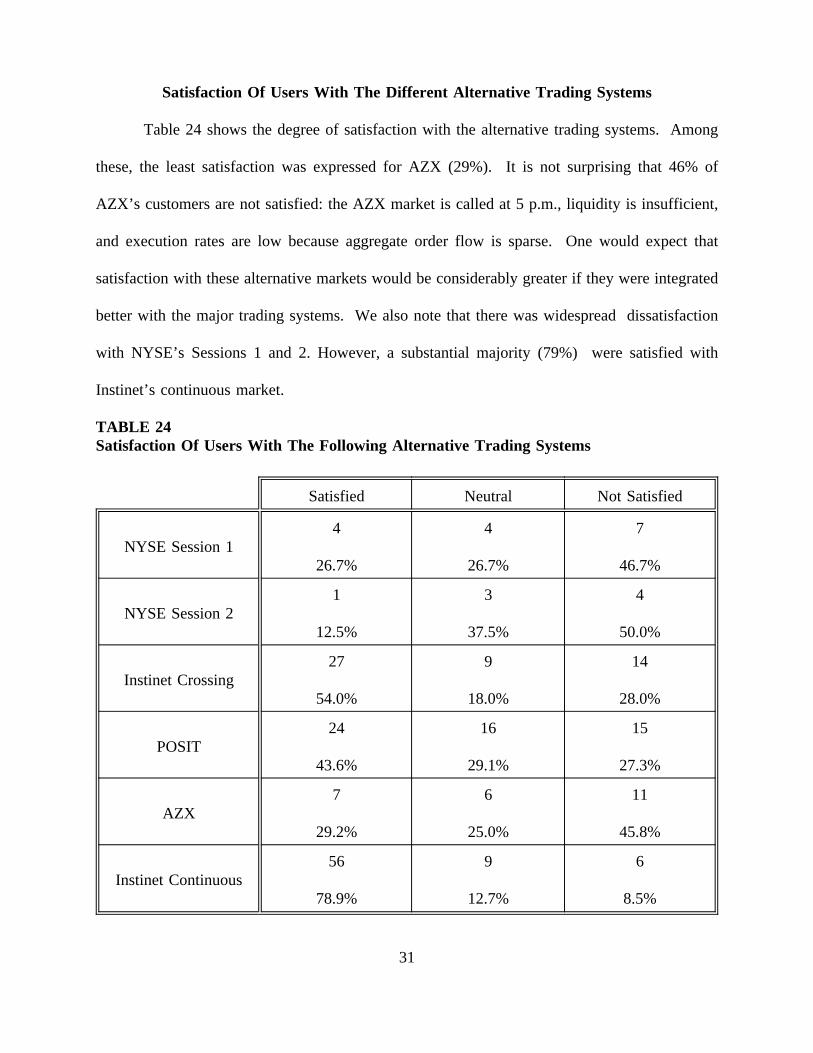
Satisfaction Of Users With The Different Alternative Trading Systems
Table 24 shows the degree of satisfaction with the alternative trading systems. Among
these, the least satisfaction was expressed for AZX (29%). It is not surprising that 46% of
AZX’s customers are not satisfied: the AZX market is called at 5 p.m., liquidity is insufficient,
and execution rates are low because aggregate order flow is sparse. One would expect that
satisfaction with these alternative markets would be considerably greater if they were integrated
better with the major trading systems. We also note that there was widespread dissatisfaction
with NYSE’s Sessions 1 and 2. However, a substantial majority (79%) were satisfied with
Instinet’s continuous market.
TABLE 24Satisfaction Of Users With The Following Alternative Trading Systems
Satisfied Neutral Not Satisfied
NYSE Session 14
26.7%
4
26.7%
7
46.7%
NYSE Session 21
12.5%
3
37.5%
4
50.0%
Instinet Crossing27
54.0%
9
18.0%
14
28.0%
POSIT24
43.6%
16
29.1%
15
27.3%
AZX7
29.2%
6
25.0%
11
45.8%
Instinet Continuous56
78.9%
9
12.7%
6
8.5%
31
What Would Get You To Use The Alternative Trading Systems More
If clear motives exist for trading on electronic systems, why aren’t the systems used more
heavily? ITG’s POSIT, Instinet’s crossing network, and the Arizona Stock Exchange’s AZX each
batch orders for multilateral execution at a single time at a single price; if institutional asset
managers are willing to forgo immediacy, why aren’t these systems particularly attractive to
them? The survey asked the question, "What would get you to use the alternative trading
systems more?" The results are in Table 25.
Not surprisingly, 55% said that they would use the alternative systems more if they gave
higher execution rates. This is consistent with the reality that a lack of order flow is a major
impediment to the success of any trading system (and with the adage, "order flow attracts order
flow"). Second on the list, 35% indicated that they would use the systems more if they did not
have soft dollar arrangements (that is, soft dollar arrangements appear to be an impediment to
change). A total of 31% claimed they would use the alternative markets more if they allowed
trading at more convenient times (presumably during the day rather than after hours), and 20%
responded that they would use them more if they knew more about them (which suggests some
continuing lethargy on the part of some institutional investors).
32

TABLE 25What Would Get You To Use The Alternative Trading Systems More14
Number ofRespondents
Percent ofRespondents
They Gave Higher Execution Rates 82 54.7
You Didn’t Have Soft Dollar Arrangements 53 35.3
They Allowed Trading at More Convenient Times 47 31.3
You Knew More About Them 30 20.0
Other 7 4.7
None of the Above 47 31.3
6. The Sample of Respondents and Their Reasons for Trading
A total of 825 questionnaires were mailed to 125 members of the TraderForum and to 700
non-members. A total of 150 responded. These include approximately 90 TraderForum
members and 60 non-members.15 Thus, the response was 72% of TraderForum members and
8.6% of non-members. In terms of our total respondents, 60% were TraderForum members and
40% were non-members.
The questionnaires were filled out by the equity trader at each institution. In some of the
smaller institutions the trader may also be an asset manager. Respondents were asked the total
14 Note that columns add to more than 100% because some respondents have checked morethan one category.
15 Members automatically receive the report while non-members must send in a card toreceive the report. We expect that virtually all non-members who took the time to fill out thequestionnaire would want to receive the report. Thus the number of non-members is inferredfrom the number of cards that were received.
33

value of their organization’s equity assets under management. A total of 135 out of the 150
answered. The estimated amount of equity under management was $1.54 trillion.16 This
represents approximately half the managed equity assets17 The distribution of the respondents,
according to the type of institution, is shown in Table 26.
TABLE 26Distribution of Respondents by Institution
Number ofRespondents
Percentage ofRespondents
Independent Investment Management Firm 69 46.0
Subsidiary of Bank or Brokerage Firm 53 35.3
Mutual Fund 14 9.3
Internally Managed Pension Fund 9 6.0
Other 5 3.3
Total 150 100
Table 27 shows the reasons for trading stated by the respondents in descending order.
The primary reasons are stock specific fundamental issues (79%), internally-generated research
(68%), reassessment of portfolio structure (47%), bargain-hunting (37%), and profit taking (36%).
TABLE 27
16 Out of the 150 respondents, 128 respondents reported a total of $1,316.42 billion of equityunder management and 22 gave no answer. Extrapolating to the total of 150, we estimate thetotal assets under management of the respondents of the questionnaire at $1.54 trillion.
17 Total equity assets in the US at the end of 1992 were $5.5 trillion (Flow of Funds CodedTables, Board of Governors of the Federal Reserve System, Washington, D.C.). It is estimatedthat 60% of these are managed, so that managed equity assets are $3.3 trillion. Thus, our surveycovers about 50% of all managed equity assets.
34

Why Do You Trade?
All Traders
Frequently Neutral Infrequently NA18
Stock Specific Fundamental Issues 79.3 10.0 9.3 1.4
Internally-generated Research(From Portfolio Manager) 68.7 17.3 12.0 2.0
Reassessment of Portfolio Structure 47.3 32.0 18.0 2.7
Bargain-hunting 37.3 26.7 36.0 0
Profit Taking 36.0 32.0 31.3 0.7
Market-wide News 32.0 32.7 33.3 2.0
Fund Redemptions or Other CashFlow Reasons 20.7 24.7 52.7 2.0
Trading Information (i.e., Knowledgeof an Order on the Floor) 18.0 30.0 51.3 0.7
Desire to Cut Losses 15.3 34.0 49.3 1.4
Chartist Signals 12.0 14.0 72.7 1.3
Need to Track a Market Index 11.3 10.0 76.7 2.0
Derivatives-motivated Trading 4.7 5.3 88.0 2.0
Other Factors 1.3 0.7 10.7 87.3
18 The indication NA in the top right hand corner stands for "No Answer".
35

7. Differences Between Active and Passive Traders
One of the interesting questions for which the responses to our questionnaire provide an
answer is whether significant differences exist in the trading behavior of active traders in
comparison with passive traders. In particular, we are interested to see if these two groups have
reported differences in what they consider an immediate trade, on the willingness to trade
patiently, on motives for trading in electronic systems, on the effects of anonymity, or in their
reasons for trading in general.
The answers of active and passive traders to many questions were similar. However, in
some questions their answers could easily be differentiated. We summarize below the responses
in which active and passive traders showed clear differences.19
Table 1b shows that the time horizon appears to be a bit shorter for active than for
passive traders, as one might expect. At the short end of the scale, 76% of the active traders
checked 10 minutes or less, vs. 50% of the passive traders. At the long end of the scale, 3% of
the active traders checked one day vs. 25% of the passive traders.
19 All tables in this section are numbered Nb where N is the number of the correspondingtable presented earlier that summarized responses to the same question by all participants.
36

TABLE 1bTime In Which You Consider A Trade To Be Immediate:Differences Between Active And Passive Traders
Active Traders Passive Traders
Number ofRespondents
Percentage ofActive Traders
Number ofRespondents
Percentage ofPassive Traders
Under 10Minutes 90 75.7 12 50.0
1 Hour 16 13.4 5 20.8
2 Hours 3 2.5 0 0
1 Day 3 2.5 6 25.0
Other 6 5.0 1 4.2
No Answer 1 0.8 0 0
Table 2b shows a tendency for passive traders to be more willing to trade patiently: 46%
of the passive traders said they would be "very willing," vs. 31% of active traders. No passive
traders indicated they would be not willing at all or not very willing vs. 10% of active traders.
This is consistent with expectations. Trading on news implies a need for immediacy on the part
of active traders, and seeking to minimize transaction costs implies patient trading on the part
of passive traders. But again, the difference between the two groups is not large.
37

TABLE 2bWillingness To Trade Patiently To Reduce Execution Costs:Differences Between Active And Passive Traders
Active Traders Passive Traders
Number ofRespondents
Percentage ofActive Traders
Number ofRespondents
Percentage ofPassive Traders
5 (VeryWilling) 37 31.1 11 45.8
4 41 34.5 7 29.2
3 27 22.7 6 25.0
2 6 5.0 0 0
1 (Not at AllWilling) 6 5.0 0 0
No Answer 2 1.7 0 0
Table 12b distinguishes between active and passive traders on the issue of concern about
information leakage. Despite the general similarity, a substantial percentage (33%) of passive traders are
not concerned at all about information leakage compared to 8% of active traders.
TABLE 12bConcern About Information Leakage When A Broker Is Called:Differences Between Active And Passive Traders
Active Traders Passive Traders
Number ofRespondents
Percentage ofActive Traders
Number ofRespondents
Percentage ofPassive Traders
5 (Very Concerned) 36 30.3 7 29.2
4 18 15.1 3 12.5
3 41 34.5 5 20.8
2 14 11.8 1 4.2
1 (Not Concerned) 9 7.6 8 33.3
No Answer 1 0.8 0 0
38

Table 13b shows that passive traders are much more likely never to demand capital from
a broker (33% vs. 17% for active traders). Further, none of the passive traders regularly or
frequently demand capital from a broker, while 8% of the active traders do.
TABLE 13bFrequency With Which Capital Is Demanded From A Broker For Transactions Of 10,000Shares Or More: Differences Between Active And Passive Traders
Active Traders Passive Traders
Number ofRespondents
Percentage ofActive Traders
Number ofRespondents
Percentage ofPassive Traders
Never 20 16.8 8 33.3
Rarely (1-24% ofTrades) 65 54.6 13 54.2
Sometimes (25-49%of Trades) 19 16.0 3 12.5
Regularly (50-74%of Trades) 5 4.2 0 0
Frequently (75-100% of Trades) 5 4.2 0 0
Don’t Know/Not Sure 4 3.4 0 0
No Answer 1 0.8 0 0
Table 21b shows the differences between active and passive traders in their motives for
trading on electronic systems. Among passive traders, lower transaction costs are the primary
motivation (75.0%); this motive was indicated by 42.9% of active traders. Active traders are
motivated by a variety of other reasons. Reduced market impact and lower spread costs are the
primary reasons for active traders, indicated by 52.9% and 52.1% respectively. Each of these
motives was indicated by only 25% of the passive traders as a primary motive. 45.4% of the
39

active traders indicated better liquidity as a primary motive, in contrast with 20.8% of the passive
traders. Similarly, anonymity was indicated by 42.9% of active traders as a motive, and only by
16.7% of passive traders. Finally, greater control of the negotiation process was indicated by
36.1% of the active and 20.8% of the passive traders.
TABLE 21bMotive For Trading On The Electronic Systems:Differences Between Active And Passive Traders
Active Traders Passive Traders
Number ofRespondents Who
Rated MotiveImportant
Percentageof ActiveTraders
Number ofRespondents Who
Rated MotiveImportant
Percentageof Passive
Traders
Reduced MarketImpact 63 52.9 6 25.0
Lower SpreadCosts 62 52.1 6 25.0
Better Liquidity 54 45.4 5 20.8
LowerTransaction
Costs51 42.9 6 75.0
TradeAnonymously 51 42.9 4 16.7
Greater Controlof Negotiation
Process43 36.1 5 20.8
Time Savings 6 5.0 0 0
Other Motives 5 4.2 1 4.2
Table 22b shows that more active than passive traders believe that the anonymity offered
by electronic trading systems improves their execution ability. This opinion is expressed by 46%
of the active traders and 25% of the passive traders.
40

TABLE 22bWhat Effect Does The Anonymity Offered By ElectronicTrading Systems Have On Your Execution Ability?
Active Traders Passive Traders
Number ofRespondents
Percentage ofActive Traders
Number ofRespondents
Percentage ofPassive Traders
Improves it 55 46.2 6 25.0
Has no Effect 28 23.5 5 20.8
Worsens it 1 0.8 0 0
Don’t Know 16 13.4 9 37.5
No Answer 19 16.0 4 16.7
Table 23b shows that a larger percentage of active than passive traders believe that the
benefits of electronic trade execution outweigh its disadvantages. This was expressed by 71%
of active traders, compared with 46% of passive traders.
TABLE 23bDo You Believe That The Benefits Of Electronic Trade Execution Outweigh TheDisadvantages Or That The Disadvantages Outweigh The Benefits?
Active Traders Passive Traders
Number ofRespondents
Percentage ofActive Traders
Number ofRespondents
Percentage ofPassive Traders
Benefits Outweighthe Disadvantages 84 70.6 11 45.8
DisadvantagesOutweigh the
Benefits19 16.0 5 20.8
No Answer 16 13.4 8 33.3
Table 25b shows significant differences between active and passive traders in the reasons
that would make them use the alternative trading systems more. Active traders (61%) would use
41
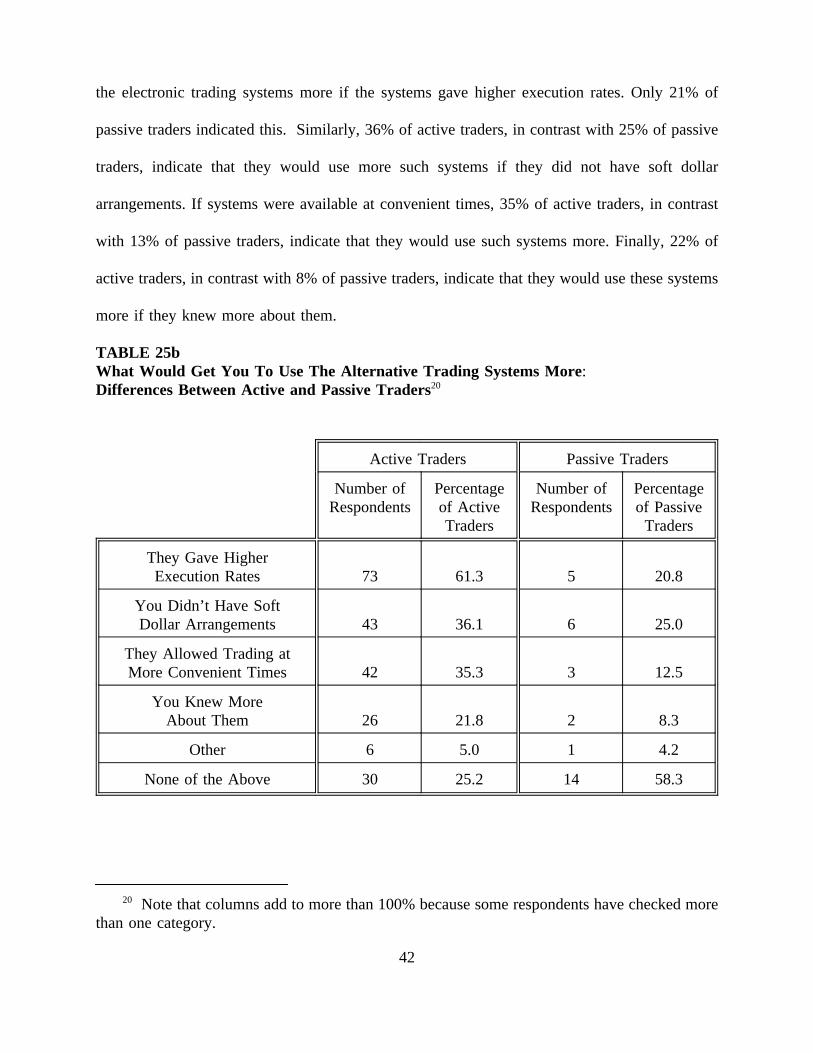
the electronic trading systems more if the systems gave higher execution rates. Only 21% of
passive traders indicated this. Similarly, 36% of active traders, in contrast with 25% of passive
traders, indicate that they would use more such systems if they did not have soft dollar
arrangements. If systems were available at convenient times, 35% of active traders, in contrast
with 13% of passive traders, indicate that they would use such systems more. Finally, 22% of
active traders, in contrast with 8% of passive traders, indicate that they would use these systems
more if they knew more about them.
TABLE 25bWhat Would Get You To Use The Alternative Trading Systems More:Differences Between Active and Passive Traders20
Active Traders Passive Traders
Number ofRespondents
Percentageof ActiveTraders
Number ofRespondents
Percentageof Passive
Traders
They Gave HigherExecution Rates 73 61.3 5 20.8
You Didn’t Have SoftDollar Arrangements 43 36.1 6 25.0
They Allowed Trading atMore Convenient Times 42 35.3 3 12.5
You Knew MoreAbout Them 26 21.8 2 8.3
Other 6 5.0 1 4.2
None of the Above 30 25.2 14 58.3
20 Note that columns add to more than 100% because some respondents have checked morethan one category.
42

Table 26b distinguishes between active and passive traders in the distribution of the
respondents according to the type of institution where they are more likely to trade. Among
active traders, the majority (51%) are in independent investment management firms, while 34%
trade for a subsidiary of a bank or a brokerage firm. The roles are reversed among passive
traders: the majority (54%) of passive trader respondents trade for a subsidiary of bank or a
brokerage firm, while 29% is in independent investment management firms.
TABLE 26bDistribution of Respondents by Institution:Differences Between Active and Passive Traders21
Active Traders Passive Traders
Number ofRespondents
Percentage ofActive Traders
Number ofRespondents
Percentage ofPassive Traders
IndependentInvestment
Management Firm61 51.3 7 29.2
Subsidiary ofBank or
Brokerage Firm40 33.6 13 54.2
Mutual Fund 12 10.1 2 8.3
InternallyManaged Pension
Fund7 5.9 2 8.3
Other 8 6.7 4 16.7
Table 27b below shows that the most important reasons to trade for active traders concern
their evaluation of fundamental information concerning individual stocks. Most respondents
(87%) indicated that they frequently trade because of stock specific, fundamental issues; and 74%
21 Note that columns add to more than 100% because some respondents have checked morethan one category.
43

indicated that they frequently trade because of internally generated research. Interestingly,
passive traders also trade for these reasons, though not as much as the active traders. Only 58%
of passive traders frequently traded because of stock specific fundamental issues, and 21%
because of internally generated research. On the other hand, 33% of the passive traders traded
to trace a market index vs. 8% of active traders. And 33% of passive traders traded because of
fund redemptions or other cash flow reasons vs. 19% of active traders.
In some respects the two groups are quite similar: 39% of active traders frequently trade
for profit taking compared to 25% for passive traders; 38% of active traders trade for bargain-
hunting purposes compared to 38% of passive traders; and 74% of active traders infrequently
trade because of chartist signals compared to 75% for passive traders. Overall, the active and
passive traders differ in emphasis, but not by as much as expected.
44

TABLE 27bWhy Do You Trade? Differences Between Active and Passive Traders
Active Traders Passive Traders
Frequently
Neutral
Infrequently
NA Frequently
Neutral
Infrequently
NA22
Stock SpecificFundamental Issues 86.6 8.4 3.4 1.6 58.3 16.7 25.0 0
Internally-generatedResearch (from
Portfolio Manager)74.8 17.6 6.7 0.9 41.7 20.8 33.3 4.2
Reassessment ofPortfolio Structure 47.9 31.9 17.6 2.6 54.2 20.8 25.0 0
Bargain-hunting 37.8 29.4 32.8 0 37.5 12.5 50.0 0
Profit Taking 39.4 30.3 30.3 0 25.0 33.3 41.7 0
Market-wide News 34.5 33.6 30.3 1.6 20.8 29.2 50.0 0
Fund Redemptions orOther Cash Flow
Reasons19.3 24.4 54.6 1.7 33.3 29.2 37.5 0
Trading Information(i.e., Knowledge of
an Order on theFloor)
18.5 31.9 48.7 0.7 8.3 29.2 62.5 0
Desire to Cut Losses 18.5 34.5 46.2 0.8 4.2 29.1 66.7 0
Chartist Signals 14.3 11.8 73.9 0 4.2 20.8 75.0 0
Need to Track aMarket Index
7.6 10.1 80.7 1.6 33.3 12.5 54.2 0
Derivatives-motivatedTrading 4.2 5.9 88.2 1.7 8.3 0 91.7 0
Other Factors 1.7 0.8 10.1 87.4 0 0 12.5 87.5
22 The indication NA stands for "No Answer".
45

8. Conclusion
This paper has presented an assessment of the demand for immediacy by buy-side institutional
equity traders that we surveyed. The 150 surveys that were returned clearly indicate that an appreciable
number of the respondents do trade patiently. This is not surprising in light of the size of trades that the
institutions commonly seek to make, and of the costs to them of obtaining immediacy in a continuous
market. Their orders commonly exceed the average daily trading volume for a stock, the large orders are
commonly broken into smaller pieces, and the smaller pieces often take a day or more to be executed
completely. The respondents were also concerned about losing anonymity to sell-side broker/dealers.
These findings have a major implication for market structure. Increasingly, electronic technology
is making it possible for institutional buy-side participants to meet each other directly in a disintermediated
environment. This can be done most effectively with batched (i.e., call market) trading arrangements,
which establish place and time meeting points. A perceived limitation of call market trading is that it does
not supply immediacy to participants. This is true, however, only if call markets are used in place of
continuous trading, rather than along with continuous trading, as we recommend.
However, immediacyper sedoes not appear to be urgently sought by many buy-side asset traders.
This suggests that, if both call and continuous markets were readily available to participants, the order
flow directed to the calls would, indeed, be appreciable. The bottom line is that providing electronic call
market trading would be desirable for an appreciable number of institutional investors.
46

References
Amihud, Yakov, and Haim Mendelson, (1980), "Dealership Market: Market-Making with Inventory,"Journal of Financial Economics, (March 1980).
Amihud, Yakov, and Haim Mendelson, (1985), "An Integrated Computerized Trading System," inMarketMaking and the Changing Structure of the Securities IndustryEd. Y. Amihud, T. Ho and R.Schwartz Lexington Books Lexington, MA 1985.
Cohen, Kalman J., S. Maier, Robert A. Schwartz, and D. Whitcomb,The Microstructure of SecuritiesMarkets. Englewood Cliffs, NJ: Prentice Hall, 1986.
Cohen, Kalman J. and Robert A. Schwartz, "An Electronic Call Market: Its Design and Desirability," inThe Challenge of Information Technology for the Securities Markets: Liquidity, Volatility, andGlobal Trading,H. Lucas and R. Schwartz Editors, 1989.
Economides, Nicholas and Jeff Heisler, (1994), "Co-existence of Call and Continuous Markets," mimeo.
Economides, Nicholas and Robert A. Schwartz, (1995), "Electronic Call Market Trading,"Journal ofPortfolio Management, vol. 21, no. 3, pp. 10-18, (Spring 1995).
Economides, Nicholas and Robert A. Schwartz, (1994),Making the Trade: Equity Trading Practices andMarket Structure - 1994, TraderForum, Institutional Investor, New York.
Garman, M., (1976), "Market Microstructure,"Journal of Financial Economics, (June 1976).
Handa, Puneet, and Robert A. Schwartz (1996), "How Best to Supply Liquidity to a Securities Market,"Journal of Portfolio Management, forthcoming.
Ho, T., and Stoll, H. (1981), "On Dealer Markets Under Competition,"Journal of Finance, (May 1980).
McInish, Thomas H., and Robert A. Wood (1990), "An Analysis of Transactions Data for the TorontoStock Exchange: Return Patterns and End of the Day Effect,"Journal of Banking and Finance,vol. 14, pp. 441-458.
Mildenstein, E., and Schleef, H. (1983), "The Optimal Pricing Policy of a Monopolistic Marketmaker inthe Equity Market,"Journal of Finance, (March 1983).
Schwartz, Robert A.,Reshaping the Equity Markets: A Guide for the 1990s,HarperBusiness, 1991(reissued by Business One Irwin, 1993).
Schwartz, Robert A. (editor)The Electronic Call Market, Irwin Professional, forthcoming, 1996.
Wagner, Wayne, and Mark Edwards, (1993), "Best Execution,"Financial Analysts Journal,(January/February 1993).
47

Appendix: The Questionnaire
48