equity works, aligning workforce programs with state … · equity works, aligning workforce...
TRANSCRIPT

Equity Works, Aligning Workforce Programs with State Efforts
Kolu Wilson| Director of the Office of Economic Equity and Opportunity
Tim O’Neill, Regional Labor Market Analyst – Labor Market Information
2/21/2017
mn.gov/deed

DEED
Created in 2003
Over 1,400 employees
mn.gov/deed
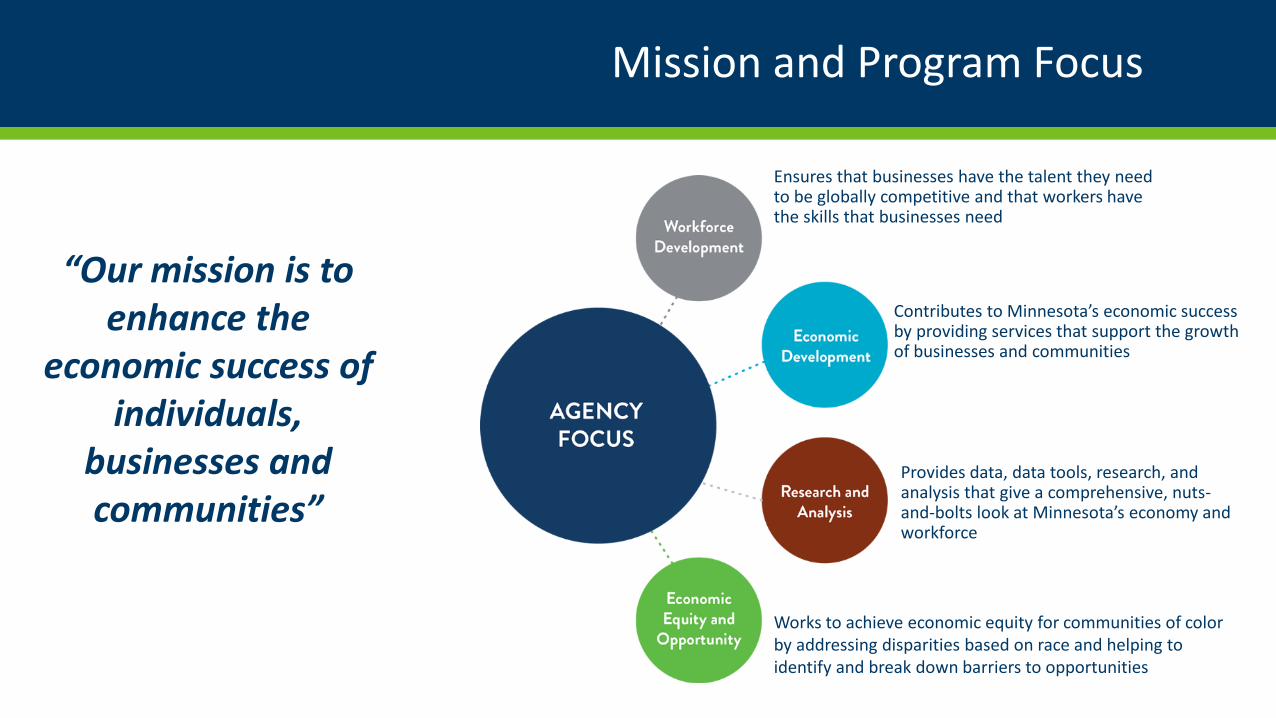
“Our mission is to enhance the
economic success of individuals,
businesses and communities”
Mission and Program Focus
Agency Focus
Ensures that businesses have the talent they need to be globally competitive and that workers have the skills that businesses need
Contributes to Minnesota’s economic success by providing services that support the growth of businesses and communities
Provides data, data tools, research, and analysis that give a comprehensive, nuts-and-bolts look at Minnesota’s economy and workforce
Works to achieve economic equity for communities of color by addressing disparities based on race and helping to identify and break down barriers to opportunities


Workforce Development Overview
Employment and Training for People with Disabilities
Employment and Training - Youth
Programs
Employment and Training – Adult
Programs
Unemployment Insurance Program
Individual Placement &
SupportsExtended
Employment Independent Living
StateServices for the
Blind
Vocational Rehabilitation
Services

Employment and Training
• Programs and services for employers include:
• Dual Training Competency Grants
• Minnesota Apprenticeship Initiative Grants
• Federal Bonding Program
• Work Opportunity Tax Credit
• Foreign Labor Certification Program
• Rapid Response
• Labor Market Data
mn.gov/deed

Employment and Training
• Programs and services for unemployed individuals include:
• Dislocated Worker Program
• Rapid Response Program
• Displaced Homemaker Program
• Pathways to Prosperity Program
• Trade Adjustment Assistance
mn.gov/deed

Economic Development Overview
Economic DevelopmentBusiness
Assistance Programs
Community Assistance Programs
Minnesota Trade Office
Business FinanceBusiness
Development Small Business
Assistance
Infrastructure Programs
BroadbandDevelopment
Redevelopment Grant Program

Economic Development
• Business Development
• Workforce Development Training Grants
• Minnesota Job Skills Partnership
• Job Training Incentive Program
• Low Income Worker Training Program
• Pathways Program
https://mn.gov/deed/business/financing-business/mjsp/training-grants/
mn.gov/deed

OEEO Overview
• Created by Gov. Mark Dayton in 2015
• Purpose: To address economic disparities and achieve equity for communities of color
• Goal: A Minnesota where race does not predicteconomic outcomes
mn.gov/deed

OEEO Objectives
• Integrate racial equity principles and practices in all agency work.
• Ensure communities of color have equitable access to agency workforce and business resources and opportunities.
• Expand employment, contracting and engagement opportunities for communities of color.
mn.gov/deed

Equity Grants
• In 2016, the Minnesota Legislature approved a $35 million spending package, which Governor Dayton signed into law, for equity programs and services designed to improve economic opportunities for communities of color, women, people with disabilities, veterans and youth
• Much of this was to be administered by DEED, including about $10 million in competitive grants and $24 million in direct appropriations
• The OEEO facilitated the grant process
• Principles – Awareness, Access, Transparency, Outcomes
mn.gov/deed

Equity Grants
• New and existing DEED programs that received equity grant funding: • Pathways to Prosperity
• Youth at Work
• Women in High Wage, High Demand, Nontraditional Jobs (WESA)
• Southeast Asian Economic Relief
• Support Services (Adult and Youth)
• Somali Youth
• Capacity Building
• Minnesota Emerging Entrepreneur Loan Program
mn.gov/deed

Competitive Grants Process
Legislature Appropriates
Funds
DEED Develops Programs
DEED Develops
RFPs
Open RFP Period
Applications Review –Review Panels
Award Decisions
Made
Grant Agreements Negotiated
and Executed

Equity Competitive Grant Programs – Funding Requests

Guiding Authority
• Governor Dayton’s Administration - An Opportunity Agenda for a Better Minnesota
• Job Creation – Equity Initiatives
• Prepare Minnesotans for jobs in growing industries
• Training for High Wage, High Demand Jobs
• Expanding Access to Apprenticeships
• Minnesota Legislature
• Workforce Innovation and Opportunity Act (WIOA) - Strategic Workforce Plan (2016 –2010)
• Goal 1 – Reduce educational and employment disparities along race and disability.
• Goa1 2 – Build business-led industry sector strategies that meet the demands of the economy.
mn.gov/deed

Using Labor Market Information - The State of the State
How many workers are there in Minnesota?3,019,622 workers (2016 Annual Average)
How many of them are unemployed?115,238 unemployed workers (3.8%)
Is Minnesota’s economy growing or declining?GROWING!
Minnesota gained +11,900 jobs in December;
and +37,102 jobs since last year
What about wages?Up 5.7% over-the-year!
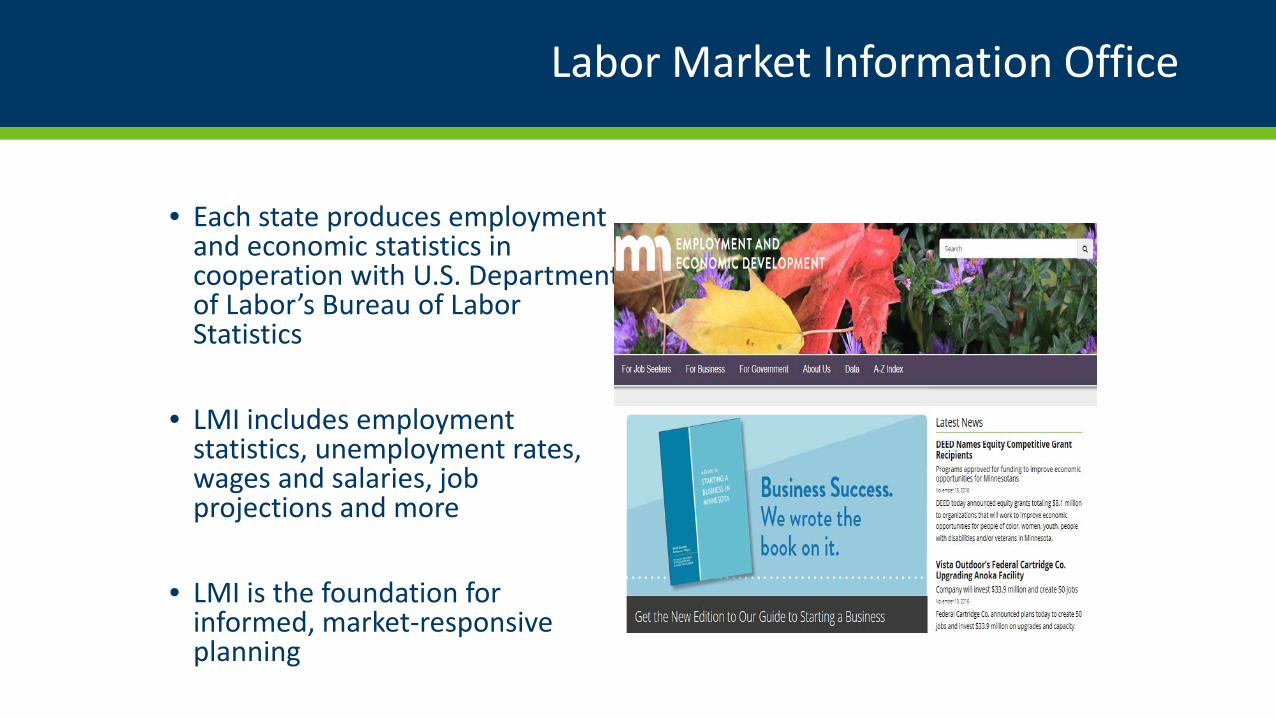
Labor Market Information Office
• Each state produces employment and economic statistics in cooperation with U.S. Department of Labor’s Bureau of Labor Statistics
• LMI includes employment statistics, unemployment rates, wages and salaries, job projections and more
• LMI is the foundation for informed, market-responsive planning


Labor Force Trends
60.0
62.0
64.0
66.0
68.0
70.0
72.0
74.0
76.0
78.0Ja
n-76
Jul-7
7Ja
n-79
Jul-8
0Ja
n-82
Jul-8
3Ja
n-85
Jul-8
6Ja
n-88
Jul-8
9Ja
n-91
Jul-9
2Ja
n-94
Jul-9
5Ja
n-97
Jul-9
8Ja
n-00
Jul-0
1Ja
n-03
Jul-0
4Ja
n-06
Jul-0
7Ja
n-09
Jul-1
0Ja
n-12
Jul-1
3Ja
n-15
Jul-1
6
Minnesota
United States
Peaked at 75.6% in 2000
Baby Boomers leaving the workforce

Labor Force & UnemploymentMinnesota 1976 – 2016
0
500,000
1,000,000
1,500,000
2,000,000
2,500,000
3,000,000
3,500,000
0
50,000
100,000
150,000
200,000
250,000
1976
1978
1980
1982
1984
1986
1988
1990
1992
1994
1996
1998
2000
2002
2004
2006
2008
2010
2012
2014
2016
Labor ForceU
nem
ploy
men
t
UnemploymentLabor Force

Regional Unemployment Rates
County December 2016 Unemployment Rate
Central MN 4.8%
Northeast MN 6.3%
Northwest MN 5.8%
7-County Metro 3.4%
Southeast MN 3.6%
Southwest MN 4.2%
Minnesota 4.0%
United States 4.5%
Not Seasonally Adjusted

Alternative Measures of Unemployment

Alternative Measures of Unemployment
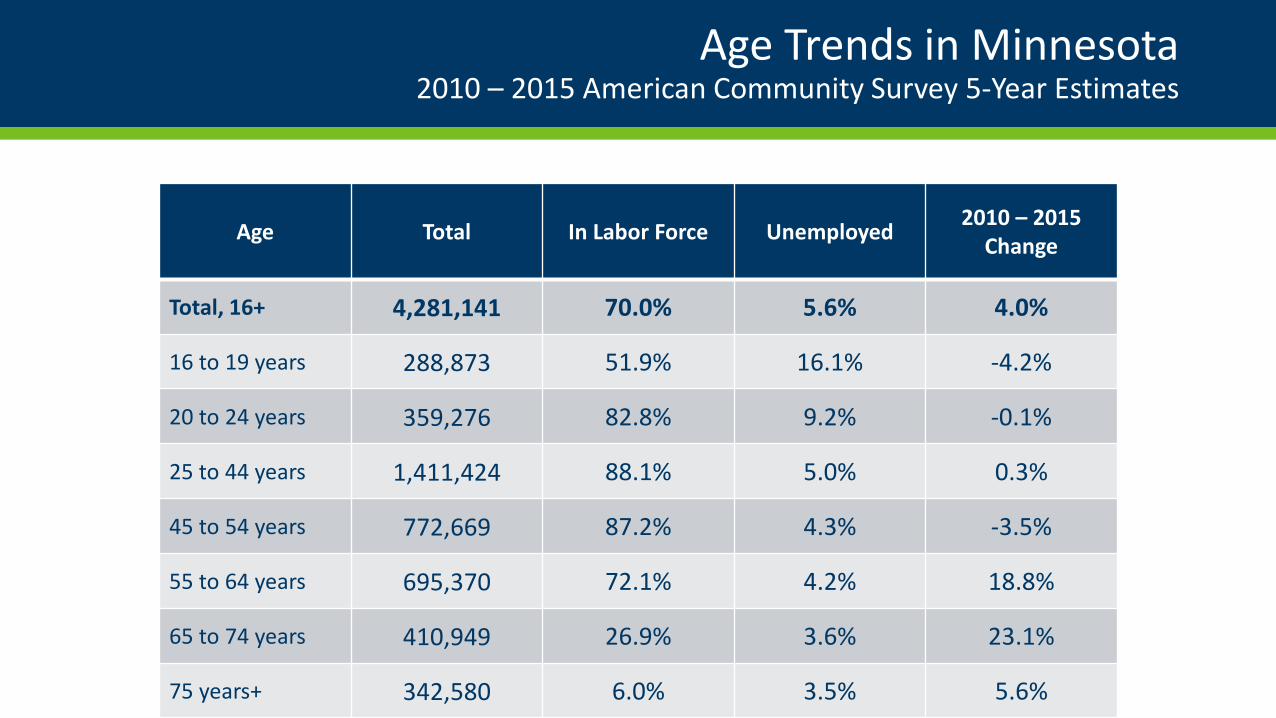
Age Trends in Minnesota2010 – 2015 American Community Survey 5-Year Estimates
Age Total In Labor Force Unemployed 2010 – 2015 Change
Total, 16+ 4,281,141 70.0% 5.6% 4.0%
16 to 19 years 288,873 51.9% 16.1% -4.2%
20 to 24 years 359,276 82.8% 9.2% -0.1%
25 to 44 years 1,411,424 88.1% 5.0% 0.3%
45 to 54 years 772,669 87.2% 4.3% -3.5%
55 to 64 years 695,370 72.1% 4.2% 18.8%
65 to 74 years 410,949 26.9% 3.6% 23.1%
75 years+ 342,580 6.0% 3.5% 5.6%
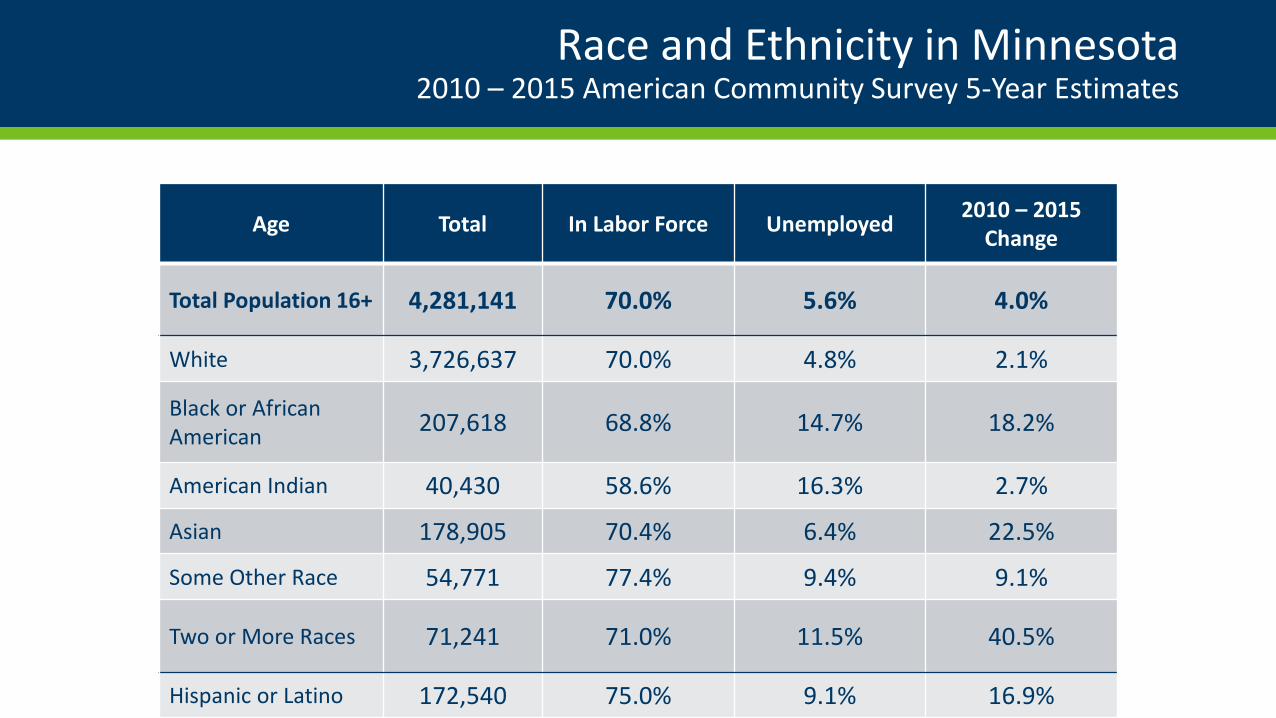
Race and Ethnicity in Minnesota2010 – 2015 American Community Survey 5-Year Estimates
Age Total In Labor Force Unemployed 2010 – 2015 Change
Total Population 16+ 4,281,141 70.0% 5.6% 4.0%
White 3,726,637 70.0% 4.8% 2.1%
Black or African American 207,618 68.8% 14.7% 18.2%
American Indian 40,430 58.6% 16.3% 2.7%
Asian 178,905 70.4% 6.4% 22.5%
Some Other Race 54,771 77.4% 9.4% 9.1%
Two or More Races 71,241 71.0% 11.5% 40.5%
Hispanic or Latino 172,540 75.0% 9.1% 16.9%

359,515
140,231
0 100,000 200,000 300,000 400,000
Minority Population
Non-Hispanic White Population
52.2%
3.3%
0.0% 10.0% 20.0% 30.0% 40.0% 50.0% 60.0%
Minority Population
Non-Hispanic White Population
Race and Ethnicity in Minnesota2005 – 2015 American Community Survey 1-year Estimates

Minnesota’s Tight Labor Market
0.0
1.0
2.0
3.0
4.0
5.0
6.0
7.0
8.0
9.0
0
50,000
100,000
150,000
200,000
250,000
300,000
Q4,
200
1Q
2, 2
002
Q4,
200
2Q
2, 2
003
Q4,
200
3Q
2, 2
004
Q4,
200
4Q
2, 2
005
Q4,
200
5Q
2, 2
006
Q4,
200
6Q
2, 2
007
Q4,
200
7Q
2, 2
008
Q4,
200
8Q
2, 2
009
Q4,
200
9Q
2, 2
010
Q4,
201
0Q
2, 2
011
Q4,
201
1Q
2, 2
012
Q4,
201
2Q
2, 2
013
Q4,
201
3Q
2, 2
014
Q4,
201
4Q
2, 2
015
Q4,
201
5Q
2, 2
016
Num
ber o
f Une
mpl
oyed
Per
Vac
ancy
Num
ber o
f Une
mpl
oyed
& V
acan
cies
Number of Vacancies Number of Unemployed Unemployed per Vacancy

Minnesota Job Vacancies by Industry
Health Care & Social Assistance
21%
Accommodation & Food Services
14%
Retail Trade12%
Manufacturing9%
Construction7%
Educational Services6%
Finance & Insurance4%
Other Services4%
Professional, Scientific, and Technical Services
4%
Transportation & Warehousing4%
Ten Smallest Industries15%

Metro-Area Vacancies Q2, 2016 JVS
• Retail Salespersons (1,937 vacancies)
• Hairdressers & Cosmetologists (1,719)
• Personal Care Aides (1,683)
• Supervisors of Food Prep & Serving Workers (1,432)
• Combined Food Prep & Serving Workers (1,417)
• Registered Nurses (1,351)
Workers (1,015)
• Nursing Assistants (995)
• Cooks, Restaurant (962)
• Customer Service Representatives (886)
• Waiters & Waitresses (882)
• Maids & Housekeeping Cleaners (801)
• Stock Clerks and Order Fillers (781)

Vacancy Trends by Industry2010 – 2015 Avg. Annual Change in Vacancies
Industry Q2 2016 Vacancies
Avg. OTY Vacancy Change
2010-2015 Job Change
Total 55 Years+
Total, All Industries 97,580 22.6% 9.1% 27.3%
Construction 6,696 74.7% 34.9% 64.1%
Other Services 3,914 46.3% 4.8% 20.1%
Transportation & Warehousing 3,404 37.8% 16.1% 42.0%
Accommodation & Food Services 14,020 37.3% 11.6% 34.9%
Retail Trade 11,987 25.5% 0.5% 18.0%
Health Care & Social Assistance 20,875 24.7% 12.2% 27.6%
Agriculture 418 22.3% 21.4% 50.2%
Admin. & Waste Services 2,899 22.0% 11.0% 38.4%
Manufacturing 8,536 21.1% 9.6% 37.2%
Wholesale Trade 3,022 18.6% 6.3% 31.6%

Largest-Growing Industries2010 – 2015
Industry Title Job Growth PercentProfessional, Scientific, & Technical Services 21,276 17.1%Specialty Trade Contractors 18,030 32.8%Food Services & Drinking Places 17,436 10.1%Ambulatory Health Care Services 16,994 13.5%Social Assistance 14,650 19.6%Administrative & Support Services 12,235 10.4%Merchant Wholesalers, Durable Goods 7,734 13.2%Management of Companies & Enterprises 7,479 10.6%Hospitals 6,432 5.6%Educational Services 6,403 3.0%

Minnesota Job Vacancy Characteristics
$11.00$12.16
$15.01
$19.81
$28.87
$35.71
$11.64
$16.43
$34.99
$0.00
$5.00
$10.00
$15.00
$20.00
$25.00
$30.00
$35.00
$40.00
0
10,000
20,000
30,000
40,000
50,000
60,000
None High schoolor GED
Vocationaltraining
Associate'sdegree
Bachelor'sdegree
Advanceddegree
Less thanone year
experience
1 - 3 Yearsof
experience
4+ Years ofexperience
Median W
age OfferN
umbe
r of J
ob V
acan
cies
Number of VacanciesMedian Wage Offer

Job Seeking Resources
• Occupational Employment Statistics (OES)
• Cost of Living Calculator
• Occupations in Demand (OID)
• Career Profile
• Employment Outlook
• Graduate Employment Outcomes (GEO)
• Job Vacancy Survey (JVS)
• CareerOneStop

LMI Publications
• Minnesota Economic Trends• Quarterly magazine on economic topics
• Subscriptions available free of charge or on-line
• http://mn.gov/deed/newscenter/publications/trends/
• Minnesota Employment Review• Monthly magazine on economic data and regional trends
• Includes Minnesota business development
• Available exclusively on-line
• http://mn.gov/deed/newscenter/publications/review/

LMI Helpline
• LMI experts are available to answer your questions weekdays from 9 AM to 3 PM
• Telephone 651-259-7384 , or toll free at 888-234-1114
• Send questions by e-mail to [email protected]
