erdc/chl chetn-iv-116 'post-irma unmanned aircraft system ... · small uas (groups i and ii)...
TRANSCRIPT
ERDC/CHL CHETN-IV-116 April 2019
Approved for public release; distribution is unlimited. Destroy when no longer needed; do not return to the originator.
Post-Irma Unmanned Aircraft System (UAS)
Coastal Storm Impact Surveys
by Katherine Brodie, Nicholas Spore, Brittany Bruder, Alexander Renaud, Tyler Hesser, Victor Wilhelm, and Kevin Hodgens
PURPOSE: This Coastal and Hydraulics Engineering Tech Note (CHETN) provides a brief, preliminary assessment of utilizing small unmanned aircraft systems (UAS) to collect topographic data of the sub-aerial beach prior to and following extreme coastal storms to provide quantitative storm impact assessments.
BACKGROUND: Under the authority of Public Law (PL) 84-99, the U.S Army Corps of Engineers (USACE) Office of Homeland Security/ Emergency Management can use Flood Control and Coastal Emergencies (FCCE) funds to rehabilitate Coastal Storm Risk Management (CSRM) projects following major storms (33 USC §701n; 33 CFR Part 203). One criterion used to determine if rehabilitation is warranted under the PL 84-99 authority is the amount of fill volume lost, calculated by comparing pre- and post-storm topographic surfaces. Unfortunately, the pre-storm surveys are often out of date (anywhere from months to years prior to the storm), and therefore the true impact of the storm cannot be separated from either natural variations in beach evolution, and/or the portion of the project designed to be sacrificial in nature. For example, the 2013 USACE Sandy Coastal Project Performance Evaluation Study (USACE 2013) highlights that many districts lack detailed, quantitative data before the storm to document and evaluate the performance of federal beach projects following extreme events1.
As a consequence of outdated pre-storm data, the FCCE account may either be funding extra replenishment of beach projects, which should instead be covered by Construction General funds (under terms of the project's Project Partnership Agreement), or may be funding rehabilitation projects that, with accurate data, would not be deemed warranted. In Fiscal Year 13, the FCCE account funded 33 CSRM rehabilitation projects in response to Hurricane Sandy, with 25 rehabilitation projects in the North Atlantic District alone costing over $500M. Each rehabilitation project using a dredge costs at minimum $2M in dredge mobilization/demobilization costs before any sand is pumped onto the beach, meaning the avoidance of just one rehabilitation project could result in the savings of over $2M to the FCCE program. Twelve districts in four divisions have CSRM projects that would directly benefit from improved mapping capabilities, more timely data, and therefore more accurate volume change calculations.
In some cases, when storm damage is widespread, the Joint Airborne Lidar Bathymetry Technical Center of eXpertise (JALBTCX) is funded to collect post-storm assessment imagery and elevation data of impacted coastal regions, which supplements the National Coastal Mapping Program 1 Hurricane Sandy Coastal Projects Performance Evaluation Study Disaster Relief Appropriations Act, 2013: Rockaway, NY: “There is no detailed information to document the physical performance of this project,” p 37; Fire Island to Shores Westerly, NY: “Although no specific quantitative data are available…,” p 47; Ocean Gate, NJ: “The relative condition of the project prior to Hurricane Sandy is unknown,” p 46; Manasquan, NJ: “No full-scale detailed profile monitoring had been done since 2003 [9 years prior],” p 35; Maryland: “The pre-storm condition of Assateague Island is not known,” p 53.

ERDC/CHL CHETN-IV-116 April 2019
2
mission to provide data every 5 years on U.S. coastlines. Figure 1 highlights the availability of pre/post-storm JALBTCX surveys for the most recent significant storms to impact the United States. Available pre-storm data for impacted regions ranged from 0.4 to 6.4 years prior to storm impact in the continental United States, and between 1.5 to over 13 years prior for Puerto Rico (Figure 1, blue bars). In general, JALBTCX post-storm surveys occurred < 2 months following the storm; however, for some areas, surveys postdated storms by 1 to 2 years (Figure 1, orange bars). In addition, despite significant impacts occurring to the coast, no post-storm surveys occurred after Hurricanes Maria (2017) in Puerto Rico, Hurricane Harvey (2017) in Texas, and some areas affected by Sandy (2012) due to cost or scheduling constraints. Data processing times have been improving (Figure 1, gray bars), ranging from 0.5 to 4.5 years after Hurricane Sandy to less than a month following Hurricane Irma. Absent from Figure 1 are other events that severely impact beach projects (i.e., Nor’Easters and El Niño winters). Few post-Nor’Easter/El-Niño JALBTCX data were found to exist, perhaps due to funding/scheduling constraints. The need for cost-efficient methods to collect higher frequency coastal morphology data is evident.
Figure 1. Time between recent major hurricanes and the most recently available JALBTCX data (JALBTCX 2018): prior to impact (blue bars), after impact (orange bars), and post storm publication (gray bars) for different locations along the U.S. East, Gulf, and Caribbean Coasts.
Recent advancements in UAS-based technologies and photogrammetric software have led to the development of cost-efficient tools for accurate, detailed, and timely three-dimensional monitoring of coastal terrain, environmental features, and infrastructure. Using these low-cost and easy-to-use commercial-off-the-shelf (COTS) hardware and software tools, districts now have the opportunity to efficiently monitor and map individual CSRM projects and infrastructure frequently. As a result, UAS remote sensing methods have the potential to substantially alter how USACE collects, processes, and exploits geospatial products for a variety of coastal management applications. These applications include improved assessment of flood risks and storm impacts from timely surveying capabilities, as well as emergency management operations during and after natural disasters. UAS fill an important gap between air/space-borne assets and on-the-ground surveys, but just like other geospatial tools have pros and cons. Table 1 outlines different geospatial surveying tools and example advantages and disadvantages.

ERDC/CHL CHETN-IV-116 April 2019
3
Table 1. Overview of methodology for geospatial data collection. Method Advantage Disadvantage
Satellite Very large areas (1000s of kilometers [km]), low-cost, wide range of sensors.
Low spatial resolution, low-accuracy terrain models.
Manned Airplane or Large UAS (Groups III or IV)
Large areas (100s of km), can support large payloads (e.g., topo-bathymetric lidar and precise cameras).
Medium-high cost; contracting/scheduling can be slow. Medium resolution (1-10 points per meter [pts /m]).
Small UAS (Groups I and II)
Smaller areas (1 to 10s of km), very high spatial resolution (1000s of pts/m), optical and multi-spectral imagery, some topographic lidar.
Lower accuracy than ground-based remote sensing/surveys; variable quality sensors; black-box processing software.
Field Survey
Smaller areas (0.1 to 10s of km), very accurate, low to high spatial resolution (GPS survey vs. terrestrial or mobile lidar).
High-cost, time-intensive, difficult to access some areas, higher safety risk to operating personnel, smaller areas.
This CHETN documents a joint ERDC-District pilot effort to utilize UAS to map post-Hurricane Irma sub-aerial beach and navigation structure topography at three locations in the South-Atlantic Jacksonville (SAJ) District: Duval County Beach, St. Augustine Beach, and Ponce Inlet (Green circles, Figure 2A). A brief overview of Hurricane Irma and the existing USACE techniques used to assess storm impacts is provided followed by a discussion of the three field sites where data were collected and the data collection and processing methodology. The UAS and airborne lidar data quality is evaluated relative to control points and to each other. This note concludes with a brief discussion of logistical concerns, lessons learned, a summary, and plans for future work.
Figure 2. (A) Hurricane Irma’s path (magenta line)
through Florida and the three field site locations (green circles) at Duval Beach, St. Augustine Beach, and Ponce Inlet. (B-E) Images of Hurricane Irma damage (B, C) and SAJ personnel conducting post-hurricane assessments, assessing beach erosion across the shore face (D) as well as volume lost relative to pre-storm levels (E).
ERDC/CHL CHETN-IV-116 April 2019
4
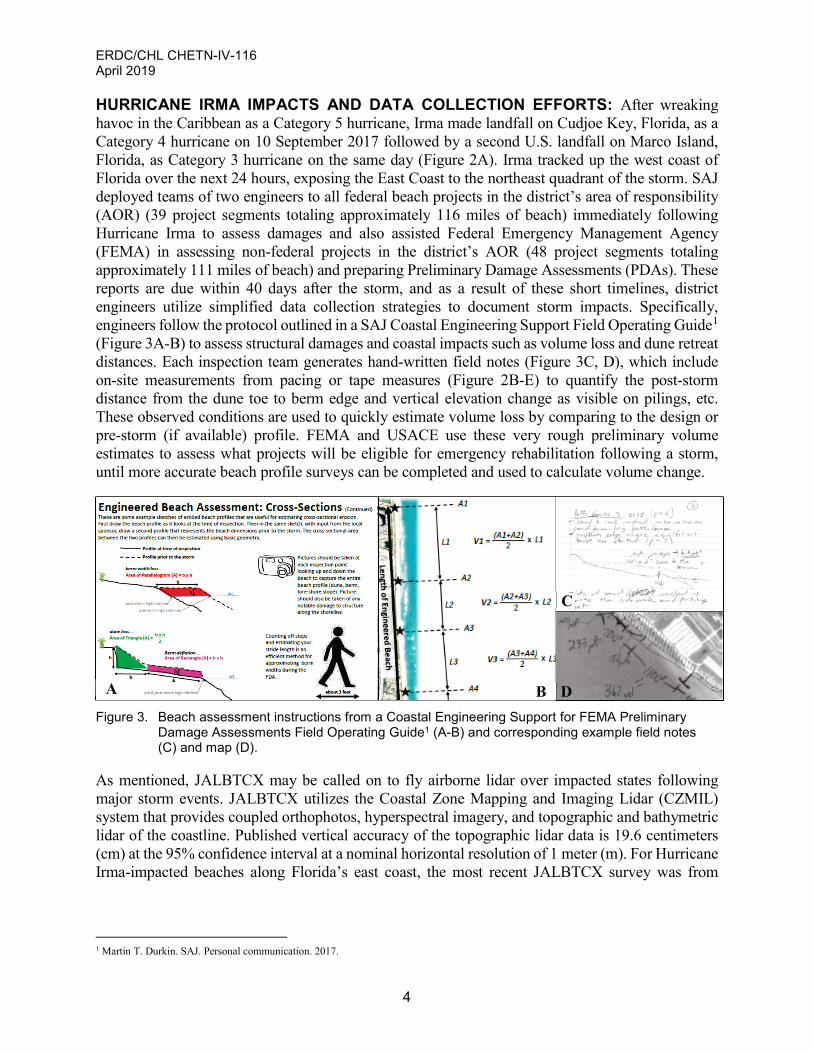
HURRICANE IRMA IMPACTS AND DATA COLLECTION EFFORTS: After wreaking havoc in the Caribbean as a Category 5 hurricane, Irma made landfall on Cudjoe Key, Florida, as a Category 4 hurricane on 10 September 2017 followed by a second U.S. landfall on Marco Island, Florida, as Category 3 hurricane on the same day (Figure 2A). Irma tracked up the west coast of Florida over the next 24 hours, exposing the East Coast to the northeast quadrant of the storm. SAJ deployed teams of two engineers to all federal beach projects in the district’s area of responsibility (AOR) (39 project segments totaling approximately 116 miles of beach) immediately following Hurricane Irma to assess damages and also assisted Federal Emergency Management Agency (FEMA) in assessing non-federal projects in the district’s AOR (48 project segments totaling approximately 111 miles of beach) and preparing Preliminary Damage Assessments (PDAs). These reports are due within 40 days after the storm, and as a result of these short timelines, district engineers utilize simplified data collection strategies to document storm impacts. Specifically, engineers follow the protocol outlined in a SAJ Coastal Engineering Support Field Operating Guide1
(Figure 3A-B) to assess structural damages and coastal impacts such as volume loss and dune retreat distances. Each inspection team generates hand-written field notes (Figure 3C, D), which include on-site measurements from pacing or tape measures (Figure 2B-E) to quantify the post-storm distance from the dune toe to berm edge and vertical elevation change as visible on pilings, etc. These observed conditions are used to quickly estimate volume loss by comparing to the design or pre-storm (if available) profile. FEMA and USACE use these very rough preliminary volume estimates to assess what projects will be eligible for emergency rehabilitation following a storm, until more accurate beach profile surveys can be completed and used to calculate volume change.
Figure 3. Beach assessment instructions from a Coastal Engineering Support for FEMA Preliminary
Damage Assessments Field Operating Guide1 (A-B) and corresponding example field notes (C) and map (D).
As mentioned, JALBTCX may be called on to fly airborne lidar over impacted states following major storm events. JALBTCX utilizes the Coastal Zone Mapping and Imaging Lidar (CZMIL) system that provides coupled orthophotos, hyperspectral imagery, and topographic and bathymetric lidar of the coastline. Published vertical accuracy of the topographic lidar data is 19.6 centimeters (cm) at the 95% confidence interval at a nominal horizontal resolution of 1 meter (m). For Hurricane Irma-impacted beaches along Florida’s east coast, the most recent JALBTCX survey was from
1 Martin T. Durkin. SAJ. Personal communication. 2017.
A B
C
D
ERDC/CHL CHETN-IV-116 April 2019
5
Hurricane Matthew post-storm flight in 2017, which means in this case, pre-storm data was only a year out of date but likely did not include any Hurricane Matthew response placements.
UAS DATA COLLECTION OVERVIEW: The UAS data collected for this pilot project cost $10K for SAJ to collect and process the data into georectified orthomosaics, topographic point clouds, and digital surface models (DSMs) at three federal beach project sites (Duval County Beach, St. Augustine Beach, and near Ponce Inlet in Florida). Collection time for the three sites totaled 36 person-hours. Data were collected by a three-person team from SAJ, which included a UAS pilot, UAS observer, and a survey technician.
Platform and Camera. An eBee Sensefly fixed wing UAS, weighing 1.5 pounds (lb) with a Sensor Optimized for Drone Applications (SODA) camera was used to collect imagery data of the coast (1.25 cm ground sampling distance). This older platform cost ~12K, but is no longer sold. The subsequent platform (eBee Plus) would have been preferable for the flight due to the inclusion of Real-Time Kinematic/Virtual Reference Station (RTK/VRS) Global Positioning System (GPS) onboard; however, SAJ did not yet have their Air Worthiness Release (AWR) for this platform at this time. Alternative platforms would be the 3DR Solo (small quadcopter costing <$1K with or without RTK GPS) or the FireFLY6 PRO sold by BirdsEyeView (~$13K). Systems with highly accurate (< 0.1 m error), GPS-tagged imagery are preferred, as they reduce reliance on ground control for georectified data.
Site Selections and Airspace Access. SAJ selection criteria focused on three main considerations: field collection costs, airspace access, and technical merit. To minimize field data collection costs for this effort, locations within 3 hours driving distance of Jacksonville, FL, (enabling one-day site visits) were prioritized to reduce costs associated with lodging and per diem. In addition, sites with minimal airspace access timeframes, Certificate of Airworthiness (COA) Via Notification, or existing COAs were prioritized (FAA 2017). Finally, candidate sites had to have been impacted by 2017 hurricanes and be a federal beach project, or a beach with similar characteristics to have technical merit for data collection. Three sites were selected meeting these criteria, two of them being federal beach nourishment projects (Duval County and St. Augustine) and one being a jetty (Ponce Inlet).
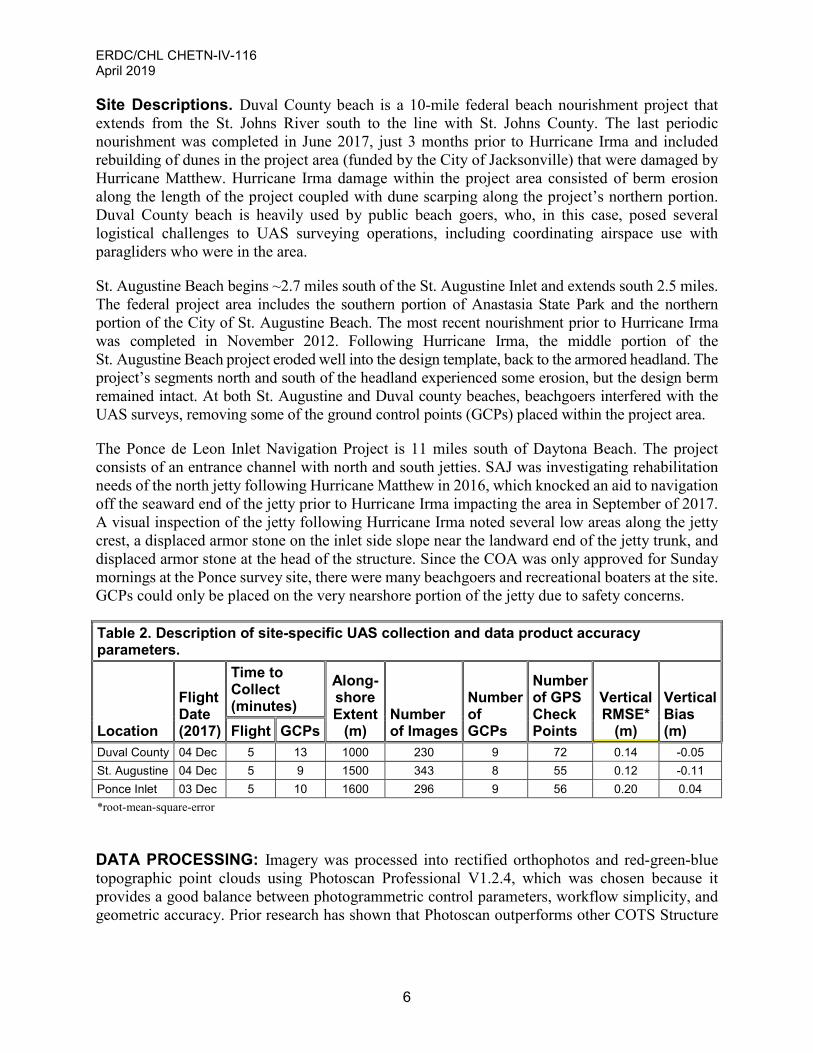
St. Augustine and Ponce Inlet required a new COA via Notification airspace access requests while Duval County already had a COA in place that could be used for this effort. SAJ obtained a COA via Notification for two of the sites that were federal beach project sites within Class G airspace. Normally, the timeframe to process requests to fly requires 10 days following submittal of the airspace access request from the Department of the Army Representative (DAR) to the Federal Aviation Administration (FAA). However, the flight lines near St. Augustine were close to Class E airspace, and the DAR would not approve the originally requested flight lines, so the request had to be resubmitted. As a result, this process took 20 days from initiation of the request and 23 days total from when funding was in place (31 October 2017). Due to the proximity of the Ponce Inlet Jetty to the approach of New Smyrna Beach Municipal Airport, a COA was only approved for Sunday mornings, which made timing survey windows with tides and weather more challenging (ideally, UAS beach topographic surveys would be collected at low tide in winds of less than 20 mph). UAS flights ultimately were conducted at Duval County Beach, St. Augustine Beach, and near Ponce Inlet on 04, 04, and 03 December 2017, respectively (Table 2).
ERDC/CHL CHETN-IV-116 April 2019
6
Site Descriptions. Duval County beach is a 10-mile federal beach nourishment project that extends from the St. Johns River south to the line with St. Johns County. The last periodic nourishment was completed in June 2017, just 3 months prior to Hurricane Irma and included rebuilding of dunes in the project area (funded by the City of Jacksonville) that were damaged by Hurricane Matthew. Hurricane Irma damage within the project area consisted of berm erosion along the length of the project coupled with dune scarping along the project’s northern portion. Duval County beach is heavily used by public beach goers, who, in this case, posed several logistical challenges to UAS surveying operations, including coordinating airspace use with paragliders who were in the area.
St. Augustine Beach begins ~2.7 miles south of the St. Augustine Inlet and extends south 2.5 miles. The federal project area includes the southern portion of Anastasia State Park and the northern portion of the City of St. Augustine Beach. The most recent nourishment prior to Hurricane Irma was completed in November 2012. Following Hurricane Irma, the middle portion of the St. Augustine Beach project eroded well into the design template, back to the armored headland. The project’s segments north and south of the headland experienced some erosion, but the design berm remained intact. At both St. Augustine and Duval county beaches, beachgoers interfered with the UAS surveys, removing some of the ground control points (GCPs) placed within the project area.
The Ponce de Leon Inlet Navigation Project is 11 miles south of Daytona Beach. The project consists of an entrance channel with north and south jetties. SAJ was investigating rehabilitation needs of the north jetty following Hurricane Matthew in 2016, which knocked an aid to navigation off the seaward end of the jetty prior to Hurricane Irma impacting the area in September of 2017. A visual inspection of the jetty following Hurricane Irma noted several low areas along the jetty crest, a displaced armor stone on the inlet side slope near the landward end of the jetty trunk, and displaced armor stone at the head of the structure. Since the COA was only approved for Sunday mornings at the Ponce survey site, there were many beachgoers and recreational boaters at the site. GCPs could only be placed on the very nearshore portion of the jetty due to safety concerns.
Table 2. Description of site-specific UAS collection and data product accuracy parameters.
Location
Flight Date (2017)
Time to Collect (minutes)
Along-shore Extent
(m) Number of Images
Number of GCPs
Number of GPS Check Points
Vertical RMSE*
(m)
Vertical Bias (m) Flight GCPs
Duval County 04 Dec 5 13 1000 230 9 72 0.14 -0.05 St. Augustine 04 Dec 5 9 1500 343 8 55 0.12 -0.11 Ponce Inlet 03 Dec 5 10 1600 296 9 56 0.20 0.04 *root-mean-square-error
DATA PROCESSING: Imagery was processed into rectified orthophotos and red-green-blue topographic point clouds using Photoscan Professional V1.2.4, which was chosen because it provides a good balance between photogrammetric control parameters, workflow simplicity, and geometric accuracy. Prior research has shown that Photoscan outperforms other COTS Structure
ERDC/CHL CHETN-IV-116 April 2019
7
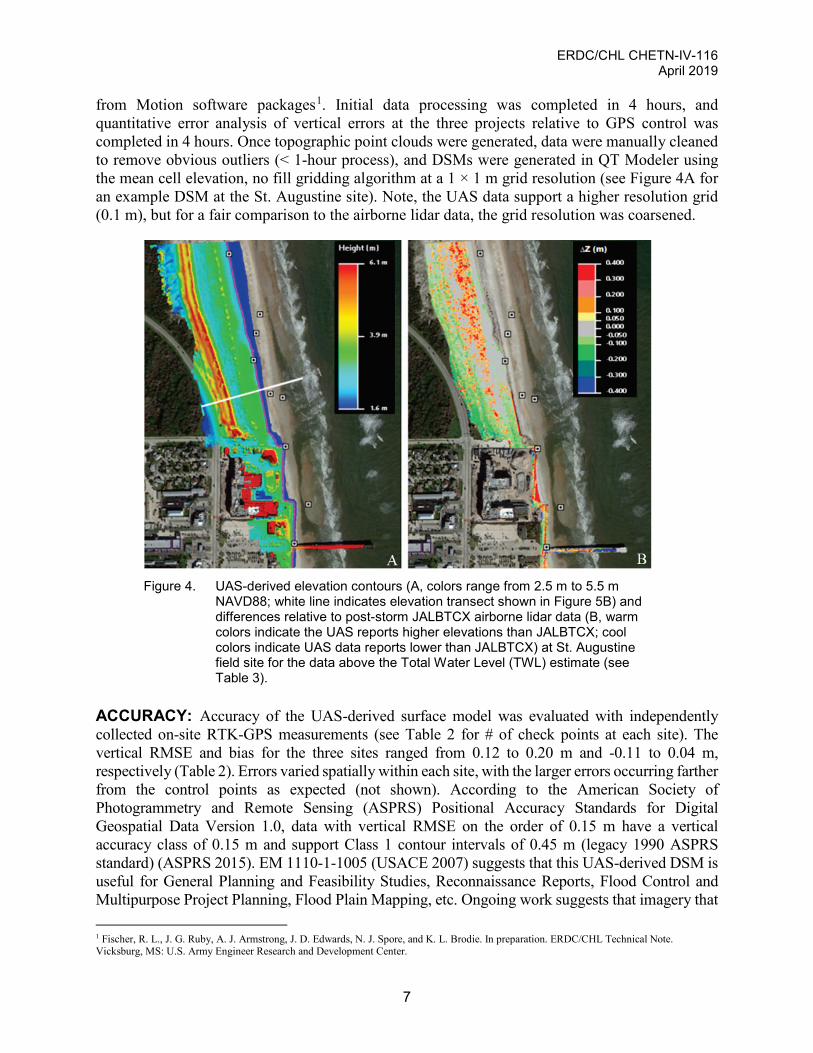
from Motion software packages1. Initial data processing was completed in 4 hours, and quantitative error analysis of vertical errors at the three projects relative to GPS control was completed in 4 hours. Once topographic point clouds were generated, data were manually cleaned to remove obvious outliers (< 1-hour process), and DSMs were generated in QT Modeler using the mean cell elevation, no fill gridding algorithm at a 1 × 1 m grid resolution (see Figure 4A for an example DSM at the St. Augustine site). Note, the UAS data support a higher resolution grid (0.1 m), but for a fair comparison to the airborne lidar data, the grid resolution was coarsened.
Figure 4. UAS-derived elevation contours (A, colors range from 2.5 m to 5.5 m
NAVD88; white line indicates elevation transect shown in Figure 5B) and differences relative to post-storm JALBTCX airborne lidar data (B, warm colors indicate the UAS reports higher elevations than JALBTCX; cool colors indicate UAS data reports lower than JALBTCX) at St. Augustine field site for the data above the Total Water Level (TWL) estimate (see Table 3).
ACCURACY: Accuracy of the UAS-derived surface model was evaluated with independently collected on-site RTK-GPS measurements (see Table 2 for # of check points at each site). The vertical RMSE and bias for the three sites ranged from 0.12 to 0.20 m and -0.11 to 0.04 m, respectively (Table 2). Errors varied spatially within each site, with the larger errors occurring farther from the control points as expected (not shown). According to the American Society of Photogrammetry and Remote Sensing (ASPRS) Positional Accuracy Standards for Digital Geospatial Data Version 1.0, data with vertical RMSE on the order of 0.15 m have a vertical accuracy class of 0.15 m and support Class 1 contour intervals of 0.45 m (legacy 1990 ASPRS standard) (ASPRS 2015). EM 1110-1-1005 (USACE 2007) suggests that this UAS-derived DSM is useful for General Planning and Feasibility Studies, Reconnaissance Reports, Flood Control and Multipurpose Project Planning, Flood Plain Mapping, etc. Ongoing work suggests that imagery that 1 Fischer, R. L., J. G. Ruby, A. J. Armstrong, J. D. Edwards, N. J. Spore, and K. L. Brodie. In preparation. ERDC/CHL Technical Note. Vicksburg, MS: U.S. Army Engineer Research and Development Center.

ERDC/CHL CHETN-IV-116 April 2019
8
is geo-tagged with high-accuracy GPS may result in RMSE as low as 0.1 m without GCPs, saving hours of personnel time.
COMPARISON TO AIRBORNE LIDAR: UAS-derived topography was also compared with the airborne lidar data collected by JALBTCX during its post-Irma assessment flights. The airborne lidar data were collected in October 2017 whereas the UAS data were collected in December 2017. Between these two time periods a Nor’Easter impacted the sites (Hs = 3.3 m at storm peak), and most of the lower beach at the three field sites was inundated (Figure 5, note elevation differences on lower beach).
For statistical comparisons between the JALBTCX airborne lidar and UAS surveys, data below the calculated highest water level (where true morphologic change was likely between the survey dates) for each site were removed (see Figure 4 for region where statistics were calculated for St. Augustine). The predicted total water level elevations (2% exceedance elevation of wave runup + observed water level; black dashed lines in Figure 5A-B) were calculated following the methodology in Stockdon et al. (2006) using (1) wave data from CDIP Buoy 228 located off of St. Augustine Florida; (2) observed water level at National Oceanic and Atmospheric Administration station 8721604 (near Cape Canaveral); and (3) representative beach slopes for Duval County, St. Augustine, and Ponce Inlet (calculated with a least squares linear regression to the lower beach below the berm, see Table 3).
Figure 5. Elevation transects at Duval County (A) and St. Augustine Beaches (B) from UAS (blue,
December 2017) and JALBTCX data (red, October 2017). Estimated highest water level between surveys (Table 3) are shown by the dashed black line.
Surface differences (UAS minus JALBTCX) were calculated for each site (see Figure 4B for St. Augustine data) and root-mean-squared-differences (RMSD) and bias ranged from 0.21 to 0.43 m and 0.02 to 0.30 m, respectively, among the three sites (Table 3), with positive (negative) biases indicating UAS data estimates higher elevations (lower elevations) than the JALBTCX airborne lidar data. Vertical differences between the UAS and airborne lidar data varied spatially (Figure 4B) and were of similar magnitude to the reported vertical accuracy of the airborne lidar data at the 95% confidence interval (0.196 m).

ERDC/CHL CHETN-IV-116 April 2019
9
In an attempt to independently verify both datasets, both datasets were compared to a subset of GPS check points (only including points located either on the upper beach above the total water level and on fixed structures where no change was expected). Using these overlapping subset GPS points, UAS data had lower RMSE and biases than the JALBTCX airborne lidar data at Ponce Inlet and St. Augustine whereas at Duval County, the JALBTCX airborne lidar slightly out-performed the UAS data (Table 3). Other potential sources of error in this comparison are due to much of the compared region lying west of the UAS GCPs, which were only distributed on the lower beach (compare white squares with data region, Figure 4). Without onboard RTK-GPS, the region of most accurate image-derived UAS data will be constrained to the region within the GCPs. Data collected at the 2017 Duck UAS Pilot Experiment (Bruder et al. 2018) should provide additional insight into the compared accuracies of the airborne lidar and UAS data.
Table 3. UAS and JALBTCX Comparison statistics.
Location
Beach Slope (m/m)
Total Water
Level (m)
Vertical RMSD
(m)
Vertical Bias (m)
UAS to GPS Subset Lidar to GPS Subset RMSE
(m) Bias (m) RMSE
(m) Bias (m) Duval County 0.03 2.03 0.21 0.03 0.10 0.05 0.04 -0.03 St. Augustine 0.025 1.96 0.23 0.02 0.08 0.07 0.38 -0.17 Ponce Inlet 0.015 1.85 0.42 0.30 0.01 -- 0.16 0.16
As expected, the JALBTCX airborne lidar and UAS data products differed in data coverage and density. UAS data only covered ~1.5 km alongshore whereas the airborne data provided coverage over the entire east coast of Florida. On the other hand, UAS data provided on the order of 103 points/m2 whereas the airborne lidar data provided on the order of 100 to 101 points/m2. This point density was particularly apparent at the Ponce Inlet jetty (Figure 6), where the high-resolution point cloud from the UAS (Figure 6A) provided an ability to identify individual rock positions and dimensions that could be utilized to assess structural damage (Figure 6D). The airborne lidar data could not resolve these features (Figure 6B, red circles, Figure 6D).

ERDC/CHL CHETN-IV-116 April 2019
10
Figure 6. Example elevation data from the UAS (A) and JALBTCX airborne lidar (B) and
photo-realistic elevation data from the UAS (C) over Ponce Jetty. An example cross-jetty elevation transect comparing the UAS (blue) and JALBTCX lidar data (red) is shown in D, and its location is shown in white in (A) and (B).
LOGISTICAL CONCERNS AND RECOMMENDATIONS: A number of potential Concept of Operations (CONOPs) improvements were identified during this pilot effort and are summarized below:
1. In the future, data should be collected from a platform with high-accuracy GPS (e.g., 3DR-Solo w/ RTK or eBee Plus) to eliminate the need for ground control. Complications associated with ground control included beach goers removing targets; additional survey training needed for UAS team; additional on-site personnel time (typically 2 extra hours), and difficulty in physically accessing high-risk terrain such as inlet jetty features. Also, accuracy of final products were affected by the geometry (spread) of the ground control. At a minimum, self-recording GCPs (available commerically) could be used to reduce on-site time.
2. Time to gain airspace access for non-emergency response flights (2–3 weeks) is too slow to respond to approaching storms. While the FAA has an expedited process for emergency airspace access, it is unclear whether this category includes flood-risk-management data collection. Pre-approval should be obtained for interested sites to eliminate the lead time required for flights.
3. There were a number of airspace restrictions including proximity to airports and highly populated areas that prevented flight approvals for some federal projects. Solutions include identifying alternative CONOPs (e.g., flight lines offshore of the beach to reduce flight times over people, low kinetic energy plaforms) and identifying a waiver process based on the high-value need for flood risk management data prior to or following a large coastal storm. This process could be similar to the less-restrictive language in the Army AWR required by AR 70-72 for emergency response allowing for operations over non-flight personnel (U.S. Army 2016). It is also very likely that deconfliction of the airspace will be

ERDC/CHL CHETN-IV-116 April 2019
11
an issue during post-storm recovery operations when low-flying aircraft are used to visually assess damages.
SUMMARY AND IMPLICATIONS: This CHETN summarizes an initial effort conducted with SAJ to examine the feasibility, accuracy, and advantages of using small UAS to collect aerial imagery for pre- and post-storm assessments at federal beach and navigation projects. Data were collected at three locations along Florida’s East coast (Duval County Beach, St. Augustine Beach, and Ponce Inlet) in December 2017, approximately 3 months after Hurricane Irma made landfall in Florida. UAS data were collected using an eBee fixed wing UAS and processed to provide orthophoto imagery and topographic point clouds. Data were rectified using surveyed GCPs.
UAS-derived topographic point clouds were compared with data collected by JALBTCX using the CZMIL system and independently surveyed GPS check points. Vertical RMSEs relative to common independently surveyed check points ranged from 0.01 to 0.1 m for the UAS data and from 0.04 to 0.38 m for the JALBTCX data for all three sites. Comparisons between UAS and airborne lidar data produced vertical RMSEs and biases respectively between 0.21 to 0.42 m and 0.02 to 0.30 m, within the lidar’s 95% confidence interval, with the exception of the Ponce Inlet site where the JALBTCX data were found to have a consistent 0.16 m bias. UAS data provided significantly higher-resolution point clouds when compared with airborne lidar, providing valuable data to assess coastal structures (e.g., jetty condition), though over significantly smaller study sites.
While a handful of logistical issues were identified regarding airspace approvals on populated coastlines, overall, UAS provided an excellent platform to inexpensively collect topographic data at three federal project sites. UAS should be considered a relevant tool to be used in any federal beach or navigation project monitoring plan and could provide valuable insight on project performance and vulnerability in between regional airborne lidar surveys, which are only scheduled to be collected every 5 years. In particular, USACE districts could identify high-priority sites that would receive bi-annual (at least) UAS data collections scheduled in mid-summer prior to hurricane season and late fall prior to the Nor’easter season where appropriate, to ensure data are available to accurately quantify storm impacts (e.g., volume change estimates). UAS could then be used post-storm to quantify specific impacts to those project sites in cases when JALBTCX flights are not scheduled or could be used to cost-effectively add higher resolution detail at specific locations to provide more accurate PDAs for FCCE consideration/spending.
ADDITIONAL INFORMATION: This Coastal and Hydraulics Engineering Technical Note (CHETN) was prepared as part of the USACE Flood and Coastal Systems R&D Program by Dr. Katherine L. Brodie, Nicholas J. Spore, Dr. Brittany L. Bruder, and Alexander D. Renaud, U.S. Army Engineer Research and Development Center (ERDC), Coastal and Hydraulics Laboratory (CHL), Coastal Analysis and Observations Branch (COAB), Duck, NC, and by Dr. Tyler J. Hesser, ERDC-CHL, Coastal Processes Branch, Vicksburg, MS, and by Mr. Kevin Hodgens and Mr. Victor Wilhelm, South Atlantic Division, Jacksonville District (SAJ). Questions pertaining to this CHETN may be directed to Dr. [email protected] ([email protected]) or to the USACE Flood and Coastal R&D Technical Director, Dr. Julie D. Rosati, ([email protected]).

ERDC/CHL CHETN-IV-116 April 2019
12
This ERDC/CHL CHETN-IV-116 should be cited as follows:
Brodie, K., N. Spore, B. Bruder, A. Renaud, T. Hesser, V. Wilhelm, and K. Hodgens. 2019. Post-Irma Unmanned Aircraft System (UAS) Coastal Storm Impact Surveys. ERDC/CHL CHETN-IV-116. Vicksburg, MS: U.S. Army Engineer Research and Development Center. http://dx.doi.org/10.21079/11681/32463
REFERENCES
American Society for Photogrammetry and Remote Sensing (ASPRS). 2015. New ASPRS positional accuracy standards for digital geospatial data released. Photogrammetric Engineering & Remote Sensing 81(4): 277.
Bruder, B. L., A. D. Renaud, N. J. Spore, and K. L. Brodie. 2018. Evaluation of Unmanned Aircraft Systems for Flood Risk Management: Field Experiment Conspectus. ERDC/CHL-SR-18-2. Vicksburg, MS: U.S. Army Engineer Research and Development Center.
Federal Aviation Administration (FAA). 2017. Certificates of Waiver or Authorization. Washington, DC. https://www.faa.gov/about/office_org/headquarters_offices/ato/service_units/systemops/aaim/organizations/uas/coa/
Joint Airborne Lidar Bathymetry Technical Center of Expertise. (JALBTCX). 2018. JALBTCX Acquisition Status Webserver. http://shoals.sam.usace.army.mil/
Stockdon, H. F., R. A. Holman, P. A. Howd, and A. H. Sallenger, Jr. 2006. Empirical parameterization of setup, swash, and runup. Coastal Engineering 53(7): 573–588.
U.S. Army. 2016. AR 70-62. Research, Development and Acquisition - Airworthiness of Aircraft Systems. https://armypubs.army.mil/epubs/DR_pubs/DR_a/pdf/web/r70_62_FINAL.pdf
U.S. Army Corps of Engineers (USACE). 2007. Engineering and Design: Control and Topographic Surveying. EM 1110-1-1005. https://www.publications.usace.army.mil/Portals/76 /Publications/EngineerManuals/EM_1110-1-1005.pdf
USACE. 2013. Sandy Coastal Project Performance Evaluation Study. http://www.nan.usace.army.mil/Portals/37/docs/civilworks/SandyFiles/USACE_Post-Sandy_Coastal_Projects_Performance_Evaluation_Study.pdf
33 CFR Part 203. 2012. Emergency Employment of Army and other Resources, Natural Disaster Procedures. https://www.gpo.gov/fdsys/granule/CFR-2012-title33-vol3/CFR-2012-title33-vol3-part203
33 USC § 701n (PL 84-99). Flood Control. Emergency Response to Natural Disasters. https://www.gpo.gov/fdsys/pkg/USCODE-2016-title33/pdf/USCODE-2016-title33-chap15-sec701n.pdf
NOTE: The contents of this technical note are not to be used for advertising, publication,
or promotional purposes. Citation of trade names does not constitute an official endorsement or approval of the use of such products.