erformance - cxc.harvard.educxc.harvard.edu/cal/spie/spie97_kraft.pdf · figure 2: sc hematic...
TRANSCRIPT

Performance and Calibration of theAXAF High Resolution Camera II:the Spectroscopic DetectorR. P. Kraft, J. H. Chappell, A. T. Kenter, K. Kobayashi, G. R. MeehanS. S. Murray, and M. V. ZombeckSmithsonian Astrophysical Observatory60 Garden St., MS-31Cambridge, MA 02138e-mail: [email protected]. W. Fraser, J. F. Pearson, J. E. Lees, A. N. BruntonUniversity of LeicesterLeicester LE1 7RH, United KingdomM. Barbera, A. Collura, and S. SerioInstituto e Osservatorio Astronomico G. S. Vaiana, Palermo, Italy 90134ABSTRACTThe High Resolution Camera (HRC) is one of two focal plane detector systems that will be own on theAdvanced X-ray Astrophysics Facility (AXAF). The HRC consists of two microchannel plate (MCP) detectors:one to provide large area, high position resolution imaging and timing (HRC-I), and a second (HRC-S) to providea readout for the AXAF Low Energy Transmission Gratings. Each detector is composed of a chevron pair ofCsI coated MCPs with a crossed grid charge detector and an Al/Polyimide UV/Ion shield. In this paper, wedescribe the operation, performance and calibration of the spectroscopic detector. In particular, we discuss theabsolute quantum e�ciency calibration, the point spread function of the instrument combined with the AXAFtelescope, the count rate linearity, the spatial linearity, and the internal background of the instrument. Datataken in the laboratory and at the X-ray Calibration Facility at Marshall Space Flight Center are presented.Keywords: X-rays, microchannel plates, X-ray detectors, AXAF High Resolution Camera, X-rayspectroscopy1 INTRODUCTIONThe Advanced X-ray Astrophysics Facility (AXAF) will provide high spatial and moderate spectral resolutionimaging and high resolution dispersive spectroscopy of astrophysical sources in the 0.1 to 10 keV bandpass.AXAF consists of the High Resolution Mirror Assembly (HRMA), two sets of transmission gratings, and twofocal plane detectors1 . The HRMA is composed of 4 nested, iridium coated Wolter type I mirrors, and will

capable of �1 arcsec image resolution in orbit. High resolution spectroscopy will be performed with one of twosets of transmission gratings: the Low Energy Transmission Gratings (LETG) in the 0.1 to 1 keV bandpass2,and the High Energy Transmission Gratings (HETG) in the 0.5 to 10 keV bandpass3. There are two focal planedetector systems on AXAF, the High Resolution Camera (HRC)4 and the AXAF CCD Imaging Spectrometer(ACIS)5. In this paper, we will discuss the performance and calibration of the HRC-S. In particular, we presentpreliminary results on measurements of the e�ective area, point spread function, and count rate linearity of theHRMA/HRC combination, as well as the absolute quantum e�ciency and detector uniformity measurements.The HRC is composed of two microchannel plate based X-ray detectors. One is designed for large area, highspatial and temporal resolution imaging (the HRC-I), the other (HRC-S) as a readout for the LETGs. TheHRC is an extension of the highly successful Einstein6 and ROSAT HRI7 programs, but with several signi�cantimprovements, including MCPs manufactured from low noise glass, larger MCP area, and a CsI photocathode forimproved response at low energies. The HRC was developed in a collaboration by the Smithsonian AstrophysicalObservatory (USA), the University of Leicester (UK), and the Instituto e Osservatorio Astronomico G. S. Vaiana(Italy).We have performed an extensive calibration of various sub-components of the HRC at SAO, Leicester, andPalermo8;9. The ight instrument was shipped to Marshall Space Flight Center (MSFC) in February, 1997,where the HRC was tested and calibrated with the HRMA and gratings in the X-ray Calibration Facility(XRCF). The ight instrument was then returned to SAO to make some minor electronic modi�cations andperform at �eld measurements. After returning to MSFC for thermal/vac testing, the instrument was shippedto Ball Aerospace in Boulder, Colorado for integration into the Science Instrument Module. It will then betaken to TRW in California to be integrated with the rest of the satellite. From there, the instrument will beshipped back to Kennedy Space Center and launched in September, 1998.This paper is organized as follows. The HRC-S is described in section 2. The most recent calibration datais presented in section 3. Section 4 contains a brief summary and conclusion.2 DETECTOR DESCRIPTIONThe HRC-S consists of three pairs, or segments, of microchannel plates (MCPs) in a chevron con�gurationwith Al/polyimide UV/Ion shields (UVIS)10. All three segments share a single modi�ed crossed grid chargedetector (CGCD) readout. A schematic diagram of the operation of the HRC is contained in Figure 1. Eachsegment is 30mm�100mm, and the three segments are abutted such that the detector is �300mm in length inthe LETG disperson direction, with 1.5 mm gaps between each segment. The spectral range of the LETG andHRC-S extends to 160�A, with a dispersion of 1.15�A/mm. The center segment is aligned perpendicular to theoptical axis of the telescope, while the outer two segments are tilted to more closely match the Rowland circle ofthe LETGs. The centerline of the detector is o�set from the optical axis by 4 mm so that the gaps between thesegments are not centered on the zeroth order. A schematic diagram of the arrangement of the three segmentsis contained in Figure 2.The MCPs in the HRC-S were manufactured by the Phillips Corporation of Brieve, France. They have 12.5�m diameter pores on 15 �m centers with an L=D ratio of 120:1. The pores are biased at 6 degrees in thecross-dispersion direction. The 6 degree bias maximizes the HRC QE with respect to the cone angles of the 4shells of the HRMA. The tilt in the cross-dispersion direction minimizes QE variations in the dispersion directiondue to the variation of the angle between the incident photon and the MCP pore. Decays from radio-isotopesof K and Rb were found to be the largest source of internal background in the Einstein and ROSAT HRIs. TheHRC MCPs have been manufactured from a glass virtually free of these elements. The internal background ofthe HRC-S is 0.04 cts/(cm2 s), a factor of 10 reduction over conventional MCPs. The HRC is also providedwith active and passive shielding to reduce background in the space environment. The HRC is surrounded bya tantalum shield to block hard X-rays and gamma-rays, A �ve-sided anti-coincidence shield consisting of aplastic scintillator and photomultiplier tubes vetos charged particle events. The background on orbit from all
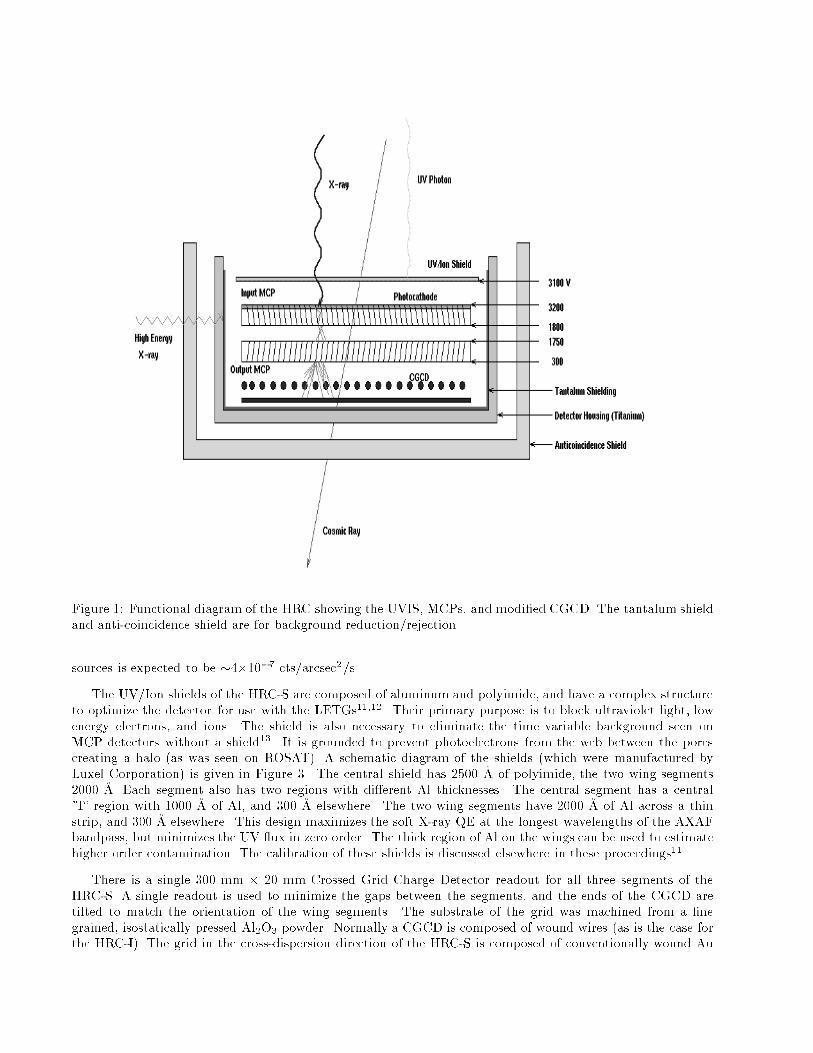
Figure 1: Functional diagram of the HRC showing the UVIS, MCPs, and modi�ed CGCD. The tantalum shieldand anti-coincidence shield are for background reduction/rejection.sources is expected to be �4�10�7 cts/arcsec2/s.The UV/Ion shields of the HRC-S are composed of aluminum and polyimide, and have a complex structureto optimize the detector for use with the LETGs11;12. Their primary purpose is to block ultraviolet light, lowenergy electrons, and ions. The shield is also necessary to eliminate the time variable background seen onMCP detectors without a shield13. It is grounded to prevent photoelectrons from the web between the porescreating a halo (as was seen on ROSAT). A schematic diagram of the shields (which were manufactured byLuxel Corporation) is given in Figure 3. The central shield has 2500 �A of polyimide, the two wing segments2000 �A. Each segment also has two regions with di�erent Al thicknesses. The central segment has a central'T' region with 1000 �A of Al, and 300 �A elsewhere. The two wing segments have 2000 �A of Al across a thinstrip, and 300 �A elsewhere. This design maximizes the soft X-ray QE at the longest wavelengths of the AXAFbandpass, but minimizes the UV ux in zero order. The thick region of Al on the wings can be used to estimatehigher order contamination. The calibration of these shields is discussed elsewhere in these proceedings11.There is a single 300 mm � 20 mm Crossed Grid Charge Detector readout for all three segments of theHRC-S. A single readout is used to minimize the gaps between the segments, and the ends of the CGCD aretilted to match the orientation of the wing segments. The substrate of the grid was machined from a �negrained, isostatically pressed Al2O3 powder. Normally a CGCD is composed of wound wires (as is the case forthe HRC-I). The grid in the cross-dispersion direction of the HRC-S is composed of conventionally wound Au

Figure 2: Schematic diagram of the layout of the three segments of the HRC-S. Note the tilt of the two wingsegments relative to the center segment.alloy wires. This is not practical along the long and tilted dispersion direction, however. As an alternative,electroplated Au strips (190 �m wide on 200 �m centers) were deposited along the dispersion direction. Thereis no di�erence in grid performance of the HRC-S and HRC-I.Every wound wire or Au strip is tied together by a resistor (10 k for the wires, 30 k for the strips), andevery eighth wire/strip (called a tap) is attached to a charge sensitive preampli�er for position determination.The CGCD contains 16�192 taps for the HRC-S. In order to make the HRC-S and HRC-I readouts redundant(the HRC-I has 64�64 taps) a multiplexing readout scheme is used, and every 64th tap along the dispersionaxis is connected together. There is then a threefold degeneracy along the dispersion direction in the positionof any event. This degeneracy is removed by determining which segment the event originated in by reading asignal from the bottom electrode of each of the three segments. In previous missions, the position of an eventwas determined by centroiding the charge over all preampli�ers along an axis (16 per axis on the ROSAT HRI).The cumulative noise from 64 preampli�ers would seriously degrade the position resolution of the detector. Asan alternative, each event is centroided using the three taps with the largest signal on each axis14. The temporalresolution of the readout and associated electronics is 16 microseconds.The HRC-S has little intrinsic energy resolution, and order sorting in astrophysical spectra will thereforebe a complex problem. In an e�ort to overcome this, a Two Facet Re ection Filter (TFRF) was added to theoriginal HRC-S design. The TFRF is a Cr/C coated mirror that can be inserted along the dispersion axis.Above the Cr L/C K edges, the re ectivity of the mirror is low, and it can be used to suppress the higherorders. It is estimated that the TFRF can provide an order of magnitude or more suppression of higher orders.There is a gap in the TFRF along the center of the center segment so that all high energy photons in zerothor �rst order will not be re ected by the �lter. The two facets are necessary to accomodate the spread of theHRMA cone angles. The TFRF is described in more detail elsewhere10;15.

Figure 3: Schematic diagram of HRC UVIS and layout of the instrument.3 CALIBRATION OF THE FLIGHT INSTRUMENTA comprehensive calibration of the HRC was planned after careful consideration of the scienti�c goalsof the mission8;9. The parameters of the HRC-S that must be calibrated to a high precision to meet thesegoals are the absolute quantum e�ciency, gain, background, spatial uniformity, the spatial resolution andthe count rate linearity. Our calibration plan can be divided into three distinct components: pre-deliverysubassembly and full ight instrument laboratory calibration, XRCF calibration with the HRMA (and gratings),and synchrotron measurements of the quantum e�ciency of CsI coated MCPs over the 0.1 to 10 keV bandpass atthe Daresbury Synchrotron Radiation Source. Our plan was to perform extensive at �eld measurements of the ight instrument at SAO at several discrete energies and angles of incidence before delivery to the XRCF. Thesynchrotron measurements provides the absolute QE of the instrument between the discrete energies measuredin the lab and the detailed edge structure in the photocathode. At XRCF, we would measure/con�rm the QEand spatial uniformity at a few points, and measure the point spread function and count rate linearity with theHRMA. We would also measure the QE and energy resolution of the HRMA/LETG/HRC-S combination at theXRCF.Because of scheduling constraints, only part of this laboratory calibration was carried out before deliveryto Marshall Space Flight Center. At the XRCF calibration, two problems with the ight instrument werediscovered. First, the MCP gain was larger than expected. The reason for this is unknown. The gain of the
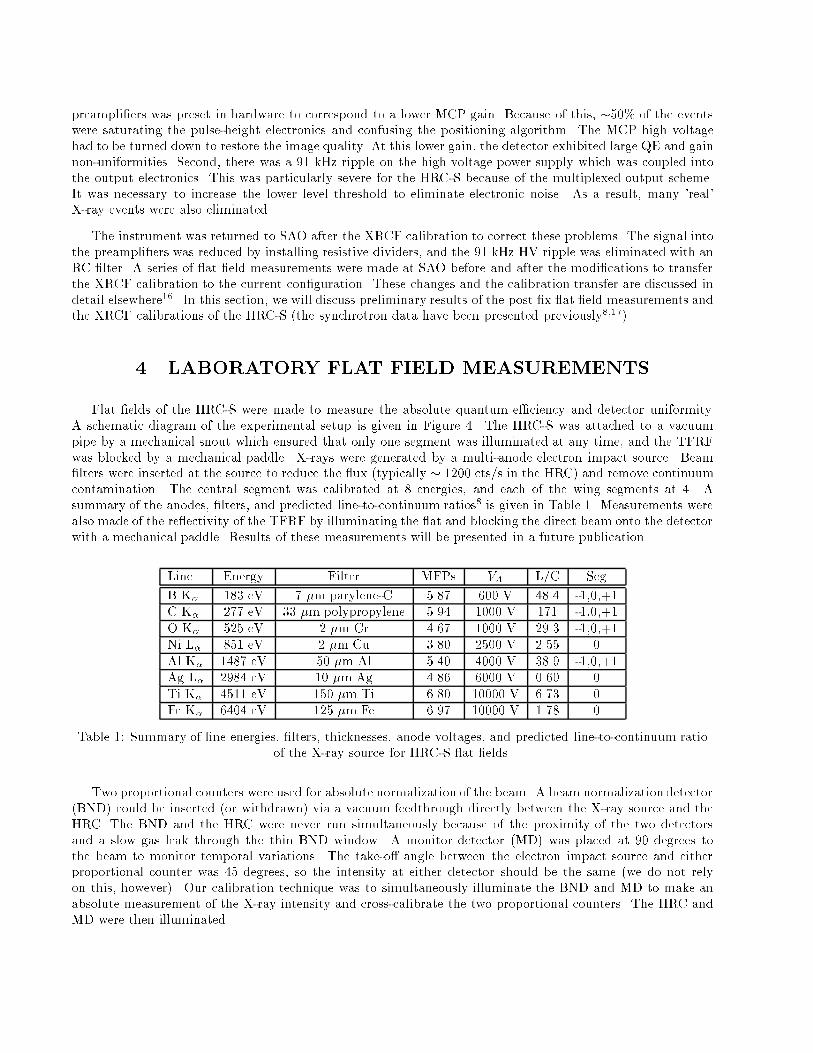
preampli�ers was preset in hardware to correspond to a lower MCP gain. Because of this, �50% of the eventswere saturating the pulse-height electronics and confusing the positioning algorithm. The MCP high voltagehad to be turned down to restore the image quality. At this lower gain, the detector exhibited large QE and gainnon-uniformities. Second, there was a 91 kHz ripple on the high voltage power supply which was coupled intothe output electronics. This was particularly severe for the HRC-S because of the multiplexed output scheme.It was necessary to increase the lower level threshold to eliminate electronic noise. As a result, many 'real'X-ray events were also eliminated.The instrument was returned to SAO after the XRCF calibration to correct these problems. The signal intothe preampli�ers was reduced by installing resistive dividers, and the 91 kHz HV ripple was eliminated with anRC �lter. A series of at �eld measurements were made at SAO before and after the modi�cations to transferthe XRCF calibration to the current con�guration. These changes and the calibration transfer are discussed indetail elsewhere16. In this section, we will discuss preliminary results of the post �x at �eld measurements andthe XRCF calibrations of the HRC-S (the synchrotron data have been presented previously8;17).4 LABORATORY FLAT FIELD MEASUREMENTSFlat �elds of the HRC-S were made to measure the absolute quantum e�ciency and detector uniformity.A schematic diagram of the experimental setup is given in Figure 4. The HRC-S was attached to a vacuumpipe by a mechanical snout which ensured that only one segment was illuminated at any time, and the TFRFwas blocked by a mechanical paddle. X-rays were generated by a multi-anode electron impact source. Beam�lters were inserted at the source to reduce the ux (typically � 1200 cts/s in the HRC) and remove continuumcontamination. The central segment was calibrated at 8 energies, and each of the wing segments at 4. Asummary of the anodes, �lters, and predicted line-to-continuum ratios8 is given in Table 1. Measurements werealso made of the re ectivity of the TFRF by illuminating the at and blocking the direct beam onto the detectorwith a mechanical paddle. Results of these measurements will be presented in a future publication.Line Energy Filter MFPs VA L/C SegB K� 183 eV 7 �m parylene-C 5.87 600 V 48.4 -1,0,+1C K� 277 eV 33 �m polypropylene 5.94 1000 V 171 -1,0,+1O K� 525 eV 2 �m Cr 4.67 1000 V 29.3 -1,0,+1Ni L� 851 eV 2 �m Cu 3.80 2500 V 2.55 0Al K� 1487 eV 50 �m Al 5.40 4000 V 38.9 -1,0,+1Ag L� 2984 eV 10 �m Ag 4.86 6000 V 0.60 0Ti K� 4511 eV 150 �m Ti 6.80 10000 V 6.73 0Fe K� 6404 eV 125 �m Fe 6.97 10000 V 1.78 0Table 1: Summary of line energies, �lters, thicknesses, anode voltages, and predicted line-to-continuum ratioof the X-ray source for HRC-S at �elds.Two proportional counters were used for absolute normalization of the beam. A beam normalization detector(BND) could be inserted (or withdrawn) via a vacuum feedthrough directly between the X-ray source and theHRC. The BND and the HRC were never run simultaneously because of the proximity of the two detectorsand a slow gas leak through the thin BND window. A monitor detector (MD) was placed at 90 degrees tothe beam to monitor temporal variations. The take-o� angle between the electron impact source and eitherproportional counter was 45 degrees, so the intensity at either detector should be the same (we do not relyon this, however). Our calibration technique was to simultaneously illuminate the BND and MD to make anabsolute measurement of the X-ray intensity and cross-calibrate the two proportional counters. The HRC andMD were then illuminated.

Top View
MD
BND
XraySource
HRC
Xray Source
Manson model 5
667 cm
MD - " Monitor Detector"
BND - " Beam Normalization Detector"
of source end:
Manson model 04 flow proportional counter
Manson model 04 flow proportional counter
Figure4:SchematicdiagramofexperimentalsetupforHRC at�eldmeasurements.

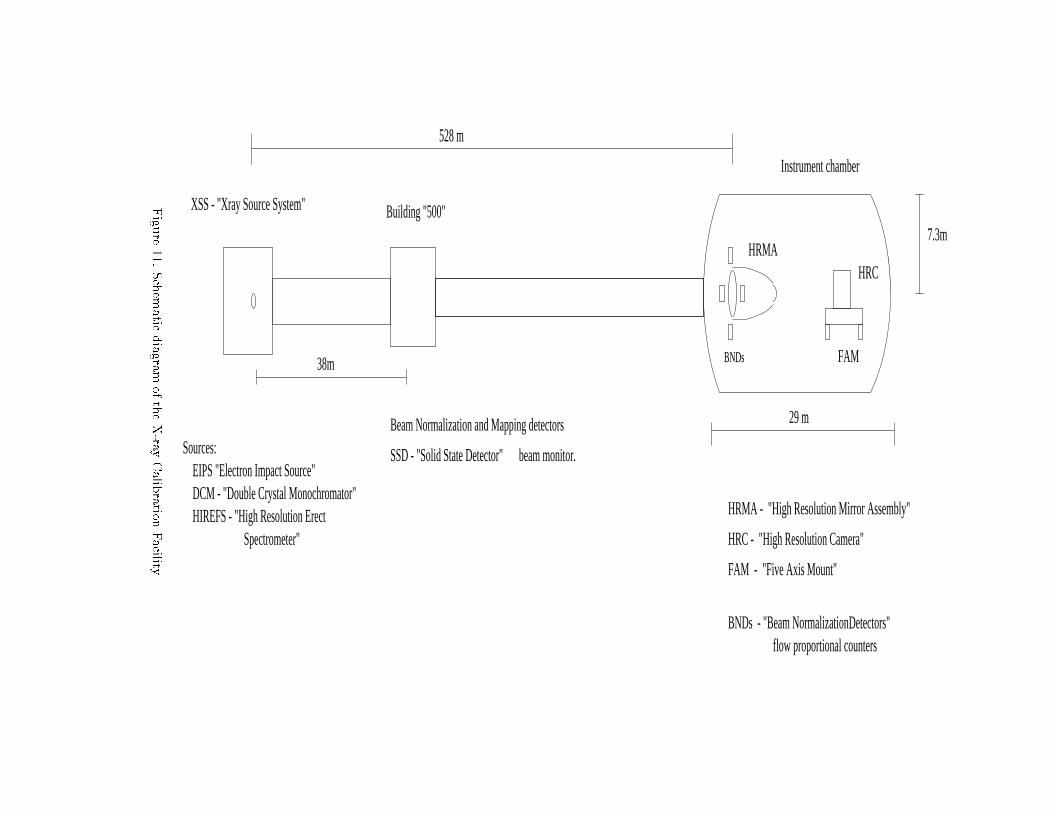
Surface plots and projections of the at �elds at Al K� for segments 0, -1, and +1 are shown in Figures 5,6, and 7, respectively. The at �elds are similar at other energies (excepting for the UVIS structure at lowenergies). There is a small (�10%) gradient in the QE across the dispersion direction of all three segments. Thisgradient is present at all energies. We are investigating the possibility that there is some spatial non-uniformityof the X-ray beam in our experimental setup. Such a non-uniformity has not been seen in thousands of hoursof previous use of the facility, however. This structure is not mimicked in the HRC-I (which was measured withthe identical setup). Additionally, segment +1 has a region of slightly lower gain and QE.The absolute QE of a given region of the detector is given byQHRC = RHRCIHRCHRC ;where RHRC is the rate (cts/s) in the HRC, IHRC is the x-ray intensity (phot/s sr) at the HRC, and HRC isthe solid angle subtended by the region. The absolute intensity, IHRC , is determined from the BND and MDrates, and is given by IHRC = RCCBNDQBNDBND � RMDRCCMD ;where RCCBND and RCCMD are the BND and MD rates measured in the cross-calibration, QBND is the calculatedBND quantum e�ciency, BND is the solid angle subtended by the BND, and RMD is the MD rate during theHRC integration. The absolute QE of various regions within each of the three segments is shown in Figures 8,9, and 10. Systematic errors will dominate these QE measurements (the statistical errorbars are smaller thanthe data points). The largest sources of systematic uncertainty are the QE of the BND and the spectral purityof the source. The derived MCP QE's (dividing out the transmission of the UVIS) are slightly lower (�10%)than our screening measurements made using laboratory electronics, and slightly lower (�10%) than the HRC-IQE's at the lowest energy. 5 XRCF CALIBRATIONThe HRC-S was tested and calibrated in the spring of 1997 with the HRMA and gratings at the X-rayCalibration Facility (XRCF) at Marshall Space Flight Center18. This facility was designed to meet the unprece-dented level of calibration required for AXAF. A schematic diagram of the XRCF is contained in Figure 11. TheXRCF consists of three buildings and a long (518 m) vacuum pipe. One building houses three X-ray sources. Asecond contains two beam monitor detectors (a gas ow proportional counter and a solid state detector). Theproportional counter is mounted on a stage to map out the X-ray beam across the HRMA. The third buildingcontains the instrument chamber and control rooms. The telescope, gratings, and detectors were mounted in theinstrument chamber for testing. Four proportional counters (the BND-H counters) were placed symmetricallyaround the front of the HRMA to continuously monitor the X-ray ux and beam uniformity at the telescope.Four di�erent X-ray sources/monochromators were used to generate X-rays over the AXAF bandpass. Anelectron impact source (EIPS) was used to generate characteristic lines from a variety of anodes (26 di�erentanodes were available). Each anode also had �lters that could be used to reduce the ux to acceptable levelsand reduce continuum (bremsstrahlung) contamination. A gold coated re ection grating (HIREFS) and a Wrotating anode source were used to generate monochromatic X-rays between 200 eV and 2000 eV. Higher ordercontamination and beam non-uniformity (up to a factor of 2 across the HRMA) make interpretation of thisdata di�cult. Four di�erent double crystal monochromators (DCM) were available to provide spectrally pureX-rays above 1.5 keV (in conjunction with the W rotating anode source). The beam uniformity of this sourcewas good (about 10% across the HRMA), and higher orders contributed only a few percent of the ux. A gasdischarge Penning source was used to generate soft X-ray and EUV lines from ionized Ar and Al.XRCF measurements were made of the e�ective area (with and without the LETG), the count rate linearity,the point spread function, and the energy resolution of the HRC-S/HRMA and HRC-S/LETG/HRMA combi-nations. Over 1000 di�erent measurements were made using the HRC-I or HRC-S. In this section, we present
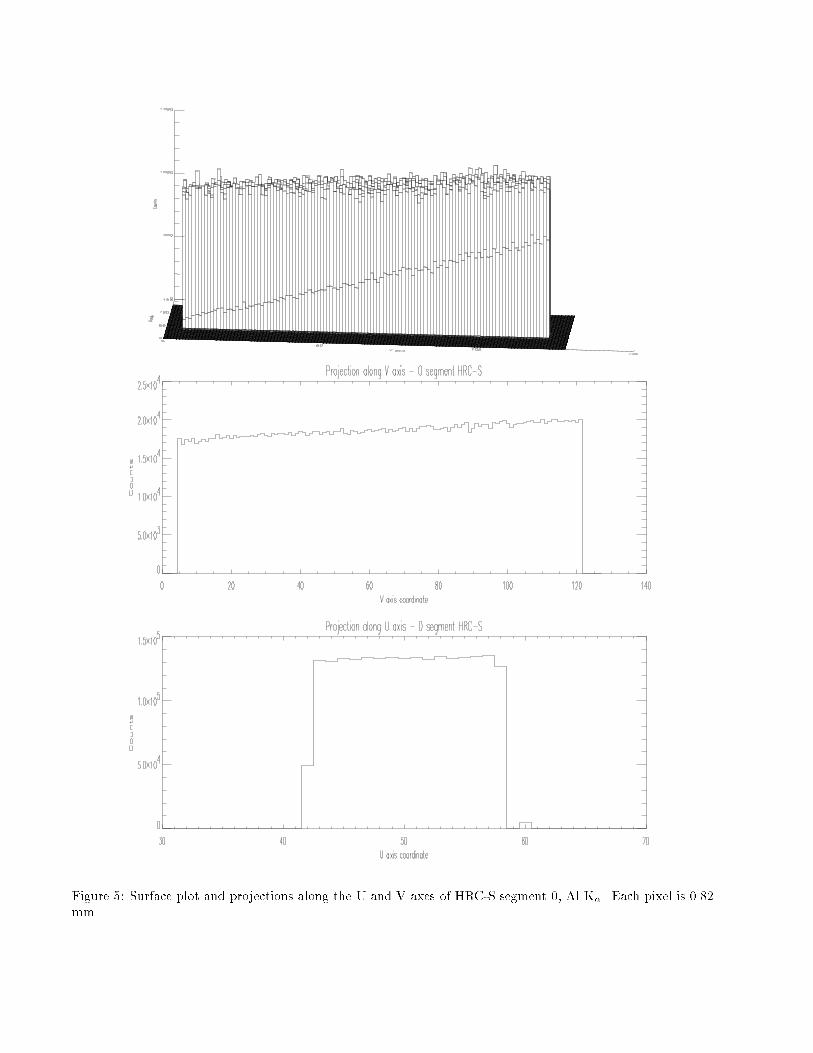
Figure 5: Surface plot and projections along the U and V axes of HRC-S segment 0, Al K�. Each pixel is 0.82mm.
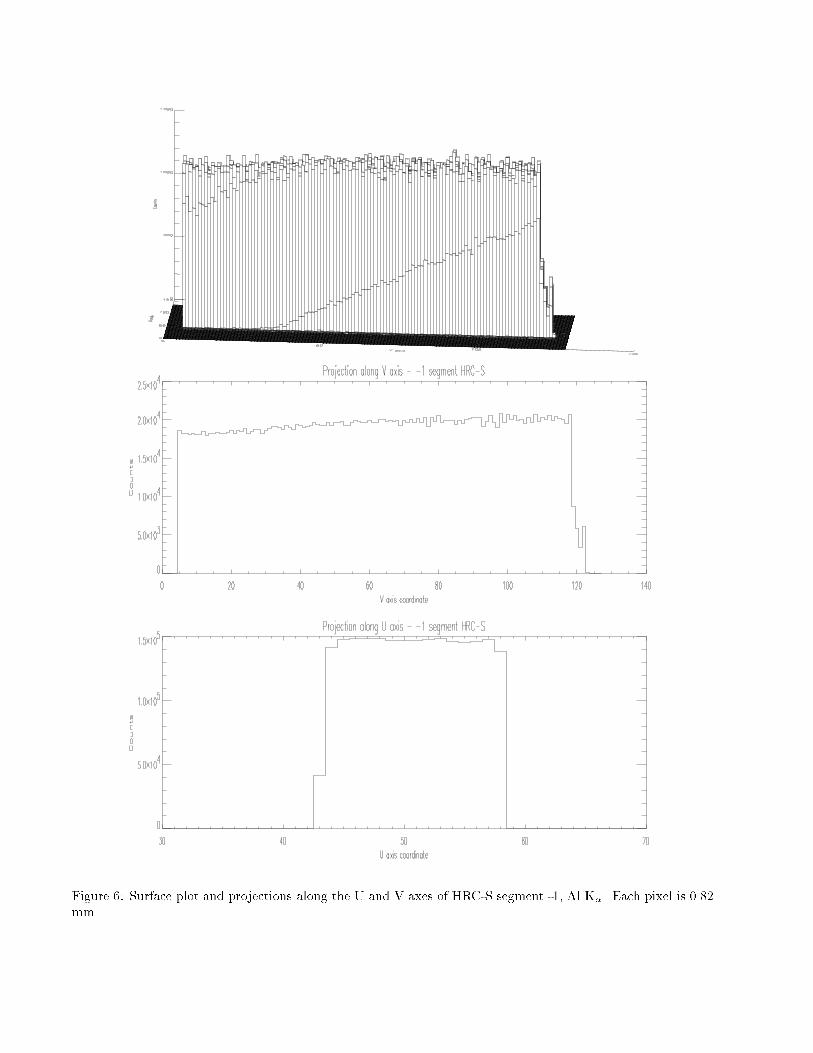
Figure 6: Surface plot and projections along the U and V axes of HRC-S segment -1, Al K�. Each pixel is 0.82mm.

Figure 7: Surface plot and projections along U and V axis of HRC-S segment +1, Al K�. Each pixel is 0.82mm.

100 500 1000 50000
0.05
0.1
0.15
0.2
0.25
0.3
Energy (eV)
HRC-S Absolute Quantum Efficiency (Seg 0)
Figure 8: Absolute QE of HRC-S segment 0. The di�erent symbols represent di�erent regions of the detector:the cross is a central region under the thick Al, the open triangle and the open square are regions under thethin Al to the left (lower V coordinate) and right (higher V coordinate) of the central T region. The stars arethe HRC-S QE derived from the XRCF data.preliminary results from calibrations of the HRC-S/HRMA, and brie y discuss the HRC-S/LETG/HRMA cal-ibrations. Measurements of the position (relative to the HRC-S and HRMA) and re ectivity of the TFRF werealso made, and will be discussed in a future publication.5.1 E�ective AreaWe have made e�ective area measurements with the LETG+HRC-S and with the HRC-S alone at various ener-gies and angles of incidence. The e�ective area was measured by simultaneously illuminating the HRMA/HRC-Sand the four BND-H proportional counters with X-rays from the EIPS, DCM, or HIREFS. The telescope wasdefocused for all e�ective area measurements to avoid extracting a large amount of charge from a small region.As above, the BNDs are used as absolute detectors. The e�ective area of the HRMA/HRC-S combination fordata taken using the EIPS or DCM sources is then given byA(E)EFF = RHRCS � Q(E)BNDABND�RBND � d2HRMAd2BND ;where A(E)EFF is the e�ective area of the HRMA/HRC-S at energy E, RHRCS is the rate (cts/s) in the HRC-S,Q(E)BND is the calculated quantum e�ciency of the BND, ABND is the geometric area of the BNDs, �RBNDis the average rate in the four BNDs, and dHRMA and dBND are the distances between the source and HRMAor BND, respectively. We have assumed that the four BNDs are identical. The BND-H rates are computed bytaking a region of interest around the main (and escape) peak, and subtracting and appropriate background. Aplot of the e�ective area on axis is contained in Figure 12. The errorbars in the plot are statistical only. Notethe complex structure around the Cs and I L edges at �5 keV. This structure is similar to that seen in thedetailed synchrotron calibrations around these edges17. The e�ective area of the HRC-I at the same energies

100 200 400 600 800 1000 20000
0.05
0.1
0.15
0.2
0.25
0.3
Energy (eV)
HRC-S Absolute Quantum Efficiency (Seg -1)
Figure 9: Absolute QE of HRC-S segment -1. The di�erent symbols represent di�erent regions of the detector:the open square is a region across the top under the thick Al, the cross and the open triangle are left (lower Vcoordinate) and right (higher V coordinate) regions under the thin Al.100 200 400 600 800 1000 20000
0.05
0.1
0.15
0.2
0.25
0.3
Energy (eV)
HRC-S Absolute Quantum Efficiency (Seg +1)
Figure 10: Absolute QE of HRC-S segment +1. The di�erent symbols represent di�erent regions of the detector:the open square is a region across the top under the thick Al, the cross and the open triangle are left (lower Vcoordinate) and right (higher V coordinate) regions under the thin Al.
HIREFS - "High Resolution Erect Spectrometer"
Sources:
DCM - "Double Crystal Monochromator" EIPS "Electron Impact Source"
528 m
HRC
FAM
7.3m
HRMA - "High Resolution Mirror Assembly"
HRC - "High Resolution Camera"
FAM - "Five Axis Mount"
XSS - "Xray Source System" Building "500"
HRMA
BNDs - "Beam NormalizationDetectors"flow proportional counters
BNDs
Beam Normalization and Mapping detectors
SSD - "Solid State Detector" beam monitor.
29 m
38m
Instrument chamberFigure11:SchematicdiagramoftheX-rayCalibrationFacility.

has also been plotted. Note the large di�erence between the detector response. This di�erence has been largelycorrected by making a few electrical changes (see above).0 2 4 6 8 10
0
50
100
150
200
Energy (keV)
HRC-S Effective area (On axis)
Figure 12: E�ective area of the HRMA/HRC-S on axisIn the above analysis, we have assumed that the X-ray beam is nearly monochromatic and spatially uniform(or at least well described by the average of the rates in the four BND-H detectors). This is a good approximationfor the DCM data and the EIPS data (C, B, and Be anodes) that we have included in the plot. Neither ofthese are good assumptions for the HIREFS data, however, and unfortunately the HIREFS source covers themost astrophysically interesting region of the LETG/HRC-S bandpass. Below 1 keV, higher orders contributesigni�cantly (or dominate) the source spectrum. A BND pulse height spectrum at 392 eV is shown in Figure 13.At least 4 orders are present in this spectrum (the re ectivity of the grating is small above � 2 keV becauseof the gold coating), and disentangling them in the HRC-S images requires spectral �tting of the BND pulseheight data (via non-linear regression)19, and measurements of the HRC-S QE at all higher orders. An LETGmeasurement was made at every HIREFS setting to help us to understand the underlying spectrum, but orderseparation is still a complex issue.5.2 HRC-S + LETG performanceA series of e�ective area measurements were also made with the HRC-S and LETG. As a typical example, theHRC-S + LETG spectrum of the EIPS with the Ti anode and Ti �lter is shown in Figure 14. The Ti L� andL� lines can clearly be seen, as well as continuum and C K� contamination. The width of the Ti L� line (27.4�A) is in this spectrum is �0.72 �A(11.9 eV), and is the intrinsic width of the line. The resolution of the gratingis much higher (more than 1000 at the longest wavelengths). A more detailed discussion of the LETG e�ectivearea and energy resolution measurements is given elsewhere20;21.

500 1000 1500 2000 2500
-5
0
5
10
15
Energy (eV)
114368_3.bin
Figure 13: One BND-H spectrum of the HIREFS source (points) and best �t spectral model (histogram).-50 -40 -30 -20 -10 0 10 20 30 40 501
5
10
50
100
500
1000
LETG/HRC-S spectrum from Ti anode
Figure 14: LETG/HRC-S spectrum of Ti anode with Ti �lter. This plot is a projection of the HRC-S imagealong the dispersion direction.5.3 Count Rate LinearityMicrochannel plates typically show considerable count rate non-linearities at high uxes because of local chargeextraction. The MCP has a �nite recharge time after an event occurs, and if the rate is large enough, the local

gain can drop so that events are lost below the lower level discriminator. The HRC-S count rate linearity (CRL)was determined simply by measuring the detector rate versus the BND-H rate as the source ux was stepped up.The BND-H rate is proportional to the incident ux, and should be linear to at least a few thousand counts persecond. The telescope was in focus, and illuminated a region near the edge of the detector to avoid extractinga large amount of charge from a central region. A plot of the HRC-S rate versus one of the BND-H rates isshown in Figure 15 (both rates have been background subtracted). As can be seen from the �gure, there is somemarginal evidence for non-linearity at about 15 cts/s. We have made linear �ts to this data, and the statisticalsigni�cance of this is low. We conclude that HRC-S is approximately linear at rates of 30 cts/s or less.0 2 4 6 8
0
10
20
30
BND rate (cts/s)
HRC-S Count Rate Linearity (277 eV)
Figure 15: Count rate linearity of the HRC-S at 277 eV. The solid line is the best �t line if the �t is forcedthrough the origin. The dashed line is the best �t line if the �t is not forced through the origin.5.4 Point Spread FunctionThe point spread function (PSF) of the HRMA+HRC-S was measured at several energies at the XRCF. Thetelescope was in focus, and the HRC-S was moved in a serpentine pattern to avoid a large amount of charge frombeing extracted from a small region. We are working to remove the e�ect of this serpentine motion on the images.As a preliminary analysis, we have used data from the count rate linearity measurements described above toestimate the PSF. These measurements were made with the telescope in focus and the detector undithered. Asurface plot of the sum of the images taken for the CRL measurements described above (E=277 eV) is containedin Figure 16. Gaussians were �t to slices of the data along the U and V axes. The width (FWHM) of the PSFin the central 135 �m of the image is 42.95 �m in the U axis and 45.85 �m in the V axis (approximately 1arcsec angular resolution). These data slices and best �t Gaussians for each axis are plotted in Figure 17. Asan alternative, the encircled energy as a function of radius is plotted in Figure 18. The half power radius is25.72 �m.

Figure 16: Point spread function of the HRC-S and HRMA6 UV/OPTICAL SENSITIVITY MEASUREMENTSWe have measured the optical and UV sensitivity of the HRC-S wing segments. These segments have thethinnest Al and polyimide, and will therefore have the largest UV/optical sensitivity. The UV sensitivity wasmeasured using a �ltered mercury lamp (2537 �A), and the optical response with a �ltered tungsten-halogenlamp (4500 �A). The absolute intensities of these lamps were measured to within 10% using a NIST calibratedphotodiode. A model of the predicted HRC-S UV/optical response (UVIS transmission times CsI coated MCPresponse) is contained in Figure 19. The UVIS transmission was determined from a combination of laboratorymeasurements and a calculation using published optical constants. The CsI coated MCP response was estimatedusing previously published results. Also plotted is the maximum acceptable (HRC speci�cation) UV/opticalsensitivity of the ight instrument. Note that the y axis of the plot covers 10 decades in response. Theuncertainties in these models are fairly large. As can be seen from Figure 19, the measured 2537 �Asensitivityagrees surprisingly well with the prediction. The optical measurement only provided an upper limit that isorders of magnitude below the prediction. The modeled optical sensitivity of the CsI MCP depends heavily onone previous (unpublished) measurement made at SAO. The bandgap of CsI is �6.2 eV (2000 �A), and it wouldbe reasonable to expect that the sensitivity drops rapidly beyond this wavelength. We will continue to studythis issue by measuring the UV/optical sensitivity of backup HRC MCPs and UVISs.

-10 -5 0 5 100
50
100
150
Channel
HRC-S PSF along U axis
-10 -5 0 5 100
50
100
150
Channel
HRC-S PSF along V axis
Figure 17: Best �t Gaussians to slices of the PSF along the U and V axes.0 10 20 30
0
0.2
0.4
0.6
0.8
1
Radius (pixels)Figure 18: Encircled energy versus radius of the HRC-S/HRMA in focus at 277 eV.

0 1000 2000 3000 4000 5000
0.0001
0.001
HRC Specification
Figure 19: The calculated UV/optical QE of the wing segments of the HRC-S (the thin solid line) versuswavelength. The dashed line is the predicted QE for the nominal UVIS thickness plus the 2 sigma uncertainty.The measured values at 2537 �Aand 4500 �A(an upper limit only) are also plotted. The dark solid line is themaximum UV/optical sensitivity speci�cation. Note the logarithmic scale of the Quantum E�ciency axis.7 SUMMARY AND CONCLUSIONWe have presented preliminary results of the HRC-S calibration at XRCF, including the e�ective area, countrate linearity, and point spread function. The imaging performance of the HRC-S/HRMA is �1 arcsec. Themeasured detector QE at XRCF was found to be considerably lower than subassembly measurements madepreviously at SAO. Electronic modi�cations were made to the detector after the XRCF calibrations to restorethe QE. Because of these changes, prediction of the on orbit e�ective area based on the XRCF calibrations will becomplex. Flat �eld measurements that span the AXAF bandpass were made before and after the modi�cations,so that the XRCF calibrations can be transferred to the new ight con�guration. The imaging capability of thedetector was not changed by these modi�cations.8 ACKNOWLEDGEMENTSWe are grateful for the support of Jack Gomes, Gerry Austin, John Polizotti, Richard Goddard, Frank DeFreze,Joseph D'Arco, Desi Hamvaz, and Frank Rivera. This work has been supported by NASA contract NAS8-38248.

9 REFERENCES1. M. C. Weisskopf, S. L. O'Dell, R. F. Elsner, and L. P. Van Speybroeck, X-ray and Extreme UltravioletOptics, R. B. Hoover and A. B. C. Walker, Jr., eds., Proc. SPIE 2515, 1995.2. A. C. Brinkman, J. J. van Rooijen, J. A. M. Bleeker, J. H. Dijkstra, J. Heise, P. A. J. de Korte, R. Mewe,and F. Paerels, Astro. Lett. and Commun., 26, 1987.3. C. R. Canizares, et al., Astro. Lett. and Commun., 26, 1987.4. S. S. Murray, et al., Astro. Lett. and Commun., 26, 1987.5. J. A. Nousek, et al., Astro. Lett. and Commun., 26, 1987.6. R. Giaconni et al., Astrophysical Journal, 230, 1979.7. M. V. Zombeck, L. P. David, F. R. Harnden, Jr., and K. Kearns, EUV, X-Ray, and Gamma-Ray Instru-mentation for Astronomy VI, O. H. W. Siegmund and J. V. Vallerga, eds., Proc. SPIE 2518, 1995.8. R. P. Kraft, et al., EUV, X-Ray, and Gamma-Ray Instrumentation for Astronomy VII, O. H.W. Siegmundand M. A. Gummin, eds., Proc. SPIE 2808, 1996.9. K. A. Flanagan, M. Barbera, S. Murray, and M. Zombeck, EUV, X-Ray and Gamma-Ray Instrumentationfor Astronomy V, O. H. W. Siegmund and J. V. Vallerga, eds., Proc. SPIE 2280, 1995.10. A. T. Kenter, J. H. Chappell, R. P. Kraft, G. R. Meehan, S. S. Murray, and M. V. Zombeck, EUV, X-Ray,and Gamma-Ray Instrumentation for Astronomy VII, O. H. W. Siegmund and M. A. Gummin, eds., Proc.SPIE 2808, 1996.11. G. R. Meehan, S. S. Murray, M. V. Zombeck, R. P. Kraft, K. Kobayashi, J. H. Chappell, A. T. Kenter,M. Barbera, A. Collura, and S. Serio, these proceedings.12. G. R. Meehan, A. T. Kenter, R. P. Kraft, S. S. Murray, M. V. Zombeck, K. Kobayashi, J. H. Chappell,M. Barbera, and A. Collura, EUV, X-Ray and Gamma-Ray Instrumentation for Astronomy VII, O. H.W. Siegmund and M. A. Gummin, eds., Proc. SPIE 2808, 1996.13. J. H. Chappell, R. K. Martin, S. S. Murray, and M. V. Zombeck, X-ray and Gamma-Ray Instrumentationfor Astronomy, Proc. SPIE 1344, 1990.14. J. H. Chappell, and S. S. Murray, X-Ray Instrumentation in Astronomy and Atomic Physics, Proc. SPIE1159, 1989.15. J. J. Drake, SAO Internal Memo, 1997.16. S. S. Murray, et al., EUV, X-Ray, and Gamma-Ray Instrumentation in Astronomy, VIII, O. H. W.Siegmund and M. A. Gummin, eds., Proc. SPIE, 3114, 1997.17. S. E. Pearce, J. E. Lees, J. F. Pearson, G. W. Fraser, A. N. Brunton, K. A. Flanagan, A. T. Kenter, M.Barbera, V. Dhanak, A. Robinson, and D. Teehan, EUV, X-Ray, and Gamma-Ray Instrumentation inAstronomy VI, O. H. W. Siegmund and J. V. Vallerga, eds., Proc. SPIE 2518, 1995.18. J. J. Kolodziejczak, R. A. Austin, R. F. Elsner, M. K. Joy, M. Sulkanen, E. M. Kellogg, and B. J. Wargelin,X-Ray and Extreme Ultraviolet Optics R. B. Hoover and A. B. Walker, eds., Proc SPIE 2515, 1995.19. E. Y. Tsiang, R. J. Edgar, A. Tennant, S. A. Vitek, and E. M. Kellogg, Grazing Incidence and MultilayerX-ray Optical Systems, R. B. Hoover and A. B. C. Walker, eds., Proc SPIE, 3113, 1997.20. P. Predehl, et al., Grazing Incidence and Multilayer X-ray Optical Systems, R. B. Hoover and A. B. C.Walker, eds., Proc. SPIE 3113, 1997.21. A. C. Brinkman, et al., Grazing Incidence and Multilayer X-ray Optical Systems, R. B. Hoover and A. B.C. Walker, eds., Proc. SPIE 3113, 1997.