ergon energy's building block components · regulatory proposal. it provides detailed...
TRANSCRIPT

03.01.01 Ergon Energy’s Building Block Components
03.01.01 – Ergon Energy’s Building Block Components 1
Contents 1 Introduction .............................................................................................................................. 3
1.1 Overview ........................................................................................................................... 3
1.2 Purpose of this document ................................................................................................. 3
1.3 NER requirements ............................................................................................................ 4
1.4 Structure of this document ................................................................................................ 5
2 Regulatory Asset Base ............................................................................................................ 7
2.1 Roll forward of the RAB in the regulatory control period 2010-15 ...................................... 7
2.1.1 Opening RAB as at 1 July 2010 ................................................................................. 8
2.1.2 Capital expenditure during the current regulatory control period ................................ 9
2.1.3 Regulatory depreciation ........................................................................................... 12
2.1.4 Adjustment to recognise the difference between actual and forecast net capital expenditure in 2009-10 .......................................................................................................... 12
2.1.5 Adjustments to recognise changes in service classifications that occur on 1 July 2015 ................................................................................................................................ 13
2.2 Roll forward of the RAB in the regulatory control period 2015-20 .................................... 15
2.2.1 Capital expenditure .................................................................................................. 16
2.2.2 Regulatory depreciation ........................................................................................... 17
2.3 Roll forward of the tax asset base in the regulatory control period 2010-15 .................... 17
2.3.1 Opening tax asset base as at 1 July 2010................................................................ 18
2.3.2 Capital expenditure during the current regulatory control period .............................. 19
2.3.3 Tax depreciation ...................................................................................................... 19
2.3.4 Adjustments to recognise changes in service classifications that occur on 1 July 2015 ................................................................................................................................ 20
3 Return on capital .................................................................................................................... 21
4 Return of Capital (Depreciation) ............................................................................................. 22
4.1 Straight Line Depreciation ............................................................................................... 23
4.2 Asset lives ...................................................................................................................... 25
4.2.1 Standard Lives ......................................................................................................... 25
4.2.2 Remaining Lives ...................................................................................................... 25
4.2.3 Tax Standard Lives .................................................................................................. 26
4.2.4 Tax Remaining Lives ............................................................................................... 26
4.3 Indexation ....................................................................................................................... 26
5 Operating expenditure ........................................................................................................... 28
5.1 Network Operating and Maintenance costs and Other O&M costs .................................. 28

03.01.01 – Ergon Energy’s Building Block Components 2
5.2 Debt raising costs ........................................................................................................... 28
5.3 Carryover amounts ......................................................................................................... 29
6 Corporate income tax ............................................................................................................. 30
6.1 Departures ...................................................................................................................... 31
6.1.1 Recovery of tax payable on contributed and gifted assets received from large customer connections in 2015-20 .......................................................................................... 32
7 Revenue increments/decrements ........................................................................................... 33
7.1 Incentive schemes .......................................................................................................... 34
7.1.1 Efficiency Benefit Sharing Scheme .......................................................................... 35
7.1.2 Service Target Performance Incentive Scheme (STPIS) .......................................... 36
7.1.3 Demand Management Incentive Scheme ................................................................ 37
7.1.4 Capital Expenditure Sharing Scheme ...................................................................... 38
7.1.5 Small scale Incentive Scheme ................................................................................. 38
7.2 Adjustments from the application of the control mechanisms in the current regulatory control period ............................................................................................................................ 38
7.2.1 Clearing the 2013-14 DUOS under-recovery ........................................................... 38
7.2.2 Clearing the residual DUOS unders and overs account balance .............................. 39
7.2.3 DUOS unders and overs in the regulatory control period 2015-20 ........................... 39
7.2.4 Transitional capital contribution unders and overs ................................................... 39
7.2.5 Transitional shared assets unders and overs ........................................................... 40
7.2.6 Cost Pass-Through – Feed in Tariffs ....................................................................... 40
7.3 Shared assets ................................................................................................................. 41
8 Annual revenue requirement .................................................................................................. 42
8.1 Comparison to forecast annual revenue requirement for regulatory control period 2010-15 ....................................................................................................................................... 42
8.2 Departures ...................................................................................................................... 44
9 X factors ................................................................................................................................ 46
9.1 Relevant NER requirements ........................................................................................... 46
9.2 X Factor Calculations – Standard Control Services ......................................................... 46
10 List of documents referenced ............................................................................................. 50
03.01.01 – Ergon Energy’s Building Block Components 3
1 Introduction
1.1 Overview
This document provides supporting information and explanations of the relevant components comprising the Standard Control Services Annual Revenue Requirement (ARR) building blocks for the regulatory control period 2015-20. It also considers how the actual and estimated expenditures, disposals, capital contributions and other allowable adjustments within the regulatory control period 2010-15 impact the opening asset base and ARR values for the regulatory control period 2015-20.
The approach the AER must take in determining the revenue requirements for Standard Control Services is detailed in Part C of Chapter 6 of the NER.
To assist the AER determine the revenue requirements, we are required to develop a building block proposal. Building blocks, added together, allow the AER to determine the ARR for each regulatory year.1
Our building block proposal contains the necessary information to allow the AER to make relevant decisions in accordance with the National Electricity Rules (NER) requirements. This document provides details of our proposed building block components, specifies values derived for each component, and builds on the summary provided in our Regulatory Proposal. It also includes information on the X factor applied to the building block revenue.
We populated the AER’s Post Tax Revenue Model (PTRM) with the information necessary for the AER to determine the ARR, including the revenue increments and decrements set out in clause 6.4.3 of the NER.2
1.2 Purpose of this document
This document sets out components of the revenue building block calculations that underpin our Regulatory Proposal. It provides detailed descriptions of, and justifications for, the assumptions, calculations and data that comprise the following inputs into the calculation of the ARR:
• Roll forward of the Regulatory Asset Base (RAB) and tax asset base in the regulatory control period 2010-15, including:
o Actual and estimated capital expenditure o Actual and estimated disposals o Actual and estimated capital contributions and gifted assets o Actual and estimated adjustments to the RAB
• Roll forward of the RAB and tax asset base in the regulatory control period 2015-20, including: o Forecast capital expenditure o Forecast disposals
1 NER clause 6.4.3. 2 Clause 6.4.2 of the NER requires the PTRM to set out how the ARR is to be determined. Further, clause 6.4.3 of the NER defines the building blocks that make up the ARR. We have interpreted these two clauses to mean the PTRM must include all building blocks set out in clause 6.4.3.

03.01.01 – Ergon Energy’s Building Block Components 4
o Forecast capital contributions and gifted assets
• Return on asset calculations for the regulatory control period 2015-20
• Regulatory depreciation and inflation additions for the regulatory control period 2015-20
• Asset lives and tax asset lives (including standard and remaining lives) for the regulatory control period 2015-20
• Forecast operating expenditure for the regulatory control period 2015-20
• The corporate income tax allowance for the regulatory control period 2015-20
• Other Revenue Adjustments for the regulatory control period 2015-20, including: o Shared asset adjustments o EBSS revenue adjustments o STPIS revenue adjustments o DMIS revenue adjustments o Carry forward of DUOS over- and under-recoveries
• X factor calculations for the regulatory control period 2015-20
1.3 NER requirements
Clause 6.4.3(a) of the NER sets out the building blocks that comprise the ARR:
• Indexation of the regulatory asset base, with the regulatory asset base to be calculated in accordance with the NER, and a negative adjustment for inflation for that year
• A return on capital for that year, calculated by applying a rate of return for that regulatory year that is determined in accordance with the allowed rate of return to the value of the regulatory asset base
• The depreciation for that year, calculated on the value of the assets as included in the regulatory asset base, as at the beginning of that regulatory year
• Our estimated cost of corporate income tax, estimated in accordance with the formula set out under the NER
• The revenue increments or decrements (if any) for that year arising from the application of any efficiency benefit sharing scheme, capital expenditure sharing scheme, service target performance incentive scheme, demand management and embedded generation connection incentive scheme or small-scale incentive scheme
• The other revenue increments or decrements (if any) for that year arising from the application of a control mechanism in the previous regulatory control period, that is those that are to be carried forward to the current regulatory control period as a result of the application of a control mechanism in the previous regulatory control period and are apportioned to the relevant year under the distribution determination for the current regulatory control period
• The revenue decrements (if any) for that year arising from the use of assets that provide Standard Control Services to provide certain other services, that is as a result of those assets being used to provide distribution services that are not classified as a direct control service or

03.01.01 – Ergon Energy’s Building Block Components 5
a negotiated distribution service; or services that are neither distribution services nor services that are provided by means of, or in connection with, dual function assets
• The forecast operating expenditure for that year, that is the forecast operating expenditure as accepted or substituted by the AER.
The diagram below sets out the high level relationships and interdependencies of the ARR:
1.4 Structure of this document
The remainder of this document is structured as follows:
• Section 2 sets out how the opening RAB value as of 1 July 2015 was established, having regard for:
o The opening RAB at the start of the regulatory control period 2010-15
o Actual and estimated capital expenditure, capital contributions and disposals during the regulatory control period 2010-15
o Regulatory depreciation during the regulatory control period 2010-15
Annual Revenue Requirement
Return on Asset Depreciation Opex Tax
Allowance
Revenue increments / decrements
WACC RAB
Opening RAB
Plus:
Capex
Less:
Depreciation
Equals:
Closing RAB
Rol
l for
war
d m
odel
Incentive schemes
Previous Control
mechanism
Shared assets
Corporate tax rate
Gamma
Building Blocks
Plus:
Indexation

03.01.01 – Ergon Energy’s Building Block Components 6
o Adjustments made during the regulatory control period 2010-15 to both remove and include assets in the RAB
Section 2 also describes the roll forward of the RAB during the regulatory control period 2015-20, having regard for:
o Forecast capital expenditure, capital contributions and disposals during the regulatory control period 2015-20
o Regulatory depreciation during the regulatory control period 2015-20
• Section 3 summarises the method by which the return on capital was determined for the regulatory control period 2015-20
• Section 4 sets out how regulatory depreciation has been determined for the regulatory control period 2015-20, having regard for:
o The calculation of remaining asset lives by asset class
o Indexation of the RAB
• Section 5 summarises the method by which the operational expenditure was determined for the regulatory control period 2015-20
• Section 6 summarises the method by which the corporate income tax was estimated for the regulatory control period 2015-20, as well as the roll forward of the tax asset base to 1 July 2015
• Section 7 sets out how the various other adjustments, increments and decrements to the RAB and the ARR were determined for the regulatory control period 2015-20, having regard for:
o Adjustments from the application of the control mechanisms in the current regulatory control period (e.g. the carry forward of DUOS over- and under-recoveries)
o Incentive schemes
o Shared assets
• Section 8 summarises the method by which the ARR was determined for the regulatory control period 2015-20
• Section 9 outlines how the X Factors for the Standard Control Services ARR values were developed

03.01.01 – Ergon Energy’s Building Block Components 7
2 Regulatory Asset Base
In accordance with Schedule 1 clause 27.1 of the Reset Regulatory Information Notice (RIN), this chapter summarises the establishment of the 1 July 2015 opening RAB value and specifically covers:
• The calculation of the RAB for each year of the regulatory control period 2010-15, including:
o The opening RAB at the start of the regulatory control period 2010-15
o The actual and estimated capital expenditure, capital contributions and disposals during the regulatory control period 2010-15
o The regulatory depreciation during the regulatory control period 2010-15
o The other adjustments made to the RAB during the regulatory control period 2010-15 to recognise departures to the underlying methods in the AER’s Roll Forward Model (RFM) and Guidelines
2.1 Roll forward of the RAB in the regulatory control period 2010-15
Our RAB represents the remaining value of all previous capital investments to be recovered from customers, taking into account:
• Investment already recovered from customers through the depreciation allowance
• Investment in new assets
• Any proceeds from asset disposals
• Increases or decreases in the value of previous investments due to the asset providing a different service or classification of service.
We have rolled forward our opening RAB to 1 July 2015 in accordance with:
• Schedule 2.1 of the NER, which establishes how our opening RAB must be calculated.
• The relevant transitional provisions set out in clause 6.5.1 of the NER, and
• The AER’s RFM and Guidelines, which set out how our prior and future investments are incorporated into our revenue requirement.
This is because the detailed calculations underpinning the establishment of the opening RAB as of 1 July 2015 are embodied within the AER’s RFM (consistent with the requirements of Schedule 1 clause 27.1 of the Reset RIN). The estimated value of our RAB at 1 July 2015 of $10,041.5 million was calculated in accordance with clause 6.5.1 and schedule 6.2 of the NER and comprises the roll forward of actual capital expenditure for 2010-11 to 2013-14, estimated capital expenditure for 2014-15 and adjustments to reflect the changes in service classifications as of 1 July 2015.
Whilst we have not altered the calculations underpinning the AER’s RFM, we have made some departures from the underlying inputs and methods in the AER’s RFM. These relate to:
• The treatment of capital contributions (as set out in section 2.1.2.2)

03.01.01 – Ergon Energy’s Building Block Components 8
• The assets which are being included or removed from the RAB during the regulatory control period 2010-15 due to service reclassifications (as set out in section 2.1.5.2)
In accordance with Schedule 1 clause 27.2 of the Reset RIN, these departures and the reasons underpinning them are set out in the appropriate sections within this chapter. We note that all departures have been correctly applied in the context of the AER’s 2010 Final Determination and the NER in effect at the time.
The table below sets out the annual roll-forward of the Standard Control Services RAB for each regulatory year of the regulatory control period 2010-15:
Table 1: Ergon Energy’s Regulatory Asset Base for 2010-15 ($M nominal)
2010-11 2011-12 2012-13 2013-14 2014-15
Opening RAB 7,160.95 7,858.05 8,360.76 9,006.79 9,606.34
plus Capital Expenditure (net of disposals and capital contributions)
801.49 758.16 827.95 748.54 885.91
less Regulatory depreciation (104.39) (255.46) (181.92) (148.99) (186.67)
less Difference Between Actual and Forecast Net Capital Expenditure in 2009-10, and the Return on Difference for the Net Capital Expenditure in 2009-10
- - - - (209.75)
Closing RAB 7,858.05 8,360.76 9,006.79 9,606.34 10,095.83
less adjustments to recognise changes in service classifications that occur on 1 July 2015
- - - - (54.29)
Opening RAB 1 July 2015 10,041.54
The closing RAB values reflect the values in the RFM for the regulatory control period 2010-15. The opening RAB value as of 1 July 2015 reflects the value in the Standard Control Service PTRM for the regulatory control period 2015-20 and reconciles with the Reset RIN templates in accordance with Schedule 1 clause 16.9 of the Reset RIN.
2.1.1 Opening RAB as at 1 July 2010
The value of the RAB as at 1 July 2010 was calculated to be $7,160.95 million. The value was determined as follows:
• An opening asset base for 2009-10 of $6,464.64 million. This comprises the opening RAB value of $6,452.64 million as per the 2010-15 Distribution Determination plus $12 million of equity raising costs

03.01.01 – Ergon Energy’s Building Block Components 9
• Plus the nominal forecast net capital expenditure for 2009-10 of $819.46 million as per the 2010-15 Distribution Determination
• Less the nominal forecast regulatory depreciation for 2009-10 of $123.15 million as per the 2010-15 Distribution Determination
This value of the opening RAB on 1 July 2010 is different to the 2010-15 Distribution Determination opening RAB value of $7,148.95 million because the AER’s opening RAB value did not include $12 million of equity raising costs, whereas our opening RAB value includes this value.
2.1.2 Capital expenditure during the current regulatory control period
For the purposes of rolling forward the RAB from 1 July 2010 to the end of the regulatory control period 2010-15, the net capital expenditure needs to be determined. Net capital expenditure is the actual (or estimated) capital expenditure for a given regulatory year, less the capital contributions, disposals and other allowable adjustments (as per section 2.1.4 of this document) that occurred during that regulatory year.
The table below sets out the capital expenditure, capital contributions, disposals and the resulting net capital contributions for each year of the regulatory control period 2010-15. Actual values are provided for 2010-11 through to 2013-14 inclusive, with estimated values provided for 2014-15. Note that these values are adjusted by the RFM to include a half-year timing adjustment equal to the square root of (1 + vanilla WACC) in each regulatory year of the regulatory control period 2010-15. We have not modified this adjustment within the RFM and we present these values in the table below:
Table 2: Ergon Energy’s net capital expenditure 2010-15 ($M nominal)
2010-11 2011-12 2012-13 2013-14 2014-15
Capital expenditure 813.67 842.70 836.00 758.75 893.24
less Capital contributions - - - - -
less Disposals (12.18) (84.54) (8.05) (10.21) (7.32)
Net capital expenditure 801.49 758.16 827.95 748.54 885.91
2.1.2.1 Capital expenditure
The capital expenditure values for 2010-11 through to 2013-14 inclusive, prior to the half-year timing adjustment being applied, represent the actual annual total capital expenditure values reported in the Annual Reporting RINs. The capital expenditure value for 2014-15 has been developed based on the best estimate available at the time of preparing the Regulatory Proposal and is consistent with the Reset RIN. A more detailed description of how the capital expenditure values for these years were developed is provided in Appendix B of the Regulatory Proposal and in the various capital expenditure summary documents that form part of the Regulatory Proposal submission.

03.01.01 – Ergon Energy’s Building Block Components 10
2.1.2.2 Capital contributions
Clause 6.21 of the NER details the circumstances in which we can “minimise financial risks associated with investment in network assets and provides for adoption of cost reflective payment options in conjunction with the use of average distribution prices”. In particular:
• Clause 6.21.2(2) provides that we “may receive a capital contribution, prepayment and/or financial guarantee up to the provider’s future revenue related to the provision of direct control services for any new assets installed as part of a new connection or modification to an existing connection, including any augmentation to the distribution network”, and
• Clause 6.21.2(3) provides that “where assets have been the subject of a contribution or prepayment, the Distribution Network Service Provider must amend the provider’s revenue related to the provision of direct control services”.
In addition, a Queensland-specific transitional rule was introduced for the regulatory control period 2010-15 under clause 11.16.10 of the NER. This clause provided that:
• By 1 July 2009, we must publish on our website a capital contributions policy based on the requirements relating to capital contributions in our Pricing Principles Statement (PPS) immediately in force prior to 1 July 2009
• The AER may, before 1 January 2010, direct us in writing to revise and republish our capital contributions policy if it is inconsistent with our PPS, and
• We may apply to the AER to amend our capital contributions policy after 1 January 2010. The requirements of Chapters 6 and 11 of the NER meant that we were able to retain our existing capital contributions policy in the regulatory control period 2010-15 provided that it remained consistent with our approved PPS. The existing methodology was approved by the Queensland Competition Authority in 2005 and involved contributed assets being recognised in the RAB at their full value, but the return on and return of capital associated with these contributed assets was netted off the ARR each year.
The forecast capital contributions for 2014-15 are based on the best estimate available at the time of preparing the Regulatory Proposal and the assumptions that capital contributions remain the same for the rest of the current regulatory control period. These estimated capital contributions, together with the actual capital contributions for 2010-11 to 2013-14 inclusive are included in the RAB roll forward for the current regulatory control period and have not been removed from the Standard Control Services RAB.
This represents a departure from the underlying methods of the AER’s RFM (in accordance with Schedule 1 clause 27.1 of the Reset RIN). However, this departure has been adopted because the transitional arrangements in clause 11.16.10 of the NER allow the RAB used to determine the allowable revenue for the regulatory control period 2010-15 to include a value for the forecast capital contributions (being both cash and gifted assets). Therefore, the calculated revenue included an allowance for return of, and on, the contributed assets.
To offset the revenue resulting from the inclusion of capital contributions, a revenue adjustment equal to the value of the forecast capital contributions was applied in the year in which the capital contribution was forecast to occur. By definition, the net present value (NPV) of the revenue stream to be earned from the capital contributions over the life of those assets is equal to the initial value of the capital contribution. A conceptual illustration of this mechanism is provided in the diagram below.

03.01.01 – Ergon Energy’s Building Block Components 11
As illustrated in the diagram, the capital contributions are not removed from the RAB as doing so would result in the NPV of the revenue stream from those assets being lower than the original value of the contributions (i.e. the original revenue adjustment would have been too high). Therefore, the value of the actual capital contributions for the current regulatory control period have been included in the roll forward of the RAB to 1 July 2015, so that the forward revenue calculations will continue to include an amount for the return on, and of, the past capital contributions.
2.1.2.3 Disposals
Clause S6.2.1(e)(6) of the NER requires the RAB to be reduced by the ‘disposal value’ of assets. We note that ‘disposal value’ is not defined in the NER. However, section 5.3.2 of the AER’s RFM Final Decision for Electricity Distribution Network Service Providers (June 2008) states that:
“For the purposes of the RFM, the AER accordingly considers that using the sale or depreciated value as the disposal value of an asset may be acceptable. The AER will assess the appropriateness of either of these approaches as proposed by a DNSP on a case-by-case basis. In either case the AER also notes that the approach adopted in the RFM must be consistent with that applied on a forecast basis in the PTRM.”
We have adopted the sale value of assets to be the disposal value in both the RFM (for the regulatory control period 2010-15) and for the PTRM (for the regulatory control period 2015-20). This approach is consistent with the principles of Financial Capital Maintenance and is consistent with what we proposed and was approved by the AER in the Distribution Determination for 2010-15.
The disposal amounts reflect:
• The transfer of the Tarong to Columboola 132kV line and the Chinchilla and Columboola 132kV switchyards to Powerlink in 2011-12
• The disposal of motor vehicles
• The disposal of other non-system assets
RAB
Year 1 RAB
Year 2 RAB
Year 3 RAB
Year 4 RAB
Year ‘n’
Capital contribution added as capital expenditure and
not netted off
Capital Contribution ($x)
Revenue Allowance
Year 1 Revenue
Allowance Year 2
Revenue Allowance
Year 3 Revenue
Allowance Year 4
Revenue Allowance
Year n
…
Return on, and return of, the
capital contribution
Value of capital contribution is rolled forward as part of the RAB over the life of the asset
Net Present Value = $x

03.01.01 – Ergon Energy’s Building Block Components 12
2.1.3 Regulatory depreciation
A detailed discussion on the approach taken to determine regulatory depreciation for the regulatory control period 2010-15 and the regulatory control period 2015-20 is set out in section 4 of this document.
2.1.4 Adjustment to recognise the difference between actual and forecast net capital expenditure in 2009-10
The AER’s RFM includes a mechanism for recognising the difference between forecast and actual capital expenditure in 2009-10 in the roll forward of the RAB in the regulatory control period 2010-15. This is because at the time of the 2010 Distribution Determination being prepared, the actual capital expenditure for 2009-10 was not available. The RFM determines the difference between the actual and forecast capital expenditure in 2009-10 and deducts the difference from the closing 2014-15 RAB. It also deducts the return on the difference between actual and forecast capital expenditure from the 2014-15 RAB.
We have applied this mechanism in the RFM without modification as follows to obtain a total adjustment in 2014-15 of $209.75 million, which comprises the sum of:
• The difference between the nominal actual net capital expenditure ($687.53 million) and nominal forecast net capital expenditure in 2009-10 ($819.46 million) was calculated to be $131.93 million. The nominal actual net capital expenditure of $687.53 million comprises:
o $673.10 million of nominal actual capital expenditure incurred in 2009-10 o Less $11.54 million of nominal actual disposals incurred in 2009-10 o Plus $28.78 million of timing adjustments as calculated by the AER’s RFM. The
AER’s RFM does this by multiplying the actual nominal net capital expenditure by the square root of (1 + the nominal vanilla WACC) for the previous regulatory control period (8.89%)
o Less $2.81 million of inflation adjustments as per the AER’s RFM. The AER’s RFM does this by multiplying the actual nominal net capital expenditure by (1 + the 2008-09 actual inflation of 2.47%) and dividing by (1 + the 2009-10 actual inflation of 2.89%)
The revenue benefit arising from this capital expenditure underspend of $131.93 million has been returned to customers – this is because in accordance with the RFM, we only include the actual net capital expenditure in the 2010-11 opening RAB and hence only earns the depreciation and return on asset allowance on the actual net capital expenditure from 2010-11 onwards.
• The return on the difference between actual and forecast capital expenditure is calculated to be $77.82 million, which is the sum of the compounded return on the difference in each year of the regulatory control period 2010-15. This calculation is embodied in the Adjustment for Previous Period tab of the AER’s RFM

03.01.01 – Ergon Energy’s Building Block Components 13
2.1.5 Adjustments to recognise changes in service classifications that occur on 1 July 2015
We own an undersea cable to Hayman Island which, at the start of the regulatory control period 2010-15, was not included in the RAB for Standard Control Services but will be transferred to the RAB for Standard Control Services at the commencement of the regulatory control period 2015-20.
In addition, there are Type 5-6 metering assets which, at the start of the regulatory control period 2010-15 were included in the RAB for Standard Control Services but will be removed the RAB for Standard Control Services at the commencement of the regulatory control period 2015-20 by virtue of the reclassification of Type 5-6 metering services as Alternative Control Services from 1 July 2015.
Table 3: Ergon Energy’s net adjustments to recognise changes in service classifications ($M nominal)
Asset Standard Control Service RAB Asset Class affected
Value as at 1 July 2015
Hayman Island 22kV Undersea Cable Underground Sub-Transmission Cables
7.31
less Type 5-6 metering Metering (61.60)
Net RAB adjustment (54.29)
Consistent with Schedule 1 clause 27.3 of the Reset RIN, the following sections provide details on:
• The applicable NER requirements relating to RAB adjustments due to service reclassifications
• The assets which are being included or removed from the RAB as at 1 July 2015.
2.1.5.1 Relevant NER requirements
Clause S6.2.1(e)(7) of the NER requires that:
The previous value of the regulatory asset base must be reduced by the value of an asset where the asset was previously used to provide Standard Control Services (or their equivalent under the previous regulatory system) but, as a result of a change to the classification of a particular service under Part B, is not to be used for that purpose for the relevant regulatory control period.
And clause S6.2.1(e)(8) of the NER requires that:
The previous value of the regulatory asset base may be increased by the value of an asset to which this subparagraph applies to the extent that:
(i) The AER considers the asset to be reasonably required to achieve one or more of the capital expenditure objectives, and
(ii) The value of the asset has not been otherwise recovered.
This subparagraph applies to an asset that:

03.01.01 – Ergon Energy’s Building Block Components 14
(i) Was not used to provide Standard Control Services (or their equivalent under the previous regulatory system) in the previous regulatory control period but, as a result of a change to the classification of a particular service under Part B, is to be used for that purpose for the relevant regulatory control period; or
(ii) Was never previously used to provide Standard Control Services (or their equivalent under the previous regulatory system) but is to be used for that purpose for the relevant regulatory control period.
The following sections sets out the adjustments to the RAB being proposed and how these are in accordance with clause S6.2.1(e)(7) and clause S6.2.1(e)(8) of the NER.
2.1.5.2 Changes in RAB values due to service reclassifications - additions
We have a number of assets to which clause S6.2.1(e)(8) of the NER applies, including the Hayman Island 22kV undersea cable. With the exception of this undersea cable, we have chosen not to adjust the Standard Control Services RAB to include a number of assets which previously provided unregulated service during the regulatory control period 2010-15. This is because of the complexity associated with extracting the asset values and the immaterial value of these assets given their age. The Hayman Island 22kV undersea cable meets the requirements of S6.2.1(e)(8) of the NER because it:
• Has never previously been classified by the AER as providing Standard Control Services and was never previously classified by the Queensland Competition Authority as providing Prescribed Services (the equivalent of Standard Control Services) under previous regulatory arrangements
• Will be used for the provision of Standard Control Services in the regulatory control period 2015-20
• Have not been otherwise recovered by customers of Standard Control Services or Prescribed Services
• Is required to achieve the following capital expenditure objectives: (1) Meet or manage the expected demand for Standard Control Services during the
regulatory control period 2015-20 (2) Comply with all applicable regulatory obligations or requirements associated with the
provision of Standard Control Services
We have confirmed, in discussions with the AER in May 2014, that the Hayman Island 22kV Undersea Cable will be included in the Standard Control Service RAB from 1 July 2015. This is because the undersea cable, substation and associated assets provide distribution services which are consistent with the AER’s Classification of Services for Standard Control Services.
We have adjusted the Standard Control Services opening RAB in the PTRM for the regulatory control period 2015-20 to recognise the written down value of the Hayman Island 22kV Undersea Cable (from our unregulated asset register) as at 2015-16 (the year in which it transfers to the RAB). The asset value of $7.31 million is added to the Underground Sub-Transmission Cables asset class in the PTRM as an opening RAB adjustment (i.e. it is not recognised as capital expenditure in 2015-16).

03.01.01 – Ergon Energy’s Building Block Components 15
2.1.5.3 Changes in RAB values due to service reclassifications - deductions
In accordance with the AER’s Framework and Approach for Ergon Energy, Type 5-6 Metering will be classified as an alternative control service as of 1 July 2015, representing a change from its previous classification as a standard control service in the regulatory control period 2010-15. For this reason, we have adjusted the Standard Control Services opening RAB in the PTRM for the regulatory control period 2015-20 to recognise this reclassification by deducting the value of Type 5-6 meters ($61.60 million) from the Metering asset class. This is consistent with the requirements of Clause S6.2.1(e)(7) of the NER.
Further details on the treatment of Type 5-6 meters is provided in our summary document 05.03.01 Default Metering Services Summary which forms part of the regulatory submission. This document also sets out the reasons for establishing a new separate asset class for Type 5-6 meters from 2015-16 onwards as required by Schedule 1 clause 28.4 of the Reset RIN. Consistent with the requirements of Schedule 1 clause 28.5 of the Reset RIN, we note that no other assets classes have been added, modified or removed in the asset based for the regulatory control period 2015-20.
2.2 Roll forward of the RAB in the regulatory control period 2015-20
This section summarises the roll forward of the opening RAB as of 1 July 2015 for the regulatory control period 2015-20. Specifically it considers the contribution of the following components to RAB roll forward:
• Forecast capital expenditure for each regulatory year from 2015-16 to 2019-20
• Forecast capital contributions for each regulatory year from 2015-16 to 2019-20, having regard for the cessation of the relevant transitional arrangements in place for the 2011-11 to 2014-15 regulatory control period
• Forecast disposals for each regulatory year from 2015-16 to 2019-20 We applied the AER’s PTRM to roll forward the RAB for Standard Control Services from 1 July 2015 to 30 June 2020. A summary of the roll forward values is provided in Table 4.
Table 4: Ergon Energy’s RAB for 2015-20 ($M nominal)
2015-16 2016-17 2017-18 2018-19 2019-20
Opening RAB 10,041.54 10,651.75 11,233.28 11,748.10 12,311.45
plus Capital Expenditure (net of disposals and capital contributions)
783.74 773.23 722.49 724.13 725.82
less Regulatory depreciation (173.53) (191.70) (207.66) (160.77) (170.28)
Closing RAB 10,651.75 11,233.28 11,748.10 12,311.45 12,867.00
These values, which reflect the values in the PTRM, reconcile with the Reset RIN templates in accordance with Schedule 1 clause 16.9 of the Reset RIN.

03.01.01 – Ergon Energy’s Building Block Components 16
2.2.1 Capital expenditure
This section sets out how the manner in which forecast capital expenditure for the regulatory control period 2015-20 is recognised in the RAB. It has specific regard for the annual forecast capital expenditure and the forecast capital contributions and forecast disposals which are netted from the annual capital expenditure values in each regulatory year. In addition, the forecast annual capital expenditures have been adjusted to reflect that some of the Standard Control Service non-system assets are also used in the provision of services other than Standard Control Service.
The table below sets out the forecast capital expenditure, capital contributions, disposals and the resulting net capital contributions for each year of the regulatory control period 2015-20. These values are included as inputs to the PTRM:
Table 5: Ergon Energy’s net capital expenditure 2015-20 ($M nominal)
2015-16 2016-17 2017-18 2018-19 2019-20
Capital expenditure 927.07 925.61 888.58 902.13 913.61
less Capital contributions (135.96) (144.82) (158.34) (170.05) (179.64)
less Disposals (7.37) (7.56) (7.75) (7.95) (8.16)
Net capital expenditure 783.74 773.23 722.49 724.13 725.82
2.2.1.1 Capital expenditure
Our capital expenditure forecasts for the regulatory control period 2015-20, and the associated supporting justifications and explanations are set out in the Appendix B of the Regulatory Proposal.
2.2.1.2 Capital contributions
As noted in section 2.1.2.2, clause 6.21 of the NER details the circumstances in which we can “minimise financial risks associated with investment in network assets and provides for adoption of cost reflective payment options in conjunction with the use of average distribution prices”.
We note that the Queensland-specific transitional rule relating to our capital contributions policy will no longer apply from 1 July 2015 onwards. To reflect this, from 1 July 2015 we have deducted the annual forecast capital contributions (by asset class) from the annual forecast capital expenditure for each year of the regulatory control period. This has been achieved by entering the forecast capital contributions (by asset class) as input into the Input tab of the AER’s PTRM in accordance with the PTRM Guidelines. The revenue deductions set out in section 2.1.2.2 are no longer applied for forecast capital contributions in the regulatory control period 2015-20.
Appendix B of the regulatory proposal and the Customer Initiated Capital Works will provide details on our forecast of capital expenditure which relates to customer connections, some of these works will involve upfront capital contributions or contributed assets. Our connections policy will include details of the circumstances in which some customers will pay a contribution towards their connection (or be responsible for the gifting of connection assets).

03.01.01 – Ergon Energy’s Building Block Components 17
2.2.1.3 Disposals
As noted in section 2.1.2.3, we have adopted the sale value of assets to be the disposal value in both the RFM (for the regulatory control period 2010-15) and for the PTRM (for the regulatory control period 2015-20). This approach is consistent with that we proposed and was approved by the AER in the Distribution Determination for 2010-15.
The disposals represent the forecast annual proceeds from sale of motor vehicles. Consistent with our approach to forecasting disposals in the 2010-15 regulatory submission, the forecast motor vehicle disposals for the regulatory control period 2015-20 are based on our historical proceeds from the sale of motor vehicles in real terms.
2.2.2 Regulatory depreciation
A detailed discussion on the approach taken to determine regulatory depreciation for the regulatory control period 2015-20 is set out in section 4 of this document.
2.3 Roll forward of the tax asset base in the regulatory control period 2010-15
This section summarises the roll forward of the opening tax asset base from 1 July 2010 to 1 July 2015 for the regulatory control period 2015-20. Note that the AER’s PTRM does not roll forward the tax asset base for each year of the regulatory control period 2015-20 and as such this document does not cover the roll forward of the tax asset base beyond 1 July 2015.
Our tax asset base represents the remaining tax value of all previous capital investments to be recovered from customers, taking into account:
• The tax depreciation allowance
• Investment in new assets
• Any proceeds from asset disposals
• Increases or decreases in the value of previous investments due to the asset providing a different service or classification of service.
We have rolled forward our opening tax asset base to 1 July 2015 in accordance with the AER’s RFM and Guidelines, which set out how our prior and future investments are incorporated into our tax depreciation and tax payable calculations.
This is because the detailed calculations underpinning the establishment of the opening tax asset base as of 1 July 2015 are embodied within the AER’s RFM (consistent with the requirements of Schedule 1 clause 29.6 of the Reset RIN). The estimated value of our tax asset base at 1 July 2015 of $6,325.07 million comprises the roll forward of actual capital expenditure for 2010-11 to 2013-14, estimated capital expenditure for 2014-15 and adjustments to reflect the changes in service classifications as of 1 July 2015.
Whilst we have not altered the calculations underpinning the AER’s RFM, we have made some departures from the underlying inputs and methods in the AER’s RFM. These relate to the assets which are being included or removed from the tax asset base during the regulatory control period 2010-15 due to service reclassifications (as set out in section 2.1.5.2)
03.01.01 – Ergon Energy’s Building Block Components 18
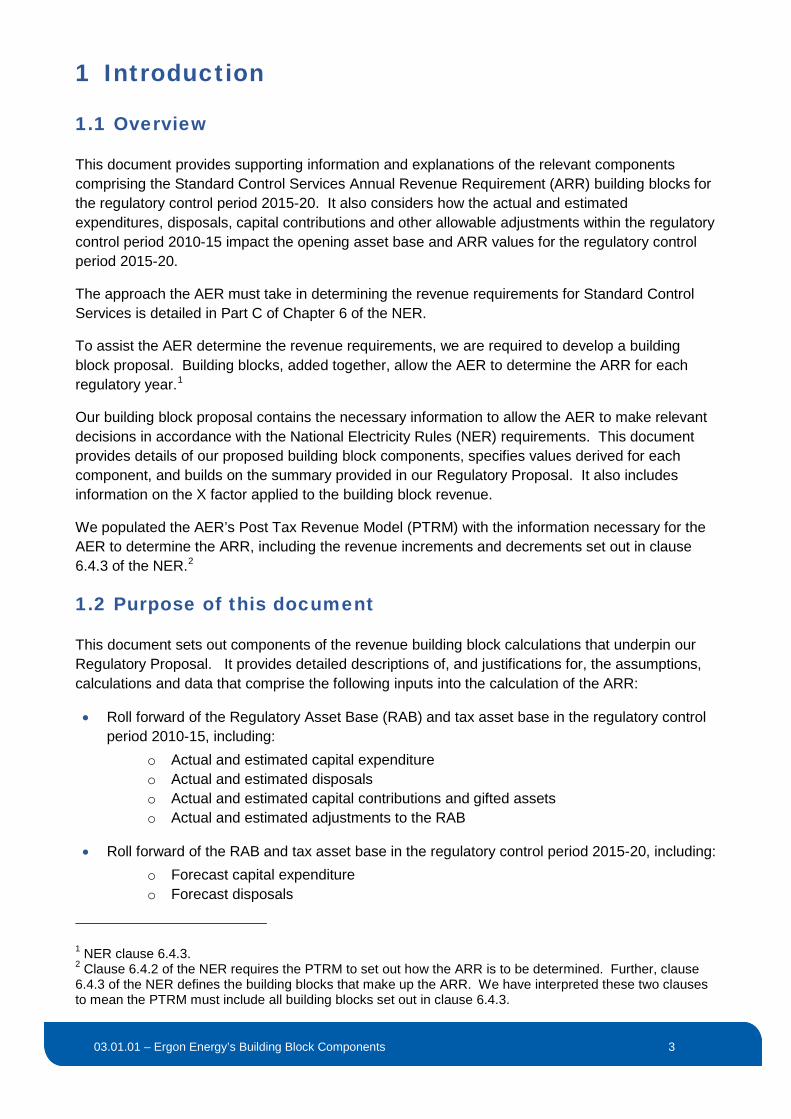
In accordance with Schedule 1 clause 29.7 of the Reset RIN, these departures and the reasons underpinning them are set out in the appropriate sections within this chapter. We note that all departures have been correctly applied in the context of the AER’s 2010 Final Determination and the NER in effect at the time.
The table below sets out the annual roll-forward of the Standard Control Services tax asset base for each regulatory year of the regulatory control period 2010-15:
Table 6: Ergon Energy’s Tax Asset Base for 2010-15 ($M nominal)
2010-11 2011-12 2012-13 2013-14 2014-15
Opening Tax Asset Base 3,914.96 4,448.15 4,915.97 5,427.04 5,843.61
plus Capital Expenditure (net of disposals)
762.16 727.14 790.50 713.19 846.88
less Tax Asset Base depreciation (228.97) (259.32) (279.43) (296.62) (305.84)
Closing Tax Asset Base as at 30 June 2015 4,448.15 4,915.97 5,427.04 5,843.61 6,384.6
less adjustments to recognise changes in service classifications that occur on 1 July 2015
- - - - (59.58)
Opening Tax Asset Base as at 1 July 2015
6,325.07
The closing tax asset value reflects the values in the RFM for the regulatory control period 2010-15. The opening tax asset value as of 1 July 2015 reflects the value in the PTRM for the regulatory control period 2015-20.
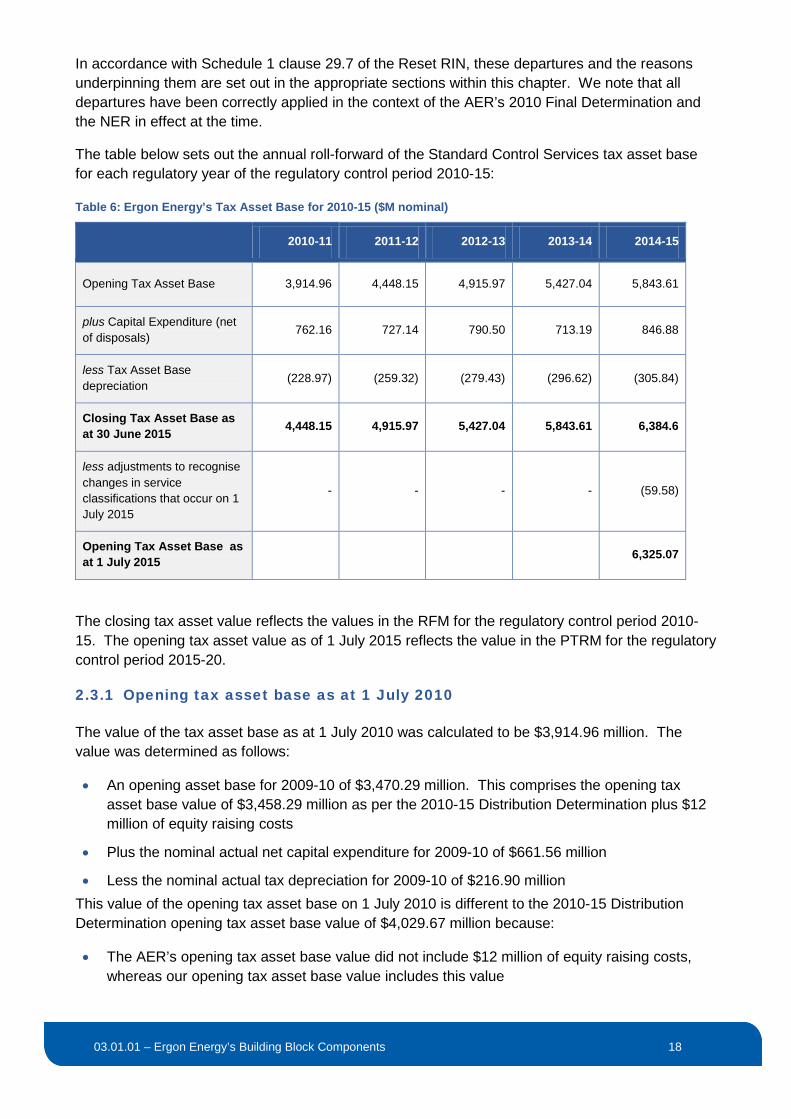
2.3.1 Opening tax asset base as at 1 July 2010
The value of the tax asset base as at 1 July 2010 was calculated to be $3,914.96 million. The value was determined as follows:
• An opening asset base for 2009-10 of $3,470.29 million. This comprises the opening tax asset base value of $3,458.29 million as per the 2010-15 Distribution Determination plus $12 million of equity raising costs
• Plus the nominal actual net capital expenditure for 2009-10 of $661.56 million
• Less the nominal actual tax depreciation for 2009-10 of $216.90 million This value of the opening tax asset base on 1 July 2010 is different to the 2010-15 Distribution Determination opening tax asset base value of $4,029.67 million because:
• The AER’s opening tax asset base value did not include $12 million of equity raising costs, whereas our opening tax asset base value includes this value
03.01.01 – Ergon Energy’s Building Block Components 19
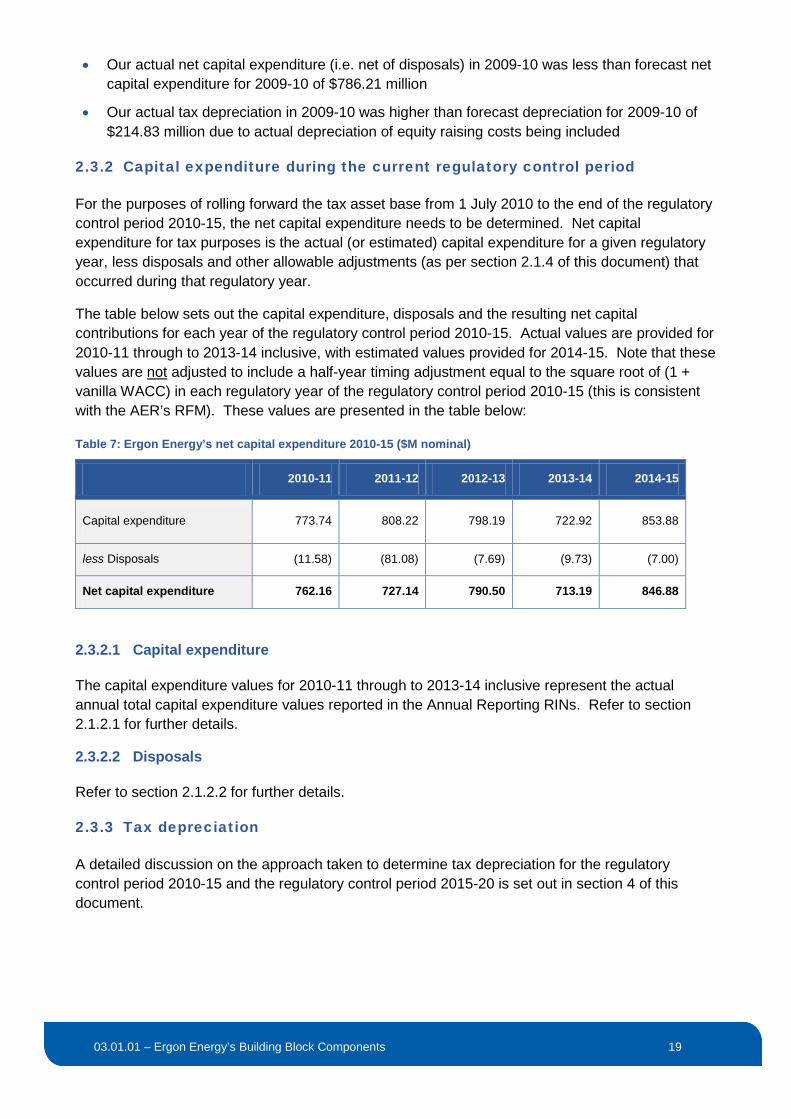
• Our actual net capital expenditure (i.e. net of disposals) in 2009-10 was less than forecast net capital expenditure for 2009-10 of $786.21 million
• Our actual tax depreciation in 2009-10 was higher than forecast depreciation for 2009-10 of $214.83 million due to actual depreciation of equity raising costs being included
2.3.2 Capital expenditure during the current regulatory control period
For the purposes of rolling forward the tax asset base from 1 July 2010 to the end of the regulatory control period 2010-15, the net capital expenditure needs to be determined. Net capital expenditure for tax purposes is the actual (or estimated) capital expenditure for a given regulatory year, less disposals and other allowable adjustments (as per section 2.1.4 of this document) that occurred during that regulatory year.
The table below sets out the capital expenditure, disposals and the resulting net capital contributions for each year of the regulatory control period 2010-15. Actual values are provided for 2010-11 through to 2013-14 inclusive, with estimated values provided for 2014-15. Note that these values are not adjusted to include a half-year timing adjustment equal to the square root of (1 + vanilla WACC) in each regulatory year of the regulatory control period 2010-15 (this is consistent with the AER’s RFM). These values are presented in the table below:
Table 7: Ergon Energy’s net capital expenditure 2010-15 ($M nominal)
2010-11 2011-12 2012-13 2013-14 2014-15
Capital expenditure 773.74 808.22 798.19 722.92 853.88
less Disposals (11.58) (81.08) (7.69) (9.73) (7.00)
Net capital expenditure 762.16 727.14 790.50 713.19 846.88
2.3.2.1 Capital expenditure
The capital expenditure values for 2010-11 through to 2013-14 inclusive represent the actual annual total capital expenditure values reported in the Annual Reporting RINs. Refer to section 2.1.2.1 for further details.
2.3.2.2 Disposals
Refer to section 2.1.2.2 for further details.
2.3.3 Tax depreciation
A detailed discussion on the approach taken to determine tax depreciation for the regulatory control period 2010-15 and the regulatory control period 2015-20 is set out in section 4 of this document.

03.01.01 – Ergon Energy’s Building Block Components 20
2.3.4 Adjustments to recognise changes in service classifications that occur on 1 July 2015
As noted in section 2.1.5, we own an undersea cable to Hayman Island which, at the start of the regulatory control period 2010-15, was not included in the tax asset base for Standard Control Services but will be transferred to the tax asset base for Standard Control Services at the commencement of the regulatory control period 2015-20.
In addition, there are Type 5-6 metering assets which, at the start of the regulatory control period 2010-15 were included in the tax asset base for Standard Control Services but will be removed the tax asset base for Standard Control Services at the commencement of the regulatory control period 2015-20 by virtue of the reclassification of Type 5-6 metering services as Alternative Control Services from 1 July 2015.
Table 8: Ergon Energy’s net adjustments to recognise changes in service classifications ($M nominal)
Asset Standard Control Service Asset Class affected
Value as at 1 July 2015
Hayman Island 22kV Undersea Cable Underground Sub-Transmission Cables
3.91
less Type 5-6 metering Metering 63.49
Net tax asset base adjustment -59.58
The following sections provide details on the assets which are being included or removed from the tax asset base as at 1 July 2015.
2.3.4.1 Changes in tax asset base values due to service reclassifications - additions
We have adjusted the Standard Control Services opening tax asset base in the PTRM for the regulatory control period 2015-20 to recognise the tax value of the Hayman Island 22kV Undersea Cable as at 2015-16 (the year in which it transfers to the tax asset base). The asset value of $3.91 million is added to the Underground Sub-Transmission Cables asset class in the PTRM as an opening tax asset base adjustment (i.e. it is not recognised as capital expenditure in 2015-16).
2.3.4.2 Changes in tax asset base values due to service reclassifications - deductions
In accordance with the AER’s Framework and Approach for Ergon Energy, Type 5-6 Metering will be classified as an alternative control service as of 1 July 2015, representing a change from its previous classification as a standard control service in the regulatory control period 2010-15. For this reason, we have adjusted the Standard Control Services opening tax asset base in the PTRM for the regulatory control period 2015-20 to recognise this reclassification by deducting the tax value of Type 5-6 meters ($63.49 million) from the Metering asset class.
Further details on the treatment of Type 5-6 meters is provided in our supporting document 05.03.01 Default Metering Services Summary which forms part of the regulatory submission.

03.01.01 – Ergon Energy’s Building Block Components 21
3 Return on capital
An allowance for the return on capital is one of the building blocks which make up our ARR under clause 6.4.3(b)(2) of the NER. The return on capital is calculated as the product of the allowed rate of return and the opening value of the RAB used to provide Standard Control Services for that regulatory year.3
For the purposes of the building block calculation, the following WACC parameter inputs have been included in the PTRM:
Table 9: Ergon Energy’s proposed WACC parameters
WACC Parameter Value
Corporate Tax Rate 30%
Nominal Risk Free Rate 3.63%
Inflation Rate 2.57%
Cost of Equity 10.52%
Utilisation of Imputation (Franking) Credits 25%
Proportion of Debt Funding 60%
Trailing Average Cost of Debt: 2015-16 6.36%
Debt Raising Cost Benchmark 0.197%
We have proposed departures to the Rate of Return Guidelines - refer to Appendix C of the Regulatory Proposal for details of, and justifications for the proposed departures.
3 NER cl. 6.5.2(a)

03.01.01 – Ergon Energy’s Building Block Components 22
4 Return of Capital (Depreciation)
Consistent with the requirements of Schedule 1 clause 28.1 of the Reset RIN, this chapter sets out our calculation of the Standard Control Services depreciation amounts for the regulatory control period 2010-15 and 2015-20.
The AER’s June 2008 Electricity Distribution Network Service Providers RFM Handbook defines nominal regulatory depreciation as being nominal straight-line depreciation less the inflation applied to the opening RAB.
The calculation of nominal regulatory depreciation is embedded within the AER’s RFM and PTRM, and in applying the RFM and PTRM we have calculated the nominal regulatory depreciation in a manner consistent with the definition set out in the RFM Handbook. Table 10 below sets out the regulatory depreciation, and the straight line depreciation and indexation components, for each year of the regulatory control period 2010-15:
Table 10: Ergon Energy’s Regulatory Depreciation for 2010-15 ($M nominal)
2010-11 2011-12 2012-13 2013-14 2014-15
Straight line depreciation (342.85) (379.62) (390.94) (412.89) (402.81)
plus Indexation 238.46 124.16 209.02 263.90 216.14
Regulatory depreciation (104.39) (255.46) (181.92) (148.99) (186.67)
Table 11 below sets out the tax depreciation for each year of the regulatory control period 2010-15:
Table 11: Ergon Energy’s Tax Depreciation for 2010-15 ($M nominal)
2010-11 2011-12 2012-13 2013-14 2014-15
Tax depreciation 228.97 259.32 279.43 296.62 305.84
Table 12 below sets out the regulatory depreciation, and the straight line depreciation and indexation components, for each year of the regulatory control period 2015-20:
Table 12: Ergon Energy’s Regulatory Depreciation for 2015-20 ($M nominal)
2015-16 2016-17 2017-18 2018-19 2019-20
Straight line depreciation (431.60) (465.45) (496.36) (462.70) (486.68)
plus Indexation 258.07 273.75 288.70 301.93 316.40
Regulatory depreciation (173.53) (191.70) (207.66) (160.77) (170.28)

03.01.01 – Ergon Energy’s Building Block Components 23
Table 13 below sets out the tax depreciation for each year of the regulatory control period 2015-20:
Table 13: Ergon Energy’s Tax Depreciation for 2015-20 ($M nominal)
2015-16 2016-17 2017-18 2018-19 2019-20
Tax depreciation (323.09) (352.90) (374.49) (387.73) (413.71)
The sections below provide more detail on how the depreciation and inflation components of the regulatory depreciation building block were calculated for the regulatory control period 2010-15 and the regulatory control period 2015-20. Note that tax depreciation is calculated on a straight line basis using tax standard lives and tax remaining lives for each asset class. The straight line approach for tax is otherwise the same as that for the regulatory asset values and as such is not covered separately in this document.
4.1 Straight Line Depreciation
Clause 6.5.5 of the NER requires that:
(a) The depreciation for each regulatory year:
(1) Must be calculated on the value of the assets as included in the RAB, as at the beginning of that regulatory year, for our distribution system, and
(2) Must be calculated: (iii) Providing such depreciation schedules conform with the requirements set out in
paragraph (b), using the depreciation schedules for each asset or category of assets that are nominated in our building block proposal, or
(iv) To the extent the depreciation schedules nominated in our building block proposal do not so conform, using the depreciation schedules determined for that purpose by the AER.
(b) The depreciation schedules referred to in paragraph (a) must conform to the following requirements:
(1) The schedules must depreciate using a profile that reflects the nature of the assets or category of assets over the economic life of that asset or category of assets
(2) The sum of the real value of the depreciation that is attributable to any asset or category of assets over the economic life of that asset or category of assets (such real value being calculated as at the time the value of that asset or category of assets was first included in the regulatory asset base for the relevant distribution system) must be equivalent to the value at which that asset or category of assets was first included in the regulatory asset base for the relevant distribution system
(3) The economic life of the relevant assets and the depreciation methods and rates underpinning the calculation of depreciation for a given regulatory control period must be consistent with those determined for the same assets on a prospective basis in the distribution determination for that period.
Straight line depreciation of the RAB is determined in the RFM broadly as follows:

03.01.01 – Ergon Energy’s Building Block Components 24
• The opening asset base as of 1 July 2010 by asset class is divided by the remaining life of each asset class
• The actual capital expenditure for 2010-11 to 2013-14 inclusive, and the estimated capital expenditure for 2014-15 is divided by the economic or “standard” life of each asset class
Similarly, straight line depreciation of the RAB is determined in the PTRM as follows:
• The opening asset base as of 1 July 2015 by asset class is divided by the remaining life of each asset class
• The forecast capital expenditure for the regulatory control period 2015-20 inclusive is divided by the economic or “standard” life of each asset class
A more detailed discussion on asset lives is set out in section 4.2.
There are some important considerations in determining the annual depreciation:
• Consistent with the AER’s RFM, depreciation of capital expenditure is not recognised in the year in which the capital expenditure was incurred. Depreciation of capital expenditure in year t is recognised from year t+1 onwards
• The “standard” economic lives for each asset class are those approved by the AER in its 2010-15 Distribution Determination
• The remaining lives for each asset class for 2010-11 are those approved by the AER in its 2010 Final Determination. For each subsequent regulatory year, the remaining lives of each asset class reduced by 1 (unless the resulting remaining life is less than zero, in which case the remaining life is truncated to zero)
In accordance with the requirements of clause 6.5.5 of the NER, we can confirm that regulatory depreciation has been calculated:
• On the value of the assets in our RAB as at 1 July 2010 (in the RFM) and as at 1 July 2015 (in the PTRM) and for each subsequent regulatory year of the current and next regulatory control periods
• Using a straight-line approach over the remaining lives of the asset classes for assets within the opening RAB. This reflects the nature of the assets or category of assets over their economic lives. It should be noted that within an asset class the individual assets may have a remaining life that is different to the weighted average remaining life calculated for the asset class
• Using a straight line approach over the standard economic life applied to the actual capital expenditure (for 2010-11 to 2013-14 inclusive), estimated capital expenditure (for 2014-15) and forecast capital expenditure (for 2015-16 to 2019-20 inclusive). This reflects the nature of the assets or category of assets over their economic lives
• Are developed on the basis that the sum of the real value for any asset over its economic life (such real value being calculated as at the time the value of that asset was first included in the RAB) must be equivalent to the value at which that asset or category of assets was first included in the RAB
In accordance with clause S6.1.3(12)(i) to (iv) of the NER, we confirm that our RFM and PTRM:
• Categorise assets according to well accepted asset classes

03.01.01 – Ergon Energy’s Building Block Components 25
• Provide details of all amounts, values and inputs that we used to compile the depreciation schedules, and
• Demonstrate that the depreciation schedules conform to the requirements set out in clause 6.5.5(b) of the NER.
4.2 Asset lives
4.2.1 Standard Lives
The standard lives for each asset class in the RFM and PTRM are the same as those approved by the AER for the regulatory control period 2010-15, with the exception of Type 5-6 meters, which have a standard life of 3 years. Type 5-6 meters was not a separate asset class in the regulatory control period 2010-15. In accordance with Schedule 1 clause 28.4 of the Reset RIN, a more detailed discussion of the standard life for Type 5-6 meters is provided in our supporting document 05.03.01 Default Metering Services Summary.
In accordance with Schedule 1 clause 28.3 of the Reset RIN, we do not propose any other changes to our standard lives for the existing asset classes in the RFM or PTRM for the regulatory control period 2015-20.
4.2.2 Remaining Lives
Remaining lives for each asset class have been calculated for 2010-11 (as used in the RFM) and again for 2015-16 (as used in the PTRM). The method for calculating the remaining lives for 2010-11 is applied consistently to each asset class as follows:
• The written down values of each asset class (as at 30 June 2010) were obtained from our asset register. These values were in 2009-10 dollars.
• The annual depreciation amounts for each asset class (as at 30 June 2010) were obtained from our asset register. These values were in 2009-10 dollars.
• For each asset class, the written down value was divided by the annual depreciation to obtain the remaining life in years as at 30 June 2010
Schedule 1 clause 28.6 of the Reset RIN requires that the method used to calculate the remaining lives for existing asset classes as at 1 July 2015 be described and that supporting calculations be provided if the approach differs from that in the RFM. We provide the following description of the approach used to calculate the remaining lives for the asset classes used in the PTRM for the regulatory control period 2015-20:
• The “interim closing” regulated asset values for each asset class at the end of 2014-15, prior to the 2009-10 actual capital expenditure adjustment, were obtained from the RFM (cells L199 to L228 of the Total Actual RAB Roll Forward tab). These values were in 2014-15 dollars.
• The annual regulatory depreciation values for each asset class in 2015-16 were obtained from the RFM (cells M44 to M433) in the Actual RAB Roll Forward tab. These values are in real 2009-10 dollars, and are escalated to 2014-15 dollars using the appropriate cumulative escalator in the RFM (cell M178) in the Input tab).
03.01.01 – Ergon Energy’s Building Block Components 26
• For each asset class, the interim closing value was divided by the annual regulatory depreciation to obtain the remaining life in years as at 30 June 2015
The only exception to this approach is Type 5-6 meters, which have a remaining life of 5 years. A more detailed discussion of the remaining life for Type 5-6 meters is provided in our supporting document 05.03.01 Default Metering Services Summary.
4.2.3 Tax Standard Lives
In accordance with Schedule 1 clause 29.4 of the Reset RIN, the tax standard lives for each asset class in the RFM and PTRM are the same as those approved by the AER for the regulatory control period 2010-15, with the exception of Type 5-6 meters, which have a standard life of 25 years consistent with the Australian Taxation Office’s tax Ruling TR 2014/4 - Effective Life Schedules.
We do not propose any other changes to our tax standard lives for the asset classes in the RFM or PTRM for the regulatory control period 2015-20.
4.2.4 Tax Remaining Lives
Tax remaining lives for each asset class have been calculated for 2010-11 (as used in the RFM) and again for 2015-16 (as used in the PTRM). The method for calculating the tax remaining lives for 2010-11 is applied consistently to each asset class as follows:
• The tax asset values of each asset class (as at 30 June 2010) were obtained from our tax asset register. These values were in 2009-10 dollars.
• The annual tax depreciation amounts for each asset class (as at 30 June 2010) were obtained from our tax asset register. These values were in 2009-10 dollars.
• For each asset class, the tax value was divided by the annual tax depreciation to obtain the tax remaining life in years as at 30 June 2010
Schedule 1 clause 29.5 of the Reset RIN requires that the method used to calculate the tax remaining lives for existing asset classes as at 1 July 2015 be described and that supporting calculations be provided if the approach differs from that in the RFM. We provide the following description of the approach used to calculate the tax remaining lives for the asset classes used in the PTRM for the regulatory control period 2015-20:
• The opening tax asset values for each asset class at the start of 2015-16 were obtained from the RFM (cells M8 to M37 of the Tax Value Roll Forward tab). These values were in 2014-15 dollars.
• The annual tax depreciation values for each asset class in 2015-16 were obtained from the RFM (cells M72 to M457) in the Tax Value Roll Forward tab. These values were in 2014-15 dollars.
• For each asset class, the tax asset value was divided by the annual tax depreciation to obtain the remaining life in years as at 30 June 2015
4.3 Indexation
The annual inflation for indexation of the RAB for the current regulatory control period applies the AER’s preferred methodology for calculating actual inflation and the Reserve Bank of Australia’s (RBA) most recent Statement on Monetary Policy forecasts for 2013-14 and 2014-15.

03.01.01 – Ergon Energy’s Building Block Components 27
Clause 6.5.1(e)(3) of the NER requires that:
The roll forward of the regulatory asset base from the immediately preceding regulatory control period to the beginning of the first regulatory year of a subsequent regulatory control period entails the value of the first mentioned regulatory asset base being adjusted for actual inflation, consistently with the method used for the indexation of the control mechanism (or control mechanisms) for Standard Control Services during the preceding regulatory control period.
We have applied inflation rates in the RFM based on the March to March indices for eight capital cities (from the Australian Bureau of Statistics) that were approved in the Initial and Annual Pricing Proposals for the regulatory control period 2010-15. Our RAB indexation for the current regulatory control period is set out in Table 14 below.
Table 14: Ergon Energy’s RAB Indexation for 2010-15 ($M nominal)
2010-11 2011-12 2012-13 2013-14 2014-15
Opening RAB 7,160.95 7,858.05 8,360.76 9,006.79 9,606.34
Inflation Rate 3.33% 1.58% 2.50% 2.93% 2.25%
Indexation 238.46 124.16 209.02 263.90 216.14
Our proposed indexation for the next regulatory control period is based on the same approach as used to forecast the inflation rates for the current regulatory control period. That is, the method:
• First calculates the arithmetic average of the RBA’s short-term CPI inflation forecasts published in Table 6.1 of its August 2014 Statement on Monetary Policy4 for 2013-14 to 2015-16 inclusive
• Then calculates the geometric mean of the CPI values over the 10-year period 2013-14 to 2022-23 using the calculated CPI values for 2013-14 to 2015-16 (as described above) and the midpoint of the RBA’s target CPI inflation range (2.5%) for each of the years 2016-17 to 2022-23 inclusive. This yields forecast CPI inflation values of 2.57% for each year of the regulatory control period 2015-20
Our proposed RAB indexation for the regulatory control period 2015-20 is set out in Table 15 below.
Table 15: Ergon Energy’s RAB Indexation for 2015-20 ($M nominal)
2015-16 2016-17 2017-18 2018-19 2019-20
Opening RAB 10,041.54 10,651.75 11,233.28 11,748.10 12,311.45
Inflation Rate 2.57% 2.57% 2.57% 2.57% 2.57%
Indexation 258.07 273.75 288.70 301.93 316.40
4 http://www.rba.gov.au/publications/smp/2014/aug/html, page 71

03.01.01 – Ergon Energy’s Building Block Components 28
5 Operating expenditure
For the purposes of the building block calculation we have included an allowance for operating expenditure for each year of the regulatory control period 2015-20. Operating expenditure consists of:
• Network Operating Costs
• Total Network Maintenance Costs
• Total Other Operating and Maintenance (O&M) Costs
• Debt raising costs
• Carry-over amounts The table below sets out the forecast operating expenditure for each regulatory year of the regulatory control period 2015-20. These values are included as inputs to the PTRM.
Table 16: Ergon Energy’s forecast operating expenditure 2015-20 ($M nominal)
2015-16 2016-17 2017-18 2018-19 2019-20
Network Operating Costs 35.14 36.81 39.48 41.67 43.52
plus Total Network Maintenance Costs 256.99 269.21 288.79 304.89 318.40
plus Total Other O&M Costs 66.46 68.58 64.10 66.17 68.31
plus Debt raising costs 11.87 12.58 13.26 13.87 14.54
plus Carry-over amounts 96.10 55.09 79.67 -18.14 -
Total Operating expenditure 466.56 442.29 485.32 408.19 444.78
5.1 Network Operating and Maintenance costs and Other O&M costs
Network Operating and Maintenance costs, as well as Other O&M costs are discussed in more detail in our supporting document 06.01.01 Forecast Expenditure Summary – Operating Costs.
5.2 Debt raising costs
Debt raising costs are calculated in accordance with the AER’s PTRM in accordance with the following approach for each year of the regulatory control period 2015-20:

03.01.01 – Ergon Energy’s Building Block Components 29
• The nominal closing end of year RAB value is multiplied by the product of the debt raising cost benchmark (0.197%) and the proportion of debt funding (60%). This gives the nominal debt raising cost for the regulatory year.
• The nominal debt raising cost is divided by the cumulative CPI escalator for the regulatory year to de-escalate to 2014-15 dollars. This gives the real debt raising cost for the regulatory year expressed in 2014-15 dollars.
5.3 Carryover amounts
Carry-over amounts for each regulatory year include:
• Efficiency Benefit Sharing Scheme adjustments. These are covered in more detail in section 7.1.1 of this document and in our supporting document 03.01.03 Application of Incentives Schemes
• DUOS unders and overs in 2015-16. This is covered in more detail in section 7.2.1 of this document and in our supporting document 03.01.02 Other Revenue Adjustments

03.01.01 – Ergon Energy’s Building Block Components 30
6 Corporate income tax
As required by Schedule 1 clause 29.1 and clause 29.4 of the Reset RIN, we have calculated the estimated cost of corporate income tax (and the associated tax asset base roll forward required to determine the annual tax depreciation) for each year of the regulatory control period 2015-20 by applying the AER’s Version 02 (Adjusted) PTRM without further modification. The PTRM calculates the estimated cost of corporate income tax in a manner consistent with clause 6.5.3 of the NER, which requires that the estimated cost of corporate income tax for each regulatory year (ETCt) be estimated as follows:
ETCt = (ETIt ×rt) (1 – γ) where:
• ETIt is the estimated taxable income for regulatory year ‘t’ earned by a benchmark efficient entity through the provision of Standard Control Services if such an entity, rather than Ergon Energy, operated our business. These values are generated by the AER’s PTRM, which determines the taxable income as follows:
Taxable income = ARR (unsmoothed) + annual capital contributions – annual operating expenditure – tax depreciation – interest (i.e. return on debt)
• rt is the expected statutory income tax rate for that regulatory year as determined by the AER, and γ
• γ is the value of imputation credits (gamma), which is itself the product of the Distribution Rate (or Payout Rate) and the utilisation rate (theta)
We are proposing a gamma of 0.25, which reflects a distribution rate of 0.7 and theta of 0.35. This differs from the AER’s Rate of Return Guideline, which proposes values for both these parameters of 0.7. We do not consider that 0.7 is the best value for theta, having regard to the requirements of the NER.
As noted in Appendix C of the Regulatory Proposal, SFG’s Gamma Report identifies a number of issues with the approach taken by the AER in developing its Rate of Return Guideline. It conducts a detailed review of the AER’s conceptual interpretation of theta and highlights some fundamental flaws. SFG clearly demonstrates that the relevant task is to establish a market-based value of theta. This also invalidates the equity ownership, tax statistics and ‘conceptual goalposts’ approach that have been referred to by the AER.
We concur with this view. The gamma parameter is intended to reflect the value that investors place on franking credits in establishing the rate of return they require from the efficient benchmark firm. This has to be a market value. The AER’s conclusion that this should only reflect the extent to which imputation credits might be used to reduce personal tax is erroneous and can (and has) resulted in gamma being overestimated. If the value that investors are assumed to derive from imputation credits is overstated, this will mean that their required rate of return will be underestimated.
SFG has also undertaken an updated empirical analysis of theta using dividend drop-off studies and other market value studies. This analysis concludes that:
• 0.35 remains the best estimate of theta at the current time using a dividend drop-off approach (based on the SFG approach, which has been subject to unprecedented scrutiny)

03.01.01 – Ergon Energy’s Building Block Components 31
• Other market value studies support an estimate between zero and 0.35. The SFG analysis supports the conclusion that a theta of 0.35 is more likely to be at the upper bound of a reasonable range. Our estimated cost of corporate income tax for each year of the regulatory control period 2015-20 is set out in the table below.
Table 17: Ergon Energy’s estimated cost of corporate income tax for Standard Control Services for 2015-20 ($M nominal)
2015-16 2016-17 2017-18 2018-19 2019-20
Corporate Income Tax 154.32 163.02 175.33 164.78 171.11
less Value of Imputation Credits
(38.58) (40.75) (43.83) (41.19) (42.78)
Estimate cost of corporate income tax 115.74 122.26 131.50 123.58 128.33
Further details on the corporate income tax calculation are provided in Appendix C of the Regulatory Proposal.
6.1 Departures
In accordance with Schedule 1 clause 29.3 of the Reset RIN, we must provide details of each departure from the AER’s PTRM for the estimated cost of corporate income tax and the reasons for that departure. In calculating the estimated cost of corporate income tax for the regulatory control period 2015-20, we have adopted the May 2014 (“Version 02 Adjusted”) PTRM sent to us on 29 May 2014 by the AER’s officers.
From a corporate income tax calculation perspective, this PTRM differs from the AER’s current PTRM published on the AER’s website as follows:
• The Version 02 Adjusted PTRM has inputs for corporate tax rate that vary by year. In the AER’s current PTRM, the corporate tax rate was constant across the entire regulatory control period
• The tax calculations (tax payable, intermediate tax, after tax cash flow to debt) use the varying corporate tax rate instead of the constant corporate tax rate (as was the case in the existing PTRM)
Despite the differences in the PTRM calculations, we do not consider that it has departed from the estimated cost of corporate income tax calculations in the existing PTRM in accordance with Schedule 1 Clause 29.3 of the Reset RIN. This is because we have chosen to use a constant 30% corporate tax rate in the PTRM for the regulatory control period 2015-20.
We note however that we have departed from the AER’s Rate of Return Guideline for the setting of gamma (as noted earlier in this chapter).

03.01.01 – Ergon Energy’s Building Block Components 32
6.1.1 Recovery of tax payable on contributed and gifted assets received from large customer connections in 2015-20
In the regulatory control period 2010-15, we note that the tax paid as a result of the contributed and gifted assets we received from large customer connections was not able to be recovered from either the standard control service revenue requirement or any of the alternative control service pricing mechanisms approved by the AER in the 2010 Distribution Determination. We will not be recovering these foregone costs in the regulatory control period 2015-20, however we propose to recover the forecast tax payable as a result of the contributed and gifted assets we expect to receive from large customer connections in the regulatory control period 2015-20.
We have adopted the following approach to recovering the tax payable on contributed and gifted assets we will receive from large customer connections in the regulatory control period 2015-20:
1. The forecast contributed and gifted asset values from large customer connections for each regulatory year of regulatory control period 2015-20 were developed by asset class. Please refer to our supporting document 07.00.03 Customer Initiated Capital Works Expenditure Forecast Summary for further details on how these forecasts were developed
2. The forecast contributed and gifted asset values from large customer connections, by asset class, for each regulatory year of the regulatory control period 2015-20 were then added to the standard control services capital expenditure forecasts by asset class for each regulatory year of the regulatory control period 2015-20. These combined values were then entered into the PTRM for standard control services
3. The forecast contributed and gifted asset values from large customer connections, by asset class, for each regulatory year of the regulatory control period 2015-20 were also added to the standard control services capital contribution forecasts by asset class for each regulatory year of the regulatory control period 2015-20. These combined values were also entered into the PTRM for standard control services
By virtue of the operation of the standard control services PTRM, this method ensures that we receive the tax allowance we require to recover the tax payable for contributed and gifted assets from large customer connections during the regulatory control period 2015-20. This is because the row 39 of the Analysis tab in the PTRM includes the capital contributions as additional tax income, and row 43 of the Analysis tab in the PTRM uses the value of capital contributions in determining the tax depreciation for each regulatory year. In this way, the contributed and assets from large customer connections during the regulatory control period 2015-20 are included in the tax expense and tax payable calculations in the PTRM (and hence the ARR for Standard Control Services).
For this reason, the tax payable (and hence the tax allowance) in the regulatory control period 2015-20 will be higher than in the previous regulatory control period.
Forecast contributed and gifted asset values from large customer connections for each regulatory year of regulatory control period 2015-20 are not inappropriately recovered twice from revenues for standard control services. By adding the contributed and gifted assets from large customer connections during the regulatory control period 2015-20 to both the forecast capital expenditure and the forecast capital contributions for each year of the regulatory control period 2015-20, the PTRM removes the contributed and gifted assets from large customer connections in calculating the net capital expenditure in rows 144 to 173 of the input tab. Only the standard control services net capital expenditure is used to calculate the return on and depreciation allowance for standard control services.

03.01.01 – Ergon Energy’s Building Block Components 33
7 Revenue increments/decrements
This chapter sets out the revenue increments and decrements that form part of our building block revenue requirement for Standard Control Services. Clause 6.4.3(a) of the NER outlines the following revenue increments and decrements:
(5) the revenue increments or decrements (if any) for that year arising from the application of any efficiency benefit sharing scheme, capital expenditure sharing scheme, service target performance incentive scheme, demand management and embedded generation connection incentive scheme or small-scale incentive scheme – see subparagraph (b)(5);
(6) the other revenue increments or decrements (if any) for that year arising from the application of a control mechanism in the previous regulatory control period – see paragraph (b)(6);
(6A) the revenue decrements (if any) for that year arising from the use of assets that provide standard control services to provide certain other services – see subparagraph (b)(6A); and
The table below summarises the ARR impacts during the regulatory control period 2015-20 as a result of these revenue increments and decrements contemplated by clause 6.4.3(a)(5):
Table 18: Ergon Energy’s revenue increments and decrements included in the ARR for 2015-20
$m (nominal) 2015-16 2016-17 2017-18 2018-19 2019-20
EBSS (2010-15) 37.54 55.09 79.67 (18.43) -
DMIS (Part A, DMIA) 2015-20 1.00 1.00 1.00 1.00 1.00
STPIS (2010-15) 30.22 - - - -
DMIS carryover (2010-15) - (1.98) - - -
The EBSS and DMIS (Part A, DMIA) revenue increments are included in the unsmoothed building block revenue calculation in the PTRM, while the STPIS and DMIS carryover amounts are not included in the PTRM as adjustments are made to the ARR during the annual pricing proposal process.
The table below summarises the ARR impacts during the regulatory control period 2015-20 as a result of the revenue increments and decrements contemplated by clause 6.4.3(a)(6):
Table 19: Ergon Energy’s other building block revenue increments and decrements for 2015-20
$m (nominal) 2015-16 2016-17 2017-18 2018-19 2019-20
Included in building block calculation
Residual DUOS unders and overs account balance as at 30 June 2015 58.57 - - - -
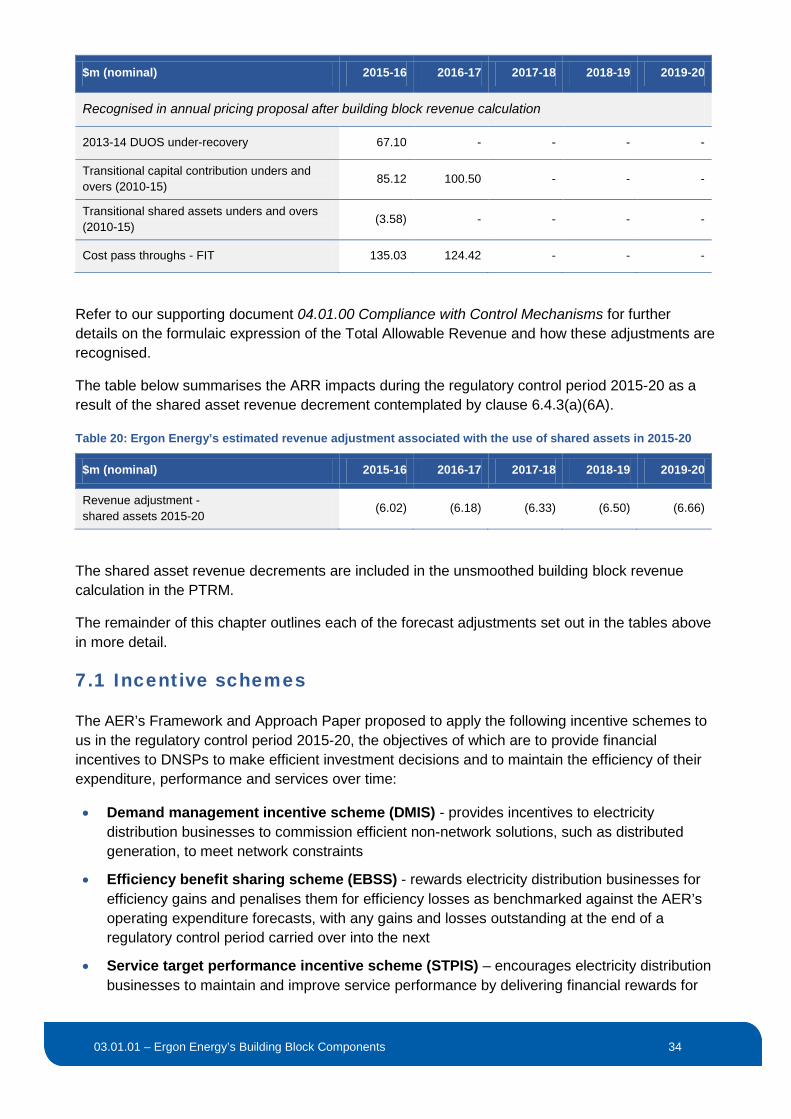
03.01.01 – Ergon Energy’s Building Block Components 34
$m (nominal) 2015-16 2016-17 2017-18 2018-19 2019-20
Recognised in annual pricing proposal after building block revenue calculation
2013-14 DUOS under-recovery 67.10 - - - -
Transitional capital contribution unders and overs (2010-15) 85.12 100.50 - - -
Transitional shared assets unders and overs (2010-15)
(3.58) - - - -
Cost pass throughs - FIT 135.03 124.42 - - -
Refer to our supporting document 04.01.00 Compliance with Control Mechanisms for further details on the formulaic expression of the Total Allowable Revenue and how these adjustments are recognised.
The table below summarises the ARR impacts during the regulatory control period 2015-20 as a result of the shared asset revenue decrement contemplated by clause 6.4.3(a)(6A).
Table 20: Ergon Energy’s estimated revenue adjustment associated with the use of shared assets in 2015-20
$m (nominal) 2015-16 2016-17 2017-18 2018-19 2019-20
Revenue adjustment - shared assets 2015-20
(6.02) (6.18) (6.33) (6.50) (6.66)
The shared asset revenue decrements are included in the unsmoothed building block revenue calculation in the PTRM.
The remainder of this chapter outlines each of the forecast adjustments set out in the tables above in more detail.
7.1 Incentive schemes
The AER’s Framework and Approach Paper proposed to apply the following incentive schemes to us in the regulatory control period 2015-20, the objectives of which are to provide financial incentives to DNSPs to make efficient investment decisions and to maintain the efficiency of their expenditure, performance and services over time:
• Demand management incentive scheme (DMIS) - provides incentives to electricity distribution businesses to commission efficient non-network solutions, such as distributed generation, to meet network constraints
• Efficiency benefit sharing scheme (EBSS) - rewards electricity distribution businesses for efficiency gains and penalises them for efficiency losses as benchmarked against the AER’s operating expenditure forecasts, with any gains and losses outstanding at the end of a regulatory control period carried over into the next
• Service target performance incentive scheme (STPIS) – encourages electricity distribution businesses to maintain and improve service performance by delivering financial rewards for

03.01.01 – Ergon Energy’s Building Block Components 35
out-performance or by imposing financial penalties for under-performance against historical service standard data
• Capital Expenditure Sharing Scheme (CESS) – rewards electricity distribution businesses for underspends and penalises them for overspends as benchmarked against their capital expenditure program approved by the AER for the regulatory control period, with AER able to require gains and losses outstanding at the end of a regulatory control period to be carried over into the next. The CESS also allows the AER to undertake an ex-post review of capital works where an electricity distribution business overspends its capital allowance and adjust the Standard Control Service RAB for imprudent or inefficient capital costs.
• Small Scale Incentive Scheme (SSIS) – the AER can apply an incentive scheme to an electricity distribution business as part of a regulatory determination. Unlike the other incentive schemes it would apply to only that business.
The remainder of this section sets out at a high level:
• How each incentive scheme was applied during the regulatory control period 2010-15 (where applicable)
• How each incentive scheme will be applied during the regulatory control period 2015-20 (where applicable)
• The forecast annual revenue impact of the schemes on the ARR for the regulatory control period 2015-20
The remainder of this section therefore sets out the outworking of the regulatory control period 2010-15 incentive schemes. A more detailed explanation of the calculations supporting these incentive scheme adjustment values is provided in 03.01.03 Application of Incentive Schemes.
7.1.1 Efficiency Benefit Sharing Scheme
The EBSS seeks to provide a financial incentive for us to improve the efficiency of our operating expenditure and to share any resulting efficiency gains (or losses) with customers. Any efficiency gains (or losses) are retained by us for five years after the gain (or loss) is realised. This means the EBSS revenue adjustment in the next regulatory control period relates to performance under the EBSS in the current regulatory control period.
In the first two to three years of the current control period we overspent our operating allowance for EBSS but have turned this around in the third/fourth year and we are estimating a further reduction in operating costs in the fifth year.
EBSS applied in current regulatory control period
The EBSS applied in the regulatory control period 2010-15 will impact the ARR values in the regulatory control period 2015-20. These revenue increments form part of the Carryover Amounts in the PTRM and are ultimately included in the unsmoothed revenue calculation. The table below sets out the annual revenue adjustments in the regulatory control period 2015-20 as a result of the operation of the EBSS during the regulatory control period 2010-15:

03.01.01 – Ergon Energy’s Building Block Components 36
Table 21: Ergon Energy’s forecast revenue adjustments associated with EBSS, 2015-20 ($M nominal)
2015-16 2016-17 2017-18 2018-19 2019-20
EBSS Adjustments 37.54 55.09 79.67 (18.43) -
Further detail is provided in our supporting document 03.01.03 Application of Incentive Schemes on the operating expenditure outcomes that give rise to the ARR adjustments set out in the table above.
EBSS for the next regulatory control period
The EBSS to be applied in the regulatory control period 2015-20 will impact the ARR in the regulatory control period 2020-25 only, and hence will have no impact on the regulatory control period 2015-20.
We are not proposing any changes to the operation or application of the EBSS in the regulatory control period 2015-20 from that set out by the AER in its Framework and Approach.
7.1.2 Service Target Performance Incentive Scheme (STPIS)
The STPIS rewards us when we improve average service to customers and penalises us for a reduction in average service to customers. The rewards or penalties are applied by adjusting the amount of allowed revenue in a year in accordance with the mechanism set out in the distribution determination and the relevant STPIS guidelines. We currently have a maximum reward or penalty of +/-2% of our allowed annual revenues in the regulatory control period 2010-15 and this will remain at +/-2% in the regulatory control period 2015-20.
STPIS applied in current regulatory control period
As set out in our supporting document 03.01.03 Application of Incentive Schemes, the following table summarises the forecast revenue adjustments likely to occur as a result of the operation of the STPIS in 2013-14. These revenue increments are not included in the PTRM as adjustments are made to the ARR during the annual pricing proposal process:
Table 22: Ergon Energy’s forecast revenue adjustments associated with STPIS, 2015-20 ($M nominal)
2015-16 2016-17 2017-18 2018-19 2019-20
STPIS revenue adjustments from regulatory control period 2010-15
30.22 - - - -
STPIS for the next regulatory control period
Our supporting document 03.02.02 Proposed Application of STPIS for the regulatory control period 2015-20 sets out our proposed STPIS targets for the regulatory control period 2015-20.
We have not forecast revenue adjustments due to the operation of the STPIS within the regulatory control period 2015-20. This is because we plan and operate our network in such a way as to

03.01.01 – Ergon Energy’s Building Block Components 37
meet the STPIS targets each year and does not specifically target higher or lower performance relative to these STPIS targets. Meeting the STPIS targets would result in no revenue adjustments under the operation of the STPIS and for this reason, no revenue adjustments due to the STPIS in the regulatory control period 2015-20 have been forecast.
7.1.3 Demand Management Incentive Scheme
The DMIS seeks to provide incentives to us to implement efficient non-network alternatives for managing expected demand on the network and efficiently connect embedded generators. In its Framework and Approach Paper, the AER proposed to apply Part A of the DMIS in the next regulatory control period (i.e. the Demand Management Innovation Allowance (DMIA)). Consistent with the Framework and Approach Paper, we have proposed a total DMIA allowance of $5 million over the next regulatory control period.
7.1.3.1 DMIS applied in current regulatory control period
As set out in our supporting document 03.01.03 Application of Incentive Schemes, the following table summarises the regulatory control period 2010-15 actual and estimated DMIA expenditure:
Table 23: Ergon Energy’s actual and estimated revenue adjustments associated with DMIS, 2010-15 (nominal dollars)
2010-11 2011-12 2012-13 2013-14 2014-15
DMIS (Part A, DMIA) 0.50 0.58 0.93 0.87 1.00
7.1.3.2 DMIS Carryover from the current regulatory control period
In accordance with the Total Allowable Revenue formulas set out in our supporting documents 04.01.00 Compliance with Control Mechanisms and 04.01.05 Control Mechanism Model, the DMIS carryover amount from the regulatory control period 2010-15 is presented in the table below. These revenue decrements are not included in the PTRM as adjustments are made to the ARR during the annual pricing proposal process.
Table 24: Ergon Energy’s estimated revenue decrements from the DMIS carryover, 2015-20 ($M nominal)
2015-16 2016-17 2017-18 2018-19 2019-20
DMIS carryover (2010-15) - (1.98) - - -
Refer to our supporting documents 04.01.00 Compliance with Control Mechanisms and 04.01.05 Control Mechanism Model for further details on the calculation and application of the DMIS Carryover from the regulatory control period 2010-15.
No further adjustments to the Total Allowable Revenue for this DMIS Carryover will occur during the regulatory control period 2015-20.

03.01.01 – Ergon Energy’s Building Block Components 38
7.1.3.3 DMIS for the next regulatory control period
The AER noted in its Framework and Approach Paper that it may develop and implement a new DMIS during the next regulatory control period, depending on the progress of the AEMC Power of Choice rule change process. For these reasons, the AER has proposed to allow a $5 million DMIA ($1 million each year), consistent with our scheme allowance under the current regulatory control period. These revenue increments form part of our forecast operating expenditure in the PTRM and are ultimately included in the unsmoothed building block revenue calculation.
The following table summarises the revenue adjustments included in the ARR for the DMIS for the regulatory control period 2015-20:
Table 25: Ergon Energy’s forecast revenue adjustments associated with DMIS, 2015-20 ($M nominal)
2015-16 2016-17 2017-18 2018-19 2019-20
DMIS (Part A, DMIA) 1.00 1.00 1.00 1.00 1.00
Further detail is provided in our supporting document 03.01.03 Application of Incentive Schemes.
7.1.4 Capital Expenditure Sharing Scheme
We note that the Capital Expenditure Sharing Scheme will not apply for the regulatory control period 2015-20 and as such has not been incorporated in the development of the proposed ARR building blocks for the regulatory control period 2015-20.
7.1.5 Small scale Incentive Scheme
We note that the Small Scale Incentive Scheme will not apply for the regulatory control period 2015-20 and as such has not been incorporated in the development of the proposed ARR building blocks for the regulatory control period 2015-20.
7.2 Adjustments from the application of the control mechanisms in the current regulatory control period
This section sets out the forecast revenue increments and decrements arising from the application of the control mechanism in place for the regulatory control period 2010-15, in accordance with clause 6.4.3(a)(6) of the NER.
7.2.1 Clearing the 2013-14 DUOS under-recovery
As noted in our supporting document 04.01.00 Compliance with Control Mechanisms, we propose to clear the entire 2013-14 DUOS under-recovery as a $67.1 million adjustment in the Total Allowed Revenue calculation, as set out in the table below:

03.01.01 – Ergon Energy’s Building Block Components 39
Table 26: Ergon Energy’s estimated revenue increments for clearing the 2013-14 under-recovery ($M nominal)
2015-16 2016-17 2017-18 2018-19 2019-20
2013-14 DUOS Under-recovery adjustment 67.10 - - - -
Note that this adjustment is not a carryover adjustment made in the PTRM. Further detail is provided in our supporting document 04.01.00 Compliance with Control Mechanisms.
7.2.2 Clearing the residual DUOS unders and overs account balance
Consistent with the approved 2014-15 Pricing Proposal, we propose to clear the residual balance left in our DUOS unders and overs account as at 30 June 2015 as a carry forward adjustment in the PTRM. Specifically, the carry forward amount included in the PTRM includes a value of $58.57 million (nominal) in 2015-16 as set out in the table below:
Table 27: Ergon Energy’s estimated revenue increments for clearing unders and overs, 2015-20 ($M nominal)
2015-16 2016-17 2017-18 2018-19 2019-20
DUOS Unders and Overs (2010-15) 58.57 - - - -
Further detail is provided in our supporting documents 03.01.02 Other Revenue Adjustments, 04.01.00 Compliance with Control Mechanisms and 04.01.05 Control Mechanism Model.
7.2.3 DUOS unders and overs in the regulatory control period 2015-20
We note that the adjustments described above only account for the unders and overs balance that has accumulated to date in the regulatory control period 2010-15. Adjustments for any unders and overs arising from the application of the control mechanism in the regulatory control period 2015-20 will be managed as per the proposed approach set out in Chapter 4 of the Regulatory Proposal. These revenue increments and decrements do not form part of the Carryover Amounts in the PTRM and are ultimately excluded in the unsmoothed revenue calculation.
7.2.4 Transitional capital contribution unders and overs
In accordance with the Total Allowable Revenue formula set out in supporting documents 04.01.00 Compliance with Control Mechanisms and 04.01.05 Control Mechanism Model, the actual under or over-recovery of capital contributions revenue (compared to forecast in AER’s 2010 Distribution Determination) is presented in the table below. These revenue increments are not included in the PTRM as adjustments are made to the ARR during the annual pricing proposal process.
Table 28: Ergon Energy’s estimated revenue increments for clearing transitional capital contribution unders and overs, 2015-20 ($M nominal)
2015-16 2016-17 2017-18 2018-19 2019-20
Transitional capital contribution unders and overs (2010-15)
85.12 100.50 - - -

03.01.01 – Ergon Energy’s Building Block Components 40
Refer to our supporting documents 04.01.00 Compliance with Control Mechanisms and 04.01.05 Control Mechanism Model for further details on the calculation and application of the Transitional capital contribution unders and overs from the regulatory control period 2010-15 and the regulatory control period 2015-20.
As this adjustment is as a result of a transitional arrangement from the regulatory control period 2010-15, no further adjustments to the Total Allowable Revenue for the clearing of transitional capital contribution unders and overs will occur during the regulatory control period 2015-20.
7.2.5 Transitional shared assets unders and overs
In accordance with the Total Allowable Revenue formula set out in our supporting documents 04.01.00 Compliance with Control Mechanisms and 04.01.05 Control Mechanism Model, the actual under or over-recovery of shared asset revenue (compared to forecast in AER’s 2010 Distribution Determination) is presented in the table below. These revenue decrements are not included in the PTRM as adjustments are made to the ARR during the annual pricing proposal process.
Table 29: Ergon Energy’s estimated revenue decrements for clearing transitional shared assets unders and overs, 2015-20 ($M nominal)
2015-16 2016-17 2017-18 2018-19 2019-20
Transitional shared assets unders and overs (2010-15)
(3.58) - - - -
Refer to our supporting documents 04.01.00 Compliance with Control Mechanisms and 04.01.05 Control Mechanism Model for further details on the calculation and application of the transitional shared assets unders and overs from the regulatory control period 2010-15 and the regulatory control period 2015-20.
As this adjustment is as a result of a transitional arrangement from the regulatory control period 2010-15, no further adjustments to the Total Allowable Revenue for the clearing of transitional shared assets unders and overs will occur during the regulatory control period 2015-20.
7.2.6 Cost Pass-Through – Feed in Tariffs
In accordance with the Total Allowable Revenue formulas set out in our supporting documents 04.01.00 Compliance with Control Mechanisms and 04.01.05 Control Mechanism Model, the cost pass-through amounts as a result of the Feed-in Tariff Cost Pass-through that occurred during the regulatory control period 2010-15 is presented in the table below. These revenue increments are not included in the PTRM as adjustments are made to the ARR during the annual pricing proposal process.
Table 30: Ergon Energy’s estimated revenue increments for clearing transitional shared assets unders and overs, 2015-20 ($M nominal)
2015-16 2016-17 2017-18 2018-19 2019-20
Cost Pass-throughs – Feed in Tariffs 135.03 124.42 - - -

03.01.01 – Ergon Energy’s Building Block Components 41
Refer to our supporting documents 04.01.00 Compliance with Control Mechanisms and 04.01.05 Control Mechanism Model for further details on the calculation and application of the Feed-in Tariff cost pass-through from the regulatory control period 2010-15.
No further adjustments to the Total Allowable Revenue for this Feed-In Tariff cost pass-through will occur during the regulatory control period 2015-20. Refer to our supporting document 04.01.02 Jurisdictional Schemes for details on the recovery of Feed-In Tariff costs in the regulatory control period 2015-20.
7.3 Shared assets
As noted in 03.01.02 Other Revenue Adjustments, the proposed revenue adjustment for the regulatory control period 2015-20 is the sum of:
• The control for 2012-13 calculated in accordance with the AER’s Shared Assets Guideline for the assets used to provide Unregulated Services, and
• The 2012-13 adjustment calculated by us for the assets used to provide Alternative Control Services
The resulting sum is indexed using the forecast inflation rate. These revenue increments form inputs to the PTRM and are ultimately included in the unsmoothed building block revenue calculation. The following table summarises the proposed revenue adjustments (decrements) resulting from the use of shared assets for the regulatory control period 2015-20.
Table 31: Ergon Energy’s adjustment for shared assets for 2015-20 ($M nominal)
2015-16 2016-17 2017-18 2018-19 2019-20
Total Revenue Adjustment (6.02) (6.18) (6.33) (6.50) (6.66)
Further detail is provided in our supporting document 03.01.02 Other Revenue Adjustments.

03.01.01 – Ergon Energy’s Building Block Components 42
8 Annual revenue requirement
The table below provides a summary of the total (unsmoothed) ARR, the ARR building blocks and the X factors / smoothed ARR for each year of the regulatory control period 2015-20:
Table 32: Ergon Energy’s ARR for 2015-20 ($M nominal)
2015-16 2016-17 2017-18 2018-19 2019-20
Return on capital 804.93 853.84 900.46 941.73 986.89
plus Regulatory Depreciation 173.53 191.70 207.66 160.77 170.28
plus Operating expenditure 370.45 387.20 405.65 426.61 444.78
plus Corporate income tax 115.74 122.26 131.50 123.58 128.33
plus Revenue adjustments 90.08 48.92 73.34 (24.92) (6.66)
Building Block Revenue (unsmoothed) 1,554.74 1,603.92 1,718.60 1,627.77 1,723.61
ARR (smoothed) 1,511.09 1,598.46 1,703.82 1,710.69 1,717.60
X Factors 15.85% (3.13%) (3.92%) 2.11% 2.11%
With the exception of the X factors for 2016-17 through to 2019-20 inclusive, the values set out in the table were calculated using the AER’s PTRM and we therefore do not consider these calculations to be a departure from the AER’s underlying methods and calculations for determining the unsmoothed and smoothed ARR values.
8.1 Comparison to forecast annual revenue requirement for regulatory control period 2010-15
We have examined the differences between the forecast ARR building blocks from the regulatory control period 2010-15 and the regulatory control period 2015-20. In order to do so, the forecast ARR building blocks from the regulatory control period 2010-15 were escalated to 2014-15 dollars and the forecast ARR building blocks from the regulatory control period 2015-20 were de-escalated to 2014-15 dollars.
The table below sets out the total ARR for the regulatory control periods 2010-15 and 2015-20 (in real 2014-15 dollars to allow comparison), and the differences in each of the forecast ARR building blocks between the regulatory control periods 2010-15 and 2015-20:

03.01.01 – Ergon Energy’s Building Block Components 43
Table 33: Difference in Standard Control Services building blocks between regulatory control period 2010-15 and 2015-20 (real 2014-15 $M)
Building Block Differences between regulatory control periods
Total Revenue
Total ARR Regulatory Control Period 2010-15 7,113.17
Difference in Return on capital (426.40)
Difference in Regulatory Depreciation 49.40
Difference in Operating expenditure (171.14)
Difference in Corporate income tax 226.47
Difference in Revenue adjustments 830.36
Total ARR Regulatory Control Period 2010-15 7.621.86
The following waterfall chart depicts these differences graphically:
The changes associated with each Standard Control Service building block are briefly explained below:
• The reduction in the return on asset is largely due to the lower nominal vanilla WACC of 8.02% (compared to the 9.72% nominal vanilla WACC in the regulatory control period 2010-15)

03.01.01 – Ergon Energy’s Building Block Components 44
• The reduction in operating expenditure is due to lower operating expenditure forecasts for the regulatory control period 2015-20 compared to that forecast for the regulatory control period 2010-15
• The increase in the regulatory depreciation is largely due to the larger RAB in the regulatory control period 2015-20
• The increase in the corporate income tax is largely due to: o The lower operating expenditure and interest expense (the return on debt rate is
lower) in the regulatory control period 2015-20 o Higher capital contributions in the regulatory control period 2015-20 o No tax loss carried forward in the regulatory control period 2015-20
• The difference in total revenue adjustments consists of: o The cessation of the transitional arrangement for the treatment of capital
contributions as described in section 2.1.2.2. As of 1 July 2015, we will no longer retain the value of contributed assets in the RAB and therefore will no longer deduct the value of capital contributions from the ARR upfront. The majority of the increase in revenue adjustments is due to the apparent uplift associated with the removal of the upfront revenue deduction.
o Higher shared assets adjustments o Higher carryover amounts from the regulatory control period 2010-15 (including
DUOS unders and overs)
8.2 Departures
The NER requires that the building block proposal be prepared in accordance with the PTRM and other relevant requirements of Part C5. We also note that:
• The current AER PTRM was developed in June 2008 • There have been numerous changes to the NER since that time • Most importantly there were changes to the NER made in 2012 that materially impacted
the calculation of regulated revenues
On 29 May 2014, AER officers provided us with an updated (“Version 02 Adjusted”) PTRM. This updated PTRM included important changes which would make the PTRM consistent with Part C of the NER. While the AER noted the Version 02 Adjusted PTRM was not a formally issued PTRM that had been through the normal consultation process, the AER noted it was keen to fast-track the process for the acceptance of the updated PTRM as the new model.
Therefore, for the purposes of the regulatory submission, we have populated both the AER’s current PTRM in accordance with the AER’s PTRM Guidelines, and the Version 02 Adjusted PTRM (which differs from the AER’s current PTRM published on the AER’s website).
We have chosen to populate the Version 02 Adjusted PTRM because it embodies the trailing average cost of debt calculations (and the relevant inputs required for this calculation) to ensure compliance with clause 6.5.2(i) (2) of the NER. This provision of the NER states that:
5 NER Clause 6.3.1(c)(1)
03.01.01 – Ergon Energy’s Building Block Components 45
The return on debt may be estimated using a methodology which results in…the return on debt (and consequently the allowed rate of return) being, or potentially being, different for different regulatory years in the regulatory control period.
The Version 02 Adjusted PTRM also contains slightly different WACC calculations to those in the AER’s current PTRM. These relate to:
• The Nominal Pre-Tax Cost of Debt (Rd), which was a calculated value in the AER’s current PTRM, but is a user input in the Version 02 Adjusted PTRM
• The Post-tax Nominal Return on Equity (pre-imp) calculation, which is now rounded to one decimal place in the Version 02 Adjusted PTRM
To ensure consistency between the outcomes of the AER’s current PTRM and the Version 02 Adjusted PTRM, we have made some minor adjustments to the Nominal Pre-Tax Cost of Debt (Rd) calculation and the Post-tax Nominal Return on Equity (pre-imp) calculation in the AER’s current PTRM to ensure that the WACC value calculated exactly aligns with the WACC calculated in the Version 02 Adjusted PTRM.
Whilst the use of the Version 02 Adjusted PTRM may represent a departure from the AER’s current PTRM in accordance with Schedule 1 Clause 28.2 of the Reset RIN, we consider that the population and submission of the AER’s current PTRM in support of the regulatory proposal submission means that we have not departed from the AER’s current PTRM for the purposes of the regulatory proposal submission. Further, as clause 6.3.1(c)(1) of the NER requires us to prepare a building block in accordance with both the AER’s current PTRM and Part C of the NER (which includes clause 6.5.2), submission of the two PTRMs better allows us to meet the requirements of the NER.

03.01.01 – Ergon Energy’s Building Block Components 46
9 X factors
9.1 Relevant NER requirements
Clause 6.5.9 of the NER requires that:
(a) A building block determination is to include the X factor for each control mechanism for each regulatory year of the regulatory control period.
(b) The X factor:
(1) Must be set by the AER with regard to our total revenue requirement for the regulatory control period
(2) Must be such as to minimise, as far as reasonably possible, variance between expected revenue for the last regulatory year of the regulatory control period and the annual revenue requirement for that last regulatory year, and
(3) Must conform with whichever of the following requirements is applicable: (i) If the control mechanism relates generally to Standard Control Services – the X
factor must be designed to equalise (in terms of net present value) the revenue to be earned by us from the provision of Standard Control Services over the regulatory control period with our total revenue requirement for the regulatory control period
(ii) If there are separate control mechanisms for different Standard Control Services – the X factor for each control mechanism must be designed to equalise (in terms of net present value) the revenue to be earned by us from the provision of Standard Control Services to which the control mechanism relates over the regulatory control period with the portion of our total revenue requirement for the regulatory control period attributable to those services.
(c) There may be different X factors:
(1) For different regulatory years of the regulatory control period, and (2) If there are 2 or more control mechanisms – for each control mechanism.
We note that clause 6.5.9(2) does not apply for the regulatory control period 2015-20 due to the operation of transitional arrangements currently in place for us. Nevertheless, we have aimed to align our X factors in such a way as to achieve this requirement to the extent practicable in the regulatory control period 2015-20.
The following section sets out how our X Factor values are calculated and are consistent with the requirements of clause 6.5.9 of the NER.
9.2 X Factor Calculations – Standard Control Services
In order to determine the X Factors for each year of the regulatory control period 2015-20, the 2014-15 annual revenue value first needed to be determined. The Maximum Allowable Revenue (MAR) value for 2014-15 ($1750.8 million) was determined using the formula:
MAR2014-15 = AR2013-14 x (1+∆CPI2014-15) x (1-X2014-15) + S2014-15 + C2014-15 + Transitional2014-15 + Passthrough2014-15

03.01.01 – Ergon Energy’s Building Block Components 47
Where:
• AR2013-14 = $1,501.09 million as approved by the AER in 2013-14
• (1+∆CPI2014-15) = 1.0293 based on the December to December CPI value for 8 cities published on the Australian Bureau of Statistics website on 23 April 2014
• (1-X2014-15) = 1.0187 based on the X4 value in the merits review decision
• S2014-15 = $31.48 million based on the result of the formula S2014-15 = AR2014-15 x (1 + S factor in 2012-13) - AR2014-15 , an S factor of 2% in 2012-13 and AR2014-15 = AR2013-14 x (1+∆CPI2014-
15) x (1-X2014-15)
• C2014-15 = $63.65 million transitional capital contribution under recovery as reported in the 2012-13 RIN
• Transitional2014-15 = $2.34 million as reported in the 2012-13 RIN
• Passthrough2014-15 = $84.02 million for the Feed-in Tariff cost pass through approved by the AER
This is consistent with the MAR used in the 2014-15 annual pricing proposal approved by the AER.
The value of X1 to X4 were calculated in such a way as to allow us to achieve a targeted revenue outcome which comprises the ARR values as calculated by the PTRM and other revenue allowances (not determined using the PTRM) that we need to recover. The other revenue allowances include:
• STPIS
• DMIS
• DUOS unders and overs
• Transitional capital contribution unders and overs
• Transitional shared assets unders and overs The table below sets out the smoothed ARR values as calculated by the PTRM and other revenue allowances (not determined using the PTRM) for 2014-15 and for each year of the regulatory control period 2015-20. The sum of these revenues gives the total ‘targeted’ revenue for each regulatory year, which represents the Distribution Use of System (DUOS) charges less the Feed-in Tariff allowance:
Table 34: Ergon Energy’s annual ‘targeted’ revenue requirement for 2015-20 ($M nominal)
2015-16 2016-17 2017-18 2018-19 2019-20
ARR (smoothed) 1,511.09 1,598.46 1,703.82 1,710.69 1,717.60
plus Other revenue allowances (excluding the Feed-in Tariff Cost Pass-through)
178.87 98.52 - - -
Targeted Revenue (excluding the Feed-in Tariff Cost Pass-through) 1,689.96 1,696.98 1,703.82 1,710.69 1,717.60
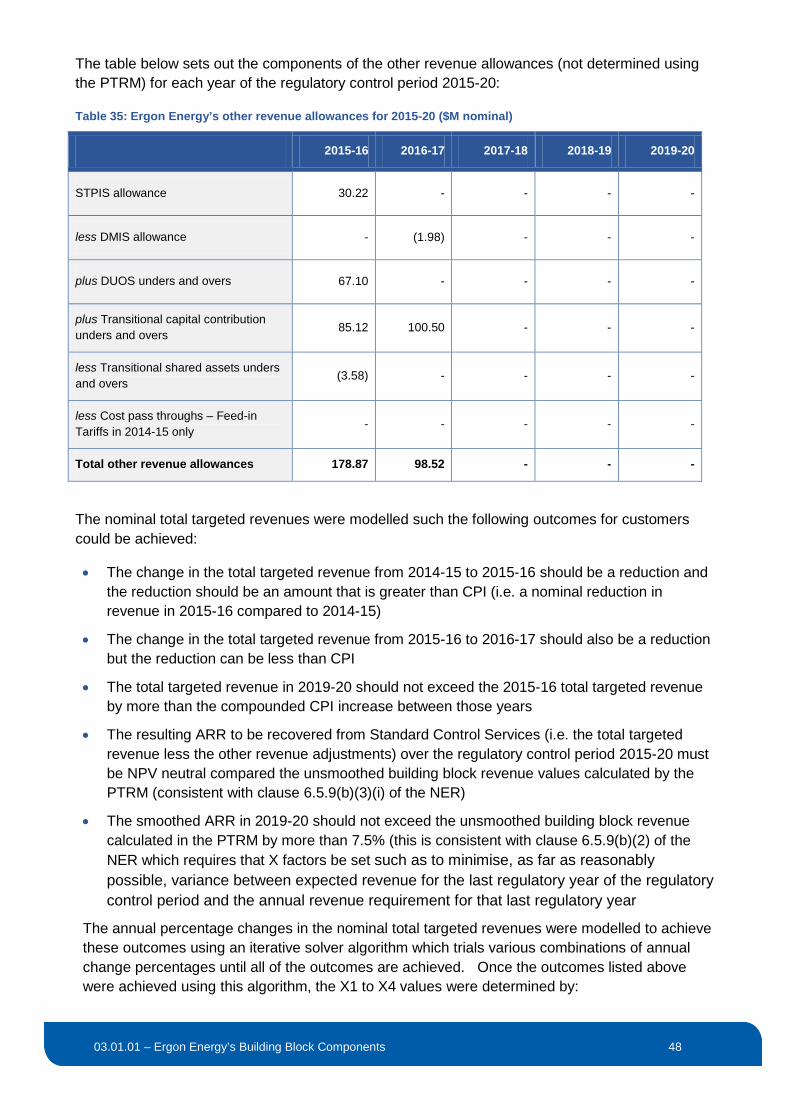
03.01.01 – Ergon Energy’s Building Block Components 48
The table below sets out the components of the other revenue allowances (not determined using the PTRM) for each year of the regulatory control period 2015-20:
Table 35: Ergon Energy’s other revenue allowances for 2015-20 ($M nominal)
2015-16 2016-17 2017-18 2018-19 2019-20
STPIS allowance 30.22 - - - -
less DMIS allowance - (1.98) - - -
plus DUOS unders and overs 67.10 - - - -
plus Transitional capital contribution unders and overs 85.12 100.50 - - -
less Transitional shared assets unders and overs
(3.58) - - - -
less Cost pass throughs – Feed-in Tariffs in 2014-15 only - - - - -
Total other revenue allowances 178.87 98.52 - - -
The nominal total targeted revenues were modelled such the following outcomes for customers could be achieved:
• The change in the total targeted revenue from 2014-15 to 2015-16 should be a reduction and the reduction should be an amount that is greater than CPI (i.e. a nominal reduction in revenue in 2015-16 compared to 2014-15)
• The change in the total targeted revenue from 2015-16 to 2016-17 should also be a reduction but the reduction can be less than CPI
• The total targeted revenue in 2019-20 should not exceed the 2015-16 total targeted revenue by more than the compounded CPI increase between those years
• The resulting ARR to be recovered from Standard Control Services (i.e. the total targeted revenue less the other revenue adjustments) over the regulatory control period 2015-20 must be NPV neutral compared the unsmoothed building block revenue values calculated by the PTRM (consistent with clause 6.5.9(b)(3)(i) of the NER)
• The smoothed ARR in 2019-20 should not exceed the unsmoothed building block revenue calculated in the PTRM by more than 7.5% (this is consistent with clause 6.5.9(b)(2) of the NER which requires that X factors be set such as to minimise, as far as reasonably possible, variance between expected revenue for the last regulatory year of the regulatory control period and the annual revenue requirement for that last regulatory year
The annual percentage changes in the nominal total targeted revenues were modelled to achieve these outcomes using an iterative solver algorithm which trials various combinations of annual change percentages until all of the outcomes are achieved. Once the outcomes listed above were achieved using this algorithm, the X1 to X4 values were determined by:

03.01.01 – Ergon Energy’s Building Block Components 49
• Deducting the other revenue allowances from the nominal total targeted revenues in each regulatory year of the regulatory control period 2015-20. The resulting values represent the ‘smoothed’ ARR values (in nominal terms) that need to be achieved from the PTRM in order for the total targeted revenue values to be achieved
• Determining the real X factor percentages that give rise to the ‘smoothed’ ARR values for each regulatory year of the regulatory control period 2015-20, taking into account the forecast CPI values for each regulatory year
The table below sets out the resulting X factors calculated using this methodology (consistent with clause 6.5.9(c)(i) of the NER):
Table 36: Ergon Energy’s X factor values calculated for 2015-20 ($M nominal)
2015-16 2016-17 2017-18 2018-19 2019-20
X Factors 15.85% (3.13%) (3.92%) 2.11% 2.11%

03.01.01 – Ergon Energy’s Building Block Components 50
10 List of documents referenced
Reference Title
Document 03.01.02 Other Revenue Adjustments
Document 03.01.03 Application of Incentives Schemes
Document 03.02.02 Proposed Application of STPIS
Summary 7.00.03 Customer Initiated Capital Works Expenditure Forecast Summary
Document 04.01.00 Compliance with Control Mechanisms
Document 04.01.02 Jurisdictional Schemes
Model 04.01.05 Control Mechanism Model
Summary 05.03.01 Default Metering Services Summary
Document 06.01.01 Forecast Expenditure Summary – Operating Costs