eric hatch christina haubrock melissa hickey november 3, 2009
TRANSCRIPT

Eric HatchChristina Haubrock
Melissa Hickey
November 3, 2009

Industrials Sector Overview Economic & Business Analysis Financial Analysis Valuation & Recommendation

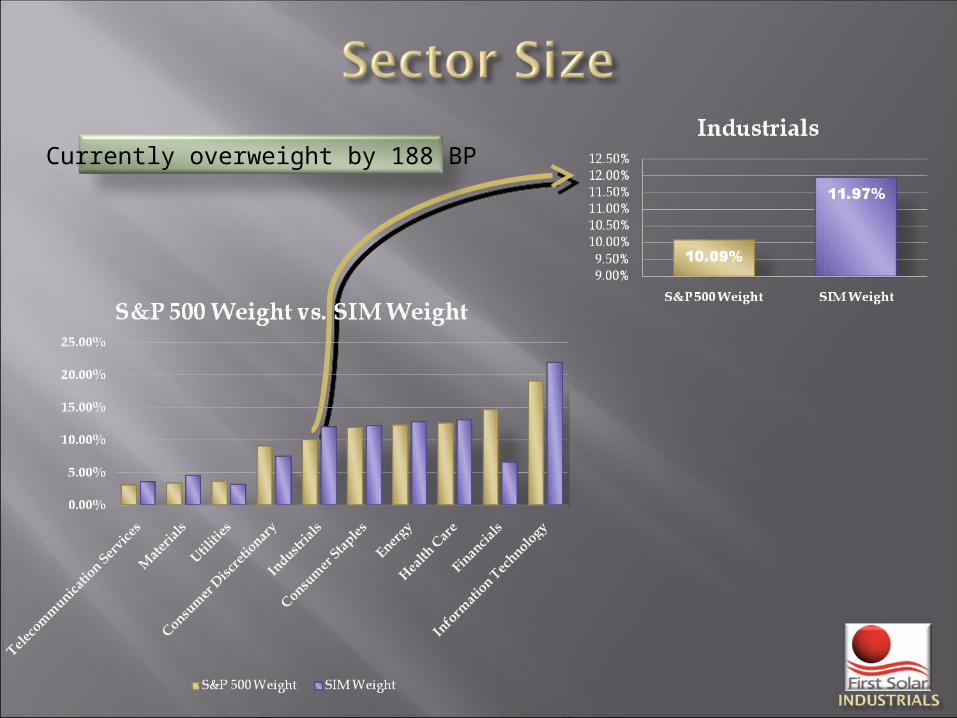
Currently overweight by 188 BP

Capital Goods
Aerospace & Defense
Building Products
Construction & Engineering
Electrical Equipment
Industrial Conglomerates
Machinery
Trading Companies & Distributors
Commercial & Professional Services Commercial Services & Supplies
Professional Services
Transportation
Air Freight & Logistics
Airlines
Marine
Road & Rail
Transportation Infrastructure

SIM OWNED COMPANIES Emerson Electric Co. Capital Goods EMR
First Solar Inc. Capital Goods FSLR
General Electric Co. Capital Goods GE
Oshkosh Truck Corp. Capital Goods OSK
UTI Worldwide Inc. Transportation UTIW
Industrials
# of
Companies% of
Industry% of SIM Portfolio
Transportation 61 19.70% 17.99%Commercial & Professional
Services 96 4.90% 0.00%
Capital Goods 248 75.40% 82.01%


Capital Goods: Capital spending tends to increase midway through the business cycle, as the economy is heating up and higher demand for products leads companies to expand their production capacity. Demand in global export markets is key for agricultural equipment, industrial machinery, and machine tools. http://personal.fidelity.com/products/funds/content/sector/cycle.shtml#7

The Industrials industry as a whole can be placed in the Maturity phase. Companies in the maturity phase can have new product lines that exist in the
Introduction or Growth phases (Oshkosh). Other companies within the sector can be in the Introduction or Growth phase
(First Solar). Many mature companies can be entering large, untapped growth markets
internationally (Emerson or GE).

Outlook for U.S. Industrial activity much better for the rest of ’09 and into ’10 (Morningstar Q4 Outlook 9/30/09).
ISM purchasing managers survey: ratio of new orders to inventories indicates industrial production will be materially higher.
Ratio’s highest point in 30 years. Been at this level only 10 out of 740 months measured.
The Fed Beige Book offers mixed expectations for near-term outlook on manufacturing (10/21/09).
Expecting slight gains and modest economic growth. Deferred projects and maintenance to conserve capital. Increasing optimism leading to more new hires and
increased spending on capital goods.


The Industrials sector is strongly correlated with the S&P 500, real GDP, commercial and industrial loans, and durable goods orders.
Industrials appear to be correlated to Capital Spending with the sector acting as a leading indicator by approximately 6 months.
Don’t wait for Capital Spending to completely return before jumping on board Industrials?


High 30.86Low 16.39
Median 20.70Current 30.44

Absolute Net Profit Margin
High 8.40%
Low 6.40%
Median 7.10%
Current 6.90%
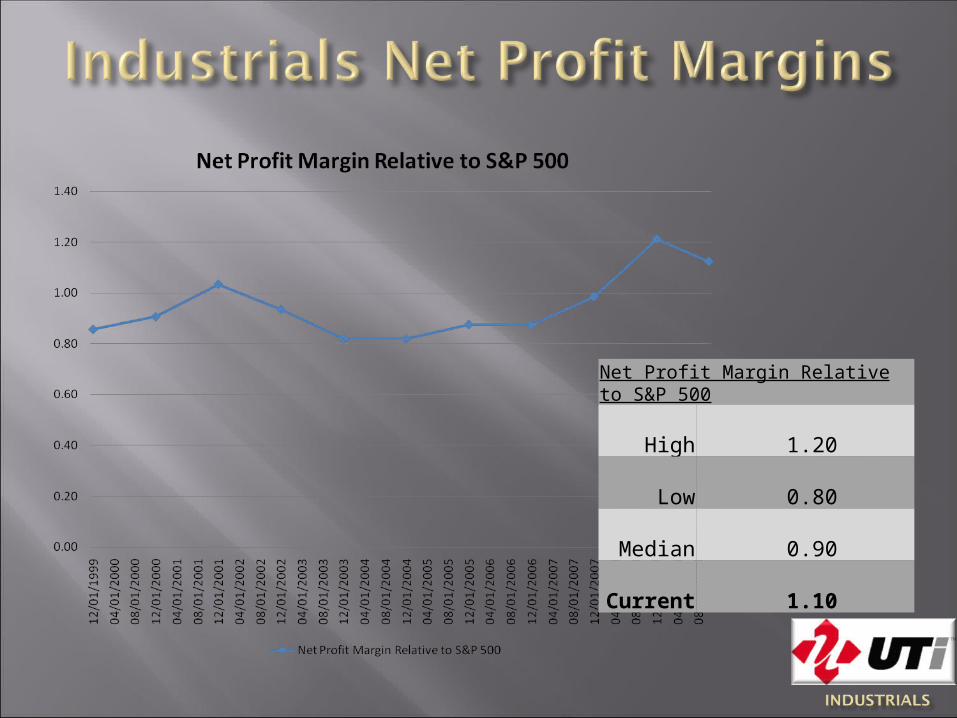
Net Profit Margin Relative to S&P 500High 1.20 Low 0.80
Median 0.90 Current 1.10

High Low Median Current
CONGL 11.1 9.2 10.6 9.2EEQPM 10 6.1 8.8 8.8TRKPT 7.3 2 4.8 4.8AIRFR 7.5 3.4 5.7 4.8
INDUST 8.4 6.4 7.1 6.9

Company EPS Growth (YoY) High Low Median Current
GE 19 -49 6.8 -36.5SI 208 -96 20.4 -56.4
UPS 28.2 -38.3 8.7 -16MMM 22.8 -19.1 10.6 -19.1
Industry EPS Growth (YoY) High Low Median Current
CONGL 23.4 -44.7 7.7 -28EEQPM 30.8 -38.9 14.4 -17.8TRKPT 100.8 -66.5 6.6 -45.7AIRFR 24.8 -36 5.8 -28.2
INDUST 22 -35.3 9.9 -21.3

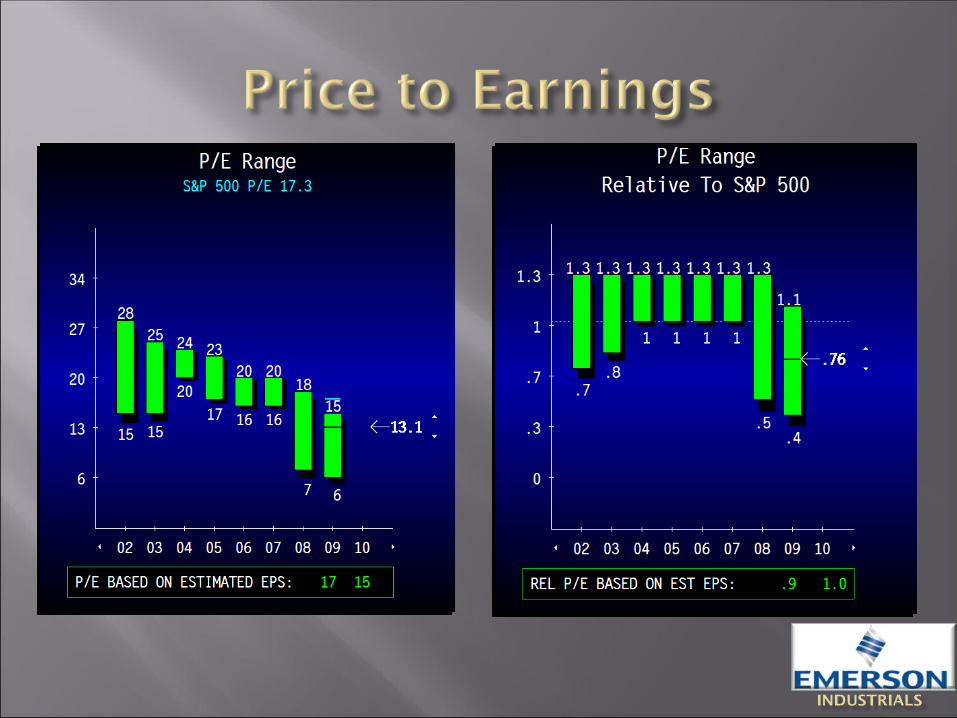
High 21.3Low 16.2
Median 17.8Current 21.3


Correlation = .86 with 0 Lag time
One Year

Absolute Basis
High Low Median Current
% Current to LT Median
P/Forward E 26.9 9.2 17.8 16.9 -5%
P/B 5.9 1.4 3.3 2.5 -24%
P/S 1.9 0.6 1.5 0.9 -40%
P/CF 16.7 4.9 11.9 7.3 -39%
Relative to SP500
High Low Median Current
% Current to LT Median
P/Forward E 1.2 0.8 1.0 1.0 0%
P/B 1.4 0.9 1.1 1.2 9%
P/S 1.1 0.8 1.0 0.9 -10%
P/CF 1.2 0.7 1.1 0.7 -36%
Ratios indicate that the industrials sector is currently undervalued.


3-MTD YTD P/E P/SDividend
Yield
Industrials 5.46% 8.35% 22.8x 0.8x 2.41%
Transportation 0.30% 5.42% 54.1x 0.8x 1.88%
Commercial & Professional Services 3.50% 5.38% 65.4x 0.7x 1.83%
Capital Goods 6.72% 9.34% 19.2x 0.9x 2.58%

Electrical Equipment and Machinery have a higher correlation with the S&P 500 than the other industries within the Industrials Sector
Thomson Ticker Correlation
Best Fit
Best Fit Lag
Capital Goods
Aerospace & Defense aerod 0.57 0.59 2 Building Products bldgp 0.45 0.53 12 Construction & Engineering engnr 0.39 0.5 11 Electrical Equipment eeqpm 0.66 0.66 Industrial Conglomerates congl 0.75 0.75 Machinery machn 0.45 0.45
Trading Companies & Distributors Trade 0.28 0.3 2Commercial & Professional
Services
Commercial Services & Supplies print 0.56 0.56
Professional Services 0.28 0.43 11.5
Transportation
Air Freight & Logistics airfr 0.24 0.39 12 Airlines ARLNS 0.26 0.29 2 Marine shipp 0.45 0.45 Road & Rail railr 0.31 0.43 11 Transportation Infrastructure Truck 0.32 0.37 12
Average 0.43 0.48

One Year

High 1.4Low .7
Median 1.2Current .8


High 1.1Low .48
Median .8Current .97

INDUSTRIALS SECTOR SHOULD MAINTAIN THE CURRENT LEVEL OF 188 BASIS POINTS
OVERWEIGHT
Positives:FINANCIAL Sector ratios indicate that the sector is undervaluedECONOMIC Improving global economic recovery Increasingly global in scope Favorable impact anticipated from the infrastructure spending
Risks: Slower economic recovery than anticipated Lag time associated with the Industrials Sector