eric mcdonald and c. titus brown february 2013 arxiv:1303
TRANSCRIPT
khmer: Working with Big Data in Bioinformatics
Eric McDonald and C. Titus Brown
February 2013
1 Introduction
1.1 Bioinformatics and Big Data
The field of bioinformatics seeks to provide tools and analyses that provideunderstanding of the molecular mechanisms of life on Earth, largely by an-alyzing and correlating genomic and proteomic information. As increasinglylarge amounts of genomic information, including both genome sequences andexpressed gene sequences, becomes available, more efficient, sensitive, and spe-cific analyses become critical.
In DNA sequencing, a chemical and mechanical process essentially “digi-tizes” the information present in DNA and RNA. These sequences are recordedusing an alphabet of one letter per nucleotide. Various analyses are performedon this sequence data to determine how it is structured into larger buildingblocks and how it relates to other sequence data. This serves as the basis forthe study of biological evolution and development, genetics, and, increasingly,medicine.
Data on nucleotide chains comes from the sequencing process in strings ofletters known as reads. (The use of the term read in the bioinformatics sense isan unfortunate collision with the use of the term in the computer science andsoftware engineering sense. This is especially true as the performance of readingreads can be tuned, as we will discuss. To disambiguate this unfortunate colli-sion we refer to sequences from genomes as genomic reads.) To analyze largerscale structures and processes, multiple genomic reads must be fit together. Thisfitting is different than a jigsaw puzzle in that the picture is often not known apriori and that the pieces may (and often do) overlap. A further complication isintroduced in that not all genomic reads are of perfect fidelity and may containa variety of errors, such as insertions or deletions of letters or substitutions ofthe wrong letters for nucleotides. While having redundant reads can help in theassembly or fitting of the puzzle pieces, it is also a hindrance because of thisimperfect fidelity in all of the existing sequencing technologies. The appearanceof erroneous genomic reads scales with the volume of data and this complicatesassembly of the data.
As sequencing technology has improved, the volume of sequence data beingproduced has begun to exceed the capabilities of computer hardware employing
1
arX
iv:1
303.
2223
v1 [
cs.C
E]
9 M
ar 2
013

conventional methods for analyzing such data. (Much of the state-of-the-artin sequencing technology produces vast quantities of genomic reads, typicallytens of millions to billions, each having a sequence of 50 to 100 nucleotides.)This trend is expected to continue and is part of what is known as the BigData [10] problem in the high performance computing (HPC), analytics, andinformation science communities. With hardware becoming a limiting factor,increasing attention has turned to ways to mitigate the problem with softwaresolutions. In this chapter, we present one such software solution and how wetuned and scaled it to handle terabytes of data.
Our research focus has been on efficient pre-processing, in which variousfilters and binning approaches trim, discard, and bin the genomic reads, in orderto improve downstream analyses. This approach has the benefit of limiting thechanges that need to be made to downstream analyses, which generally consumegenomic reads directly.
In this chapter, we present our software solution and describe how we tunedand scaled it to efficient handle increasingly large amounts of data.
1.2 What is the khmer Software?
“khmer” is our suite of software tools for pre-processing large amounts of ge-nomic sequence data prior to analysis with conventional bioinformatics tools[4] – no relation to the ethnic group indigenous to Southeast Asia. This namecomes by free association with the term ’k-mer’: as part of the pre-processing,genetic sequences are decomposed into overlapping substrings of a given length,k. As chains of many molecules are often called polymers, chains of a specificnumber of molecules are called k-mers, each substring representing one suchchain. Note that, for each genomic read, the number of k-mers will be the num-ber of nucleotides in the sequence minus k. So, nearly every genomic read willbe decomposed into many overlapping k-mers.
Since we want to tell you about how we measured and tuned this piece ofopen source software, we’ll skip over much of the theory behind it. Suffice it tosay that k-mer counting is central to much of its operation. To compactly counta large number of k-mers, a data structure known as a Bloom filter [11] is used(Figure 2). Armed with k-mer counts, we can then exclude highly redundantdata from further processing, a process known as “digital normalization”. Wecan also treat low abundance sequence data as probable errors and exclude itfrom further processing, in an approach to error trimming. These normalizationand trimming processes greatly reduce the amount of raw sequence data neededfor further analysis, while mostly preserving information of interest.
khmer is designed to operate on large data sets of millions to billions of ge-nomic reads, containing tends of billions of unique k-mers. Some of our existingdata sets require up to a terabyte of system memory simply to hold the k-mercounts in memory, but this is not due to inefficient programming: in [7] we showthat khmer is considerably more memory efficient than any exact set member-ship scheme for a wide regime of interesting k-mer problems. It is unlikely thatsignificant improvements in memory usage can be obtained easily.
2

Figure 1: Decomposition of Genomic Sequence into 4-mers. In khmer, theforward sequence and reverse complement of each k-mer are hashed to the samevalue, in recognition that DNA is double-stranded. See Future Directions.
(a) Single hash table
h1(M)
h2(M)
h3(M)
h4(M)
M h1(M)
h2(M)
h3(M)
h4(M)
(b) Multiple hash tables
Figure 2: A Bloom filter is essentially a large, fixed-size hash table, into whichelements are inserted or queried using multiple orthogonal hash functions, withno attempt at collision tracking; they are therefore probabilistic data structures.Our implementation uses multiple distinct hash tables each with its own hashfunction, but the properties are identical. We typically recommend that khmer’sBloom filters be configured to use as much main memory as is available, as thisreduces collisions maximally.
3

Our goal, then, is simple: in the face of these large data sets, we wouldlike to optimize khmer for processing time, including most especially the timerequired to load data from disk and count k-mers.
For the curious, the khmer sources and documentation can be cloned fromGitHub at http://github.com/ged-lab/khmer.git. Khmer has been avail-able for about four years, but only with the posting of several preprint papershave others started to use it; we estimate the user population at around 100groups based on e-mail interactions in 2012, although it seems to be growingrapidly as it becomes clear that a large class of assembly problems is morereadily tractable with khmer [2].
2 Architecture and Performance Considerations
Khmer started as an exploratory programming exercise and is evolving intomore mature research code over time. From its inception, the focus has beenon solving particular scientific problems with as much as accuracy or “correct-ness” as possible. Over time, as the software has come into greater use aroundthe world, issues such as packaging, performance, and scalability have becomemore prominent. These issues were not necessarily neglected in earlier times,but they now have a higher profile than they once did. Our discussion willcenter around how we have analyzed and solved particular performance andscaling challenges. Beacuse khmer is research code still under development, itroutinely receiving new features and has a growing collection of impermanentscripts built up around it. We must be careful to ensure that changes made toimprove performance or scalability do not break existing interfaces or to causethe software not decrease in accuracy or correctness. For this reason, we haveproceeded along a strategy that combines automated testing with careful, in-cremental optimization and parallelization. In conjunction with other activitiespertaining to the software, we expect this process to be essentially perpetual.
The core of the software is written in C++. This core consists of a data pump(the component which moves data from online storage into physical RAM),parsers for genomic reads in several common formats, and several k-mer coun-ters. An application programming interface (API) is built around the core. ThisAPI can, of course, be used from C++ programs, as we do with some of ourtest drivers, but also serves as the foundation for a Python wrapper. A Pythonpackage is built upon the Python wrapper. Numerous Python scripts are dis-tributed along with the package. Thus, the khmer software, in its totality, isthe combination of core components, written in C++ for speed, higher-levelinterfaces, exposed via Python for ease of manipulation, and an assortment oftool scripts, which provide convenient ways to perform various bioinformaticstasks.
The khmer software supports batch operation in multiple phases, each withseparate data inputs and outputs. For example, it can take a set of genomicreads, count k-mers in these, and then, optionally, save the Bloom filter hashtables for later use. Later, it can use saved hash tables to perform k-mer abun-
4

Figure 3: A Layered View of the khmer Software
dance filtering on a new set of genomic reads, saving the filtered data. Thisflexibility to reuse earlier outputs and to decide what to keep allows a user totailor a procedure specific to his/her needs and storage constraints.
Figure 4: Data Flow through the khmer Software
Lots and lots of data (potentially terabytes) must be moved from disk tomemory by the software. Having an efficient data pump is crucial, as the in-put throughput from storage to CPU may be 3 or even 4 orders of magnitudeless than the throughput for data transfer from physical RAM to CPU. Forsome kinds of data files, a decompressor must be used. In either case, a parsermust work efficiently with the resultant data. The parsing task revolves aroundvariable-length lines, but also must account for invalid genomic reads and pre-serving certain pieces of biological information, which may be exploited duringlater assembly, such as pairings of the ends of sequence fragments. Each genomicread is broken up into a set of overlapping k-mers and each k-mer is registeredwith or compared against the Bloom filter. If a previously stored Bloom filteris being updated or used for comparison, then it must be loaded from storage.If a Bloom filter is being created for later use or updated, then it must be saved
5

to storage.The data pump always performs sequential access on files and can potentially
be asked to read large chunks of data at one time. With this in mind, thefollowing are some of the questions which come to mind:
• Are we fully exploiting the fact that the data is accessed sequentially?
• Are enough pages of data being prefetched into memory to minimize accesslatency?
• Can asynchronous input be used instead of synchronous input?
• Can we efficiently bypass system caches to reduce buffer-to-buffer copiesin memory?
• Does the data pump expose data to the parser in a manner that does notcreate any unnecessary accessor or decision logic overhead?
Parser efficiency is essential, as data enters in a fairly liberal string formatand must be converted into an internal representation before any further pro-cessing is done. Since each individual data record is relatively small (100-200bytes), but there are millions to billions of records, we have focused quite abit of effort on optimizing the record parser. The parser, at its core, is a loopwhich breaks up the data stream into genomic reads and stores them in records,performing some initial validation along the way.
Some considerations regarding parser efficiency are:
• Have we minimized the number of times that the parser is touching thedata in memory?
• Have we minimized the number of buffer-to-buffer copies while parsinggenomic reads from the data stream?
• Have we minimized function call overhead inside the parsing loop?
• The parser must deal with messy data, including ambiguous bases, too-short genomic reads, and character case. Is this DNA sequence validationbeing done as efficiently as possible?
For iterating over the k-mers in a genomic read and hashing them, we couldask:
• Can the k-mer iteration mechanism be optimized for both memory andspeed?
• Can the Bloom filter hash functions be optimized in any way?
• Have we minimized the number of times that the hasher is touching thedata in memory?
• Can we increment hash counts in batches to exploit a warm cache?
6

3 Profiling and Measurement
Simply reading the source code with an eye on performance revealed a numberof areas for improvement. However, we wanted to systematically quantify theamount of time spent in various sections of the code. To do this, we usedseveral profilers: the GNU Profiler (gprof) and the Tuning and Analysis Utilities(TAU). We also created instruments within the source code itself, allowing a finegranularity view of key performance metrics.
3.1 Code Review
Blindly applying tools to measure a system (software or otherwise) is rarely agood idea. Rather, it is generally a good idea to gain some understanding ofthe system before measuring it. To this end, we reviewed the code by eye first.
Manually tracing the execution paths of an unfamiliar code is a good idea.(One of the authors, Eric McDonald, was new to the khmer software at thetime he joined the project and he did this.) While it is true that profilers (andother tools) can generate call graphs, those graphs are only abstract summaries.Actually walking the code paths and seeing the function calls is a much moreimmersive and enlightening experience. Debuggers can be used for such walks,but do not readily lend themselves to the exploration of code paths less trav-elled. Also, moving through an execution path step-by-step can be quite tedious.Breakpoints can be used for testing whether certain points in the code are hitduring normal execution, but setting them requires some a priori knowledge ofthe code. As an alternative, the use of an editor with multiple panes works quitewell. Four display panes can often simultaneously capture all of the informationa person needs to know - and is mentally capable of handling - at any givenpoint.
The code review showed a number of things, some, but not all, of which werelater corroborated by profiling tools. Some of the things we noticed were:
• We expected the highest traffic to be in the k-mer counting logic.
• Redundant calls to the toupper function were present in the highest trafficregions of the code.
• Input of genomic reads was performed line-by-line and on demand andwithout any readahead tuning.
• A copy-by-value of the genomic read struct performed for every parsedand valid genomic read.
Although the preceding may seem like fairly strong self-criticism, we wouldlike to stress that a greater emphasis had been placed on utility and correctnessof khmer up to this point. Our goal was to optimize existing and mostly correctsoftware, not to redevelop it from scratch.
7

3.2 Tools
Profiling tools primarily concern themselves with the amount of time spent inany particular section of code. To measure this quantity, they inject instru-mentation into the code at compile time. This instrumentation does changethe size of functions, which may affect inlining during optimization. The in-strumentation also directly introduces some overhead on the total executiontime; in particular, the profiling of high traffic areas of code may result in afairly significant overhead. So, if you are also measuring the total elapsed timeof execution for your code, you need to be mindful of how profiling itself af-fects this. To gauge this, a simple external data collection mechanism, such as/usr/bin/time, can be used to compare non-profiling and profiling executiontimes for an identical set of optimization flags and operating parameters.
We gauged the effect of profiling by measuring the difference between profiledand non-profiled code across a range of k sizes – smaller k values lead to morek-mers per genomic read, increasing profiler- specific effects. For k = 20, wefound that non-profiled code ran about 19% faster than profiled code, and, fork = 30, that non-profiled code ran about 14% faster than profiled code.
Prior to any performance tuning, our profiling data showed that the k-mercounting logic was the highest traffic portion of the code, as we had predictedby eye. What was a little surprising was how significant of a fraction it was,contrasted to I/O operations against storage. Given that our trial data setswere about 500 MB and 5 GB, we did not anticipate seeing much in the way ofcache effects.1 Indeed, when we controlled for cache effects, we found that theydid not amount to more than a couple of seconds at most and were thus notmuch larger than the error bars on our total execution times. This left us withthe realization that I/O was not our primary bottleneck at that juncture in thecode optimization process.
Once we began parallelizing the khmer software, we wrote some driver pro-grams, which used OpenMP [6], to test our parallelization of various compo-nents. While gprof is good at profiling single-threaded execution, it lacks theability to trace per-thread execution when multiple threads are in use and it doesnot understand parallelization machinery, such as OpenMP. For C/C++ codes,OpenMP parallelization is determined by compiler pragmas. GNU C/C++compilers, in the version 4.x series, honor these pragmas if supplied with the-fopenmp switch. When OpenMP pragmas are being honored, the compilers in-ject thread-handling instrumentation at the locations of the pragmas and aroundthe basic blocks or other groupings with which they are associated.
As gprof could not readily give us the per-thread reporting and the OpenMPsupport that we desired, we turned to another tool. This was the Tuning andAnalysis Utilities (TAU) [3] from a collaboration led by the University of Oregon.
1If the size of a data cache is larger than the data being used in I/O performance bench-marks, then retrieval directly from the cache rather than the original data source may skewthe mesurements from successive runs of the benchmarks. Having a data source larger thanthe data cache helps guarantee data cycling in the cache, thereby giving the appearance of acontinuous stream of non-repeating data.
8

There are a number of parallel profiling tools out there - many of them focus onprograms using MPI (Message Passing Interface) libraries, which are popularfor some kinds of scientific computing tasks. TAU supports MPI profiling aswell, but as MPI is not really an option for the khmer software in its currentmanifestation, we ignored this aspect of TAU. Likewise, TAU is not the onlytool available for per-thread profiling. The combination of per-thread profilingand the ability to integrate closely with OpenMP is one of the reasons that itwas appealing to us. TAU is also entirely open source and not tied to any onevendor.
Whereas gprof relies solely upon instrumentation injected into source codeat compile time (with some additional bits linked in), TAU provides this andother instrumentation options as well. These options are library interposition(primarily used for MPI profiling) and dynamic instrumentation of binaries.To support these other options, TAU provides an execution wrapper, calledtau exec. Compile-time instrumentation of source code is supported via awrapper script, called tau cxx.sh.
TAU needs additional configuration to support some profiling activities. Toget tight OpenMP integration, for example, TAU needs to be configured andbuilt with support for OPARI. Similarly, to use the performance counters ex-posed by newer Linux kernels, it needs to be configured and built with supportfor PAPI. Also, once TAU is built, you will likely want to integrate it into yourbuild system for convenience. For example, we setup our build system to allowthe tau cxx.sh wrapper script to be used as the C++ compiler when TAUprofiling is desired. If you attempt to build and use TAU, you will definitelywant to read the documentation. While much more powerful than gprof, it isnot nearly as facile or intuitive.
3.3 Manual Instrumentation
Examining the performance of a piece of software with independent, externalprofilers is a quick and convenient way to learn something about the execu-tion times of various parts of software at a first glance. However, profilers aregenerally not so good at reporting how much time code spends in a particularspinlock within a particular function or what the input rate of your data is. Toaugment or complement external profiling capabilities, manual instrumentationmay needed. Also, manual instrumentation can be less intrusive than automaticinstrumentation, since you directly control what gets observed. To this end, wecreated an extensible framework to internally measure things such as through-puts, iteration counts, and timings around atomic or fine-grained operationswithin the software itself. As a means of keeping ourselves honest, we internallycollected some numbers that could be compared with measurements from theexternal profilers.
For different parts of the code, we needed to have different sets of metrics.However, all of the different sets of metrics have certain things in common.One thing is that they are mostly timing data and that you generally wantto accumulate timings over the duration of execution. Another thing is that a
9

consistent reporting mechanism is desirable. Given these considerations, we pro-vided an abstract base class, IPerformanceMetrics, for all of our different setsof metrics. The IPerformanceMetrics class provides some convenience meth-ods: start timers, stop timers, and timespec diff in nsecs. The methodsfor starting and stopping timers measure both elapsed real time and elapsedper-thread CPU time. The third method calculates the difference between twostandard C library timespec objects in nanoseconds, which is of quite sufficientresolution for our purposes.
To ensure that the overhead of the manually-inserted internal instrumenta-tion is not present in production code, we carefully wrapped it in conditionalcompilation directives so that a build can specify to exclude it.
4 Tuning
Making software work more efficiently is quite a gratifying experience, especiallyin the face of trillions of bytes passing through it. Our narrative will now turnto the various measures we took to improve efficiency. We divide these into twoparts: optimization of the reading and parsing of input data and optimizationof the manipulation and writing of the Bloom filter contents.
4.1 General Tuning
Before diving into some of the specifics of how we tuned the khmer software, wewould like to briefly mention some options for general performance tuning. Pro-duction code is often built with a set of safe and simple optimizations enabled;these optimizations can be generally proven not to change the semantics of thecode (i.e., introduce bugs) and only require a single compilation pass. Compilersdo provide additional optimization options, however. These additional optionscan be broadly categorized as aggressive optimizations, which is a fairly stan-dard term in compiler literature, and profile-guided optimizations (PGO) [13].(The two categories are not mutually-exclusive, strictly speaking, but typicallyinvolve different approaches.)
Aggressive optimizations may be unsafe (i.e., introduce bugs) in some casesor actually decrease performance in other cases. Aggressive optimizations maybe unsafe for a variety of reasons, including sloppiness in floating-point accuracyor assumptions about different operands being associated with different memoryaddresses. Aggressive optimizations may also be specific to a particular CPUfamily. Profile-guided optimizations rely on profiling information to make moreeducated guesses on how to optimize a program during compilation and linking.One frequently-seen profile-guided optimization is the optimization of locality- attempting to place highly-correlated functions as neighbors inside the textsegment of the executable image so that they will be loaded into the samememory pages together at runtime.
At this stage in our project, we have avoided both categories of additional op-timizations in favor of targeted algorithmic improvements - improvements that
10

provide benefits across many different CPU architectures. Also, from the stand-point of build system complexity, aggressive optimizations can create portabilityissues and profile-guided optimizations add to the total number of moving partswhich may fail. Given that we do not distribute pre-compiled executables forvarious architectures and that our target audience is usually not too savvy aboutthe intricacies of software development or build systems, it is likely that we willcontinue avoiding these optimizations until we feel that the benefits outweighthe drawbacks. In light of these considerations, our main focus has been onimproving the efficiency of our algorithms rather than other kinds of tuning.
4.2 Data Pump and Parser Operations
Our measurements showed that the time spent counting k-mers dominated thetime performing input from storage. Given that interesting fact, it may seemlike we should have devoted all of our efforts to improving the Bloom filter’sperformance. But, taking a look at the data pump and parser was worthwhilefor several reasons. One reason was that we needed to alter the design of theexisting data pump and parser to accommodate their use by multiple threadsto achieve scalability. Another reason was that we were interested in reducingmemory-to-memory copies, which could impact the efficiency of the Bloom filterat its interface with the parser. A third reason is that we wanted to positionourselves to provide an aggressive readahead or prefetch of data, in case wewere able to improve the efficiency of the k-mer counting logic to the point thatinput time became competitive with counting time. Unrelated to performancetuning, there were also issues with maintainability and extensibility.
As it turns out, all of the above reasons converged on a new design. We willdiscuss the thread-safety aspects of this design in more detail later. For now,we will focus upon the reduction of memory-to-memory copies and the abilityto perform fairly aggressive prefetching of data.
Typically, when a program retrieves data from a block storage device (e.g., ahard disk), a certain number of the blocks are cached by the operating system,in case the blocks are needed again. There is some time overhead associatedwith this caching activity; also, the amount of data to prefetch into the cachecannot be finely tuned. Furthermore, the cache cannot be accessed directly bya user process and so must be copied from the cache into the address space ofthe user process. This is a memory-to-memory copy.
Some operating systems, such as Linux, allow for their readahead windowsto be tuned some. One can make calls to posix fadvise(2) and readahead(2)
for a particular file descriptor, for example. However, these allow rather limitedcontrol and do not bypass caching. We are interested in bypassing the cachemaintained by the OS. This cache actually can be bypassed if a file is openedwith the O DIRECT flag and the file system supports it. Using direct input isnot entirely straightforward, as the reads from storage must be multiples ofthe storage medium’s block size and must be placed into an area of memory,which has a base address that is a multiple of the same block size. This requiresa program to perform housekeeping which a file system would normally do.
11

We implemented direct input, including the necessary housekeeping. There are,however, some cases where direct input will not work or is otherwise undesirable.For those cases, we still attempt to tune the readahead window. Our access ofstorage is sequential and we can tell the operating system to read further aheadthan it normally would by using posix fadvise(2) to provide a hint.
Minimizing buffer-to-buffer copies is a challenge shared between the datapump and the parser. In the ideal scenario, we would read once from storageinto our own buffer and then scan our buffer once per genomic read to demarcatea sequence with an offset and length within the buffer. However, the logic formanaging the buffer is complex enough and the logic for parsing (accountingfor our particular nuances) is complex enough that maintaining an intermediaryline buffer is quite useful for programmer comprehension. To reduce the impactof this intermediary buffer, we encourage the compiler to rather aggressivelyinline this portion of the code. We may ultimately eliminate the intermediarybuffer if performance of this particular region of the code becomes a big enoughissue, but that may come at the expense of an understandable software design.
4.3 Bloom Filter Operations
Recalling that we are working with sequences composed of an alphabet of fourletters: A, C, G, and T, you might ask whether these are uppercase or lowercaseletters. Since our software operates directly on user-provided data, we cannotrely on the data to be consistently upper- or lower-case, since both sequencingplatforms and other software packages may alter the case. While this is easy tofix for individual genomic reads, we need to repeat this for each base in millionsor billions of read!
Prior to performance tuning the code was insensitive to case right up tothe points where it validated the DNA string and where it generated the hashcodes. At these points, it would make redundant calls to the C library’s toupperfunction to normalize the sequences to uppercase, using macros such as thefollowing:
#define is_valid_dna(ch) \
((toupper(ch)) == ’A’ || (toupper(ch)) == ’C’ || \
(toupper(ch)) == ’G’ || (toupper(ch)) == ’T’)
and:
#define twobit_repr(ch) \
((toupper(ch)) == ’A’ ? 0LL : \
(toupper(ch)) == ’T’ ? 1LL : \
(toupper(ch)) == ’C’ ? 2LL : 3LL)
12
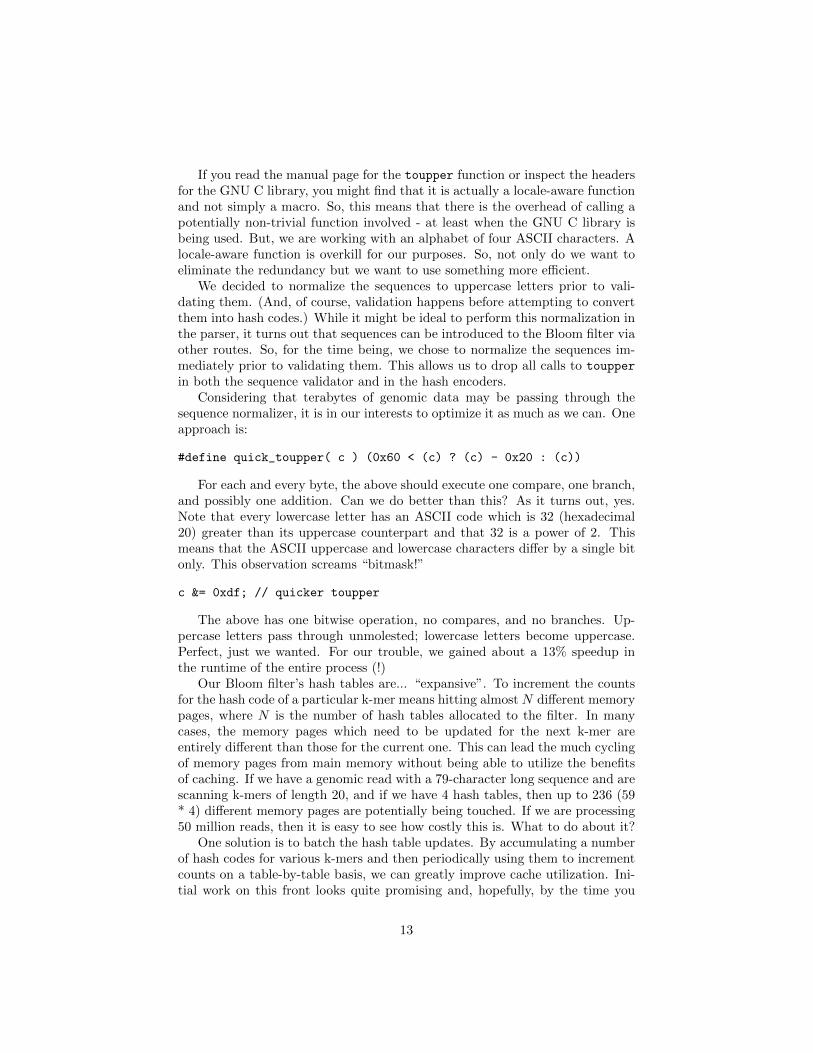
If you read the manual page for the toupper function or inspect the headersfor the GNU C library, you might find that it is actually a locale-aware functionand not simply a macro. So, this means that there is the overhead of calling apotentially non-trivial function involved - at least when the GNU C library isbeing used. But, we are working with an alphabet of four ASCII characters. Alocale-aware function is overkill for our purposes. So, not only do we want toeliminate the redundancy but we want to use something more efficient.
We decided to normalize the sequences to uppercase letters prior to vali-dating them. (And, of course, validation happens before attempting to convertthem into hash codes.) While it might be ideal to perform this normalization inthe parser, it turns out that sequences can be introduced to the Bloom filter viaother routes. So, for the time being, we chose to normalize the sequences im-mediately prior to validating them. This allows us to drop all calls to toupper
in both the sequence validator and in the hash encoders.Considering that terabytes of genomic data may be passing through the
sequence normalizer, it is in our interests to optimize it as much as we can. Oneapproach is:
#define quick_toupper( c ) (0x60 < (c) ? (c) - 0x20 : (c))
For each and every byte, the above should execute one compare, one branch,and possibly one addition. Can we do better than this? As it turns out, yes.Note that every lowercase letter has an ASCII code which is 32 (hexadecimal20) greater than its uppercase counterpart and that 32 is a power of 2. Thismeans that the ASCII uppercase and lowercase characters differ by a single bitonly. This observation screams “bitmask!”
c &= 0xdf; // quicker toupper
The above has one bitwise operation, no compares, and no branches. Up-percase letters pass through unmolested; lowercase letters become uppercase.Perfect, just we wanted. For our trouble, we gained about a 13% speedup inthe runtime of the entire process (!)
Our Bloom filter’s hash tables are... “expansive”. To increment the countsfor the hash code of a particular k-mer means hitting almost N different memorypages, where N is the number of hash tables allocated to the filter. In manycases, the memory pages which need to be updated for the next k-mer areentirely different than those for the current one. This can lead the much cyclingof memory pages from main memory without being able to utilize the benefitsof caching. If we have a genomic read with a 79-character long sequence and arescanning k-mers of length 20, and if we have 4 hash tables, then up to 236 (59* 4) different memory pages are potentially being touched. If we are processing50 million reads, then it is easy to see how costly this is. What to do about it?
One solution is to batch the hash table updates. By accumulating a numberof hash codes for various k-mers and then periodically using them to incrementcounts on a table-by-table basis, we can greatly improve cache utilization. Ini-tial work on this front looks quite promising and, hopefully, by the time you
13
are reading this, we will have fully integrated this modification into our code.Although we did not mention it earlier in our discussion of measurement andprofiling, cachegrind, a program which is part of the open-source Valgrind [5]distribution, is a very useful tool for gauging the effectiveness of this kind ofwork.
5 Parallelization
With the proliferation of multi-core architectures in today’s world, it is tempt-ing to try taking advantage of them. However, unlike many other problemdomains, such as computational fluid dynamics or molecular dynamics, our BigData problem relies on high throughput processing of data – it must become es-sentially I/O-bound beyond a certain point of parallelization. Beyond this point,throwing additional threads at it does not help as the bandwidth to the storagemedia is saturated and the threads simply end up with increased blocking orI/O wait times. That said, utilizing some threads can be useful, particularly ifthe data to be processed is held in physical RAM, which generally has a muchhigher bandwidth than online storage. As discussed previously, we have imple-mented a prefetch buffer in conjunction with direct input. Multiple threads canuse this buffer; more will be said about this below. I/O bandwidth is not theonly finite resource which multiple threads must share. The hash tables used fork-mer counting are another one. Shared access to these will also be discussedbelow.
5.1 Thread-safety and Threading
Before proceeding into details, it may be useful to clear up a couple items aboutterminology. People often confuse the notion of something being thread-safewith that of something being threaded. If something is thread-safe, then it canbe simultaneously accessed by multiple threads without fear of corrupted fetchesor stores. If something is multi-threaded, then it is simultaneously operated bymultiple threads of execution.
As part of our parallelization work, we remodeled portions of the C++core implementation to be thread-safe without making any assumptions abouta particular threading scheme or library. Therefore, the Python threading
module can be used in the scripts which use the Python wrapper around thecore implementation, or a C++ driver around the core could use a higher-level abstraction, like OpenMP as we mentioned earlier, or explicitly implementthreading with pthreads, for example. Achieving this kind of independence fromthreading scheme and guaranteeing thread-safety, while not breaking existinginterfaces to the C++ library, was an interesting software engineering challenge.We solved this by having portions of the API, which were exposed as thread-safe,maintain their own per-thread state objects. These state objects are looked upin a C++ Standard Template Library (STL) map, where thread identificationnumbers are the keys. The identification number for a particular thread is found
14

by having that thread itself query the OS kernel via a system call. This solutiondoes introduce a small amount of overhead from having a thread inquire aboutits identification number on every entry to a function exposed via the API, butit neatly avoids the problem of breaking existing interfaces, which were writtenwith a single thread of execution in mind.
5.2 Data Pump and Parser Operations
The multi-core machines one encounters in the HPC world may have multiplememory controllers, where one controller is closer (in terms of signal traveldistance) to one CPU than another CPU. These are Non-Uniform MemoryAccess (NUMA) architectures. A ramification of working with machines of thisarchitecture is that memory fetch times may vary significantly depending onphysical address. As bioinformatics software often requires a large memoryfootprint to run, it is often found running on these machines. Therefore, if oneis using multiple threads, which may be pinned to various NUMA nodes, thelocality of the physical RAM must be taken into consideration. To this end,we divide our prefetch buffer into a number of segments equal to the number ofthreads of execution. Each thread of execution is responsible for allocating itsparticular segment of the buffer. The buffer segment is administered via a stateobject, maintained on a per-thread basis.
5.3 Bloom Filter Operations
The Bloom filter hash tables consume the majority of main memory (see Figure1) and therefore cannot usefully be split into separate copies among threads.Rather, a single set of tables must be shared by all of the threads. This impliesthat there will be contention among the threads for these resources. Memorybarriers [12] or some form of locking are needed to prevent two or more threadsfrom attempting to access the same memory location at the same time. Weuse atomic addition operations to increment the counters in the hash tables.These atomic operations [9] are supported on a number of platforms by severalcompiler suites, the GNU compilers among those, and are not beholden to anyparticular threading scheme or library. They establish memory barriers aroundthe operands which they are to update, thus adding thread-safety to a particularoperation.
A performance bottleneck, which we did not address, is the time to writethe hash tables out to storage after k-mer counting is complete. We did notfeel that this was such a high priority because the write-out time is constantfor a given Bloom filter size and is not dependent upon the amount of inputdata. For a particular 5 GB data set, which we used for benchmarking, wesaw that k-mer counting took over six times as long as hash table write-out.For even larger data sets, the ratio becomes more pronounced. That said, weare ultimately interested in improving performance here too. One possibility isto amortize the cost of the write-out over the duration of the k-mer countingphase of operation. The URL-shortener site, bit.ly, has a counting Bloom filter
15

implementation, called dablooms [1], which achieves this by memory-mappingits output file to the hash table memory. Adopting their idea, in conjunctionwith batch updates of the hash tables, would effectively give us asynchronousoutput in bursts over a process’ lifetime and chop off the entire write-out timefrom the end of execution. Our output is not simply tables of counts, however,but also includes a header with some metadata; implementing memory-mappingin light of this fact is an endeavor that needs to be approached thoughtfully andcarefully.
5.4 Scaling
Was making the khmer software scalable worth our effort? Yes. Of course, wedid not achieve perfectly linear speedup. But, for every doubling of the numberof cores, we presently get about a factor of 1.9 speedup.
Figure 5: Speedup Factor from 1 to 8 CPU Cores
In parallel computing, one must be mindful of Amdahl’s Law [8] and theLaw of Diminishing Returns. The common formulation of Amdahl’s Law, inthe context of parallel computing, is S(N) = 1
(1−P )+ PN
, where S is the speedup
achieved given N CPU cores and, P , the proportion of the code which is paral-lelized. For limN→∞ S = 1
(1−P ) , a constant. The I/O bandwidth of the storage
system, which the software utilizes, is finite and non-scalable; this contributes toa non-zero (1−P ). Moreover, contention for shared resources in the parallelizedportion means that P
N is, in reality, PN l , where l < 1 versus the ideal case of
l = 1. Therefore, returns will diminish over a finite number of cores even morerapidly.
16

Using faster storage systems, such as solid-state drives (SSDs) as opposed tohard-disk drives (HDDs), increases I/O bandwidth (and thus reduces (1 − P )),but that is beyond the purview of software. While we cannot do much abouthardware, we can still try to improve l. We think that we can further improveour access patterns around shared resources, such as the hash table memory,and that we can better streamline the use of per-thread state objects. Doingthese two things will likely grant us an improvement to l.
6 Conclusion
The khmer software is a moving target. New features are being added to itregularly, and we are working on incorporating it into various software stacks inuse by the bioinformatics community. Like many pieces of software in academia,it started life as an exploratory programming exercise and evolved into researchcode. Correctness was and is a primary goal of the project. While performanceand scalability cannot truly be regarded as afterthoughts, they yield prece-dence to correctness and utility. That said, our efforts regarding scalability andperformance have produced good results, including speedups in single-threadedexecution and the ability to significantly reduce total execution time by employ-ing multiple threads. Thinking about performance and scalability issues led tothe redesign of the data pump and parser components. Going forward, thesecomponents should be able to benefit not only from scalability but improvedmaintainability and extensibility.
7 Future Directions
Looking forward, once we have addressed the basic performance issues, we areprimarily interested in growing the programmer’s API, providing well testeduse cases and documentation, and providing well-characterized components forintegration into larger pipelines. More broadly, we would like to take advantageof advances in the theory of low-memory data structures to simplify certain usecases, and we are also interested in investigating distributed algorithms for someof the more intractable data set challenges facing us in the near future.
Some additional concerns facing khmer development include an expansionof the hashing options to allow the use of different hash functions for single-stranded DNA and the addition of a rolling hash function to permit k > 32.
We look forward to continuing the development of this software and hope tohave an impact on the Big Data problem facing molecular biologists and bioin-formaticians. We hope that you enjoyed reading about some high performance,open source software being employed in the sciences.
17

8 Acknowledgements
We thank Alexis Black-Pyrkosz and Rosangela Canino-Koning for commentsand discussion.
References
[1] bit.ly software developers. dablooms: a scalable, counting Bloom filter.http://github.com/bitly/dablooms.
[2] CT Brown, A Howe, Q Zhang, A Pyrkosz, and TH Brom. Areference-free algorithm for computational normalization of shotgun se-quencing data. In review at PLoS One, July 2012; Preprint athttp://arxiv.org/abs/1203.4802, 2012.
[3] A. D. Malony et al. TAU: Tuning and Analysis Utilities. http://www.cs.uoregon.edu/Research/tau/home.php.
[4] C. Titus Brown et al. khmer: genomic data filtering and partitioningsoftware. http://github.com/ged-lab/khmer.
[5] Julian Seward et al. Valgrind. http://valgrind.org/.
[6] OpenMP members. OpenMP. http://openmp.org.
[7] J Pell, A Hintze, R Canino-Koning, A Howe, JM Tiedje, and CT Brown.Scaling metagenome sequence assembly with probabilistic de bruijn graphs.Accepted at PNAS, July 2012; Preprint at http://arxiv.org/abs/1112.4193,2012.
[8] [Various]. Amdahl’s Law. http://en.wikipedia.org/w/index.php?
title=Amdahl%27s_law&oldid=515929929.
[9] [Various]. atomic operations. http://en.wikipedia.org/w/index.php?
title=Linearizability&oldid=511650567.
[10] [Various]. big data. http://en.wikipedia.org/w/index.php?title=
Big_data&oldid=521018481.
[11] [Various]. Bloom filter. http://en.wikipedia.org/w/index.php?title=Bloom_filter&oldid=520253067.
[12] [Various]. memory barrier. http://en.wikipedia.org/w/index.php?
title=Memory_barrier&oldid=517642176.
[13] [Various]. profile-guided optimization. http://en.wikipedia.org/w/
index.php?title=Profile-guided_optimization&oldid=509056192.
18