eric p. johnson · eric p. johnson 350 salem street hinkley remediation project manager gas...
TRANSCRIPT
Eric P. Johnson Hinkley Remediation Project Manager Gas Transmission and Distribution
350 Salem Street Chico, CA 95926 (530) 520-2959 (cell) (530) 896 4285 (office) (530) 896 4657 (fax) [email protected]
31 January 2011 File No. 36385-008 Lauri Kemper Assistant Executive Officer California Regional Water Quality Control Board - Lahontan Region 2501 South Lake Tahoe Boulevard South Lake Tahoe, California 96150 Subject: Addendum #1 to the Feasibility Study Pacific Gas and Electric Company Compressor Station Hinkley, California Dear Ms. Kemper: Pacific Gas and Electric Company (PG&E) has prepared this Addendum #1 to the Feasibility Study in response to the California Regional Water Quality Control Board – Lahontan Region (LRWQCB) letter dated 10 January 2011. The LRWQCB submitted preliminary comments to the Feasibility Study (FS) for the PG&E Compressor Station in Hinkley, California (Site). As requested by the LRWQCB, an Addendum #1 to the FS was prepared and includes responses to the LRWQCB comments from the 10 January 2011 letter, as described below. PG&E and its consultants have worked hard in the brief three weeks since January 10th to analyze two additional remedial alternatives, which are discussed below. As we have discussed, PG&E shares the goal of creating a remedy that can fully restore the beneficial uses of the aquifer in Hinkley as rapidly as possible. It is important to keep in mind that the alternatives presented in the FS were intended to help select between families of alternatives. It has always been our plan and our expectation that we would develop improvements to these basic alternatives during the design and implementation phase, with input from the Water Board and the public. The two new alternatives that have been developed in the last three weeks are a good start in that direction. Alternative 4A uses more aggressive pumping, more extensive IRZs, and longer operation of the IRZs to achieve background concentrations in approximately half the time of the original Alternative 4. The ‘Combined’ alternative, as requested by the Water Board, explores the impact of blending elements of three remedial alternatives together. Both of these new alternatives will aggressively contain the plume from the beginning. Alternative 4A will treat higher concentrations and larger quantities of mass early in the program, which is a benefit that needs to be considered. Nevertheless, the extent of the plume and the low background levels present very difficult challenges for the predictive modeling used to simulate the remediation process, and for the remediation itself. Simply put, it is very challenging if not impossible to accurately predict the cleanup time to such low levels. Our efforts to improve the remediation alternatives will not stop with this submittal. We will continue to look for ways to reduce the remediation timeline even further. If we are successful in developing a significantly improved alternative in the coming weeks, we will submit it to you as Alternative 4B.
California Regional Water Quality Control Board - Lahontan Region 31 January 2011 Page 2
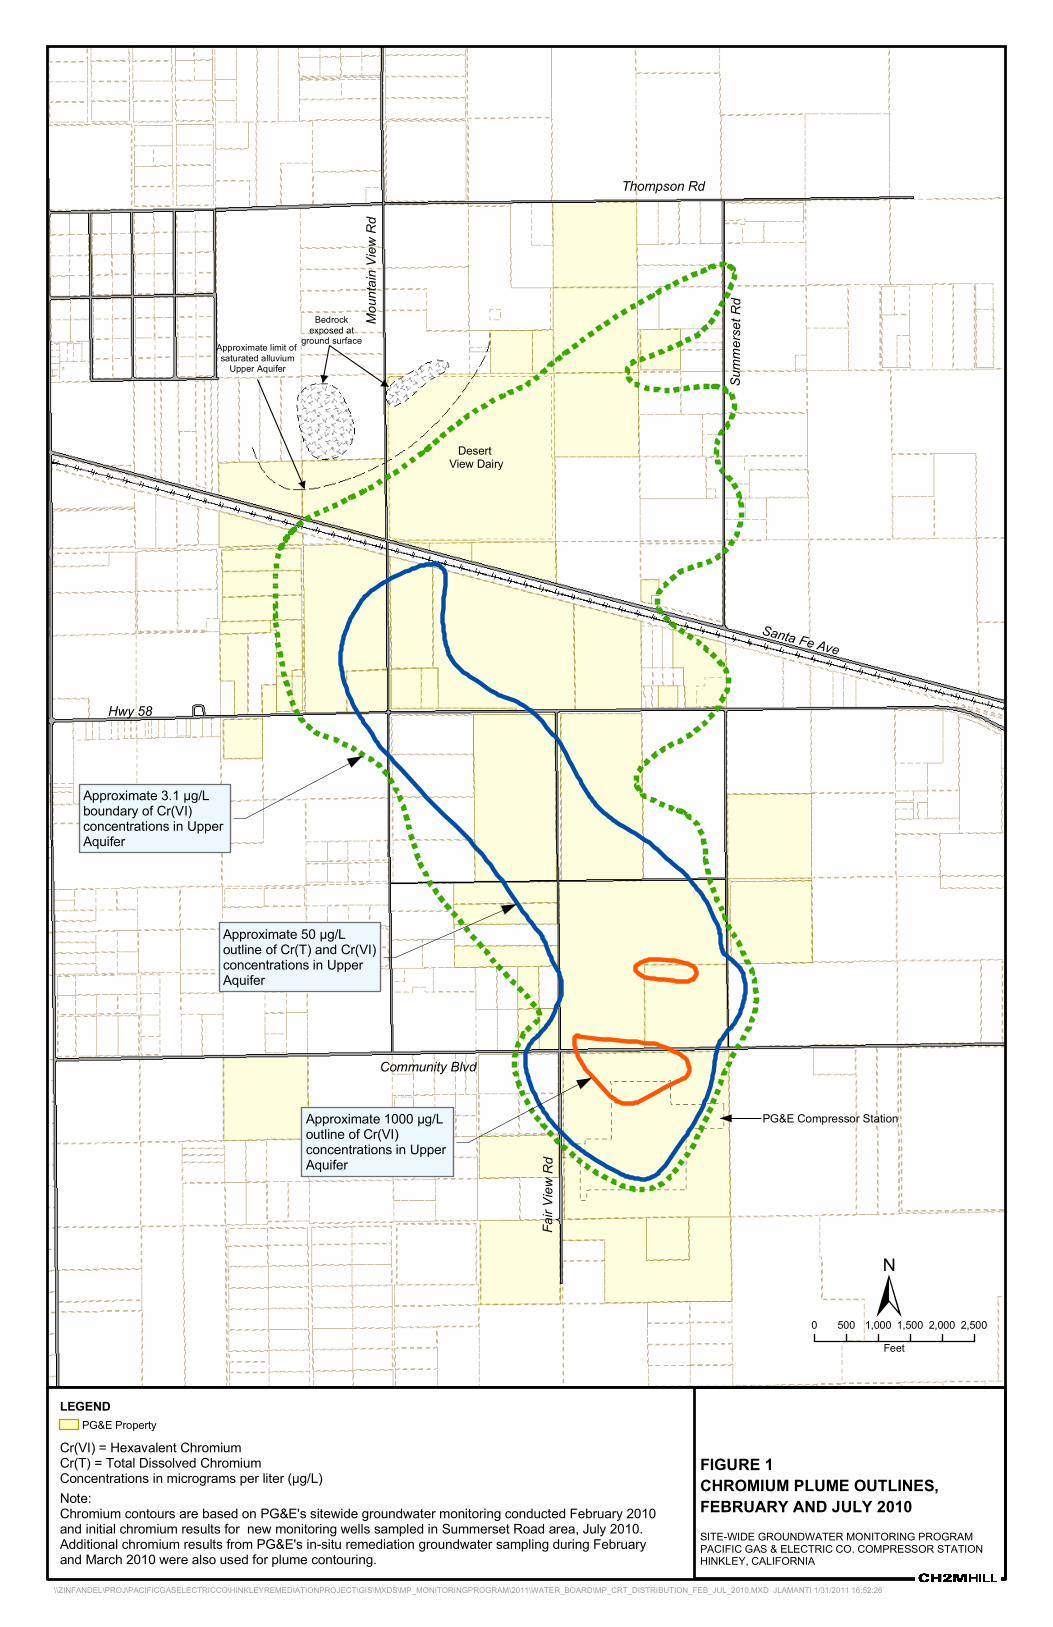
Due to the limitations of groundwater modeling, the need for long term data to calibrate the cleanup model, and the requirement to avoid excessive drawdown of the aquifer, we are not confident that a feasible alternative that further significantly shortens the remediation time can be developed. However, we are committed to working with the Water Board to continue to try to find ways to minimize the remediation timeline to the extent possible, while balancing other site concerns such as drawdown, byproduct creation, and ancillary effects. We look forward to further technical discussions to advance that goal. While the effort to find improvements will continue, we believe the alternatives presented should provide enough data for a realistic assessment of expected environmental impacts, and thus the EIR process can continue in parallel with any refinements of the final remedial alternative. LRWQCB Comment #1: The Study or its addendum must describe the existing levels of hexavalent and total chromium concentrations in groundwater throughout the Project Area. The Study only states in Section 3.3.2 that the chromium data from the February 2010 sampling set was used for the purposes of defining the Remedial Area in the Study. Of the numerical values listed for chromium in the Study, the highest value mentioned is 50 pg/L Cr(T). The February 2010 monitoring data shows that up to 8,450 µg/L Cr(VI) and 8,170 µg/L Cr(T) were detected in the Source Area at well SA-MW-05D, exceeding the hazardous waste limit of 5,000 µg/L. In contrast, Section 3.3.3 goes into great detail in describing the various total dissolved solids (TDS) and nitrate concentrations in groundwater along the entire length of the chromium plume. Response to LRWQCB Comment #1: Within the Remedial Area, total chromium (Cr[T]) and hexavalent chromium (Cr[VI]) concentrations in groundwater samples collected from the Upper Aquifer ranged from less than analytical detection limits (typically less than 0.2 micrograms per liter [µg/L]) to 8,450 µg/L Cr(VI) and 8,170 µg/L Cr(T), as of February 2010. With the exception of well MW-23C, Cr(T) and Cr(VI) concentrations in groundwater samples collected from the Lower Aquifer were consistently below the background level. In most groundwater samples obtained from the Remedial Area, detected Cr(T) concentrations are approximately equal to Cr(VI) concentrations, which is consistent with the assumption that most if not all of the chromium in groundwater in the Remedial Area is in the hexavalent form (Cr[VI]). The typically minor difference is most likely due principally to the different analytical test methods for total and hexavalent chromium. The dominance of Cr(VI) over Cr(III) in groundwater at the Hinkley site is consistent with the geochemistry of groundwater in much of the western Mojave Desert. Therefore, the term “chromium concentration” is often used in this report to represent both Cr(VI) and Cr(T) concentrations, which are approximately equivalent. The highest chromium concentrations detected in groundwater occur in the Upper Aquifer in the southern part of the Remedial Area, beneath and immediately downgradient of the Hinkley Compressor Station property. Chromium concentrations within the plume decrease to the north in the downgradient direction. This is due to dilution, dispersion and PG&E’s remedial activities. Chromium concentrations decrease from over 8,000 µg/L near the station to less than 1,000 µg/L approximately ½ mile north, and to less than 100 µg/L approximately ¾ mile north. In 2010, the “core” of the chromium plume (where concentrations exceeded 50 µg/L), extended approximately 1.6 miles north-northwest from the area of highest concentrations to the SCRIA extraction well field, and was 3,000 feet wide just north of Community Boulevard (Figure 1). The overall dimensions of the plume core were generally stable in 2010, with minor changes in some areas caused by local pumping stresses or
California Regional Water Quality Control Board - Lahontan Region 31 January 2011 Page 3
remedial activities. Within the southern portion of the plume core, where chromium concentrations have historically been the highest, numerous areas of low chromium concentrations (less than 50 µg/L to non-detectable levels) have been created by in-situ remediation activities conducted by PG&E. These areas range in size from a few thousand square feet to several acres. Outside of the plume core, concentrations of chromium range from naturally-occurring background levels to 49 µg/L. On Figure 1, the lowest contoured chromium concentration is 3.1 µg/L, which is the Site-specific maximum background value for Cr(VI). In the northern and central parts of the plume (most notably north of Highway 58), changing hydraulic gradients have, over time, created a wider area of chromium-affected groundwater outside of the plume core. The hydraulic gradient (and the direction of groundwater movement) in the Upper Aquifer in this area is predominantly north-northeastward, but historically has been influenced by agricultural pumping in the area. To the northwest of the plume core between Highway 58 and Santa Fe Avenue, the plume margin extends approximately ¼ mile west of the plume core. In the central part of the plume north of Santa Fe Avenue, extraction wells associated with the DVD LTU capture most of the chromium-affected groundwater north of the plume core. In 2010, the northernmost detection of chromium greater than 10 µg/L in groundwater in the Remediation Area occurred at monitoring well MW-62A (Figure 1), along the northern boundary of the DVD. In response to this detection, two new extraction wells were constructed in 2010 to limit further migration of chromium-affected groundwater in this area. Chromium was also detected at concentrations above background levels (to 20.5 µg/L) in samples collected in 2010 from Lower Aquifer monitoring well MW-23C, located near the intersection of Santa Fe Avenue and Mountain View Road, north of the plume core. This is the only Lower Aquifer well where chromium concentrations were detected in 2010 at concentrations above background levels. Additional investigation was performed in late-2010 and early-2011 to evaluate the nature of the aquitard (Blue Clay) that separates the Upper and Lower Aquifers in this area, and to better define chromium concentrations in the Lower Aquifer. At the eastern and northern margins of the plume, chromium has been detected in groundwater monitoring wells along the Summerset Road alignment - from just north of Highway 58 to ¼ mile south of Thompson Road - at concentrations ranging up to 5.5 µg/L. Chromium concentrations at several wells west of Summerset Road and south of Thompson Road are less than background, suggesting that the plume in this area does not consist of a well-defined, cohesive “front,” but instead occurs in “fingers”. This is likely in response to local pumping stresses on the Upper Aquifer. Additional investigation of this area is continuing at the present time. LRWQCB Comment #2: The Study states in numerous sections that in-situ remediation at the site is currently operating at full scale. Section 4.3 states that, "To date, three pilot and three full- scale IRZs (in-situ remediation zones) have been implemented." Water Board staff disagree with this statement, since in-situ remediation is only operating at pilot study areas. Full-scale in-situ remediation operations that extend out to the 50 µg/L Cr(VI) chromium plume boundaries have not yet been implemented at the site. We request the addendum clarify this information from the Study.
California Regional Water Quality Control Board - Lahontan Region 31 January 2011 Page 4
Response to LRWQCB Comment #2: The intent of this statement was to simply convey to the reader an overall sense of the phased history of IRZ implementation at the site. The IRZs currently operating at the site are extensive; and the current IRZ permit does not refer to ‘pilot’ or ‘full scale’ but rather refers to the refers to them as a ‘project’. PG&E is currently in the process of implementing additional phases of the current IRZs as contemplated in the original project descriptions for the Source Area IRZ (which by itself was referred to in the permit documents as ‘full scale’). PG&E looks forward to implementing a further expansion of the current IRZs to cover additional portions of the plume, if a final remedy is selected which includes the use of IRZs. To provide additional clarity, below is a brief summary of the IRZ history at the site, along with references to the various permitting documents: Following preliminary bench-scale studies, three limited pilot tests were performed first: Test Cell 1 and Test Cell 2 under the 2004 Waste Discharge Requirements R6V-2004-0041, and then the initial portion (Test Cell 3, Phase 1) of the Central Area IRZ under Order No. R6V-2006-0023 Later, three larger-scale IRZs were installed and operated: 1. The Central Area IRZ was expanded (under Revised Order No. R6V-2007-0032) to
approximately 1800 feet long, in order to cover the width of the 50ug/L Cr(VI) plume as it was depicted at the time. This IRZ was referred to as ‘pilot scale’ in the waste discharge requirements (WDRs).
2. The Source Area IRZ is referred to as ‘full scale’ in Order No. R6V-2006-0054, to be built in phases over a number of years. An expansion phase of this system is currently under construction.
3. The South Central IRZ Reinjection area was initiated in October 2009 under an April 7, 2009 Notice of Applicability under General Permit R6V-2008-0014
IRZ operations were conducted under these permits until July 2010. Based on favorable results of the operations, the IRZ systems were combined in July 2010 under the General Permit WDR R6V-2008-0014 as authorized by the Notice of Applicability issued by the LRWQCB on July 7 2010. LRWQCB Comment #3: In Study Section 3.3, a description of high concentrations of total dissolved solids (TDS) in groundwater in the area of the chromium plume is attributed to historical agricultural use unrelated to PG&E's activities. The Study, however, fails to mention that PG&E's past land treatment units also likely contributed to higher than normal TDS concentrations in groundwater. PG&E operated the East land treatment unit on the north side of Community Boulevard for about ten years. PG&E also operated the Ranch land treatment unit between Highway 58 and Santa Fe Avenue for about four years. These past PG&E operations contributed to increased TDS levels in groundwater that now extend over a 1.5 mile distance in the chromium plume. Furthermore, TDS data in Study Figure 2-4 indicate that operations at the Compressor Station have also added to TDS impacts to groundwater above background concentrations.
California Regional Water Quality Control Board - Lahontan Region 31 January 2011 Page 5
Response to LRWQCB Comment #3: PG&E operated two permitted land treatment units (“LTUs”) in the Hinkley area. The East LTU operated for approximately ten years on a 40-acre parcel located at the corner of Summerset Road and Community Boulevard. The Ranch LTU operated for approximately four years on an 80-acre parcel adjacent to Highway 58. These permitted LTUs were designed to (and did) remove chromium from the applied water. Because of their specific purpose, the LTUs applied water at or near the rate used by the crops (the “agronomic rate”). As a result, very little water returned to the underlying groundwater to add total dissolved solids (“TDS”) to the groundwater. In addition, the LTUs removed chromium and nitrate from the applied water, resulting in some reduction in TDS in the applied water. Significant groundwater testing has been conducted for many years in the vicinity of PG&E’s former LTUs and the PG&E station. These data do not indicate the existence of any point source for TDS impact to groundwater at any of these locations. If PG&E’s operations did contribute to TDS in groundwater at the site, the small size of the farmed parcels, the short duration of the farming, and the agronomic rate of water application would have resulted in a very small contribution to the TDS levels present in groundwater in the Hinkley vicinity, particularly in comparison with the impacts of decades of farming and dairy operations throughout most of the area. LRWQCB Comment #4: In discussing plume boundary control in Section 4.1.1, the Study states that, "...data show that groundwater extraction from this well network is largely effective in achieving hydraulic capture of the northern portion of the Remedial Area plume, thus containing it." This statement is inaccurate based on data submitted throughout 2010 showing that the northern portion of the chromium plume is not being captured by PG&E's groundwater extraction. PG&E has been notified of its failure to contain the plume in accordance with directives in CAO R6V-2008-0002. Third Quarter 2010 monitoring data for the Desert View Dairy indicates further violation of plume containment beyond the Dairy property. We request that PG&E provide in an addendum a more accurate description of the limits of the plume containment efforts to date and offer additional measures to effectively contain plume migration. Response to LRWQCB Comment #4: The limitations on plume containment efforts in the northern area of the plume boundary are directly related to the amount of water extracted within that area. Approval in July 2010 by the Water Board to increase by 50 percent the amount of water that can be applied to the Desert View Dairy Land Treatment Unit has improved capture in the immediate area, but the total extraction in this area remains below the level that PG&E’s hydraulic model predicts would be required to ensure capture. However, measures to increase extraction to levels at which the hydraulic model predicts full containment are currently under construction. These include: Resumption of agricultural operations on approximately 50 acres of the former Gorman
property, with the former irrigation system now converted to a drag-drip pivot operation, using extraction points optimized to bring about hydraulic control of the plume boundary;
Resumption of agricultural operations of the 95-acre Ranch land treatment facility using a drag-drip pivot; and
California Regional Water Quality Control Board - Lahontan Region 31 January 2011 Page 6
Commencement of agricultural pumping on approximately 50 acres (total) at up to two additional properties located east of the Desert View Dairy.
LRWQCB Comment #5: The description of the five alternatives for final site cleanup contains incomplete discussions. For instance, the descriptions for Alternatives 2 through 5 state that emphasis is placed on rapid reduction of Cr(Vl) concentrations in the plume core (>50 µg/L) to expedite re-establishing beneficial use of the Upper Aquifer. However, this premise is short-sighted given the current proposed public health goals. Beneficial uses may not be considered restored by achieving 50 µg/L Cr(Vl). Additionally, the Study descriptions of each alternative imply that the primary cleanup method will be shut off following achievement of cleanup to the 50 µg/L Cr(T) concentration boundary. The exception being Alternative 4 which states that, "(fate and transport modeling and cost estimates assume IRZ is discontinued after 5 years of operation)". Moreover, the descriptions and model simulations in Appendix E imply that natural attenuation will be the principal method for achieving cleanup to background concentrations after remediation to the 50 µg/L Cr(T) boundary occurs. PG&E needs to explicitly describe in an addendum the timing and area of implementation for each proposed active remedial actions. PG&E must also include at least one alternative where remedial actions continue until background concentrations of Cr(VI) are achieved in the groundwater within the Project Area. Response to LRWQCB Comment #5: The five alternatives presented and evaluated in the FS consist of one or more remedial alternative technology types, including: no action (as a basis of comparison only, as is common FS practice); land application of extracted groundwater in agricultural units (AUs) similar to the current Desert View Dairy land treatment unit; in-situ groundwater treatment using in-situ reactive zones (IRZs); and traditional pump and treat (ex-situ). Alternative 4 is a hybrid comprising two of these general technology types operating for different time periods. The active remedial components and durations for each of the FS alternatives are further described below: Alternative 2 (Containment Only) includes extraction of groundwater at the distal end of the
plume generally north of Highway 58, and application of this extracted groundwater to AUs for treatment for the time period necessary to achieve the background goal .
Alternative 3 (Plume-Wide In-situ Treatment) uses IRZ treatment instead of AUs to contain the plume and treat the Cr(VI) mass present in the vicinity of the source area and plume core. For the purpose of the FS, it was assumed the IRZs would operate for the full duration of the remedy to reach the background goal. Alternative 3, as developed for the FS, includes optimization steps with different IRZ configurations, to focus and improve the overall distribution of carbon-amended water (e.g., distinct IRZ configurations were developed for year 0 to 5, year 5 to 10, year 10 to 15 and after 15 years of operation).
Alternative 4 (Core In-Situ Treatment and Beneficial Agricultural Use), which was identified in the FS as the preferred alternative, combines both AUs and IRZs, but assumed different operation time periods. It was assumed that IRZs and AUs would both operate for the first 5 years, then AUs would continue to operate for the duration of the remedy to achieve the background chromium goal.
California Regional Water Quality Control Board - Lahontan Region 31 January 2011 Page 7
Alternative 5 (Plume-Wide Pump and Treat) extracts water throughout the plume, treats it on-Site in an ex-situ treatment plant, and re-injects treated water back into the aquifer (no AUs or IRZs would be used). Similar to Alternatives 2 and 3, the pumping and treatment systems for Alternative 5 were assumed to operate for the full remedy duration to reach the 3.1 µg/L background chromium goal. This alternative also includes three optimization steps and three configurations to enhance performance (e.g., slightly varying extraction and injection well configurations were assumed for year 0 to 10, year 10 to 15, and after 15 years of operation).
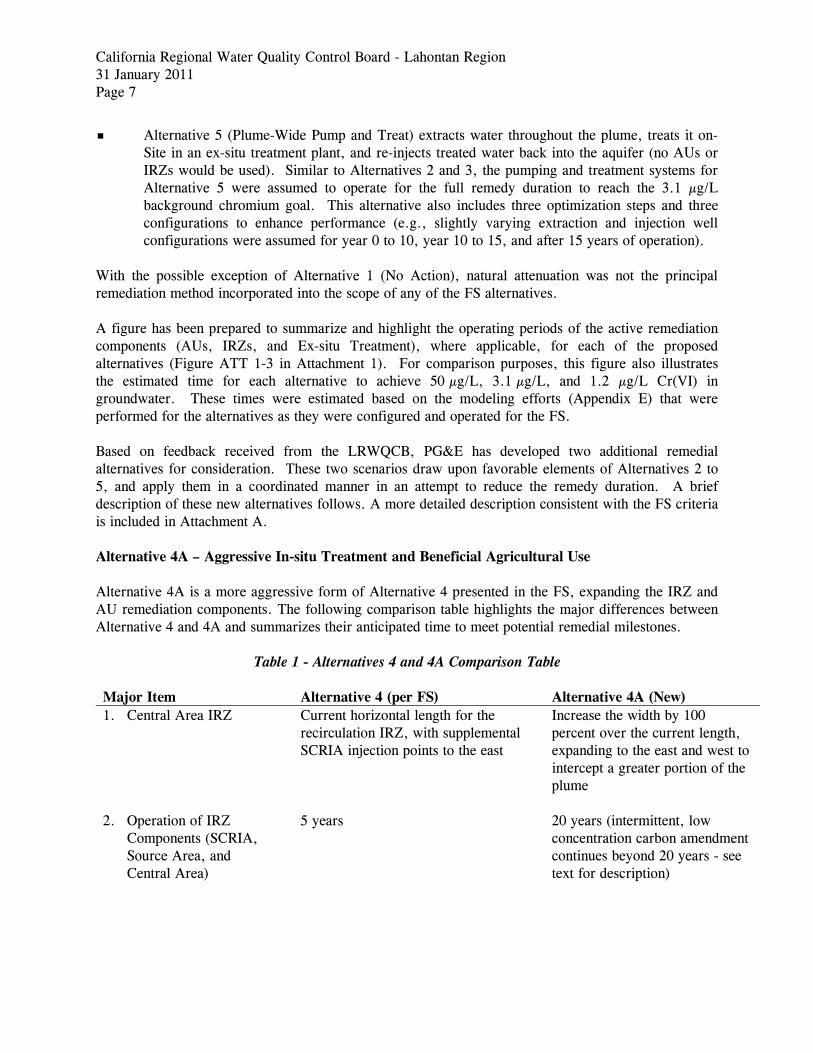
With the possible exception of Alternative 1 (No Action), natural attenuation was not the principal remediation method incorporated into the scope of any of the FS alternatives. A figure has been prepared to summarize and highlight the operating periods of the active remediation components (AUs, IRZs, and Ex-situ Treatment), where applicable, for each of the proposed alternatives (Figure ATT 1-3 in Attachment 1). For comparison purposes, this figure also illustrates the estimated time for each alternative to achieve 50 µg/L, 3.1 µg/L, and 1.2 µg/L Cr(VI) in groundwater. These times were estimated based on the modeling efforts (Appendix E) that were performed for the alternatives as they were configured and operated for the FS. Based on feedback received from the LRWQCB, PG&E has developed two additional remedial alternatives for consideration. These two scenarios draw upon favorable elements of Alternatives 2 to 5, and apply them in a coordinated manner in an attempt to reduce the remedy duration. A brief description of these new alternatives follows. A more detailed description consistent with the FS criteria is included in Attachment A. Alternative 4A – Aggressive In-situ Treatment and Beneficial Agricultural Use Alternative 4A is a more aggressive form of Alternative 4 presented in the FS, expanding the IRZ and AU remediation components. The following comparison table highlights the major differences between Alternative 4 and 4A and summarizes their anticipated time to meet potential remedial milestones.
Table 1 - Alternatives 4 and 4A Comparison Table Major Item Alternative 4 (per FS) Alternative 4A (New) 1. Central Area IRZ Current horizontal length for the
recirculation IRZ, with supplemental SCRIA injection points to the east
Increase the width by 100 percent over the current length, expanding to the east and west to intercept a greater portion of the plume
2. Operation of IRZ Components (SCRIA, Source Area, and Central Area)
5 years 20 years (intermittent, low concentration carbon amendment continues beyond 20 years - see text for description)
California Regional Water Quality Control Board - Lahontan Region 31 January 2011 Page 8
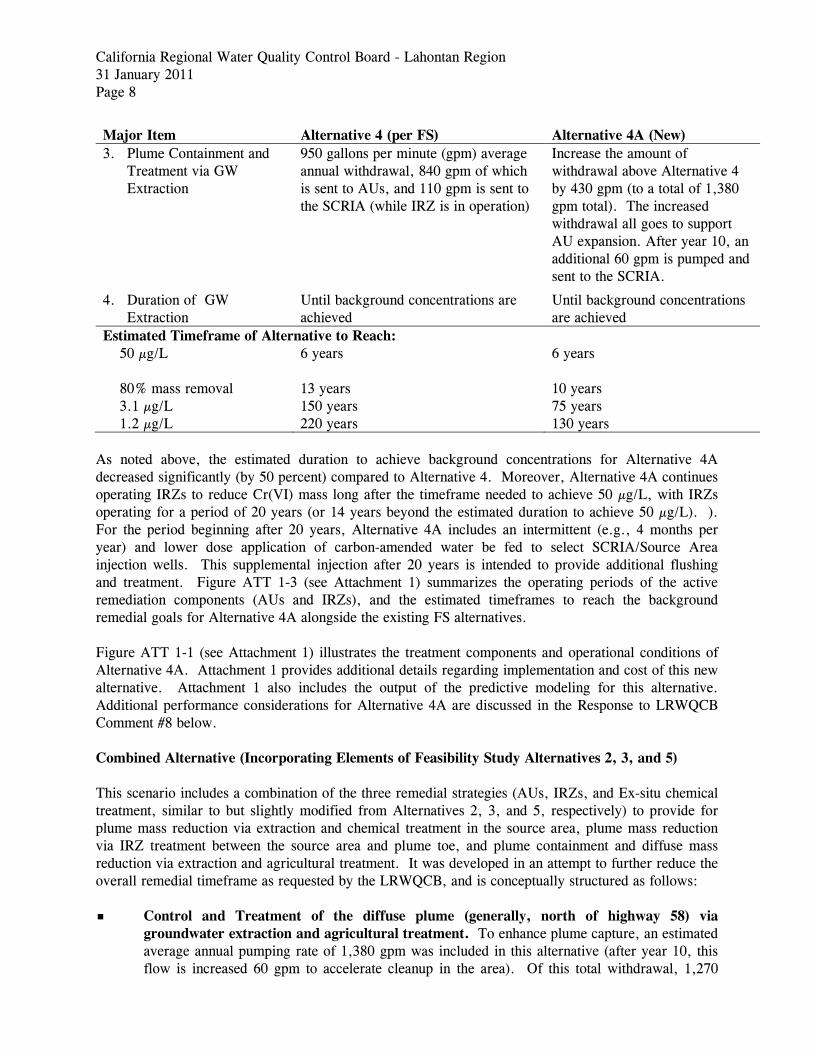
Major Item Alternative 4 (per FS) Alternative 4A (New) 3. Plume Containment and
Treatment via GW Extraction
950 gallons per minute (gpm) average annual withdrawal, 840 gpm of which is sent to AUs, and 110 gpm is sent to the SCRIA (while IRZ is in operation)
Increase the amount of withdrawal above Alternative 4 by 430 gpm (to a total of 1,380 gpm total). The increased withdrawal all goes to support AU expansion. After year 10, an additional 60 gpm is pumped and sent to the SCRIA.
4. Duration of GW Extraction
Until background concentrations are achieved
Until background concentrations are achieved
Estimated Timeframe of Alternative to Reach: 50 µg/L
6 years 6 years
80% mass removal 13 years 10 years 3.1 µg/L 150 years 75 years 1.2 µg/L 220 years 130 years
As noted above, the estimated duration to achieve background concentrations for Alternative 4A decreased significantly (by 50 percent) compared to Alternative 4. Moreover, Alternative 4A continues operating IRZs to reduce Cr(VI) mass long after the timeframe needed to achieve 50 µg/L, with IRZs operating for a period of 20 years (or 14 years beyond the estimated duration to achieve 50 µg/L). ). For the period beginning after 20 years, Alternative 4A includes an intermittent (e.g., 4 months per year) and lower dose application of carbon-amended water be fed to select SCRIA/Source Area injection wells. This supplemental injection after 20 years is intended to provide additional flushing and treatment. Figure ATT 1-3 (see Attachment 1) summarizes the operating periods of the active remediation components (AUs and IRZs), and the estimated timeframes to reach the background remedial goals for Alternative 4A alongside the existing FS alternatives. Figure ATT 1-1 (see Attachment 1) illustrates the treatment components and operational conditions of Alternative 4A. Attachment 1 provides additional details regarding implementation and cost of this new alternative. Attachment 1 also includes the output of the predictive modeling for this alternative. Additional performance considerations for Alternative 4A are discussed in the Response to LRWQCB Comment #8 below. Combined Alternative (Incorporating Elements of Feasibility Study Alternatives 2, 3, and 5) This scenario includes a combination of the three remedial strategies (AUs, IRZs, and Ex-situ chemical treatment, similar to but slightly modified from Alternatives 2, 3, and 5, respectively) to provide for plume mass reduction via extraction and chemical treatment in the source area, plume mass reduction via IRZ treatment between the source area and plume toe, and plume containment and diffuse mass reduction via extraction and agricultural treatment. It was developed in an attempt to further reduce the overall remedial timeframe as requested by the LRWQCB, and is conceptually structured as follows: Control and Treatment of the diffuse plume (generally, north of highway 58) via
groundwater extraction and agricultural treatment. To enhance plume capture, an estimated average annual pumping rate of 1,380 gpm was included in this alternative (after year 10, this flow is increased 60 gpm to accelerate cleanup in the area). Of this total withdrawal, 1,270
California Regional Water Quality Control Board - Lahontan Region 31 January 2011 Page 9
gpm is directed to AUs for treatment, with the balance of 110 gpm (170 gpm after year 10) pumped to the SCRIA for carbon amendment and injection. Given the plume dimensions, it is anticipated that, of the three active remedial components included in this alternative, the AUs will operate until the 3 background chromium goal is achieved.
Treatment of moderately high (<1000 µg/L) chromium concentrations via groundwater extraction and in situ treatment – the Alternative 3 IRZ injections on the eastern edge of the plume running along Summerset Road (near Highway 58 and separate well group east of SCRIA) were replaced by an expanded IRZ configuration in the SCRIA vicinity, and an expanded Central Area IRZ (similar to Alternative 4A).The bulk of the IRZ remedial components including the expanded Central Area IRZ, would be operated for a period of 40 years. For two years after the Source Area pump & treat is discontinued (in year 40 as discussed below), wells in the Source Area/SCRIA vicinity would be injected with carbon-amended water, to facilitate further treatment in residual affected areas. After year 42, an intermittent (e.g., 4 months per year) and lower dose application of carbon amended water would be fed to select SCRIA/Source Area injection wells. This supplemental injection after year 42 is intended to provide additional flushing and treatment, while providing a means of managing excess water extracted from the plume toe area during the non-growing winter.
Treatment of the highest chromium concentrations (>1000 µg/L via groundwater extraction and ex situ chemical treatment – An estimated 200 gpm of withdrawal is needed to provide treatment in the area where chromium concentrations exceed 1,000 µg/L. Extracted groundwater would be conveyed to a new water treatment plant (consistent with Alternative 5 in the FS, chemical precipitation was the assumed treatment method). Treated water would be pumped and re-injected into the aquifer upgradient of the source area to flush residual Cr(VI). Modeling of this new alternative estimates that the source area ex-situ water treatment plant would be operated for a period of 40 years. After 40 years, the Source Area extraction wells are converted into injection well and operated as IRZ wells for 2 years.
Figure ATT 1-3 (Attachment 1) summarizes the estimated operating periods of the active remedial components (AUs, IRZs, and Ex-situ Treatment) used in the FS, and the model-predicted timeframes to reach various remedial goals and milestones for this combined alternative scenario alongside the FS alternatives. Predicted times for the combined alternatives to reach remedial goals are shown below:
Table 2 – Estimated Times to Reach Chromium Remediation Goals
for Combined Alternatives
Cr(VI) Thresholds Timeframe 50 µg/L 28 years
80% mass removal 18 years 3.1 µg/L 90 years 1.2 µg/L 130 years
The predicted duration required to achieve the average background chromium concentration (1.2 µg/L) for the Combined Alternatives scenario is similar to Alternative 4A, while the predicted time to reach the MCL (50 µg/L) and the background chromium goal is longer for this scenario than it is for Alternative 4A. This difference in treatment time for higher concentration areas is understandable, as the primary treatment mechanism for pump and treat (flushing) is expected to be slower than the
California Regional Water Quality Control Board - Lahontan Region 31 January 2011 Page 10
primary treatment mechanism of in-situ treatment (direct reduction). Figure ATT 1-4 summarizes the scope of this combined alternatives scenario. Attachment 1 provides additional details regarding the scope and cost of this new alternative. Additional performance considerations for this Combined Alternatives scenario are provided in the Response to LRWQCB Comment #8. LRWQCB Comment #6: The Study contains conflicting information concerning the degree of chromium clean up using in-situ remediation. Section 4.3.1 states that in-situ treatment in the Central and Source Areas was able to achieve clean up of chromium to background levels in approximately 50 to 60 percent of the treated wells. Yet, the section concludes that it would be extremely difficult to fully treat Cr(Vl) to background in all areas of the plume due to variations in groundwater flux and heterogeneities in the formation. In comparison, data in in-situ monitoring reports imply that more aggressive treatment implementation would enable clean up chromium in groundwater to background levels in all or almost all treatment wells. Water Board staff requests PG&E evaluate the benefits of more aggressive treatment actions which include in-situ treatment for a longer period of time (10 and 20 years), closer-spaced extraction and injection wells, and the application of additional in-situ zones. Response to LRWQCB Comment #6: As stated in response to comment #5, a more aggressive form of Alternative 4 was evaluated – Aggressive Alternative 4 (Alternative 4A). Aggressive Alternative 4 includes operation of in-situ treatment for a longer period, closer-spaced extraction and injection wells, and the application of additional IRZs. Enhancements made in Alternative 4A include increased northern groundwater extraction, more agriculture units, an expanded Central Area IRZ recirculation line, an expanded SCRIA injection system, and an expanded Source Area IRZ recirculation system. In total, Alternative 4A adds approximately 60 wells to the current carbon delivery system. Transport modeling predicts that by year 10, approximately 80% of the Cr(VI) mass in the aquifer would be treated. After 10 years of modeled treatment, three extraction wells were added to the northern DVD/SCRIA extraction area and three injection wells were added to the well layout to address residual elevated Cr(VI) areas. At year 20, modeling predicts that the majority of the Cr(VI) mass south of Highway 58 will be below background, suggesting that a more aggressive and longer duration treatment layout similar to Alternative 4A can be successful at treating the southern half of the plume within approximately 20 years. A detailed description and evaluation of Alternative 4A is included in Attachment 1. LRWQCB Comment #7: Water Board staff requests PG&E provide an estimate for chromium mass (hexavalent, trivalent, and total chromium) to be left in the environment following completion of each of the remediation alternatives. Alternative 1 indicates that all chromium mass will be left in the groundwater over a wide area in the form of hexavalent chromium. Alternatives 2 through 4 imply that chromium mass will be left in the soil within 5 feet of ground surface and/or at the water table, approximately 80 feet below ground surface, in the trivalent solid state. Lastly, Alternative 5 indicates that most of the chromium mass will be removed from the environment by ex-situ treatment while some will be left in the soil within 5 feet of ground surface in the trivalent solid
California Regional Water Quality Control Board - Lahontan Region 31 January 2011 Page 11
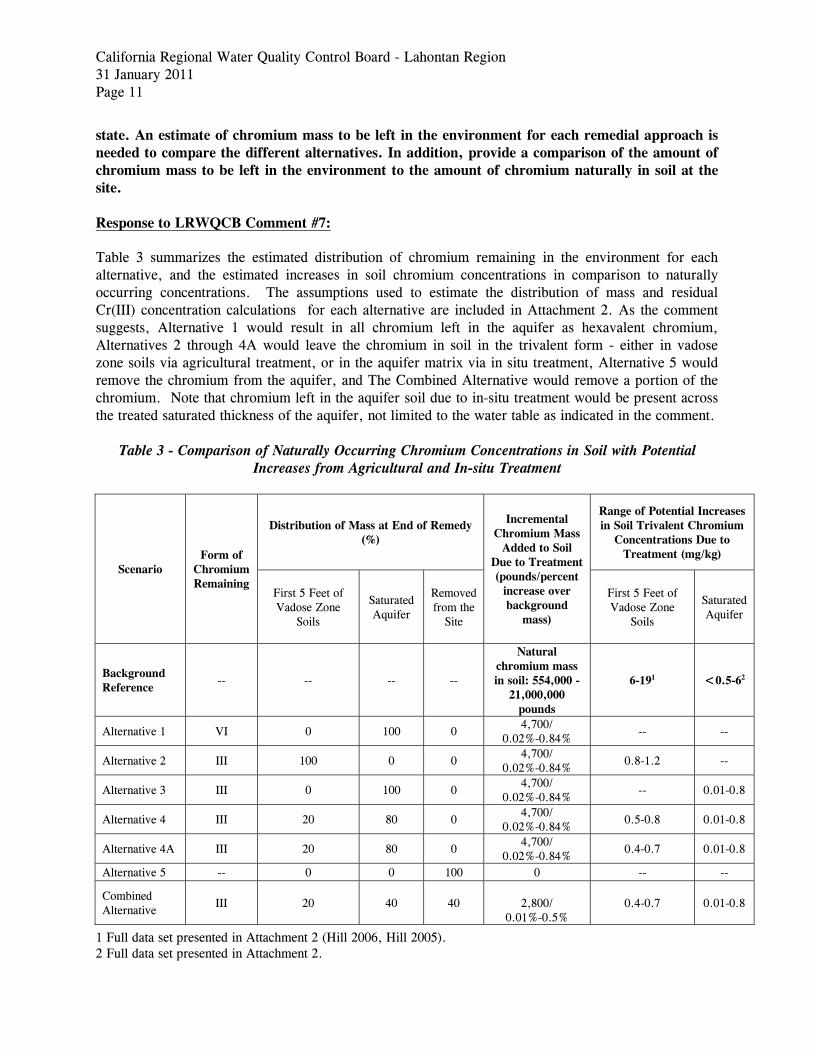
state. An estimate of chromium mass to be left in the environment for each remedial approach is needed to compare the different alternatives. In addition, provide a comparison of the amount of chromium mass to be left in the environment to the amount of chromium naturally in soil at the site. Response to LRWQCB Comment #7: Table 3 summarizes the estimated distribution of chromium remaining in the environment for each alternative, and the estimated increases in soil chromium concentrations in comparison to naturally occurring concentrations. The assumptions used to estimate the distribution of mass and residual Cr(III) concentration calculations for each alternative are included in Attachment 2. As the comment suggests, Alternative 1 would result in all chromium left in the aquifer as hexavalent chromium, Alternatives 2 through 4A would leave the chromium in soil in the trivalent form - either in vadose zone soils via agricultural treatment, or in the aquifer matrix via in situ treatment, Alternative 5 would remove the chromium from the aquifer, and The Combined Alternative would remove a portion of the chromium. Note that chromium left in the aquifer soil due to in-situ treatment would be present across the treated saturated thickness of the aquifer, not limited to the water table as indicated in the comment.
Table 3 - Comparison of Naturally Occurring Chromium Concentrations in Soil with Potential Increases from Agricultural and In-situ Treatment
Scenario Form of
Chromium Remaining
Distribution of Mass at End of Remedy (%)
Incremental Chromium Mass
Added to Soil Due to Treatment (pounds/percent
increase over background
mass)
Range of Potential Increases in Soil Trivalent Chromium
Concentrations Due to Treatment (mg/kg)
First 5 Feet of Vadose Zone
Soils
Saturated Aquifer
Removed from the
Site
First 5 Feet of Vadose Zone
Soils
Saturated Aquifer
Background Reference
-- -- -- --
Natural chromium mass in soil: 554,000 -
21,000,000 pounds
6-191 <0.5-62
Alternative 1 VI 0 100 0 4,700/
0.02%-0.84% -- --
Alternative 2 III 100 0 0 4,700/
0.02%-0.84% 0.8-1.2 --
Alternative 3 III 0 100 0 4,700/
0.02%-0.84% -- 0.01-0.8
Alternative 4 III 20 80 0 4,700/
0.02%-0.84% 0.5-0.8 0.01-0.8
Alternative 4A III 20 80 0 4,700/
0.02%-0.84% 0.4-0.7 0.01-0.8
Alternative 5 -- 0 0 100 0 -- --
Combined Alternative
III 20 40 40
2,800/ 0.01%-0.5%
0.4-0.7 0.01-0.8
1 Full data set presented in Attachment 2 (Hill 2006, Hill 2005). 2 Full data set presented in Attachment 2.
California Regional Water Quality Control Board - Lahontan Region 31 January 2011 Page 12
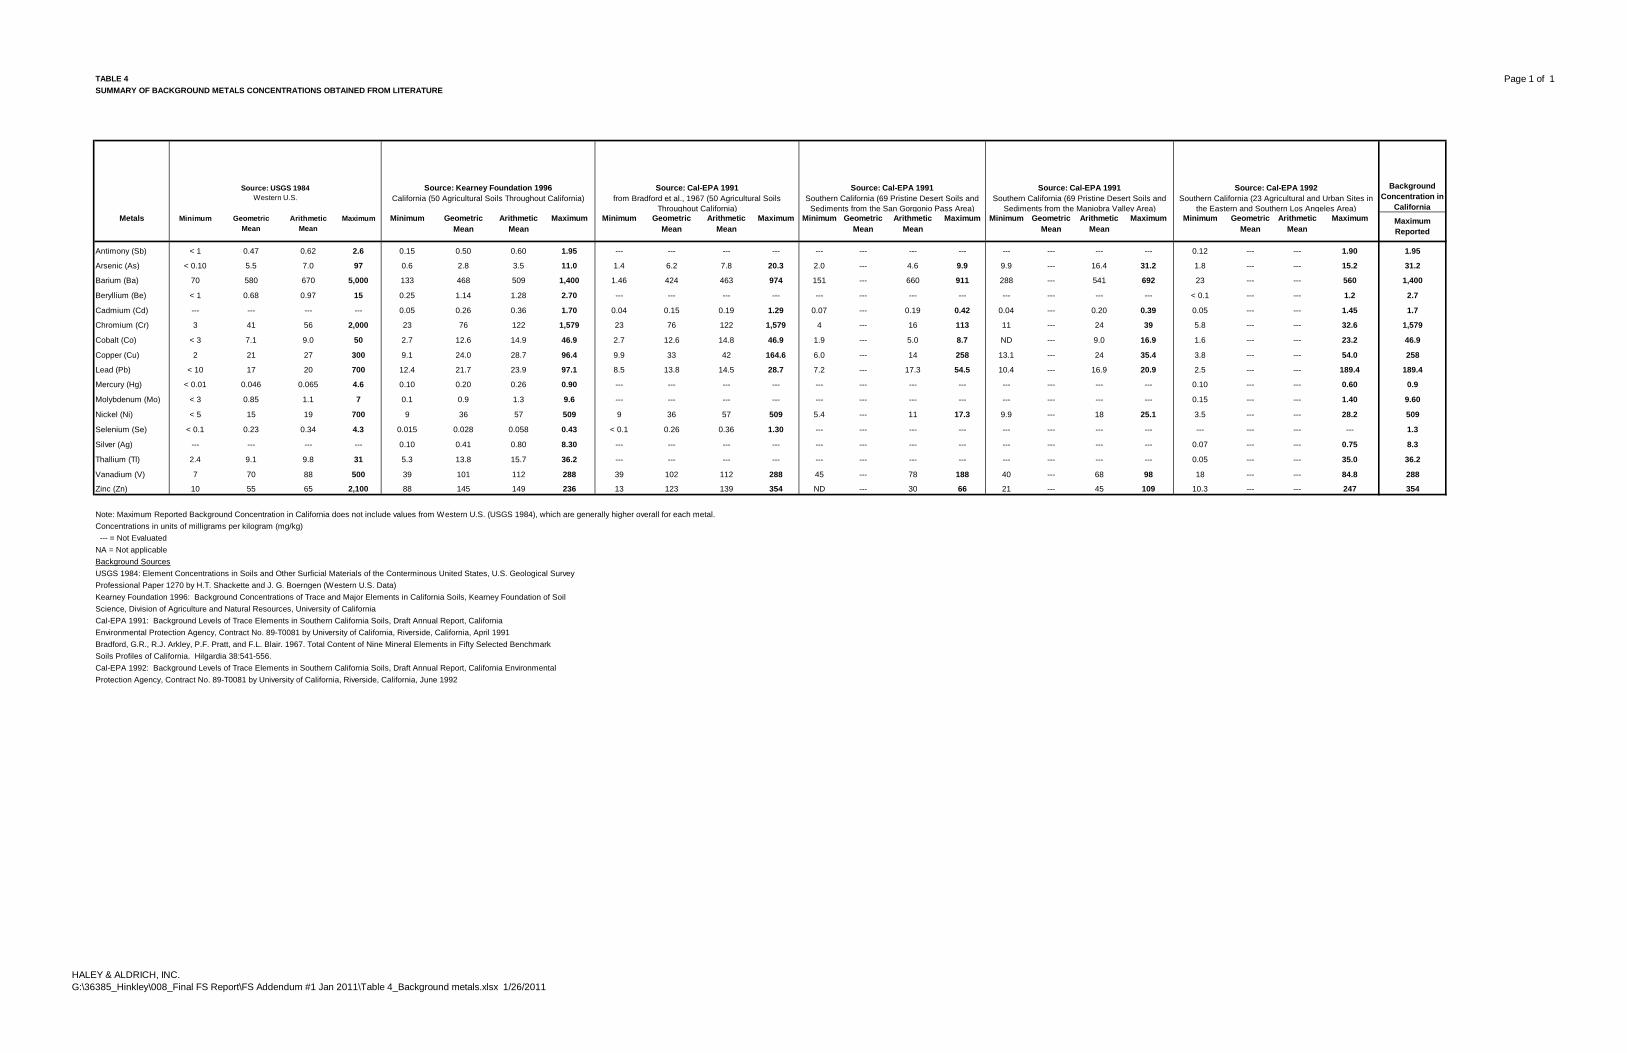
The amount of chromium estimated to remain in the environment, up to 4,700 pounds, is negligible in comparison with the estimated range of naturally occurring chromium in the soil: 554,000 to 21,000,000 pounds (up to 0.8% increase). The range of naturally occurring chromium was estimated considering a soil volume 170 feet thick over the area of the plume at naturally occurring soil concentrations ranging from 0.5 to 19 mg/kg. Background Cr(III) concentrations range from 6 to 19 mg/kg in the first 5 feet of vadose zone soils. Treatment of Cr(VI) in agricultural units is predicted to increase the Cr(III) soil concentrations by 0.4 to 1.2 mg/kg. The estimated increases in Cr(III) concentrations due to treatment via agricultural units (up to 1.2 mg/kg) are insignificant in comparison to the observed natural variability in vadose zone soil (13 mg/kg). The assumptions used to estimate the residual Cr(III) concentration calculations are included in Attachment 2. Observed background Cr(III) concentrations within the aquifer matrix range from less than 0.5 to 6 mg/kg. Treatment of Cr(VI) in IRZs is predicted to increase local matrix Cr(III) concentrations by up to 0.4 mg/kg. The estimated increases in Cr(III) concentrations in the aquifer matrix caused by treatment via IRZs are insignificant in comparison to the variability in background aquifer soil concentrations. The assumptions used to estimate the residual Cr(III) concentration calculations are included in Attachment 2. Naturally Occurring Chromium Conditions Attachment 2 Tables 2-1 and 2-2 present soil data characterizing naturally occurring Cr(III) conditions in shallow vadose zone and aquifer soils, respectively. Shallow vadose zone soil concentrations presented in Table 2-1 include data from samples collected from the Desert View Diary Land Treatment Unit (DVD LTU) prior to operation in 2004 (samples designated DVD-SB), from the background characterization of the Ranch Land Treatment Unit in 2003 (samples designated RRS, Hill 2006), and from samples collected from soils outside the operating fields in the DVD LTU in 2005, designated DVD-LB (Hill 2005). Vadose zone soil concentrations within this data set range from 6 to 19 mg/kg, with an average concentration of 12 mg/kg. Concentrations of Cr(III) in the aquifer matrix representative of naturally occurring conditions in Hinkley are presented in Attachment 2 Table 2-2, and include samples collected from a background location, BW-1, located southeast of the compressor station, and samples collected from the saturated zone during installation of the CA-MW-100 series monitoring wells for the Central Area IRZ system. Cr(III) concentrations in the BW-1 samples ranged from less than 0.5 to 6 mg/kg. Cr(III) concentrations in the Central Area monitor well samples ranged from 0.708 to 27.4 mg/kg. Although these samples were collected from an area within the plume, Cr(VI) from the plume is not likely a major contributor to Cr(T) concentrations. Soil concentrations varied with lithology, with higher concentrations associated with finer grained silts and clays. The range of concentrations was higher in the Central Area sample set, due to the collection of finer grained samples from this area. As a point of comparison, a literature search for background metals concentrations in California and the Western United States was conducted. A summary of these results is presented in Table 4. Below is the range of chromium concentrations reported in each document: Western US data (USGS, 1994): 3 to 2,000 mg/kg;
50 agricultural soils throughout California (Kearny Foundation, 1996): 23 to 1,579 mg/kg;
California Regional Water Quality Control Board - Lahontan Region 31 January 2011 Page 13
50 agricultural soils throughout California (Cal-EPA, 1991): 23 to 1,579 mg/kg;
69 pristine desert soils and sediments from the San Gorgonio Pass area (Cal-EPA, 1991): 4 to 113 mg/kg;
69 pristine desert soils and sediments from the Maniobra Valley area (Cal-EPA, 1991): 11 to 39 mg/kg; and
23 agricultural and urban sites in eastern and southern Los Angeles area (Cal-EPA, 1992): 5.8 to 32.6 mg/kg.
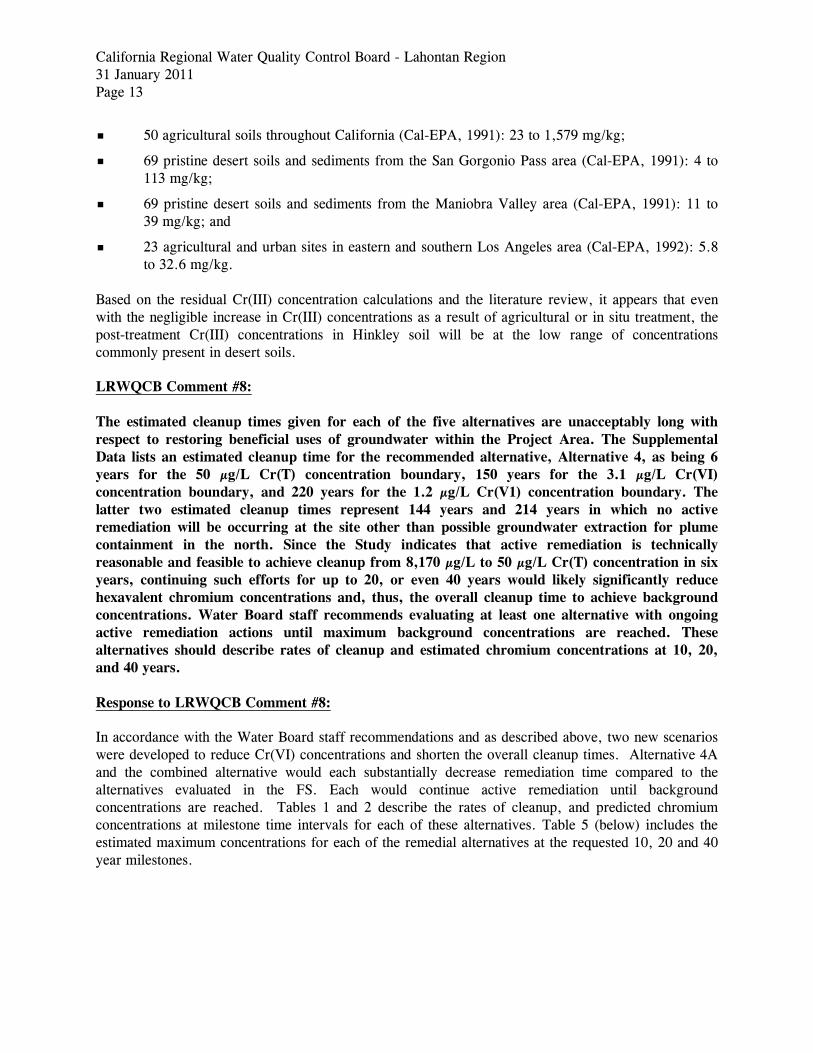
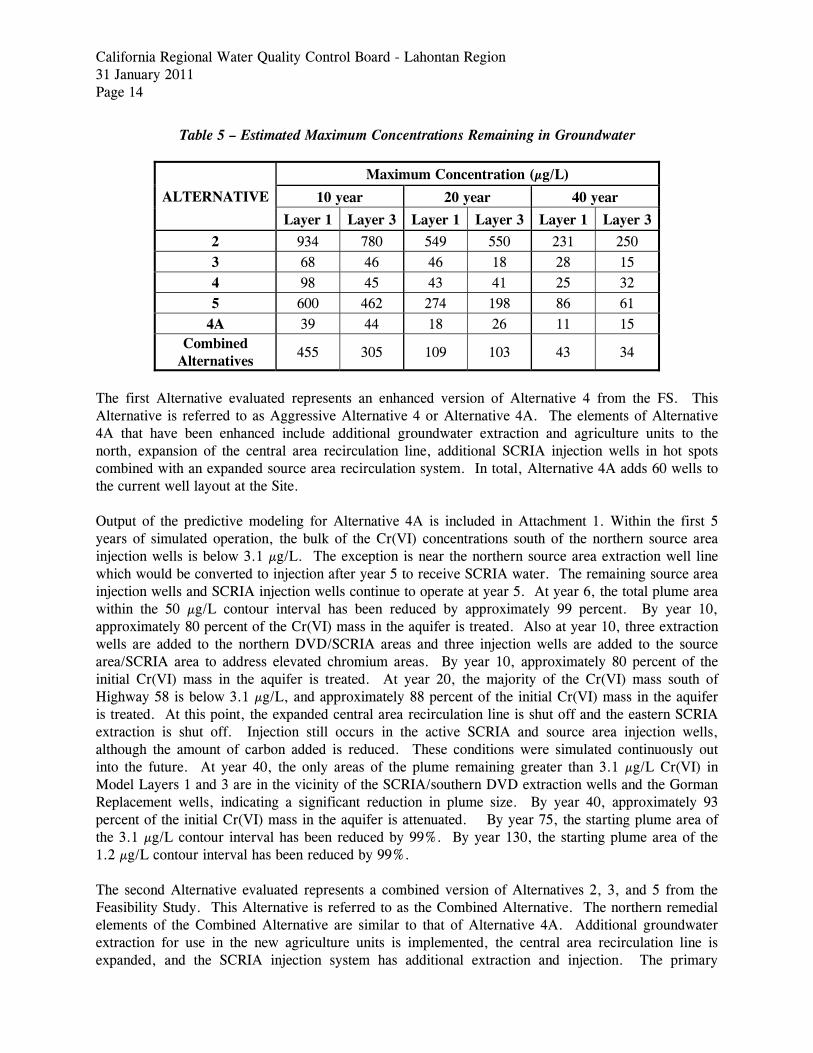
Based on the residual Cr(III) concentration calculations and the literature review, it appears that even with the negligible increase in Cr(III) concentrations as a result of agricultural or in situ treatment, the post-treatment Cr(III) concentrations in Hinkley soil will be at the low range of concentrations commonly present in desert soils. LRWQCB Comment #8: The estimated cleanup times given for each of the five alternatives are unacceptably long with respect to restoring beneficial uses of groundwater within the Project Area. The Supplemental Data lists an estimated cleanup time for the recommended alternative, Alternative 4, as being 6 years for the 50 µg/L Cr(T) concentration boundary, 150 years for the 3.1 µg/L Cr(VI) concentration boundary, and 220 years for the 1.2 µg/L Cr(V1) concentration boundary. The latter two estimated cleanup times represent 144 years and 214 years in which no active remediation will be occurring at the site other than possible groundwater extraction for plume containment in the north. Since the Study indicates that active remediation is technically reasonable and feasible to achieve cleanup from 8,170 µg/L to 50 µg/L Cr(T) concentration in six years, continuing such efforts for up to 20, or even 40 years would likely significantly reduce hexavalent chromium concentrations and, thus, the overall cleanup time to achieve background concentrations. Water Board staff recommends evaluating at least one alternative with ongoing active remediation actions until maximum background concentrations are reached. These alternatives should describe rates of cleanup and estimated chromium concentrations at 10, 20, and 40 years. Response to LRWQCB Comment #8: In accordance with the Water Board staff recommendations and as described above, two new scenarios were developed to reduce Cr(VI) concentrations and shorten the overall cleanup times. Alternative 4A and the combined alternative would each substantially decrease remediation time compared to the alternatives evaluated in the FS. Each would continue active remediation until background concentrations are reached. Tables 1 and 2 describe the rates of cleanup, and predicted chromium concentrations at milestone time intervals for each of these alternatives. Table 5 (below) includes the estimated maximum concentrations for each of the remedial alternatives at the requested 10, 20 and 40 year milestones.
California Regional Water Quality Control Board - Lahontan Region 31 January 2011 Page 14
Table 5 – Estimated Maximum Concentrations Remaining in Groundwater
ALTERNATIVE
Maximum Concentration (µg/L)
10 year 20 year 40 year
Layer 1 Layer 3 Layer 1 Layer 3 Layer 1 Layer 3 2 934 780 549 550 231 250 3 68 46 46 18 28 15 4 98 45 43 41 25 32 5 600 462 274 198 86 61
4A 39 44 18 26 11 15 Combined
Alternatives 455 305 109 103 43 34
The first Alternative evaluated represents an enhanced version of Alternative 4 from the FS. This Alternative is referred to as Aggressive Alternative 4 or Alternative 4A. The elements of Alternative 4A that have been enhanced include additional groundwater extraction and agriculture units to the north, expansion of the central area recirculation line, additional SCRIA injection wells in hot spots combined with an expanded source area recirculation system. In total, Alternative 4A adds 60 wells to the current well layout at the Site. Output of the predictive modeling for Alternative 4A is included in Attachment 1. Within the first 5 years of simulated operation, the bulk of the Cr(VI) concentrations south of the northern source area injection wells is below 3.1 µg/L. The exception is near the northern source area extraction well line which would be converted to injection after year 5 to receive SCRIA water. The remaining source area injection wells and SCRIA injection wells continue to operate at year 5. At year 6, the total plume area within the 50 µg/L contour interval has been reduced by approximately 99 percent. By year 10, approximately 80 percent of the Cr(VI) mass in the aquifer is treated. Also at year 10, three extraction wells are added to the northern DVD/SCRIA areas and three injection wells are added to the source area/SCRIA area to address elevated chromium areas. By year 10, approximately 80 percent of the initial Cr(VI) mass in the aquifer is treated. At year 20, the majority of the Cr(VI) mass south of Highway 58 is below 3.1 µg/L, and approximately 88 percent of the initial Cr(VI) mass in the aquifer is treated. At this point, the expanded central area recirculation line is shut off and the eastern SCRIA extraction is shut off. Injection still occurs in the active SCRIA and source area injection wells, although the amount of carbon added is reduced. These conditions were simulated continuously out into the future. At year 40, the only areas of the plume remaining greater than 3.1 µg/L Cr(VI) in Model Layers 1 and 3 are in the vicinity of the SCRIA/southern DVD extraction wells and the Gorman Replacement wells, indicating a significant reduction in plume size. By year 40, approximately 93 percent of the initial Cr(VI) mass in the aquifer is attenuated. By year 75, the starting plume area of the 3.1 µg/L contour interval has been reduced by 99%. By year 130, the starting plume area of the 1.2 µg/L contour interval has been reduced by 99%. The second Alternative evaluated represents a combined version of Alternatives 2, 3, and 5 from the Feasibility Study. This Alternative is referred to as the Combined Alternative. The northern remedial elements of the Combined Alternative are similar to that of Alternative 4A. Additional groundwater extraction for use in the new agriculture units is implemented, the central area recirculation line is expanded, and the SCRIA injection system has additional extraction and injection. The primary
California Regional Water Quality Control Board - Lahontan Region 31 January 2011 Page 15
difference of the Combined Alternative is that a new source area pump and treatment system operating at 200 gpm has been installed to address high chromium concentrations (greater than 1,000 µg/L). The treated effluent from the pump and treatment system is injected upgradient of the source areas to facilitate flushing of chromium. The purpose of this source area system is to be a pump and treat system to target and flush the hexavalent chromium in the source area. By year 10, approximately 60 percent of the initial Cr(VI) mass in the aquifer is attenuated. At year 10, the source area Cr(VI) progressed far enough north that the upgradient injection arc was turned off and replaced by the northern source area injection line injecting treated water. Two of the source area extraction wells were turned off and the rates were allocated to the remaining source area extraction wells. Additionally, at year 10, three extraction wells are added to the northern DVD/SCRIA areas. At year 18, approximately 80 percent of the initial Cr(VI) mass in the aquifer is attenuated. At year 20, the majority of the Cr(VI) mass in the vicinity of the SCRIA injection, southern source area, and expanded central recirculation is below 3.1 µg/L. The remaining mass is primarily in the vicinity of the source area extraction wells and the northern extraction wells. By year 28, the starting plume area of the 50 µg/L contour interval has been reduced by 99%. By year 40, approximately 90 percent of the initial Cr(VI) mass in the aquifer is attenuated. At year 40, the northern Source Area extraction wells are converted into injection wells and operated as IRZ wells for 2 years to address the downgradient hexavalent chromium concentrations. Also at year 40, the expanded central area recirculation wells and the eastern SCRIA extraction wells are shutoff. After year 42, injection still occurs in the active SCRIA and source area injection wells, although the amount of carbon added is reduced. By year 90, the starting plume area of the 3.1 µg/L contour interval has been reduced by 99%. By year 130, the starting plume area of the 1.2 µg/L contour interval has been reduced by 99%. LRWQCB Comment #9: Water Board staff requests PG&E clarify its recommendation in an addendum to include at least one revised alternative that hastens cleanup times and provides better measures to ensure that the existing plume size will not expand in size, pursuant to Water Board's 2008 and 2009 Cleanup and Abatement Orders. In addition, evaluate benefits and impacts of various remedies and scales of implementation for a revised alternative. Response to LRWQCB Comment #9: As previously mentioned, two new scenarios (Alternative 4A and the Combined Alternatives) have been evaluated since the FS was published, that combine proven technologies used at this or other sites for Cr(VI) treatment in groundwater. They incorporate years of Site-specific experience gained in pilot testing and operating numerous remedial alternatives. Further, the assembled scenarios are presented based on their anticipated ability to comply with the project regulatory requirements, as outlined in Section 2 of the FS (in particular the CAO and Resolution 92-49), and their ability to meet the ROs detailed in Section 5 of the FS. Both alternatives employ robust hydraulic containment of the plume. A detailed description and evaluation of the two alternatives are included in Attachment 1. The evaluation concluded that Alternative 4A is the preferred alternative, as it: Meets remedial objectives in the shortest time period;
Is far more feasible than the combined alternative, because it employs compatible remedial technologies (in situ treatment and ex situ treatment technologies are not compatible without a buffer area to prevent the uptake of in situ byproducts); and
California Regional Water Quality Control Board - Lahontan Region 31 January 2011 Page 16
Would have less negative impacts on the site. RWQCB General Consideration #1: As part of developing and evaluating alternatives with active remediation occurring over larger areas and continuing over longer time periods, Water Board staff requests PG&E evaluate in an addendum a new alternative that combines Alternatives 2, 3, and 5 for simultaneous implementation in an aggressive manner (e.g. greater pumping rates, additional and extended in-situ treatment zones, longer active remediation time, etc.). An evaluation of these combined alternatives should include description of benefits (increased reduction of chromium concentrations in groundwater) and adverse effects. Response to RWQCB General Consideration #1: Combined Alternative Evaluation As requested by the LRWQCB an evaluation of the benefits and adverse effects of the combined alternatives 2, 3, and 5 (Combined Alternative) has been performed. A summary of the anticipated performance of these additional alternatives was presented in Response #5 above. A detailed description and evaluation of these additional alternatives consistent with the FS is included in Attachment 1. RWQCB General Consideration #2: Alternative 2 provides for plume containment at the toe or downgradient-most end of the plume, using extraction wells and agricultural land treatment. This method appropriately implemented could prevent further chromium migration in groundwater to unaffected areas. Since PG&E already owns the Desert View Dairy and the Gorman fields in the north, implementation of this alternative would be almost immediate. Additional extraction wells are likely needed to ensure containment of potential plume migration along the northwestern and southeastern plume boundaries. Response to RWQCB General Consideration #2: Alternative 2-Plume Containment The LRWQCB is correct in assuming that Alternative 2 could be rapidly implemented. In fact, additional extraction wells and AUs are currently being installed to enhance plume containment. Based on the model simulations presented in the FS, the Alternative 2 pumping program is anticipated to maintain plume control to the north. If this alternative is selected, then additional fine tuning of the remedial alternative would be completed during a detailed modeling and design phase which would adjust the number of extraction wells or AUs deployed to provide robust plume control. RWQCB General Consideration #3: Alternative 3, which primarily proposes plume-wide in-situ remediation, may be appropriate for implementation over the entire off-site plume length (approximately 1.8 miles), to the containment zone in the north. This alternative is easily implemented considering that in-situ remediation facilities are already in place and would only require additional wells and piping to expand treatment out to the 3.1 µg/L Cr(VI) plume boundary. Some property acquisition might also be required. Potential by-products of reduced metals, such as iron, manganese, and arsenic, would only occur for a limited distance and over a limited time during overall remediation activities.
California Regional Water Quality Control Board - Lahontan Region 31 January 2011 Page 17
Response to RWQCB General Consideration#3: Alternative 3 - Plume-Wide In-Situ Treatment As discussed in Section 4.3.4 of the FS, and in greater detail in a focused study in Appendix C, in-situ byproducts (typically iron, manganese, and/or arsenic) dissolve into groundwater within the reducing (low redox potential) footprint of the IRZ. The concentrations of byproducts that are generated by in situ treatment are dependent upon the type of carbon amendment that is applied, the rate of organic carbon loading, and the location within the Site. The generation of byproducts is largely a function of organic carbon loading, and it can be minimized to a certain extent by lowering the applied organic loading rate. However, a balance must be struck to achieve robust Cr(VI) reduction in the desired area. The time for recovery to baseline condition varies, but is believed to be on the order of months to years. Outside of the reducing zone generated by the IRZ system, dissolved iron, manganese and arsenic attenuate through sorption, diffusion, and precipitation. This restricts the downgradient flux of byproducts. Given an adequate distance for byproduct attenuation, a clean water front will arrive downgradient without Cr(VI) or byproducts above background conditions. One concern with implementation of in situ technology in the northern diffuse plume area, or near the lateral edges of the plume, is that there may be less distance between sensitive downgradient beneficial uses and in situ operations. Additionally, as IRZs are implemented over a larger area, the corresponding amount of byproducts generated will increase. This increased byproduct load may result in significantly longer attenuation distances that those observed in the comparatively localized IRZs that have been implemented to date RWQCB General Consideration #4: Alternative 5, which primarily proposes groundwater extraction and ex-situ treatment using an aboveground treatment facility, may be appropriate for implementation in the Source Area in lieu of in-situ remediation for two reasons: chromium exists at hazardous waste concentrations and the method offers complete removal of chromium from the environment, preventing potential conversion back to hexavalent chromium in the future. Implementing this alternative would require constructing a new treatment facility on the Compressor Station property, already in PG&E's control, similar to the facility built to remediate hexavalent contamination in Topock. Response to RWQCB General Consideration #4: Alternative 5 PG&E has evaluated this option in the Combined Alternatives scenario discussed in Comment #5. A detailed evaluate of this alternative is included in Attachment 1. RWQCB General Consideration #5: As proposed in the Study for each alternative, it is appropriate to continue operating the freshwater injection wells in the northwestern plume area to prevent plume migration in that direction. Response to RWQCB General Consideration #5: Freshwater Injection As part of the current Site remedy, continued freshwater injection has been evaluated as an integral component of the selected final remedy. In the future, modeling simulations will be used to evaluate locations where continued groundwater injection improves or reduces the effectiveness of the final
California Regional Water Quality Control Board - Lahontan Region 31 January 2011 Page 18
remedy. Recommendations regarding the specifics of continued freshwater injection will be included in the final remedial design. Until then, freshwater injections will continue at the northwest edge of the plume, to maintain robust hydraulic control. RWQCB General Consideration #6: Following achievement of remediation by the three alternatives to 3.1 µg/L Cr(VI), monitored natural attenuation could be used to verify final site cleanup to the average background value of 1.2 µg/L Cr(VI). Response to RWQCB General Consideration #6: Monitored Natural Attenuation Comment noted. While testing done to date has not indicated a significant natural attenuation mechanism in the main portion of the upper aquifer (see Appendix C of the original FS), it is possible that longer-term monitoring of the aquifer during cleanup will demonstrate such a mechanism. CLOSING We appreciate the opportunity to present these responses to your requests, and we look forward to working with the Water Board in the evaluation and selection of a final remedy at Hinkley. If you have any questions, please do not hesitate to contact me. Sincerely yours, Eric Johnson Hinkley Remediation Project Manager c: Lisa Dernbach/RWQCB Lahontan Region, South Lake Tahoe
Mike Plaziak/RWQCB Lahontan Region, Victorville Attachments: Table 1 – Alternatives 4 and 4A Comparison Table (embedded in text)
Table 2 – Estimated Times to Reach Chromium Remediation Goals for Combined Alternatives (embedded in text) Table 3 –Comparison of Naturally Occurring Chromium Concentrations in Soil with Potential Increases from Agricultural and In-situ Treatment (embedded in text)
Table 4 – Summary of Background Metals Concentrations Obtained from Literature Table 5 – Estimated Maximum Concentrations Remaining in Groundwater (embedded in text)
Figure 1 –Chromium Plume Outlines Attachment 1 – Evaluation of Alternative 4A and Combined Alternatives Attachment 2 - Residual Post-Treatment Chromium Concentration Calculation Assumptions
California Regional Water Quality Control Board - Lahontan Region 31 January 2011 Page 19
References 1. Hill 2005. Quarterly Monitoring Report. Desert View Dairy Land Treatment Unity. Hinkley,
California. July 28.
2. Hill, 2006. Waste Characterization Report. Ranch Land Treatment Unit. Hinkley, California. March.
G:\36385_Hinkley\008_Final FS Report\FS Addendum #1 Jan 2011\2011_0131_Addendum#1 to FS_F.docx
Page 1 of 1TABLE 4 SUMMARY OF BACKGROUND METALS CONCENTRATIONS OBTAINED FROM LITERATURE
Metals Minimum Geometric Arithmetic Maximum Minimum Geometric Arithmetic Maximum Minimum Geometric Arithmetic Maximum Minimum Geometric Arithmetic Maximum Minimum Geometric Arithmetic Maximum Minimum Geometric Arithmetic MaximumMean Mean Mean Mean Mean Mean Mean Mean Mean Mean Mean Mean
Antimony (Sb) < 1 0.47 0.62 2.6 0.15 0.50 0.60 1.95 --- --- --- --- --- --- --- --- --- --- --- --- 0.12 --- --- 1.90 1.95
Arsenic (As) < 0.10 5.5 7.0 97 0.6 2.8 3.5 11.0 1.4 6.2 7.8 20.3 2.0 --- 4.6 9.9 9.9 --- 16.4 31.2 1.8 --- --- 15.2 31.2
Barium (Ba) 70 580 670 5,000 133 468 509 1,400 1.46 424 463 974 151 --- 660 911 288 --- 541 692 23 --- --- 560 1,400
Beryllium (Be) < 1 0.68 0.97 15 0.25 1.14 1.28 2.70 --- --- --- --- --- --- --- --- --- --- --- --- < 0.1 --- --- 1.2 2.7
Cadmium (Cd) --- --- --- --- 0.05 0.26 0.36 1.70 0.04 0.15 0.19 1.29 0.07 --- 0.19 0.42 0.04 --- 0.20 0.39 0.05 --- --- 1.45 1.7
Chromium (Cr) 3 41 56 2,000 23 76 122 1,579 23 76 122 1,579 4 --- 16 113 11 --- 24 39 5.8 --- --- 32.6 1,579
Cobalt (Co) < 3 7.1 9.0 50 2.7 12.6 14.9 46.9 2.7 12.6 14.8 46.9 1.9 --- 5.0 8.7 ND --- 9.0 16.9 1.6 --- --- 23.2 46.9
Copper (Cu) 2 21 27 300 9.1 24.0 28.7 96.4 9.9 33 42 164.6 6.0 --- 14 258 13.1 --- 24 35.4 3.8 --- --- 54.0 258
Lead (Pb) < 10 17 20 700 12.4 21.7 23.9 97.1 8.5 13.8 14.5 28.7 7.2 --- 17.3 54.5 10.4 --- 16.9 20.9 2.5 --- --- 189.4 189.4
Mercury (Hg) < 0.01 0.046 0.065 4.6 0.10 0.20 0.26 0.90 --- --- --- --- --- --- --- --- --- --- --- --- 0.10 --- --- 0.60 0.9
Molybdenum (Mo) < 3 0.85 1.1 7 0.1 0.9 1.3 9.6 --- --- --- --- --- --- --- --- --- --- --- --- 0.15 --- --- 1.40 9.60
Nickel (Ni) < 5 15 19 700 9 36 57 509 9 36 57 509 5.4 --- 11 17.3 9.9 --- 18 25.1 3.5 --- --- 28.2 509
Selenium (Se) < 0.1 0.23 0.34 4.3 0.015 0.028 0.058 0.43 < 0.1 0.26 0.36 1.30 --- --- --- --- --- --- --- --- --- --- --- --- 1.3
Silver (Ag) --- --- --- --- 0.10 0.41 0.80 8.30 --- --- --- --- --- --- --- --- --- --- --- --- 0.07 --- --- 0.75 8.3
Thallium (Tl) 2.4 9.1 9.8 31 5.3 13.8 15.7 36.2 --- --- --- --- --- --- --- --- --- --- --- --- 0.05 --- --- 35.0 36.2
Vanadium (V) 7 70 88 500 39 101 112 288 39 102 112 288 45 --- 78 188 40 --- 68 98 18 --- --- 84.8 288
Zinc (Zn) 10 55 65 2,100 88 145 149 236 13 123 139 354 ND --- 30 66 21 --- 45 109 10.3 --- --- 247 354
Note: Maximum Reported Background Concentration in California does not include values from Western U.S. (USGS 1984), which are generally higher overall for each metal.Concentrations in units of milligrams per kilogram (mg/kg) --- = Not EvaluatedNA = Not applicable Background SourcesUSGS 1984: Element Concentrations in Soils and Other Surficial Materials of the Conterminous United States, U.S. Geological SurveyProfessional Paper 1270 by H.T. Shackette and J. G. Boerngen (Western U.S. Data)Kearney Foundation 1996: Background Concentrations of Trace and Major Elements in California Soils, Kearney Foundation of Soil Science, Division of Agriculture and Natural Resources, University of CaliforniaCal-EPA 1991: Background Levels of Trace Elements in Southern California Soils, Draft Annual Report, California Environmental Protection Agency, Contract No. 89-T0081 by University of California, Riverside, California, April 1991Bradford, G.R., R.J. Arkley, P.F. Pratt, and F.L. Blair. 1967. Total Content of Nine Mineral Elements in Fifty Selected BenchmarkSoils Profiles of California. Hilgardia 38:541-556.Cal-EPA 1992: Background Levels of Trace Elements in Southern California Soils, Draft Annual Report, California EnvironmentalProtection Agency, Contract No. 89-T0081 by University of California, Riverside, California, June 1992
Southern California (23 Agricultural and Urban Sites in the Eastern and Southern Los Angeles Area)
from Bradford et al., 1967 (50 Agricultural Soils Throughout California)
Background Concentration in
California
Source: USGS 1984Western U.S.
Source: Kearney Foundation 1996California (50 Agricultural Soils Throughout California)
Source: Cal-EPA 1992Source: Cal-EPA 1991 Source: Cal-EPA 1991 Source: Cal-EPA 1991
Maximum Reported
Southern California (69 Pristine Desert Soils and Sediments from the San Gorgonio Pass Area)
Southern California (69 Pristine Desert Soils and Sediments from the Maniobra Valley Area)
HALEY & ALDRICH, INC.G:\36385_Hinkley\008_Final FS Report\FS Addendum #1 Jan 2011\Table 4_Background metals.xlsx 1/26/2011
Community Blvd
Fair V
iew R
d
Moun
tain V
iew R
d
Summ
erset
Rd
Thompson Rd
Santa Fe Ave
Hwy 58
Desert View Dairy
PG&E Compressor Station
Approximate limit of saturated alluvium
Upper Aquifer
Bedrockexposed at
ground surface
\\ZINFANDEL\PROJ\PACIFICGASELECTRICCO\HINKLEYREMEDIATIONPROJECT\GIS\MXDS\MP_MONITORINGPROGRAM\2011\WATER_BOARD\MP_CRT_DISTRIBUTION_FEB_JUL_2010.MXD JLAMANTI 1/31/2011 16:52:26
FIGURE 1CHROMIUM PLUME OUTLINES, FEBRUARY AND JULY 2010SITE-WIDE GROUNDWATER MONITORING PROGRAMPACIFIC GAS & ELECTRIC CO. COMPRESSOR STATIONHINKLEY, CALIFORNIA
Approximate 50 µg/Loutline of Cr(T) and Cr(VI)concentrations in Upper Aquifer
Approximate 1000 µg/Loutline of Cr(VI)concentrations in Upper Aquifer
Approximate 3.1 µg/Lboundary of Cr(VI)concentrations in Upper Aquifer
±0 500 1,000 1,500 2,000 2,500
Feet
LEGENDPG&E Property
Note:Chromium contours are based on PG&E's sitewide groundwater monitoring conducted February 2010 and initial chromium results for new monitoring wells sampled in Summerset Road area, July 2010. Additional chromium results from PG&E's in-situ remediation groundwater sampling during February and March 2010 were also used for plume contouring.
Cr(VI) = Hexavalent ChromiumCr(T) = Total Dissolved ChromiumConcentrations in micrograms per liter (µg/L)
Attachment 1
Evaluation of Alternative 4A and Combined Alternatives
ATTACHMENT 1 TABLES Table ATT 1-1 Estimated Time and Costs to Reach Chromium Remediation Goals Table ATT 1-2 Supplemental Details for Cost Estimate ATTACHMENT 1 FIGURES Figure ATT 1-1 Alternative 4A - Aggressive In-situ Treatment and Beneficial Agricultural Use Figure ATT 1-2 Alternative 4A - Aggressive In-situ Treatment and Beneficial Agricultural Use,
Configuration as Analyzed Figure ATT 1-3 Remedial Alternative Summary – Active Remediation Components and
Durations Figure ATT 1-4 Combined Alternatives (Incorporating Elements of Alternatives 2, 3, and 5) Figure ATT 1-5 Combined Alternatives (Incorporating Elements of Alternatives 2, 3, and 5),
Configuration as Analyzed APPENDIX A - ARCADIS MODELING RESULTS
1. DESCRIPTION OF ALTERNATIVES In response to feedback from the Hinkley community and the Lahontan Regional Water Quality Control Board that none of the remedial timeframes for the alternatives provided in PG&E’s Feasibility Study were acceptable, two additional alternatives were created. The two alternatives combine proven technologies used at this or other sites for Cr(VI) treatment in groundwater, and incorporate years of experience gained in pilot testing and operation and maintenance at the Site. Further, the assembled scenarios are presented based on their anticipated ability to comply with the project regulatory requirements outlined in Section 2 of the FS (in particular the CAO and Resolution 92-49), and their ability to meet the remedial objectives detailed in Section 5 of the FS. Each of the new alternatives employs robust containment of the plume, and each provides substantial improvement to the remedial timeframe. The two alternatives are described below. Aggressive In-Situ Treatment and Beneficial Agricultural Use (Alternative 4A) Conceptual Approach This alternative is a more aggressive version of Alternative 4 presented in the FS, and includes expanding both the IRZ and AU remediation components to aggressively target the Cr(VI) source mass while concurrently providing even more robust containment of the plume. Figure ATT1-1 illustrates the general configuration of Alternative 4A. Groundwater modeling predicts that this alternative will reduce the overall cleanup timeframe to about 75 years. Aggressive In-Situ Treatment and Beneficial Agricultural Use is consistent with Alternative 4 presented in the FS, in that it will address the remedial objectives presented in Section 5 of the FS by facilitating plume containment and Site-wide treatment using a combination of technologies based on area-specific requirements, while providing productive use of the extracted groundwater through agricultural application and recharge. Alternative 4A includes aggressive expansion, both spatially and in duration, of treatment methods currently used at the Site in areas. Special attention was made to areas where the model results presented in the FS for Alternative 4 predicted prolonged effects of residual contamination. These treatment methods for Alternative 4A include agricultural application within and adjacent to the northern diffuse portion of the plume, and in-situ treatment via injection of carbon-amended groundwater to create IRZs across the entire the plume core. The agricultural application includes the continued use of the DVD LTU, the retrofit of the Gorman AU, and the construction and operation of three new AUs. As in Alternative 4, extracted groundwater would either be: Applied to AUs via drag drip irrigation; or
Amended with carbon and injected in the plume core to establish IRZs in a distant (far-field) type recirculation loop configuration; or
Amended with carbon and injected in a localized near-field IRZ configuration (e.g., the Source or Central Area IRZs).
Additionally, the Central Area IRZ will be expanded horizontally to bisect a wider section of the plume than in Alternative 4, extending to the 3.1/3.2 µg/L chromium contour as shown on Figure ATT 1-1. The Source Area IRZ will be expanded to the east, to treat the area with the highest residual chromium concentrations. Finally, IRZ operation will be extended from five to 20 years, which is approximately
14 years beyond the model-estimated timeframe needed to reach the milestone of cleaning up the entire plume to the current drinking water standard of 50 µg/L total chromium (6 years). Implementation Details Alternative 4A is similar to Alternative 4 in that it treats extracted groundwater using two methods: agricultural application and IRZ treatment. However, Alternative 4A includes groundwater extraction in the northern diffuse portion of the plume at a much higher rate (40 percent more) than what was presented in the FS for Alternatives 2, 3, 4 and 5. In total, about 1,400 gpm would be extracted from the toe of the plume for hydraulic control purposes. Of the total groundwater withdrawn at the toe of the plume, approximately 1,270 gpm would be piped to existing or new AUs for agricultural application via drag drip irrigation. Modeling indicates that maximum hydraulic control is achieved with AUs located just outside the toe of the plume; therefore, any new AUs would be preferentially located in these areas (where feasible), and within the proposed Project Area. Approximately 170 to 255 gpm of the groundwater extracted from the toe of the plume and on the southeastern edge of the core would be amended with an organic carbon substrate (e.g., ethanol) and injected in the plume core in the vicinity of the SCRIA and Source Area, to promote in-situ reduction of Cr(VI). Additional IRZ recirculation areas of extraction and injection wells would be used to create reactive zones within the Source Area and the Central Area, adjacent to the SCRIA injections. The IRZ application methods would be similar to those discussed in Alternative 4 of the FS, as the IRZ application would be focused in the plume core (i.e., plume area where chromium concentrations are above 50 ppb). However, the IRZs in Alternative 4A will be operated for much longer than the planned IRZs in Alternative 4. These IRZ recirculation areas would build off of existing infrastructure, and the Central Area IRZ infrastructure would be expanded over what was presented in the FS for Alternative 4 so that the entire plume out to the 3.1 µg/L Cr(VI) contour would be intercepted (providing an increase in width of the Central Area IRZ by 100 percent). The net flow from the recirculation systems would be approximately 0 gpm, as all extracted groundwater would be re-injected into the aquifer once it is amended with carbon. Through agricultural application, this alternative would increase farming land and agricultural production in the area without increasing the amount of regionally imported water.
As with the alternatives presented in the FS that include plume containment, additional hydraulic control of the plume would be derived from “freshwater” injections, on an as-needed supplemental basis. Clean water from an extraction well located outside of the plume would be pumped to the boundary of the plume and into injection wells. Implementation of Alternative 4A is likely to require the acquisition of additional properties and/or easements within the Project Area. These acquisitions could be both inside and outside of the Remedial Area, for installation and maintenance of remedy infrastructure. Groundwater use on acquired properties would be restricted to non-potable use (irrigation), for the duration of the remedy. Figure ATT 1-2 illustrates the approximate location of extraction wells, freshwater injection wells, and carbon-amended injection wells for the initial build-out configuration of Alternative 4A. Over time, optimization of the initial system configuration would include shutting down or converting extraction wells to injection points for certain IRZ recirculation zones in the Source Area, Central Area, and/or plume core as the areas responds to treatment.
Based on feedback on the FS, the fate and transport modeling and cost estimates were also updated for a longer IRZ operational period than what was presented in the FS for Alternative 4 (from 5 years to 20 years), to more aggressively address elevated Cr(VI) concentrations in the source area and the area immediately downgradient. Under Alternative 4A, the IRZs will be operated for approximately 20 years, and then major IRZ operations will be discontinued. For the period after 20 years, an intermittent (e.g., 4 months per year) and lower dose application of carbon amended water will be fed to select SCRIA/Source Area injection wells, if needed. This supplemental injection after 20 years is intended to promote additional flushing and treatment. Estimated Time Frame and Cost to Reach Background Concentrations
Computer modeling of this alternative predicts that chromium concentrations within the plume core will be remediated first, while lower concentrations toward the periphery and distal plume toe will be remediated over a longer period of time, based on the location of extraction wells within the core and toe of the plume. Alternative 4A is projected to achieve the 50 µg/L chromium MCL for drinking water in approximately 6 years (similar to Alternative 4), the 80 percent mass removal milestone in approximately 10 years, and the background chromium concentration in approximately 75 years (a reduction of 75 years compared to Alternative 4). Figure ATT 1-3 illustrates these cleanup timeframes alongside those for other alternatives, as a means of comparison. The estimated cost of Alternative 4A is approximately $78.7M NPV. Computer modeling also predicts that Alternative 4A would achieve the FS 80 percent mass removal interim goal in approximately 10 years. Limitations The creation of reactive zones to treat groundwater would reduce Cr(VI) to Cr(III), but operational data to date suggest that it will be difficult to establish uniform treatment results throughout the treatment area due to aquifer heterogeneity, the presence of low permeability zones, and the difficulty of evenly distributing carbon. In addition, deleterious byproducts such as reduced iron, manganese, and/or arsenic would likely be generated, and would require additional monitoring and management. While plume containment is a fundamental component of this alternative, past containment efforts have been complicated by the complex hydrogeology, the plume size, and agricultural pumping in the area. Alternative 4A includes property purchases and/or easements for additional AUs, as the total flow extracted under hydraulic containment exceeds the maximum annual average discharge rate for the existing DVD LTU (520 gpm). In addition, property purchase and/or easements will be needed to expand the Central Area IRZ. Acquisition of properties and/or easements potentially needed for implementation may be difficult or take considerable time. Combined Alternative (Incorporating elements of Feasibility Study Alternative 2, 3, and 5) Conceptual Approach At the request of the LRWQCB, a combination of the three core remedy types (AUs, IRZs, and Ex-situ Treatment, similar to but slightly modified from Alternatives 2, 3, and 5, respectively) was evaluated. As shown on Figure ATT 1-4, this Combined Alternative includes: Groundwater Extraction and ex-situ chemical treatment in the source area, where Cr(VI)
concentrations exceed 1,000 µg/L;
Mass reduction via IRZ in between the source area and plume toe, where Cr(VI) concentrations exceed 50 µg/L;
Hydraulic containment at the plume toe via groundwater extraction and AU application; and
Freshwater injection along the northwest edge of the plume, and other margins of the plume if necessary to provide boundary control.
This combination of technologies would address the remedial objectives provided in Section 5 of the FS:
Plume containment;
Productive use of the extracted groundwater through agricultural application and recharge; and
Removal of the highest concentrations of chromium from the aquifer. Implementation Details This scenario involves a combination of the three core remedy types (AUs, IRZs, and Ex-situ Treatment), and is conceptually structured as follows: Control and Treatment of the diffuse plume (generally, north of highway 58) via
groundwater extraction and agricultural treatment. To enhance plume capture, an estimated average annual pumping rate of 1,380 gpm was included in this alternative (after year 10, this flow is increased 60 gpm to accelerate cleanup in the area). Of this total withdrawal, 1,270 gpm is directed to AUs for treatment, with the balance of 110 gpm (170 gpm after year 10) pumped to the SCRIA for carbon amendment and injection. Given the plume dimensions, it is anticipated that, of the three active remedial components included in this alternative, the AUs will operate until the 3 background chromium goal is achieved.
Treatment of moderately high (<1000 µg/L) chromium concentrations via groundwater
extraction and in situ treatment – the Alternative 3 IRZ injections on the eastern edge of the plume running along Summerset Road (near Highway 58 and separate well group east of SCRIA) were replaced by an expanded IRZ configuration in the SCRIA vicinity, and an expanded Central Area IRZ (similar to Alternative 4A).The bulk of the IRZ remedial components including the expanded Central Area IRZ, would be operated for a period of 40 years. For two years after the Source Area pump & treat is discontinued (in year 40 as discussed below), wells in the Source Area/SCRIA vicinity would be injected with carbon-amended water, to facilitate further treatment in residual affected areas. After year 42, an intermittent (e.g., 4 months per year) and lower dose application of carbon amended water would be fed to select SCRIA/Source Area injection wells. This supplemental injection after year 42 is intended to provide additional flushing and treatment, while providing a means of managing excess water extracted from the plume toe area during the non-growing winter.
Treatment of the highest chromium concentrations (>1000 µg/L via groundwater extraction and ex situ chemical treatment – An estimated 200 gpm of withdrawal is needed to provide treatment in the area where chromium concentrations exceed 1,000 µg/L. Extracted groundwater would be conveyed to a new water treatment plant (consistent with Alternative 5 in the FS, chemical precipitation was the assumed treatment method). Treated water would be pumped and re-injected into the aquifer upgradient of the source area to flush residual Cr(VI). Modeling of this new alternative estimates that the source area ex-situ water treatment plant
would be operated for a period of 40 years. After 40 years, the Source Area extraction wells are converted into injection well and operated as IRZ wells for 2 years.
Figure ATT 1-5 shows a general layout configuration for this combined alternative.
As with the alternatives presented in the FS that include plume containment, additional hydraulic control northwest of the plume would come from freshwater injections. Clean water from an extraction well located upgradient of the Site would be pumped to the boundary of the plume into injection wells on an as-needed supplemental basis. Implementation of this option is likely to require the acquisition of additional properties and/or easements within the Project Area. These acquisitions could be both inside and outside the Remedial Area and would be for installation and maintenance of remedial infrastructure. Groundwater use on acquired properties would be restricted to non-potable (irrigation) use for the duration of the remedy. Over time, optimization of the initial system would include modifications to the location and number of extraction or injection wells (to target recalcitrant areas of the plume core or periphery), shutting down the ex-situ treatment system in the Source Area, and/or shutting down the one or more of the IRZs. Fate and transport modeling and cost estimates assumed both the ex-situ treatment and major IRZ operations are discontinued after approximately 40 years of operation. As noted above, an intermittent and lower dosage IRZ application may continue after year 40 in select Source Area/SCRIA wells, if needed to further reduce chromium concentrations. Estimated Time Frame and Cost to Reach Background Computer modeling of the Combined Alternative suggests that chromium within the Source Area vicinity near the pump and treat extraction wells is generally remediated on a similar timetable as lower concentrations toward the distal plume area. For example, the area surrounding the extraction wells for the portion of the plume being remediated via pump and treat is slower to clean up (100 years for Combined Alternative vs 30 years for Alternative 4A). This difference in treatment time for higher concentration areas is understandable, as the primary treatment mechanism for pump and treat (flushing) is expected to be slower than the primary treatment mechanism of in-situ treatment (direct reduction). This behavior is reflected in the timeframes to achieve the various criteria discussed below.
This Combined Alternative is predicted to achieve the 80 percent chromium mass removal milestone in 18 years, 50 µg/L chromium concentration (the drinking water MCL) remedial milestone in approximately 28 years, the background level in approximately 90 years. Cleanup to background is estimated to cost approximately $151M NPV. Limitations The limitations associated with the various elements that will be used in the combined alternative include: Alternative 2 Elements - As indicated above under Alternative 4A, utilizing a maximum
annual average discharge rate greater than what has been approved by the LRWQCB for the existing DVD AU (520 gpm) involves either property purchase or easements for additional AUs. In addition, property purchase and/or easements will be needed to expand the Central Area IRZ as described above. Acquisition of properties and/or easements potentially needed for implementation may be difficult, or take considerable time.
Alternative 3 Elements - The creation of IRZs to treat the impacted groundwater is subject to the same spatial treatment distribution limitations discussed in Alternative 4A. These arise from the complex hydrogeology present at the Site, plume size, and variable agricultural pumping, as discussed in detail in Section 4 and Appendix B of the FS. In addition, deleterious byproducts such as reduced iron, manganese, and/or arsenic would likely be generated, which would require additional monitoring and management. While plume containment is a fundamental component of this alternative, past containment efforts have been complicated by the complex hydrogeology, plume size, and agricultural pumping in the area.
Alternative 5 Elements - While this alternative extracts groundwater from the entire plume, treatment facilities require significant infrastructure and frequent operation and maintenance visits. Further, achieving treatment plant water quality discharge criteria below the very low background concentrations at the Site would not likely be reliable. Compared to other water treatment methods such as agricultural application, costs will be significantly higher. In addition, as the combined alternative involves withdrawal and ex-situ treatment in the vicinity of IRZs, the presence of reducing conditions will likely cause plant “upsets” from unpredictable and variable water quality conditions. Therefore, the ex-situ treatment portion of the combined alternative is predicted to exhibit substantially more operational reliability concerns than the other technologies. It is possible that ex-situ treatment is not feasible in this environment.
2. COMPARATIVE ANALYSIS OF ALTERNATIVES The goal of the comparative analysis is to evaluate the two supplemental alternatives relative to the requirements established in Resolution No. 92-49, Part III.C, and the derived Site-specific remedial objectives defined in Section 5 of the FS, consistent with the five FS alternatives. A selected alternative is required to satisfy the following key criteria: effectiveness, feasibility (implementability), and cost. The ROs defined in Section 5 of the FS are all included within the effectiveness criterion. This section discusses how each alternative performs relative to these three key evaluation criteria. Table ATT-1 provides a summary comparison of the two alternatives. Aggressive In-Situ Treatment and Beneficial Agricultural Use (Alternative 4A) Aggressive In-Situ Treatment and Beneficial Agricultural Use (Alternative 4A) applies the same combination of technologies as in Alternative 4 of the FS, but in a more aggressive approach with additional infrastructure and longer in situ treatment operation. These modifications will enable the alternative to reach remedial objectives in a much shorter timeframe than the alternatives presented in the FS. The technologies contain and treat the plume to reduce its mass, while incorporating productive use of extracted groundwater to facilitate agriculture in the Site vicinity. The following is a discussion of how Alternative 4A performs relative to the four measures of effectiveness. Cleanup to Background Conditions for Chromium: Alternative 4A targets the treatment of
Cr(VI) concentrations that are greater than the 50 µg/L MCL for drinking water (within the plume core) via in-situ reduction, intercepts and treats a wider section of the plume out to the background concentration at the Central Area IRZ, and uses AU treatment to treat diffuse plume (<50 µg/L chromium) water generated as part of hydraulic containment of the plume. Specifically, this alternative incorporates the Central Area IRZ, Source Area IRZ, and SCRIA IRZ (expanded from their current configurations). Fate and transport modeling predicts that background chromium conditions would be achieved in about 75 years. However, because of the plume size and aquifer complexity, there is the potential that portions of the aquifer would be recalcitrant to IRZ treatment, which would result in areas that would not achieve background
chromium conditions as currently defined. As a result, Alternative 4A exhibits a moderate likelihood of achieving this criterion. The cleanup time frame to achieve background conditions is substantially improved when one considers that the 80 percent Cr(VI) mass removal interim goal is predicted to be achieved in 10 years (approximately 3 years less than Alternative 4 of the FS), and the duration of IRZ treatment is extended to target more residual contamination. The significant time difference between achieving 80 percent Cr(VI) mass removal and background highlights the difficulty of removing the final 20 percent of the Cr(VI) mass and achieving background chromium concentrations.
Restore Beneficial Use: Alternative 4A combines AUs and IRZs to contain the plume, reduce
Cr(VI) concentrations/mass, and reduce the Cr(VI) footprint. Specifically, Alternative 4A focuses on Cr(VI) mass reduction by aggressive IRZ treatment in the plume core to achieve the chromium MCL remedial objective, and restore beneficial use as quickly as possible. Use of IRZ treatment within the plume core will result in the localized formation of dissolved iron, manganese, and/or arsenic. Byproduct concentrations may exceed drinking water standards. While these byproducts are not expected to persist in the aquifer, they will reduce the beneficial use of groundwater while they are present at concentrations that exceed drinking water standards.
Chromium Plume Containment: The groundwater extraction configuration of Alternative 4A
was developed to exhibit a greater level of hydraulic containment capacity than the alternatives presented in the FS. Alternative 4A extracts approximately 40 percent more water at the toe of the plume compared to Alternative 4 and other FS alternatives. All of the groundwater extracted from the toe of the plume will be applied to AUs for Cr(VI) treatment. Additional withdrawal of water will occur in the plume core area; this water will be amended with carbon and injected inside the plume to reduce plume mass and footprint, targeting areas of higher Cr(VI) concentration. Similar to the alternatives presented in the FS, Alternative 4A includes the limited injection of clean groundwater into the northwest side of the plume, to enhance plume boundary control in that direction. In addition, three extraction wells would be located east of the SCRIA to improve plume capture and reduce cleanup duration. To evaluate the effectiveness of this alternative on plume containment, a groundwater fate and transport model was used to evaluate the plume containment characteristics. Modeling results indicate that Alternative 4A establishes robust hydraulic control over the plume boundaries, and is anticipated to effectively contain the plume.
Productive Use of Groundwater Resource: Aggressive core treatment, combined with plume
containment and agricultural application results in the highest productive use of groundwater for the alternatives considered in the FS. Through this treatment approach, Site groundwater would be used at its highest and best current productive use, agricultural application and fodder crop production. The agricultural application is also beneficial to water supply in the basin because it uses an already marginal or unusable resource (groundwater impacted by nitrate/TDS) for crop production, replacing the need for local farmers to import water for the same fodder crop.
Combined Alternative (Incorporating elements of Feasibility Study Alternatives 2, 3, and 5) The combined alternative applies a combination of technologies to contain and treat the plume and reduce its mass, while incorporating productive use of extracted groundwater to facilitate agriculture in the Site vicinity. This alternative applies technologies to areas where they would likely be the most
productive and achieve remedial objectives in the shortest amount of time. The following is a discussion of how the combined alternative performs relative to the four measures of effectiveness.
Cleanup to Background Conditions for Chromium: The combined alternative targets the
treatment of Cr(VI) concentrations that are greater than 1,000 µg/L via ex-situ treatment, treatment of Cr(VI) concentrations that are greater than 50 µg/L via in-situ reduction, and treatment of lower concentrations of Cr(VI) via agricultural application. Specifically, this alternative incorporates the Central Area IRZ and SCRIA IRZ (expanded from their current configurations) and ex-situ treatment targeted in the Source Area. Fate and transport modeling suggests that plume-wide background chromium conditions would be achieved in about 90 years (15 years more than Alternative 4A). However, because of the plume size and aquifer complexity, there is the potential that portions of the aquifer would be recalcitrant to IRZ treatment and/or ex-situ treatment and result in areas that would not achieve background chromium conditions as currently defined. As a result, the combined alternative exhibits a moderate likelihood of achieving this criterion. The cleanup time frame to achieve background conditions is placed in perspective when one considers that the 80 percent Cr(VI) mass removal interim goal is predicted to be achieved in 18 years.
Restore Beneficial Use: Use of IRZ treatment in portions of the plume core will result in the localized formation of iron, manganese, and/or arsenic. Byproduct concentrations may exceed drinking water standards. While these byproducts are not expected to persist in the aquifer, they will reduce the beneficial use of groundwater while they are present at concentrations that exceed drinking water standards. The combined alternatives scenario will attempt to minimize the production of secondary byproducts and restrict their generation to areas near the plume core (away from nearby domestic users) via the Central Area IRZ and SCRIA IRZ (expanded from their current configuration). It should be noted that prior operation of the Source Area IRZ in the vicinity of the proposed withdrawal area for the ex-situ treatment system has already generated highly-reduced conditions in groundwater, which is likely to result in unpredictable water quality entering the treatment plant. This condition will make groundwater treatment to background chromium levels difficult, and may lead to unpredictable treatment plant “upsets.” Fate and transport model simulations predict that this alternative would restore the aquifer to the chromium drinking water MCL in approximately 28 years.
Chromium Plume Containment: The groundwater extraction configuration of the combined alternative was developed to exhibit a greater level of containment than the alternatives presented in the FS. For example, this alternative extracts approximately 40 percent more water at the toe of the plume compared to Alternative 4 and other FS alternatives. The majority of groundwater extracted from the toe of the plume will be applied to AUs for Cr(VI) treatment, while the remainder will be amended with carbon, and injected inside the plume to reduce plume mass and footprint, targeting areas of higher Cr(VI) concentration downgradient of the source area and outside of the 1,000 µg/L Cr(VI) limits. Extraction and ex situ chemical treatment will be applied to the source area to target the highest concentration zones. This alternative also includes the limited injection of clean groundwater into the northwest side of the plume to further improve containment in that direction. In addition, three extraction wells would be located east of the SCRIA, to improve plume capture and reduce cleanup duration. Modeling results indicate that this alternative will establish robust hydraulic control over the plume boundaries, and is anticipated to effectively contain the plume.
Productive Use of Groundwater Resource: Core treatment with in-situ and ex-situ methods, combined with a plume containment strategy involving agricultural application, results in
productive use of groundwater. Through this treatment approach, Site groundwater would be used at its highest and best current productive use, agricultural application and fodder crop production. The agricultural application is also beneficial to water supply in the basin, because it uses an already marginal or unusable resource (groundwater containing nitrate/TDS) for crop production, replacing the need for local farmers to import water for the same fodder crop. The use of IRZ treatment will likely result in the localized formation of dissolved iron, manganese, and/or arsenic. Since these in situ byproducts are not expected to persist in the aquifer and plume core groundwater is not proposed to be used in AUs, their presence is not expected to reduce the productive use of groundwater in this alternative. The ex situ treatment component would only manage about 200 gpm of highly-impacted groundwater, thus its impact on productive use of the groundwater resource is primarily related to returning the treated water into the aquifer to maintain water levels.
Implementability Implementability is defined by how readily constructed and technically feasible the alternative is, considering Site-specific factors that may affect constructability, the technical complexity of the alternative, administrative feasibility (e.g., availability of property, permitting), availability of services and materials to implement the alternative, and other relevant implementability considerations.
A. Aggressive In-Situ Treatment and Beneficial Agricultural Use (Alternative 4A)
The Aggressive In-Situ Treatment and Beneficial Agricultural Use Alternative is moderately easy to implement. It consists of the aggressive use of technologies that are already being used at the Site, and expands them into areas near existing treatment areas (DVD LTU, Gorman AUs, Central Area IRZ, Source Area IRZ, and SCRIA IRZ). Specifically, Alternative 4A combines major elements from Alternative 4 presented in the FS with a larger version of the Central Area IRZ program for plume core treatment, and the overall extension of the Central Area, SCRIA, and Source Area IRZ program operation durations. Like Alternative 4, Alternative 4A capitalizes on a large portion of the existing infrastructure at the Site, with moderate expansion of certain remediation components by adding wells to improve carbon distribution. Similar to other alternatives, potential challenges to implementing this alternative relate to access to non-PG&E owned property needed for extraction, injection, or water conveyance systems. Similar to Alternative 4, Alternative 4A is anticipated to consist of a modification to the General Permit. A modification/simplification of the agricultural treatment permit process, and a modification of the monitoring program consistent with the other agricultural application processes, is critical to implementation of this approach. Overall, this alternative is moderately easy to implement.
B. Combined Alternative (Incorporating elements of Feasibility Study Alternatives 2, 3,
and 5)
The Combined Alternative (incorporating elements of Feasibility Study Alternatives 2, 3, and 5) is moderately difficult to implement. The alternative involves the implementation of three different methods of managing extracted water (AU application, dosing and reinjection as part of an IRZ, and reinjection of treated water following ex-situ treatment) which all have different operating conditions and procedures.
Though the alternative involves piping highly impacted groundwater to an ex-situ treatment plant, and distributing treated water to an injection well network similar to Alternative 5 presented in the FS, the ex-situ portion of this alternative targets the source area, and does not cover the same area (entire Site) as Alternative 5. The alternative does, however, include a 200 gpm ex-situ treatment plant comprising a treatment train with multiple process units. The operations for the ex-situ treatment system require a far more intensive and complicated operation and maintenance program to maintain system performance and operation (e.g., system adjustments, material delivery coordination, equipment maintenance, well rehabilitation, and waste management) compared to the other alternatives. Similar to other alternatives, potential challenges to implementing this alternative relate to access to non-PG&E owned property needed for extraction, injection, or conveyance systems. Permitting of this alternative would likely be accomplished through an amended version of the existing General Permit, which included provisions for the treatment of water via WDR groundwater reinjection and monitoring. EIR considerations may also complicate the permitting and construction of the groundwater treatment facility, because of potentially unmitigatible impacts. Overall, this alternative is moderately difficult to implement.
C. Cost
The development of representative costs for each alternative utilized the United States Environmental Protection Agency guidance for preparing feasibility studies (USEPA 2000). Costing methods presented herein are consistent with the FS and its supplemental data submittal dated 14 October, 2010 (Haley & Aldrich, 2010a and b). Two life-cycle costs are provided for each alternative, one that is “discounted” to account for inflation (“net present value or NPV”) and one that is “non-discounted.” The non-discounted cost is provided following the recommendation of USEPA for projects that extend beyond 30 years. This is to avoid misrepresentation of the actual long-term cash outlays and financial requirements to complete the work. Quantities and unit costs were selected based on contractor experience at the Hinkley Site and at other sites with similar impacts and subsurface conditions. Primary assumptions or considerations that were taken into account in the preparation of the alternative costs include: Costs were based on 2010 values;
For the NPV costing scenario, future capital and O&M costs were adjusted using a discount value of 3.17 percent, which accounts for inflation;
The non-discounted costing scenario assumes all costs are in “today’s dollars”.
A 20 percent contingency was used on capital costs and a contingency of 10 percent was used on O&M costs, based on engineering judgment; and
Remedy durations to meet the key remedial objectives for each alternative were estimated through the use of fate and transport modeling simulations.
Based on these assumptions, the presented costs have an approximate expected accuracy range of -30 percent to +50 percent. Table ATT-1 summarizes the estimated time frame to reach the 50 µg/L chromium MCL, 80 percent mass removal, and background, as well as the NPV cost
estimate to reach background for each of the five alternatives. The resultant estimated life cycle costs for each of these two scenarios to achieve background are:
Alternative 4A: $142M/$78.7M NPV The Combined Alternative: $295M/$151M NPV
Preferred Alternative Considering time to reach interim treatment milestones, comparative ease of implementation and cost, Alternative 4A is the preferred alternative. This alternative applies effective technologies to areas where they would to be the most productive, while producing the least amount of negative impacts. References 1. Haley & Aldrich, Inc. 2010a. Feasibility Study, Pacific Gas and Electric Company, Hinkley
Compressor Station, Hinkley, California. 30 August.
2. Haley & Aldrich, Inc. 2010b. Hinkley Feasibility Study Supplemental Data Submittal. 14 October.
G:\36385_Hinkley\008_Final FS Report\FS Addendum #1 Jan 2011\Attachment 1\2011_0131_Attachment 1_Eval of new alts_F.docx
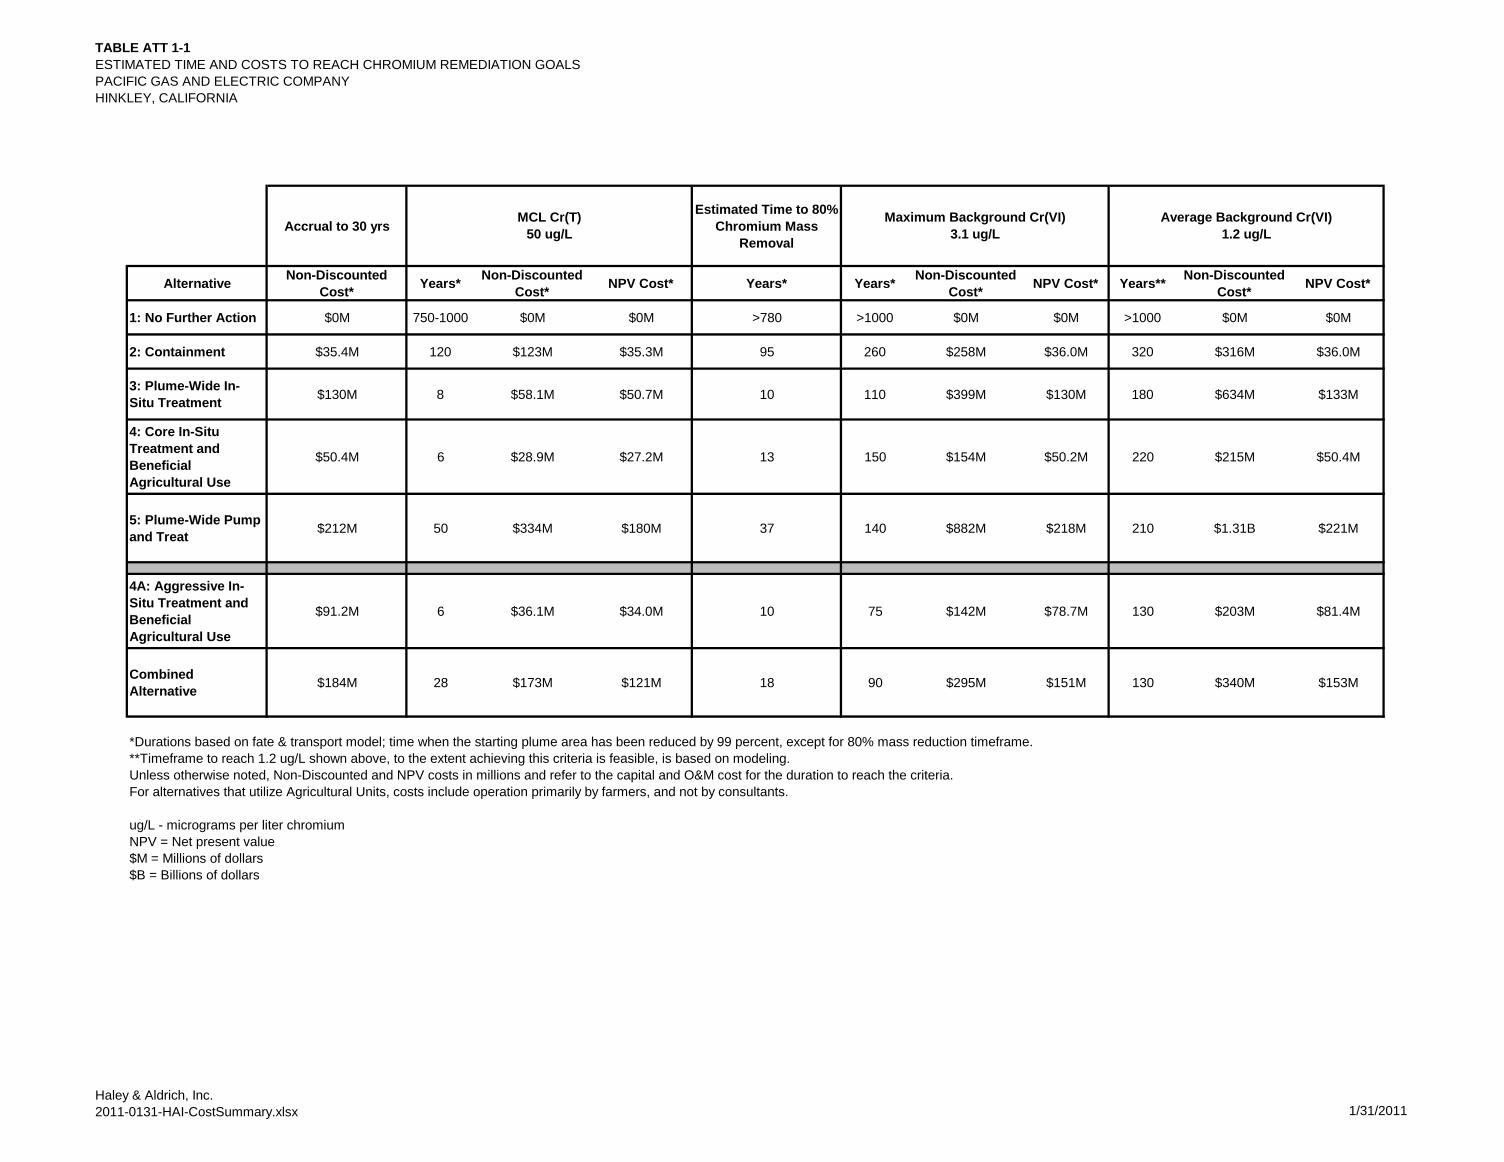
TABLE ATT 1-1ESTIMATED TIME AND COSTS TO REACH CHROMIUM REMEDIATION GOALSPACIFIC GAS AND ELECTRIC COMPANYHINKLEY, CALIFORNIA
Haley & Aldrich, Inc.2011-0131-HAI-CostSummary.xlsx 1/31/2011
Accrual to 30 yrsEstimated Time to 80%
Chromium Mass Removal
Alternative Non-Discounted Cost* Years* Non-Discounted
Cost* NPV Cost* Years* Years* Non-Discounted Cost* NPV Cost* Years** Non-Discounted
Cost* NPV Cost*
1: No Further Action $0M 750-1000 $0M $0M >780 >1000 $0M $0M >1000 $0M $0M
2: Containment $35.4M 120 $123M $35.3M 95 260 $258M $36.0M 320 $316M $36.0M
3: Plume-Wide In-Situ Treatment $130M 8 $58.1M $50.7M 10 110 $399M $130M 180 $634M $133M
4: Core In-Situ Treatment and Beneficial Agricultural Use
$50.4M 6 $28.9M $27.2M 13 150 $154M $50.2M 220 $215M $50.4M
5: Plume-Wide Pump and Treat $212M 50 $334M $180M 37 140 $882M $218M 210 $1.31B $221M
4A: Aggressive In-Situ Treatment and Beneficial Agricultural Use
$91.2M 6 $36.1M $34.0M 10 75 $142M $78.7M 130 $203M $81.4M
Combined Alternative $184M 28 $173M $121M 18 90 $295M $151M 130 $340M $153M
*Durations based on fate & transport model; time when the starting plume area has been reduced by 99 percent, except for 80% mass reduction timeframe.**Timeframe to reach 1.2 ug/L shown above, to the extent achieving this criteria is feasible, is based on modeling.Unless otherwise noted, Non-Discounted and NPV costs in millions and refer to the capital and O&M cost for the duration to reach the criteria.For alternatives that utilize Agricultural Units, costs include operation primarily by farmers, and not by consultants.
ug/L - micrograms per liter chromiumNPV = Net present value$M = Millions of dollars$B = Billions of dollars
MCL Cr(T)50 ug/L
Maximum Background Cr(VI)3.1 ug/L
Average Background Cr(VI)1.2 ug/L
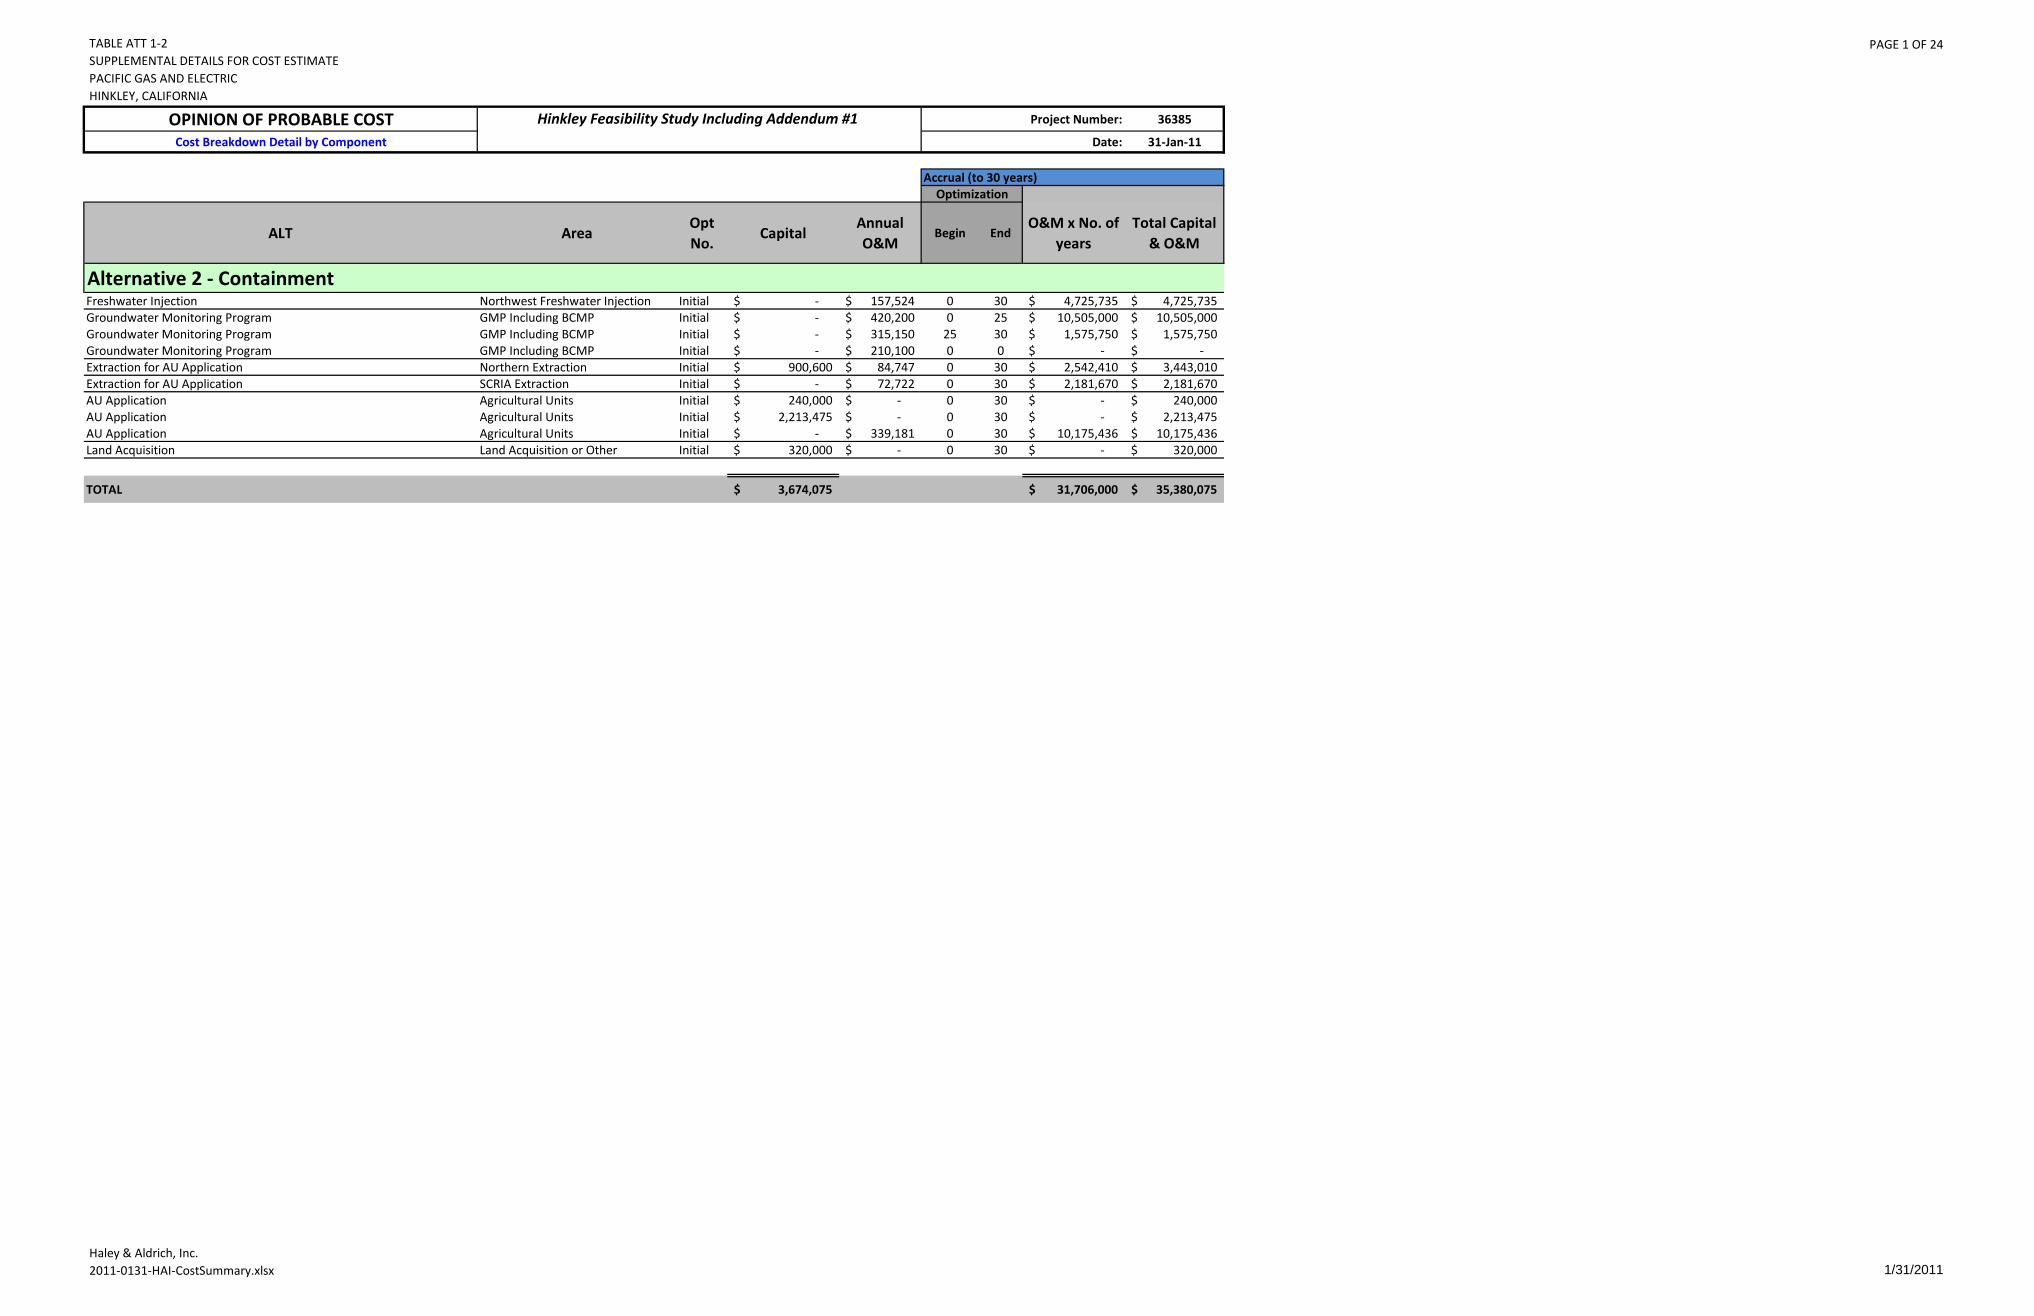
TABLE ATT 1-2SUPPLEMENTAL DETAILS FOR COST ESTIMATEPACIFIC GAS AND ELECTRICHINKLEY, CALIFORNIA
PAGE 1 OF 24
Haley & Aldrich, Inc.2011-0131-HAI-CostSummary.xlsx 1/31/2011
OPINION OF PROBABLE COST Project Number: 36385
Cost Breakdown Detail by Component Date: 31-Jan-11
Accrual (to 30 years)Optimization
ALT AreaOpt No.
CapitalAnnual O&M
Begin EndO&M x No. of
yearsTotal Capital
& O&M
Alternative 2 - ContainmentFreshwater Injection Northwest Freshwater Injection Initial -$ 157,524$ 0 30 4,725,735$ 4,725,735$ Groundwater Monitoring Program GMP Including BCMP Initial -$ 420,200$ 0 25 10,505,000$ 10,505,000$ Groundwater Monitoring Program GMP Including BCMP Initial -$ 315,150$ 25 30 1,575,750$ 1,575,750$ Groundwater Monitoring Program GMP Including BCMP Initial -$ 210,100$ 0 0 -$ -$ Extraction for AU Application Northern Extraction Initial 900,600$ 84,747$ 0 30 2,542,410$ 3,443,010$ Extraction for AU Application SCRIA Extraction Initial -$ 72,722$ 0 30 2,181,670$ 2,181,670$ AU Application Agricultural Units Initial 240,000$ -$ 0 30 -$ 240,000$ AU Application Agricultural Units Initial 2,213,475$ -$ 0 30 -$ 2,213,475$ AU Application Agricultural Units Initial -$ 339,181$ 0 30 10,175,436$ 10,175,436$ Land Acquisition Land Acquisition or Other Initial 320,000$ -$ 0 30 -$ 320,000$
TOTAL 3,674,075$ 31,706,000$ 35,380,075$
Hinkley Feasibility Study Including Addendum #1
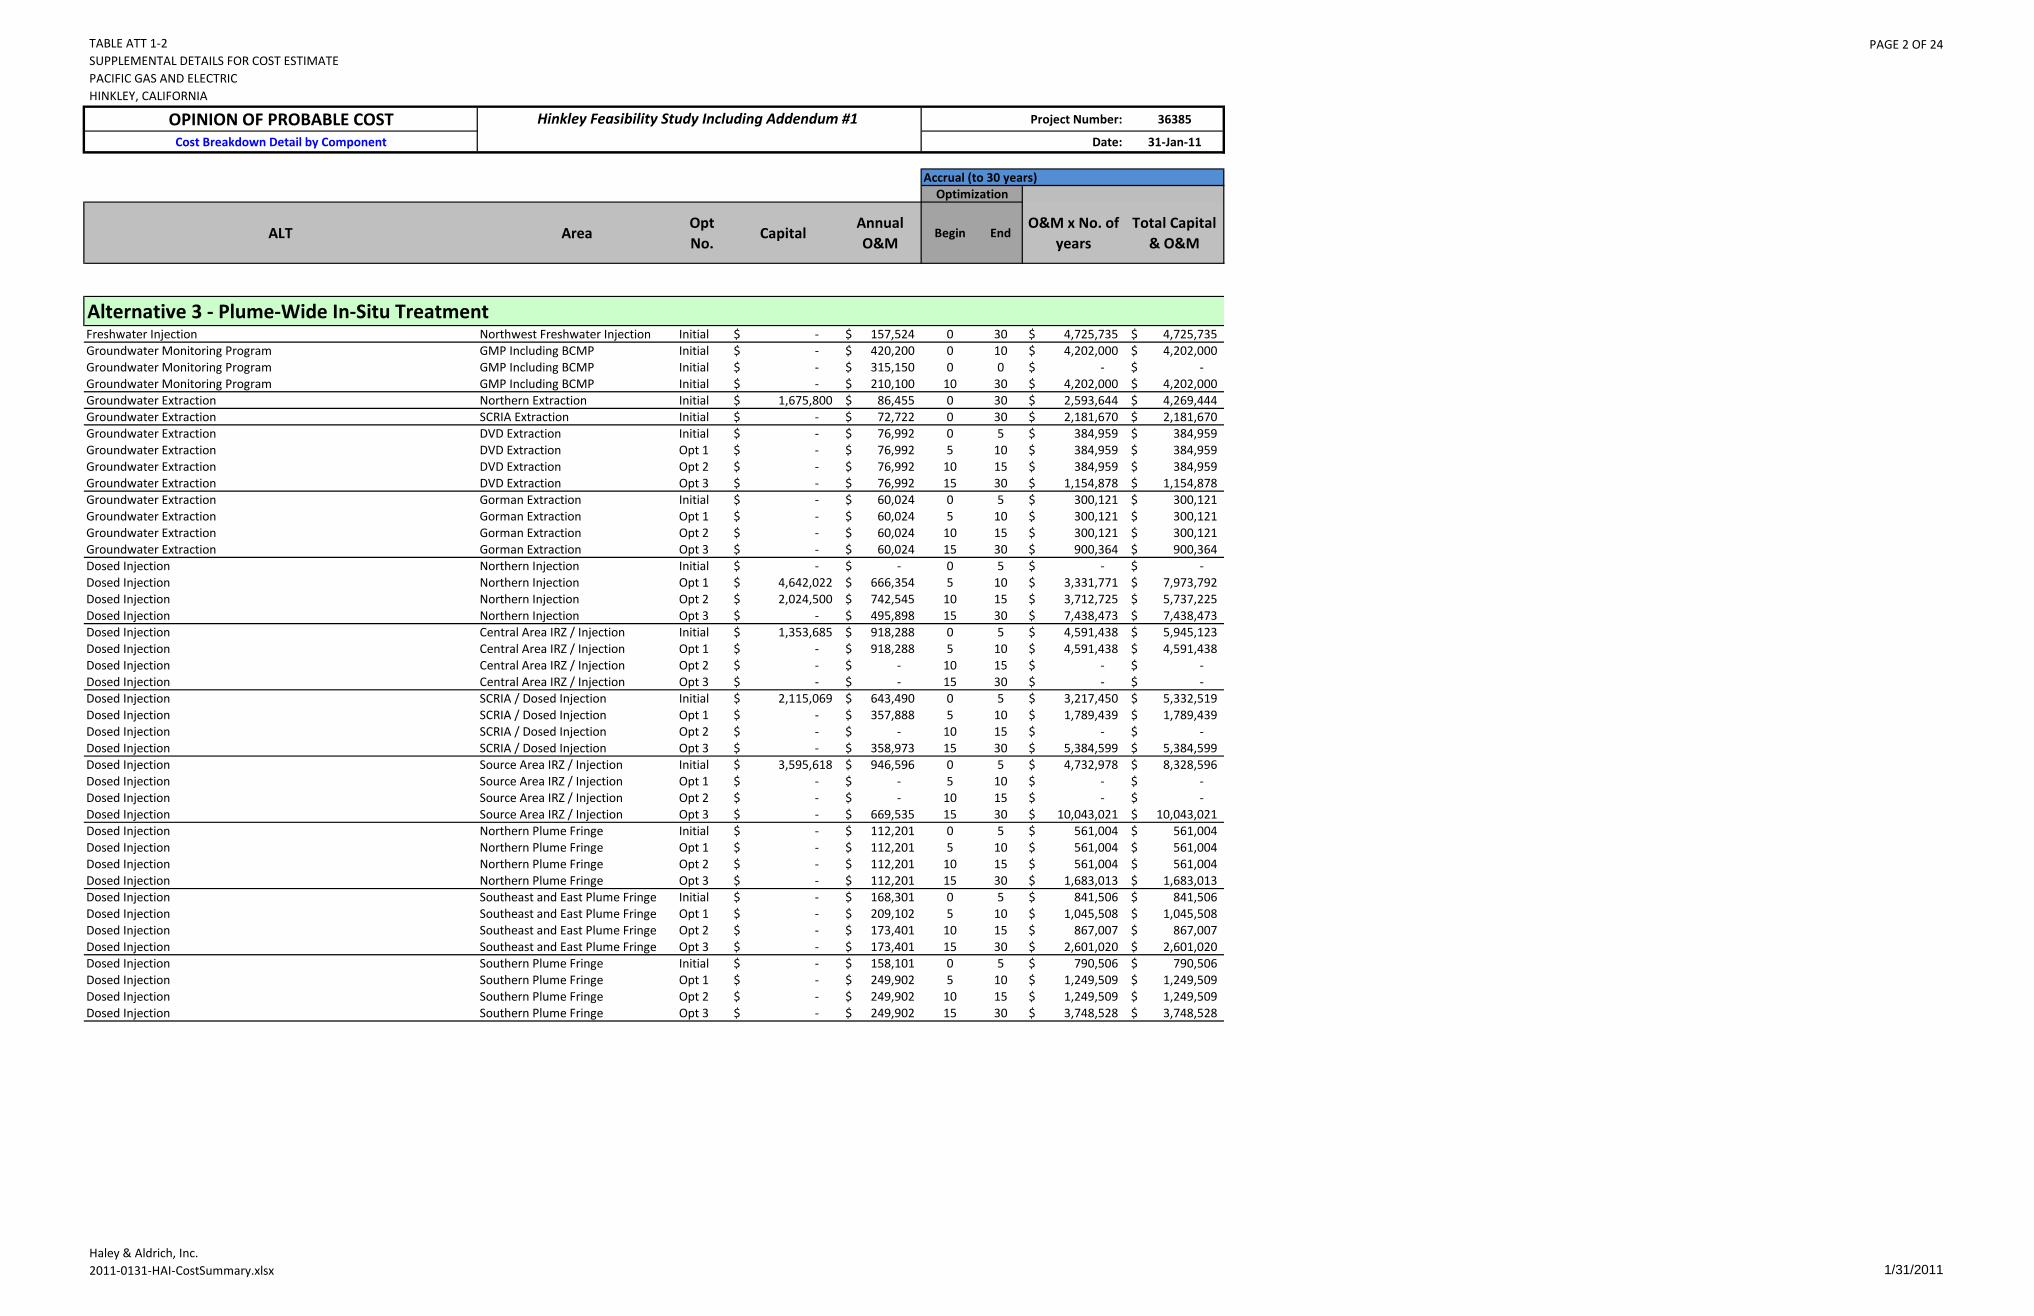
TABLE ATT 1-2SUPPLEMENTAL DETAILS FOR COST ESTIMATEPACIFIC GAS AND ELECTRICHINKLEY, CALIFORNIA
PAGE 2 OF 24
Haley & Aldrich, Inc.2011-0131-HAI-CostSummary.xlsx 1/31/2011
OPINION OF PROBABLE COST Project Number: 36385
Cost Breakdown Detail by Component Date: 31-Jan-11
Accrual (to 30 years)Optimization
ALT AreaOpt No.
CapitalAnnual O&M
Begin EndO&M x No. of
yearsTotal Capital
& O&M
Hinkley Feasibility Study Including Addendum #1
Alternative 3 - Plume-Wide In-Situ TreatmentFreshwater Injection Northwest Freshwater Injection Initial -$ 157,524$ 0 30 4,725,735$ 4,725,735$ Groundwater Monitoring Program GMP Including BCMP Initial -$ 420,200$ 0 10 4,202,000$ 4,202,000$ Groundwater Monitoring Program GMP Including BCMP Initial -$ 315,150$ 0 0 -$ -$ Groundwater Monitoring Program GMP Including BCMP Initial -$ 210,100$ 10 30 4,202,000$ 4,202,000$ Groundwater Extraction Northern Extraction Initial 1,675,800$ 86,455$ 0 30 2,593,644$ 4,269,444$ Groundwater Extraction SCRIA Extraction Initial -$ 72,722$ 0 30 2,181,670$ 2,181,670$ Groundwater Extraction DVD Extraction Initial -$ 76,992$ 0 5 384,959$ 384,959$ Groundwater Extraction DVD Extraction Opt 1 -$ 76,992$ 5 10 384,959$ 384,959$ Groundwater Extraction DVD Extraction Opt 2 -$ 76,992$ 10 15 384,959$ 384,959$ Groundwater Extraction DVD Extraction Opt 3 -$ 76,992$ 15 30 1,154,878$ 1,154,878$ Groundwater Extraction Gorman Extraction Initial -$ 60,024$ 0 5 300,121$ 300,121$ Groundwater Extraction Gorman Extraction Opt 1 -$ 60,024$ 5 10 300,121$ 300,121$ Groundwater Extraction Gorman Extraction Opt 2 -$ 60,024$ 10 15 300,121$ 300,121$ Groundwater Extraction Gorman Extraction Opt 3 -$ 60,024$ 15 30 900,364$ 900,364$ Dosed Injection Northern Injection Initial -$ -$ 0 5 -$ -$ Dosed Injection Northern Injection Opt 1 4,642,022$ 666,354$ 5 10 3,331,771$ 7,973,792$ Dosed Injection Northern Injection Opt 2 2,024,500$ 742,545$ 10 15 3,712,725$ 5,737,225$ Dosed Injection Northern Injection Opt 3 -$ 495,898$ 15 30 7,438,473$ 7,438,473$ Dosed Injection Central Area IRZ / Injection Initial 1,353,685$ 918,288$ 0 5 4,591,438$ 5,945,123$ Dosed Injection Central Area IRZ / Injection Opt 1 -$ 918,288$ 5 10 4,591,438$ 4,591,438$ Dosed Injection Central Area IRZ / Injection Opt 2 -$ -$ 10 15 -$ -$ Dosed Injection Central Area IRZ / Injection Opt 3 -$ -$ 15 30 -$ -$ Dosed Injection SCRIA / Dosed Injection Initial 2,115,069$ 643,490$ 0 5 3,217,450$ 5,332,519$ Dosed Injection SCRIA / Dosed Injection Opt 1 -$ 357,888$ 5 10 1,789,439$ 1,789,439$ Dosed Injection SCRIA / Dosed Injection Opt 2 -$ -$ 10 15 -$ -$ Dosed Injection SCRIA / Dosed Injection Opt 3 -$ 358,973$ 15 30 5,384,599$ 5,384,599$ Dosed Injection Source Area IRZ / Injection Initial 3,595,618$ 946,596$ 0 5 4,732,978$ 8,328,596$ Dosed Injection Source Area IRZ / Injection Opt 1 -$ -$ 5 10 -$ -$ Dosed Injection Source Area IRZ / Injection Opt 2 -$ -$ 10 15 -$ -$ Dosed Injection Source Area IRZ / Injection Opt 3 -$ 669,535$ 15 30 10,043,021$ 10,043,021$ Dosed Injection Northern Plume Fringe Initial -$ 112,201$ 0 5 561,004$ 561,004$ Dosed Injection Northern Plume Fringe Opt 1 -$ 112,201$ 5 10 561,004$ 561,004$ Dosed Injection Northern Plume Fringe Opt 2 -$ 112,201$ 10 15 561,004$ 561,004$ Dosed Injection Northern Plume Fringe Opt 3 -$ 112,201$ 15 30 1,683,013$ 1,683,013$ Dosed Injection Southeast and East Plume Fringe Initial -$ 168,301$ 0 5 841,506$ 841,506$ Dosed Injection Southeast and East Plume Fringe Opt 1 -$ 209,102$ 5 10 1,045,508$ 1,045,508$ Dosed Injection Southeast and East Plume Fringe Opt 2 -$ 173,401$ 10 15 867,007$ 867,007$ Dosed Injection Southeast and East Plume Fringe Opt 3 -$ 173,401$ 15 30 2,601,020$ 2,601,020$ Dosed Injection Southern Plume Fringe Initial -$ 158,101$ 0 5 790,506$ 790,506$ Dosed Injection Southern Plume Fringe Opt 1 -$ 249,902$ 5 10 1,249,509$ 1,249,509$ Dosed Injection Southern Plume Fringe Opt 2 -$ 249,902$ 10 15 1,249,509$ 1,249,509$ Dosed Injection Southern Plume Fringe Opt 3 -$ 249,902$ 15 30 3,748,528$ 3,748,528$
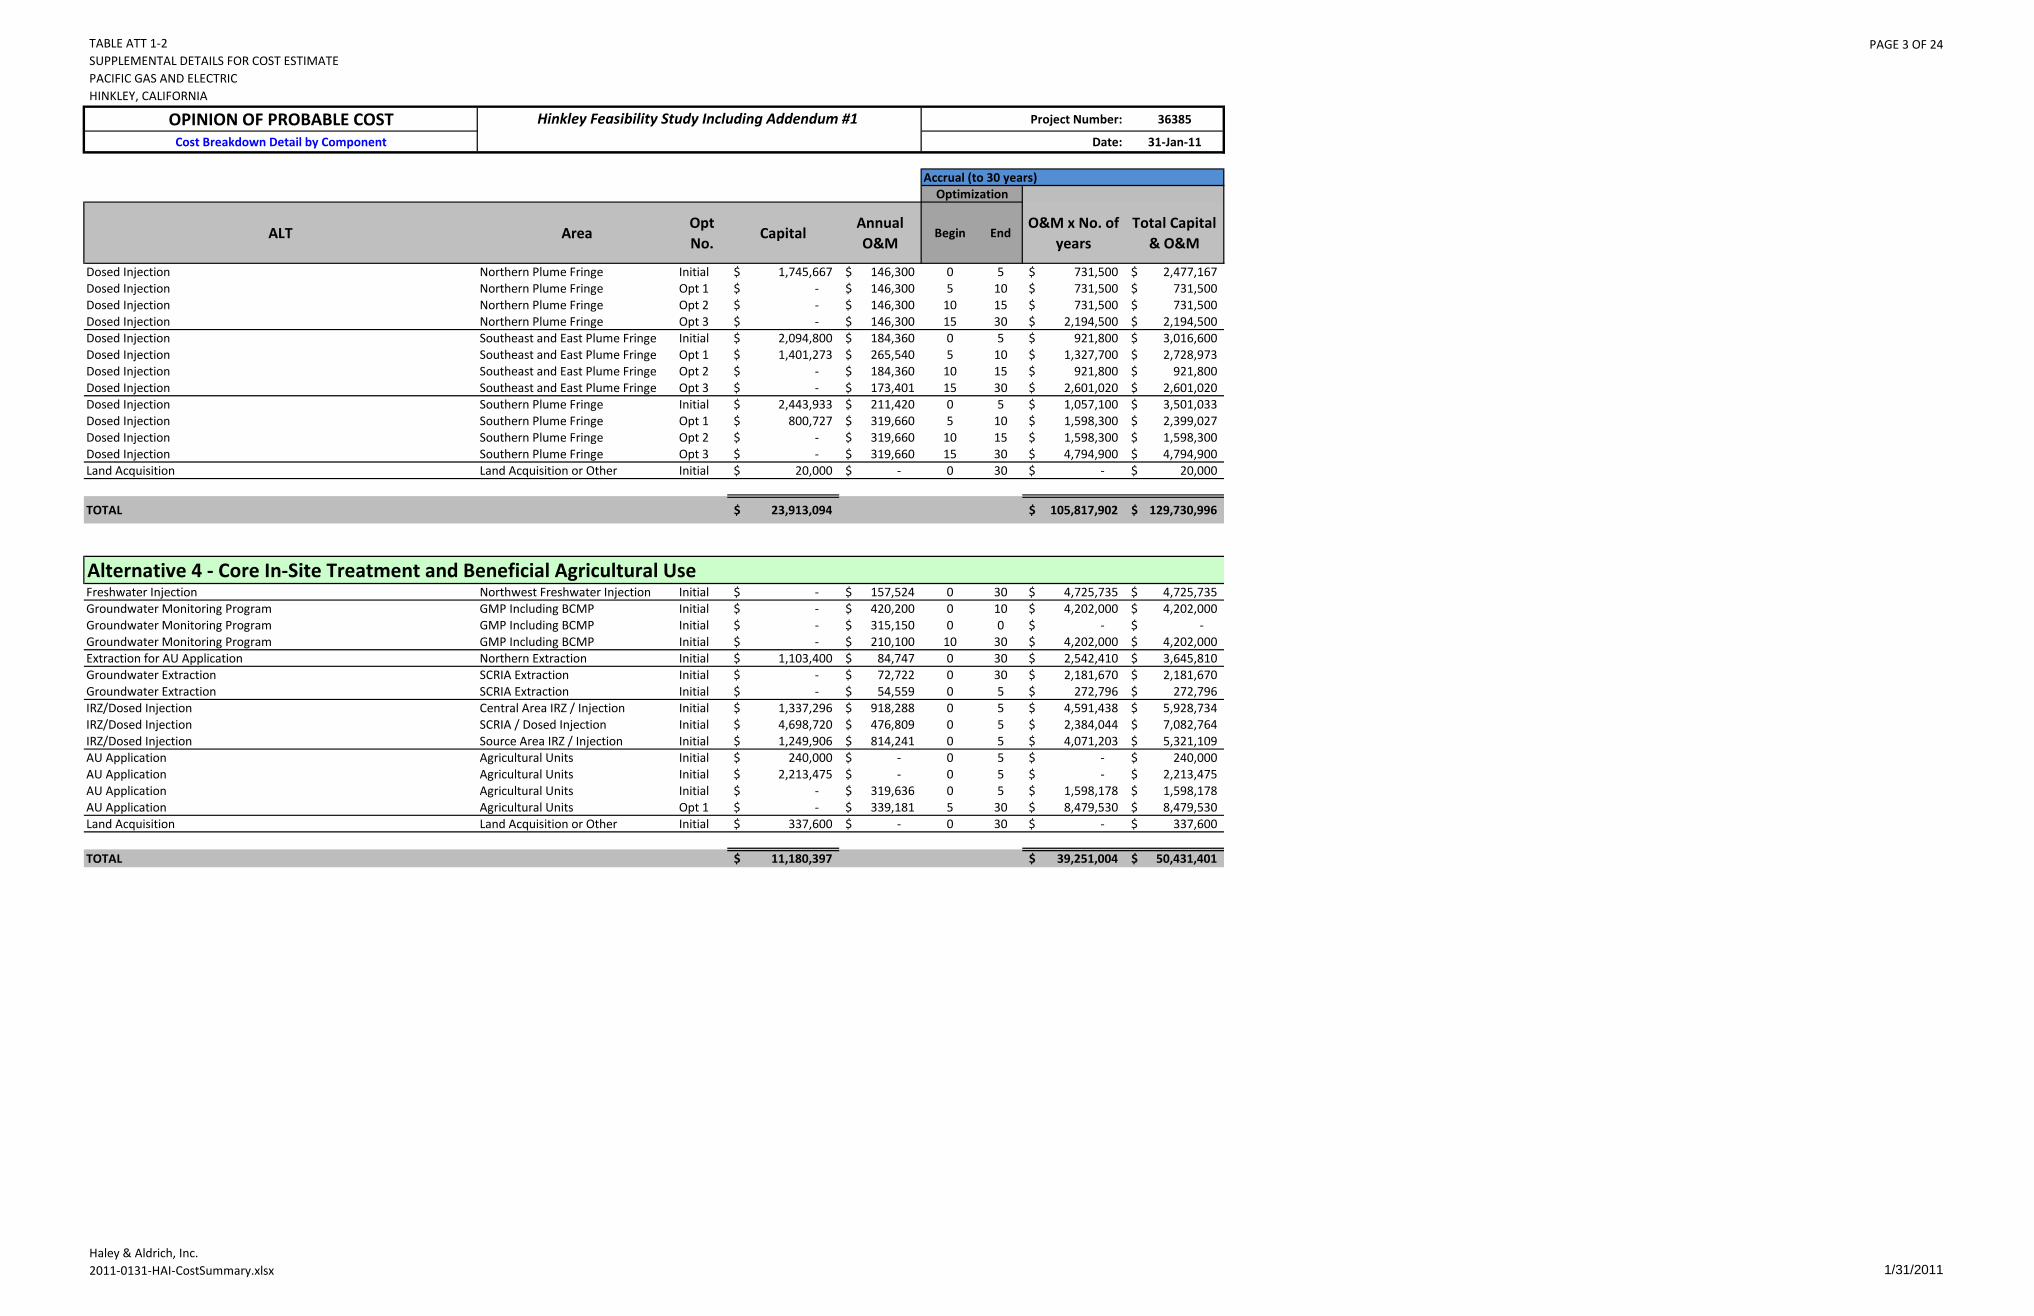
TABLE ATT 1-2SUPPLEMENTAL DETAILS FOR COST ESTIMATEPACIFIC GAS AND ELECTRICHINKLEY, CALIFORNIA
PAGE 3 OF 24
Haley & Aldrich, Inc.2011-0131-HAI-CostSummary.xlsx 1/31/2011
OPINION OF PROBABLE COST Project Number: 36385
Cost Breakdown Detail by Component Date: 31-Jan-11
Accrual (to 30 years)Optimization
ALT AreaOpt No.
CapitalAnnual O&M
Begin EndO&M x No. of
yearsTotal Capital
& O&M
Hinkley Feasibility Study Including Addendum #1
Dosed Injection Northern Plume Fringe Initial 1,745,667$ 146,300$ 0 5 731,500$ 2,477,167$ Dosed Injection Northern Plume Fringe Opt 1 -$ 146,300$ 5 10 731,500$ 731,500$ Dosed Injection Northern Plume Fringe Opt 2 -$ 146,300$ 10 15 731,500$ 731,500$ Dosed Injection Northern Plume Fringe Opt 3 -$ 146,300$ 15 30 2,194,500$ 2,194,500$ Dosed Injection Southeast and East Plume Fringe Initial 2,094,800$ 184,360$ 0 5 921,800$ 3,016,600$ Dosed Injection Southeast and East Plume Fringe Opt 1 1,401,273$ 265,540$ 5 10 1,327,700$ 2,728,973$ Dosed Injection Southeast and East Plume Fringe Opt 2 -$ 184,360$ 10 15 921,800$ 921,800$ Dosed Injection Southeast and East Plume Fringe Opt 3 -$ 173,401$ 15 30 2,601,020$ 2,601,020$ Dosed Injection Southern Plume Fringe Initial 2,443,933$ 211,420$ 0 5 1,057,100$ 3,501,033$ Dosed Injection Southern Plume Fringe Opt 1 800,727$ 319,660$ 5 10 1,598,300$ 2,399,027$ Dosed Injection Southern Plume Fringe Opt 2 -$ 319,660$ 10 15 1,598,300$ 1,598,300$ Dosed Injection Southern Plume Fringe Opt 3 -$ 319,660$ 15 30 4,794,900$ 4,794,900$ Land Acquisition Land Acquisition or Other Initial 20,000$ -$ 0 30 -$ 20,000$
TOTAL 23,913,094$ 105,817,902$ 129,730,996$
Alternative 4 - Core In-Site Treatment and Beneficial Agricultural UseFreshwater Injection Northwest Freshwater Injection Initial -$ 157,524$ 0 30 4,725,735$ 4,725,735$ Groundwater Monitoring Program GMP Including BCMP Initial -$ 420,200$ 0 10 4,202,000$ 4,202,000$ Groundwater Monitoring Program GMP Including BCMP Initial -$ 315,150$ 0 0 -$ -$ Groundwater Monitoring Program GMP Including BCMP Initial -$ 210,100$ 10 30 4,202,000$ 4,202,000$ Extraction for AU Application Northern Extraction Initial 1,103,400$ 84,747$ 0 30 2,542,410$ 3,645,810$ Groundwater Extraction SCRIA Extraction Initial -$ 72,722$ 0 30 2,181,670$ 2,181,670$ Groundwater Extraction SCRIA Extraction Initial -$ 54,559$ 0 5 272,796$ 272,796$ IRZ/Dosed Injection Central Area IRZ / Injection Initial 1,337,296$ 918,288$ 0 5 4,591,438$ 5,928,734$ IRZ/Dosed Injection SCRIA / Dosed Injection Initial 4,698,720$ 476,809$ 0 5 2,384,044$ 7,082,764$ IRZ/Dosed Injection Source Area IRZ / Injection Initial 1,249,906$ 814,241$ 0 5 4,071,203$ 5,321,109$ AU Application Agricultural Units Initial 240,000$ -$ 0 5 -$ 240,000$ AU Application Agricultural Units Initial 2,213,475$ -$ 0 5 -$ 2,213,475$ AU Application Agricultural Units Initial -$ 319,636$ 0 5 1,598,178$ 1,598,178$ AU Application Agricultural Units Opt 1 -$ 339,181$ 5 30 8,479,530$ 8,479,530$ Land Acquisition Land Acquisition or Other Initial 337,600$ -$ 0 30 -$ 337,600$
TOTAL 11,180,397$ 39,251,004$ 50,431,401$
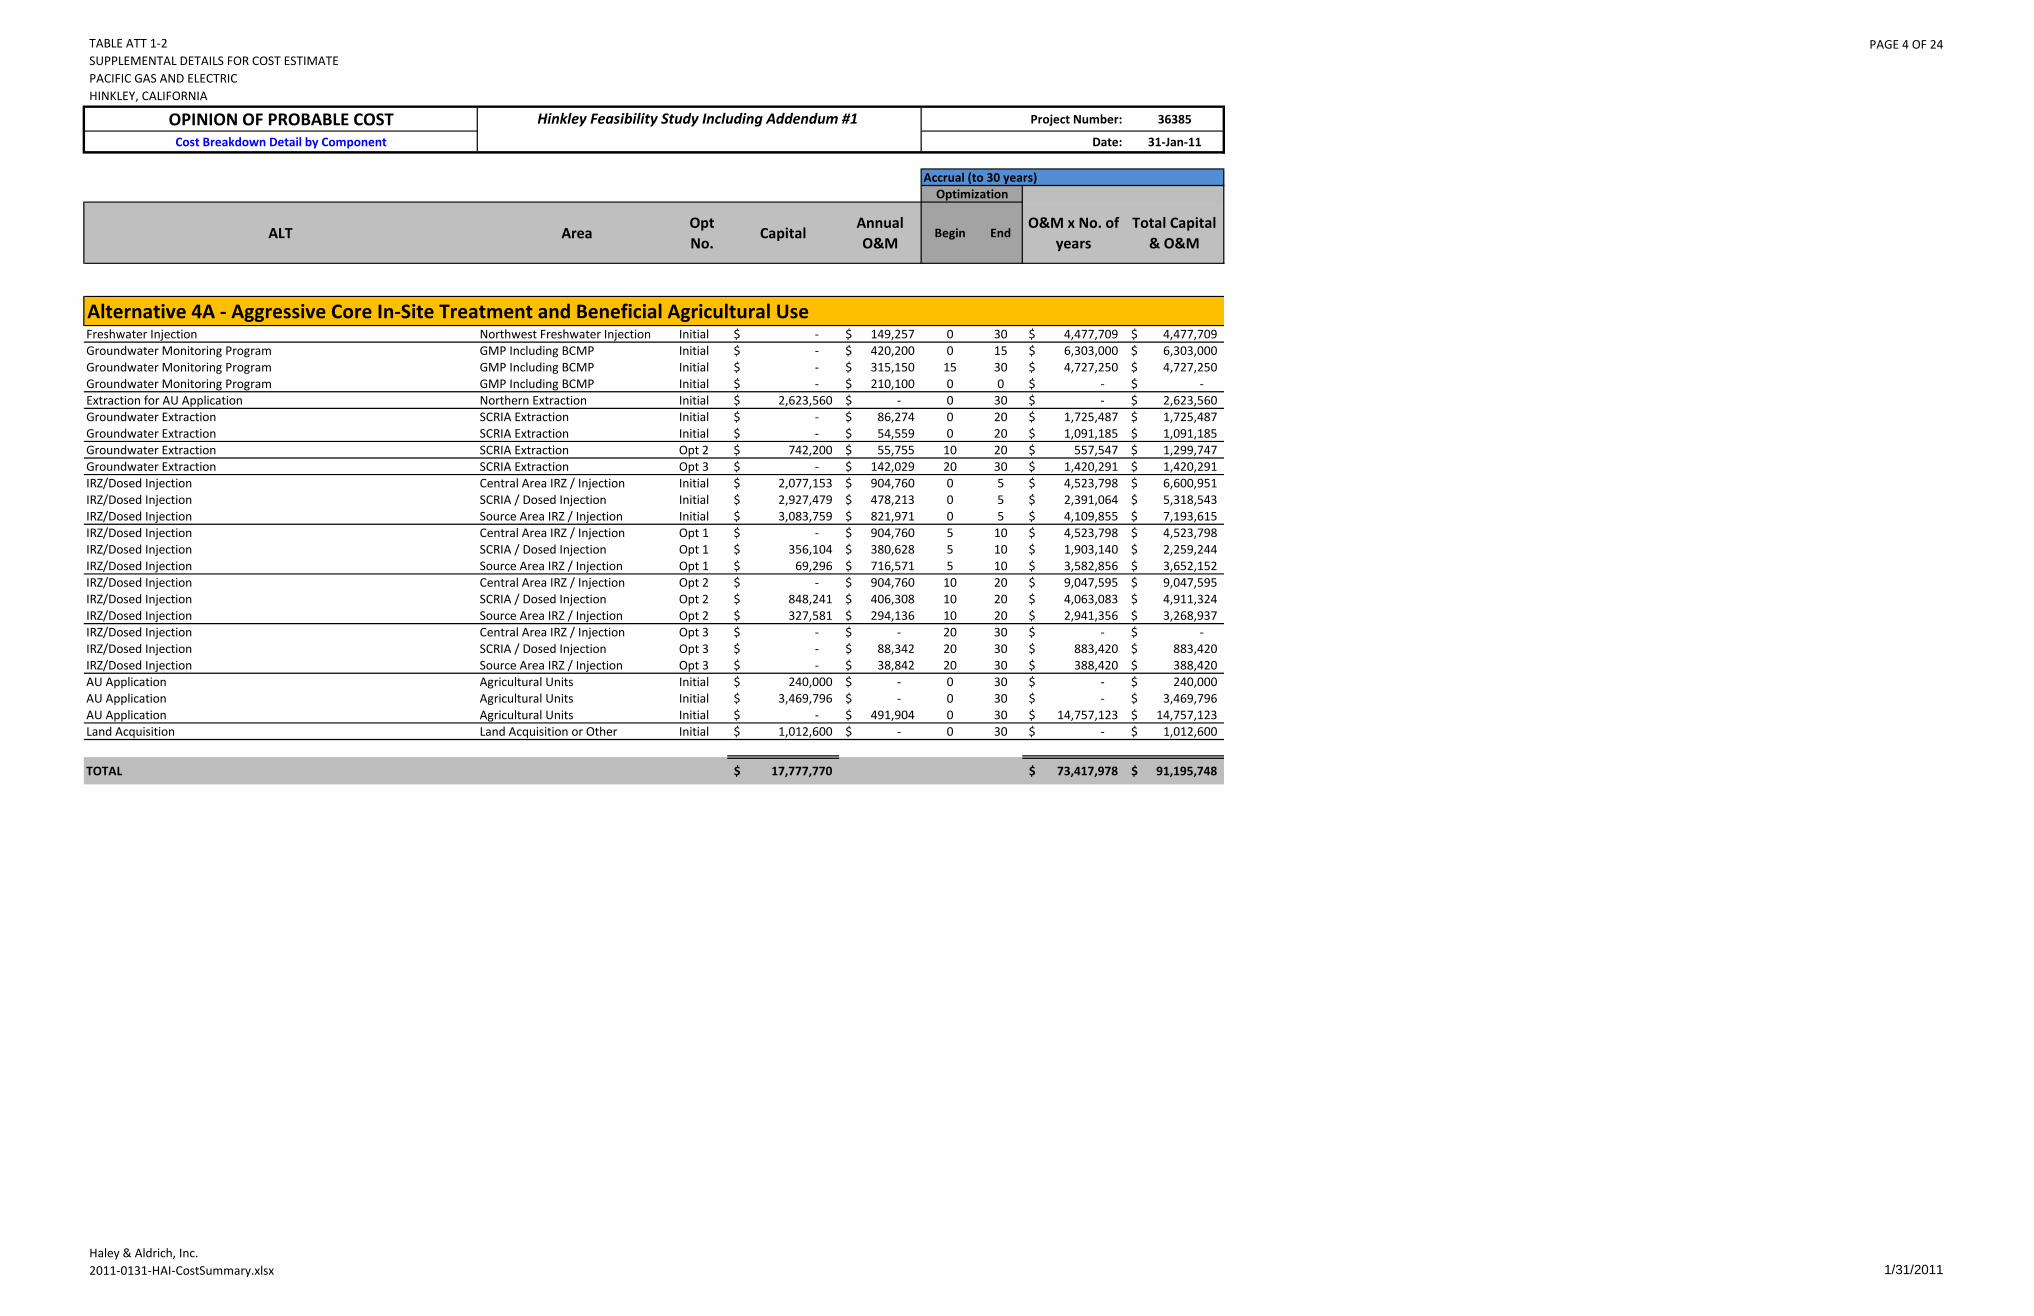
TABLE ATT 1-2SUPPLEMENTAL DETAILS FOR COST ESTIMATEPACIFIC GAS AND ELECTRICHINKLEY, CALIFORNIA
PAGE 4 OF 24
Haley & Aldrich, Inc.2011-0131-HAI-CostSummary.xlsx 1/31/2011
OPINION OF PROBABLE COST Project Number: 36385
Cost Breakdown Detail by Component Date: 31-Jan-11
Accrual (to 30 years)Optimization
ALT AreaOpt No.
CapitalAnnual O&M
Begin EndO&M x No. of
yearsTotal Capital
& O&M
Hinkley Feasibility Study Including Addendum #1
Alternative 4A - Aggressive Core In-Site Treatment and Beneficial Agricultural UseFreshwater Injection Northwest Freshwater Injection Initial -$ 149,257$ 0 30 4,477,709$ 4,477,709$ Groundwater Monitoring Program GMP Including BCMP Initial -$ 420,200$ 0 15 6,303,000$ 6,303,000$ Groundwater Monitoring Program GMP Including BCMP Initial -$ 315,150$ 15 30 4,727,250$ 4,727,250$ Groundwater Monitoring Program GMP Including BCMP Initial -$ 210,100$ 0 0 -$ -$ Extraction for AU Application Northern Extraction Initial 2,623,560$ -$ 0 30 -$ 2,623,560$ Groundwater Extraction SCRIA Extraction Initial -$ 86,274$ 0 20 1,725,487$ 1,725,487$ Groundwater Extraction SCRIA Extraction Initial -$ 54,559$ 0 20 1,091,185$ 1,091,185$ Groundwater Extraction SCRIA Extraction Opt 2 742,200$ 55,755$ 10 20 557,547$ 1,299,747$ Groundwater Extraction SCRIA Extraction Opt 3 -$ 142,029$ 20 30 1,420,291$ 1,420,291$ IRZ/Dosed Injection Central Area IRZ / Injection Initial 2,077,153$ 904,760$ 0 5 4,523,798$ 6,600,951$ IRZ/Dosed Injection SCRIA / Dosed Injection Initial 2,927,479$ 478,213$ 0 5 2,391,064$ 5,318,543$ IRZ/Dosed Injection Source Area IRZ / Injection Initial 3,083,759$ 821,971$ 0 5 4,109,855$ 7,193,615$ IRZ/Dosed Injection Central Area IRZ / Injection Opt 1 -$ 904,760$ 5 10 4,523,798$ 4,523,798$ IRZ/Dosed Injection SCRIA / Dosed Injection Opt 1 356,104$ 380,628$ 5 10 1,903,140$ 2,259,244$ IRZ/Dosed Injection Source Area IRZ / Injection Opt 1 69,296$ 716,571$ 5 10 3,582,856$ 3,652,152$ IRZ/Dosed Injection Central Area IRZ / Injection Opt 2 -$ 904,760$ 10 20 9,047,595$ 9,047,595$ IRZ/Dosed Injection SCRIA / Dosed Injection Opt 2 848,241$ 406,308$ 10 20 4,063,083$ 4,911,324$ IRZ/Dosed Injection Source Area IRZ / Injection Opt 2 327,581$ 294,136$ 10 20 2,941,356$ 3,268,937$ IRZ/Dosed Injection Central Area IRZ / Injection Opt 3 -$ -$ 20 30 -$ -$ IRZ/Dosed Injection SCRIA / Dosed Injection Opt 3 -$ 88,342$ 20 30 883,420$ 883,420$ IRZ/Dosed Injection Source Area IRZ / Injection Opt 3 -$ 38,842$ 20 30 388,420$ 388,420$ AU Application Agricultural Units Initial 240,000$ -$ 0 30 -$ 240,000$ AU Application Agricultural Units Initial 3,469,796$ -$ 0 30 -$ 3,469,796$ AU Application Agricultural Units Initial -$ 491,904$ 0 30 14,757,123$ 14,757,123$ Land Acquisition Land Acquisition or Other Initial 1,012,600$ -$ 0 30 -$ 1,012,600$
TOTAL 17,777,770$ 73,417,978$ 91,195,748$
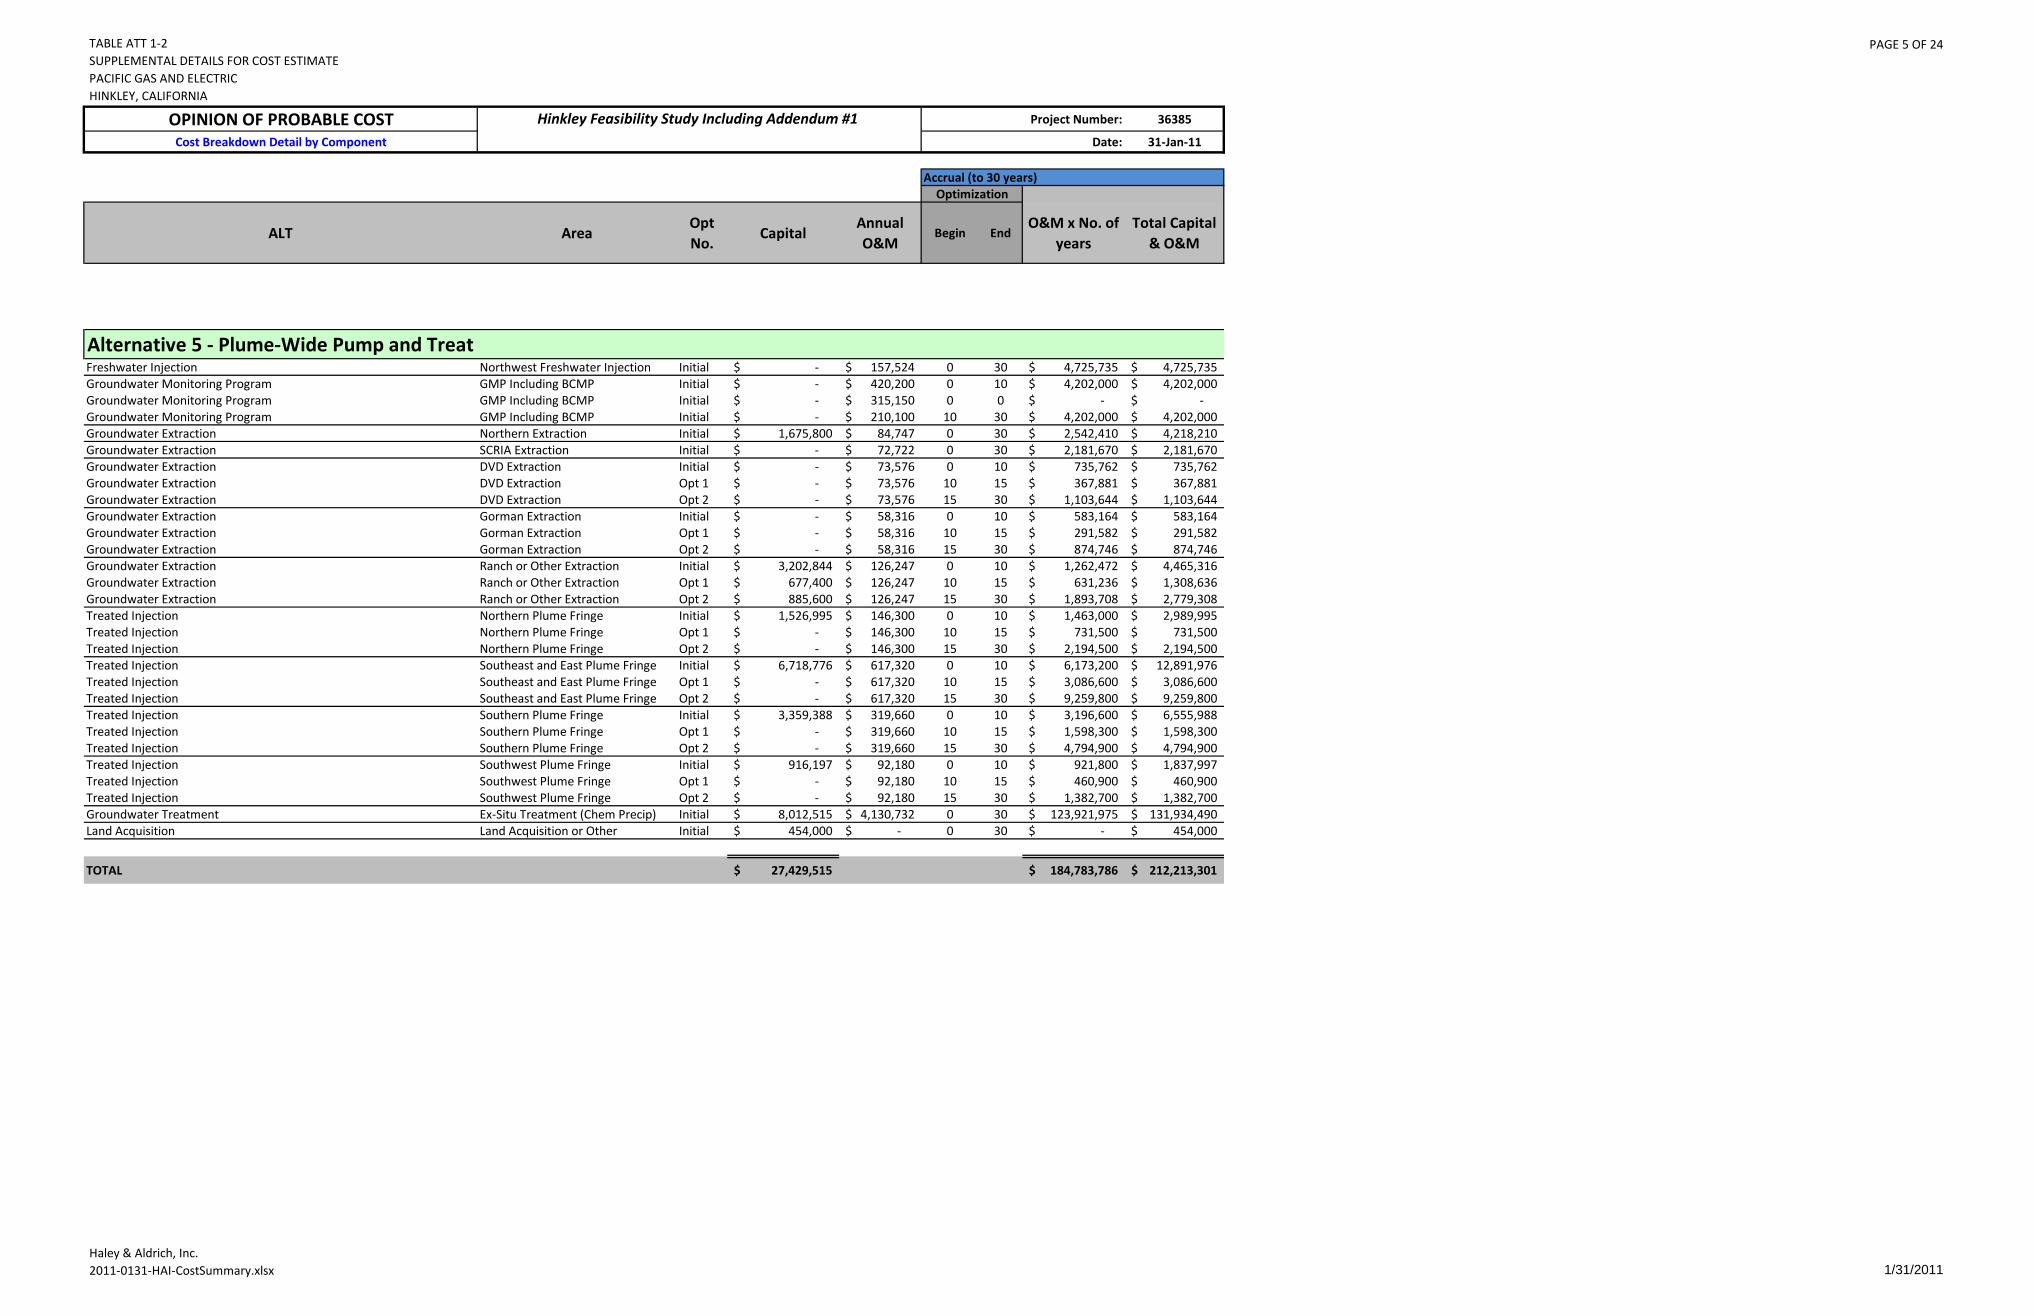
TABLE ATT 1-2SUPPLEMENTAL DETAILS FOR COST ESTIMATEPACIFIC GAS AND ELECTRICHINKLEY, CALIFORNIA
PAGE 5 OF 24
Haley & Aldrich, Inc.2011-0131-HAI-CostSummary.xlsx 1/31/2011
OPINION OF PROBABLE COST Project Number: 36385
Cost Breakdown Detail by Component Date: 31-Jan-11
Accrual (to 30 years)Optimization
ALT AreaOpt No.
CapitalAnnual O&M
Begin EndO&M x No. of
yearsTotal Capital
& O&M
Hinkley Feasibility Study Including Addendum #1
Alternative 5 - Plume-Wide Pump and TreatFreshwater Injection Northwest Freshwater Injection Initial -$ 157,524$ 0 30 4,725,735$ 4,725,735$ Groundwater Monitoring Program GMP Including BCMP Initial -$ 420,200$ 0 10 4,202,000$ 4,202,000$ Groundwater Monitoring Program GMP Including BCMP Initial -$ 315,150$ 0 0 -$ -$ Groundwater Monitoring Program GMP Including BCMP Initial -$ 210,100$ 10 30 4,202,000$ 4,202,000$ Groundwater Extraction Northern Extraction Initial 1,675,800$ 84,747$ 0 30 2,542,410$ 4,218,210$ Groundwater Extraction SCRIA Extraction Initial -$ 72,722$ 0 30 2,181,670$ 2,181,670$ Groundwater Extraction DVD Extraction Initial -$ 73,576$ 0 10 735,762$ 735,762$ Groundwater Extraction DVD Extraction Opt 1 -$ 73,576$ 10 15 367,881$ 367,881$ Groundwater Extraction DVD Extraction Opt 2 -$ 73,576$ 15 30 1,103,644$ 1,103,644$ Groundwater Extraction Gorman Extraction Initial -$ 58,316$ 0 10 583,164$ 583,164$ Groundwater Extraction Gorman Extraction Opt 1 -$ 58,316$ 10 15 291,582$ 291,582$ Groundwater Extraction Gorman Extraction Opt 2 -$ 58,316$ 15 30 874,746$ 874,746$ Groundwater Extraction Ranch or Other Extraction Initial 3,202,844$ 126,247$ 0 10 1,262,472$ 4,465,316$ Groundwater Extraction Ranch or Other Extraction Opt 1 677,400$ 126,247$ 10 15 631,236$ 1,308,636$ Groundwater Extraction Ranch or Other Extraction Opt 2 885,600$ 126,247$ 15 30 1,893,708$ 2,779,308$ Treated Injection Northern Plume Fringe Initial 1,526,995$ 146,300$ 0 10 1,463,000$ 2,989,995$ Treated Injection Northern Plume Fringe Opt 1 -$ 146,300$ 10 15 731,500$ 731,500$ Treated Injection Northern Plume Fringe Opt 2 -$ 146,300$ 15 30 2,194,500$ 2,194,500$ Treated Injection Southeast and East Plume Fringe Initial 6,718,776$ 617,320$ 0 10 6,173,200$ 12,891,976$ Treated Injection Southeast and East Plume Fringe Opt 1 -$ 617,320$ 10 15 3,086,600$ 3,086,600$ Treated Injection Southeast and East Plume Fringe Opt 2 -$ 617,320$ 15 30 9,259,800$ 9,259,800$ Treated Injection Southern Plume Fringe Initial 3,359,388$ 319,660$ 0 10 3,196,600$ 6,555,988$ Treated Injection Southern Plume Fringe Opt 1 -$ 319,660$ 10 15 1,598,300$ 1,598,300$ Treated Injection Southern Plume Fringe Opt 2 -$ 319,660$ 15 30 4,794,900$ 4,794,900$ Treated Injection Southwest Plume Fringe Initial 916,197$ 92,180$ 0 10 921,800$ 1,837,997$ Treated Injection Southwest Plume Fringe Opt 1 -$ 92,180$ 10 15 460,900$ 460,900$ Treated Injection Southwest Plume Fringe Opt 2 -$ 92,180$ 15 30 1,382,700$ 1,382,700$ Groundwater Treatment Ex-Situ Treatment (Chem Precip) Initial 8,012,515$ 4,130,732$ 0 30 123,921,975$ 131,934,490$ Land Acquisition Land Acquisition or Other Initial 454,000$ -$ 0 30 -$ 454,000$
TOTAL 27,429,515$ 184,783,786$ 212,213,301$
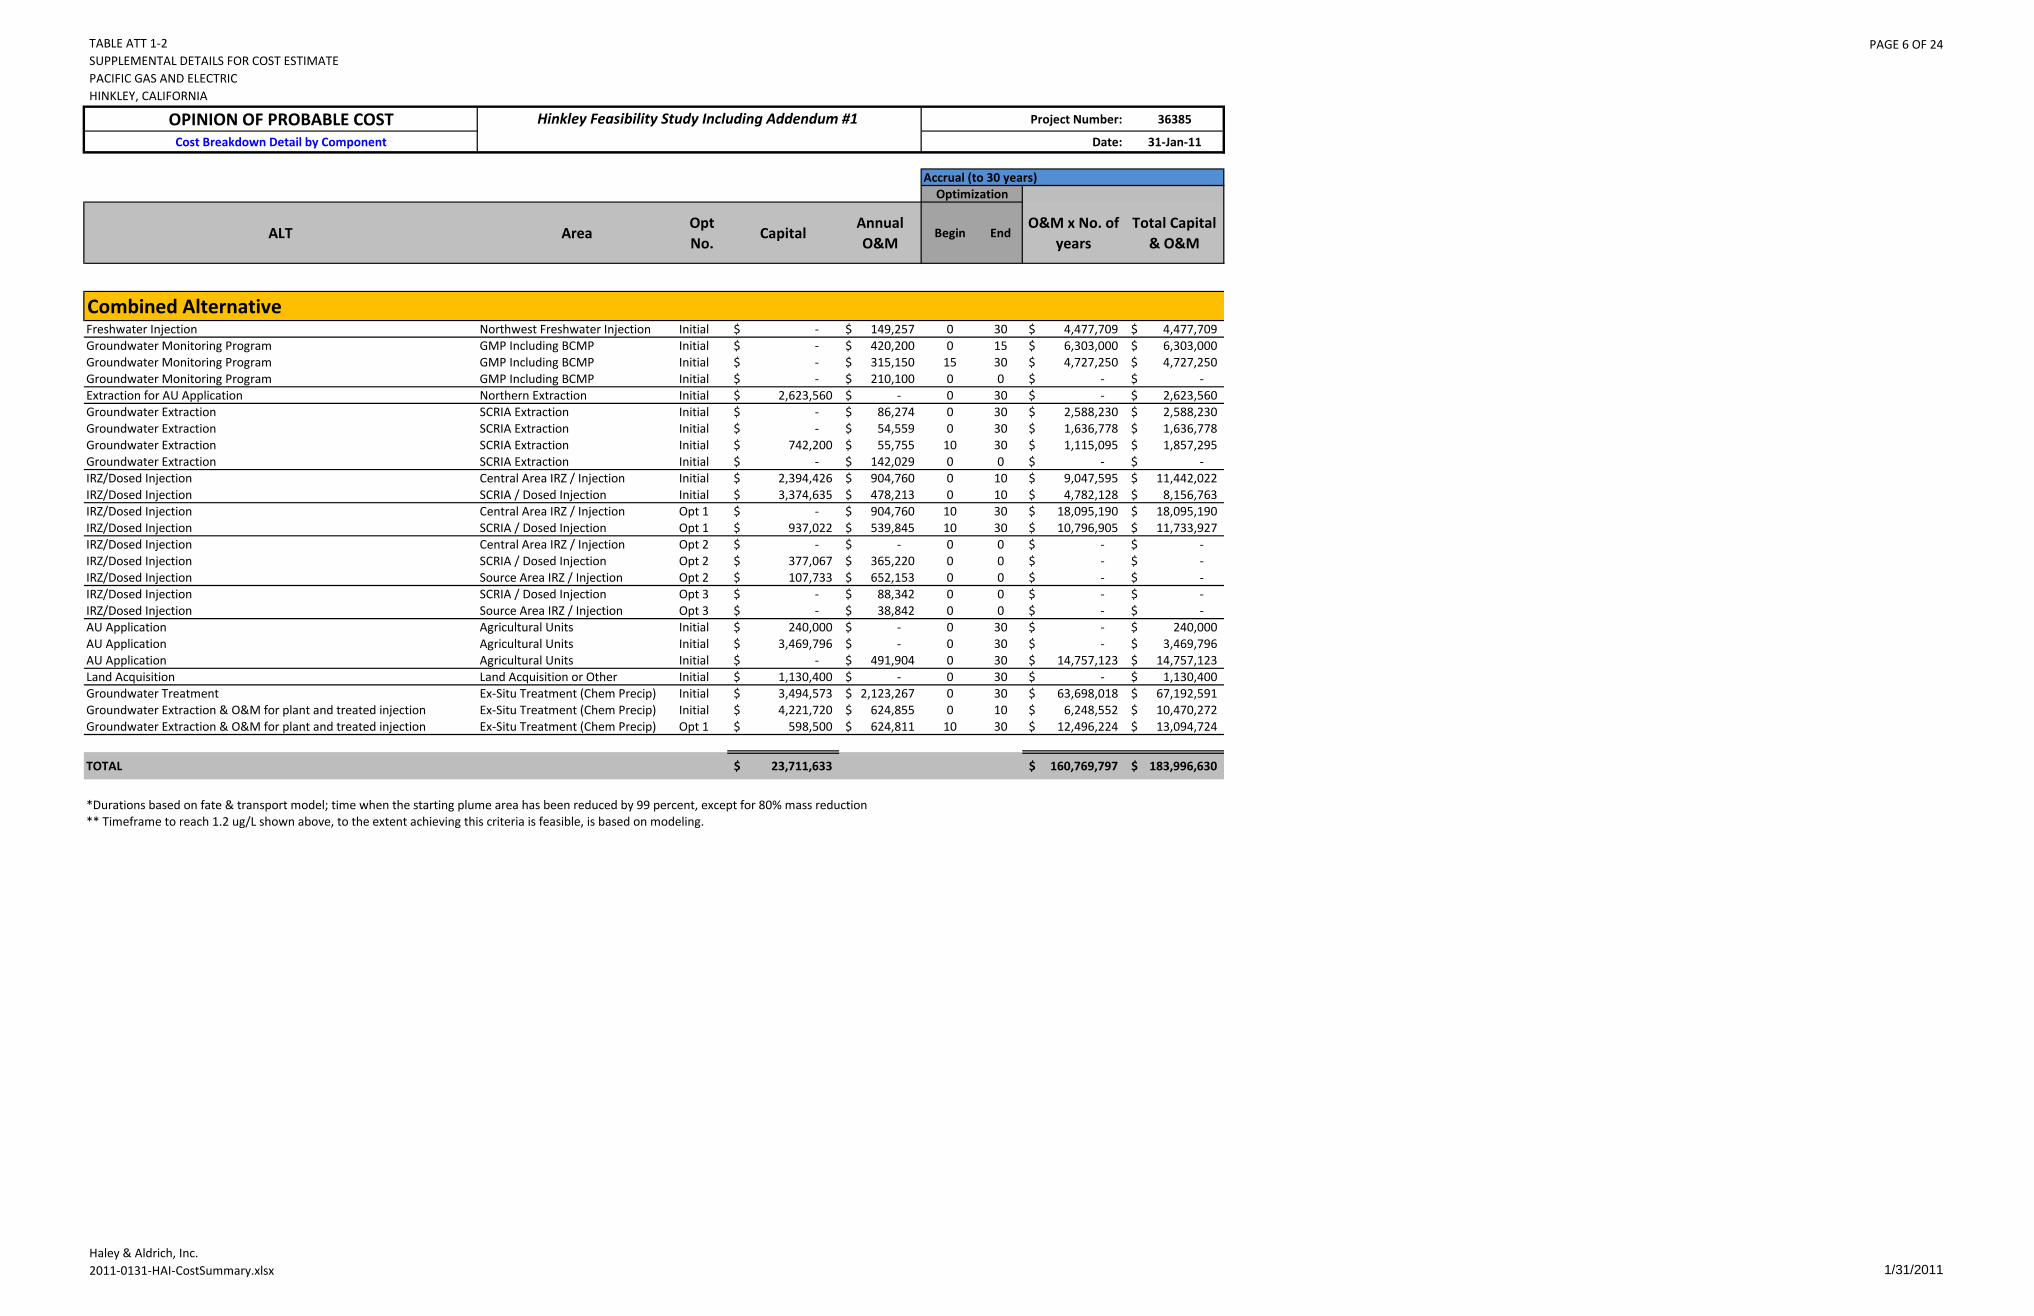
TABLE ATT 1-2SUPPLEMENTAL DETAILS FOR COST ESTIMATEPACIFIC GAS AND ELECTRICHINKLEY, CALIFORNIA
PAGE 6 OF 24
Haley & Aldrich, Inc.2011-0131-HAI-CostSummary.xlsx 1/31/2011
OPINION OF PROBABLE COST Project Number: 36385
Cost Breakdown Detail by Component Date: 31-Jan-11
Accrual (to 30 years)Optimization
ALT AreaOpt No.
CapitalAnnual O&M
Begin EndO&M x No. of
yearsTotal Capital
& O&M
Hinkley Feasibility Study Including Addendum #1
Combined AlternativeFreshwater Injection Northwest Freshwater Injection Initial -$ 149,257$ 0 30 4,477,709$ 4,477,709$ Groundwater Monitoring Program GMP Including BCMP Initial -$ 420,200$ 0 15 6,303,000$ 6,303,000$ Groundwater Monitoring Program GMP Including BCMP Initial -$ 315,150$ 15 30 4,727,250$ 4,727,250$ Groundwater Monitoring Program GMP Including BCMP Initial -$ 210,100$ 0 0 -$ -$ Extraction for AU Application Northern Extraction Initial 2,623,560$ -$ 0 30 -$ 2,623,560$ Groundwater Extraction SCRIA Extraction Initial -$ 86,274$ 0 30 2,588,230$ 2,588,230$ Groundwater Extraction SCRIA Extraction Initial -$ 54,559$ 0 30 1,636,778$ 1,636,778$ Groundwater Extraction SCRIA Extraction Initial 742,200$ 55,755$ 10 30 1,115,095$ 1,857,295$ Groundwater Extraction SCRIA Extraction Initial -$ 142,029$ 0 0 -$ -$ IRZ/Dosed Injection Central Area IRZ / Injection Initial 2,394,426$ 904,760$ 0 10 9,047,595$ 11,442,022$ IRZ/Dosed Injection SCRIA / Dosed Injection Initial 3,374,635$ 478,213$ 0 10 4,782,128$ 8,156,763$ IRZ/Dosed Injection Central Area IRZ / Injection Opt 1 -$ 904,760$ 10 30 18,095,190$ 18,095,190$ IRZ/Dosed Injection SCRIA / Dosed Injection Opt 1 937,022$ 539,845$ 10 30 10,796,905$ 11,733,927$ IRZ/Dosed Injection Central Area IRZ / Injection Opt 2 -$ -$ 0 0 -$ -$ IRZ/Dosed Injection SCRIA / Dosed Injection Opt 2 377,067$ 365,220$ 0 0 -$ -$ IRZ/Dosed Injection Source Area IRZ / Injection Opt 2 107,733$ 652,153$ 0 0 -$ -$ IRZ/Dosed Injection SCRIA / Dosed Injection Opt 3 -$ 88,342$ 0 0 -$ -$ IRZ/Dosed Injection Source Area IRZ / Injection Opt 3 -$ 38,842$ 0 0 -$ -$ AU Application Agricultural Units Initial 240,000$ -$ 0 30 -$ 240,000$ AU Application Agricultural Units Initial 3,469,796$ -$ 0 30 -$ 3,469,796$ AU Application Agricultural Units Initial -$ 491,904$ 0 30 14,757,123$ 14,757,123$ Land Acquisition Land Acquisition or Other Initial 1,130,400$ -$ 0 30 -$ 1,130,400$ Groundwater Treatment Ex-Situ Treatment (Chem Precip) Initial 3,494,573$ 2,123,267$ 0 30 63,698,018$ 67,192,591$ Groundwater Extraction & O&M for plant and treated injection Ex-Situ Treatment (Chem Precip) Initial 4,221,720$ 624,855$ 0 10 6,248,552$ 10,470,272$ Groundwater Extraction & O&M for plant and treated injection Ex-Situ Treatment (Chem Precip) Opt 1 598,500$ 624,811$ 10 30 12,496,224$ 13,094,724$
TOTAL 23,711,633$ 160,769,797$ 183,996,630$
** Timeframe to reach 1.2 ug/L shown above, to the extent achieving this criteria is feasible, is based on modeling.*Durations based on fate & transport model; time when the starting plume area has been reduced by 99 percent, except for 80% mass reduction
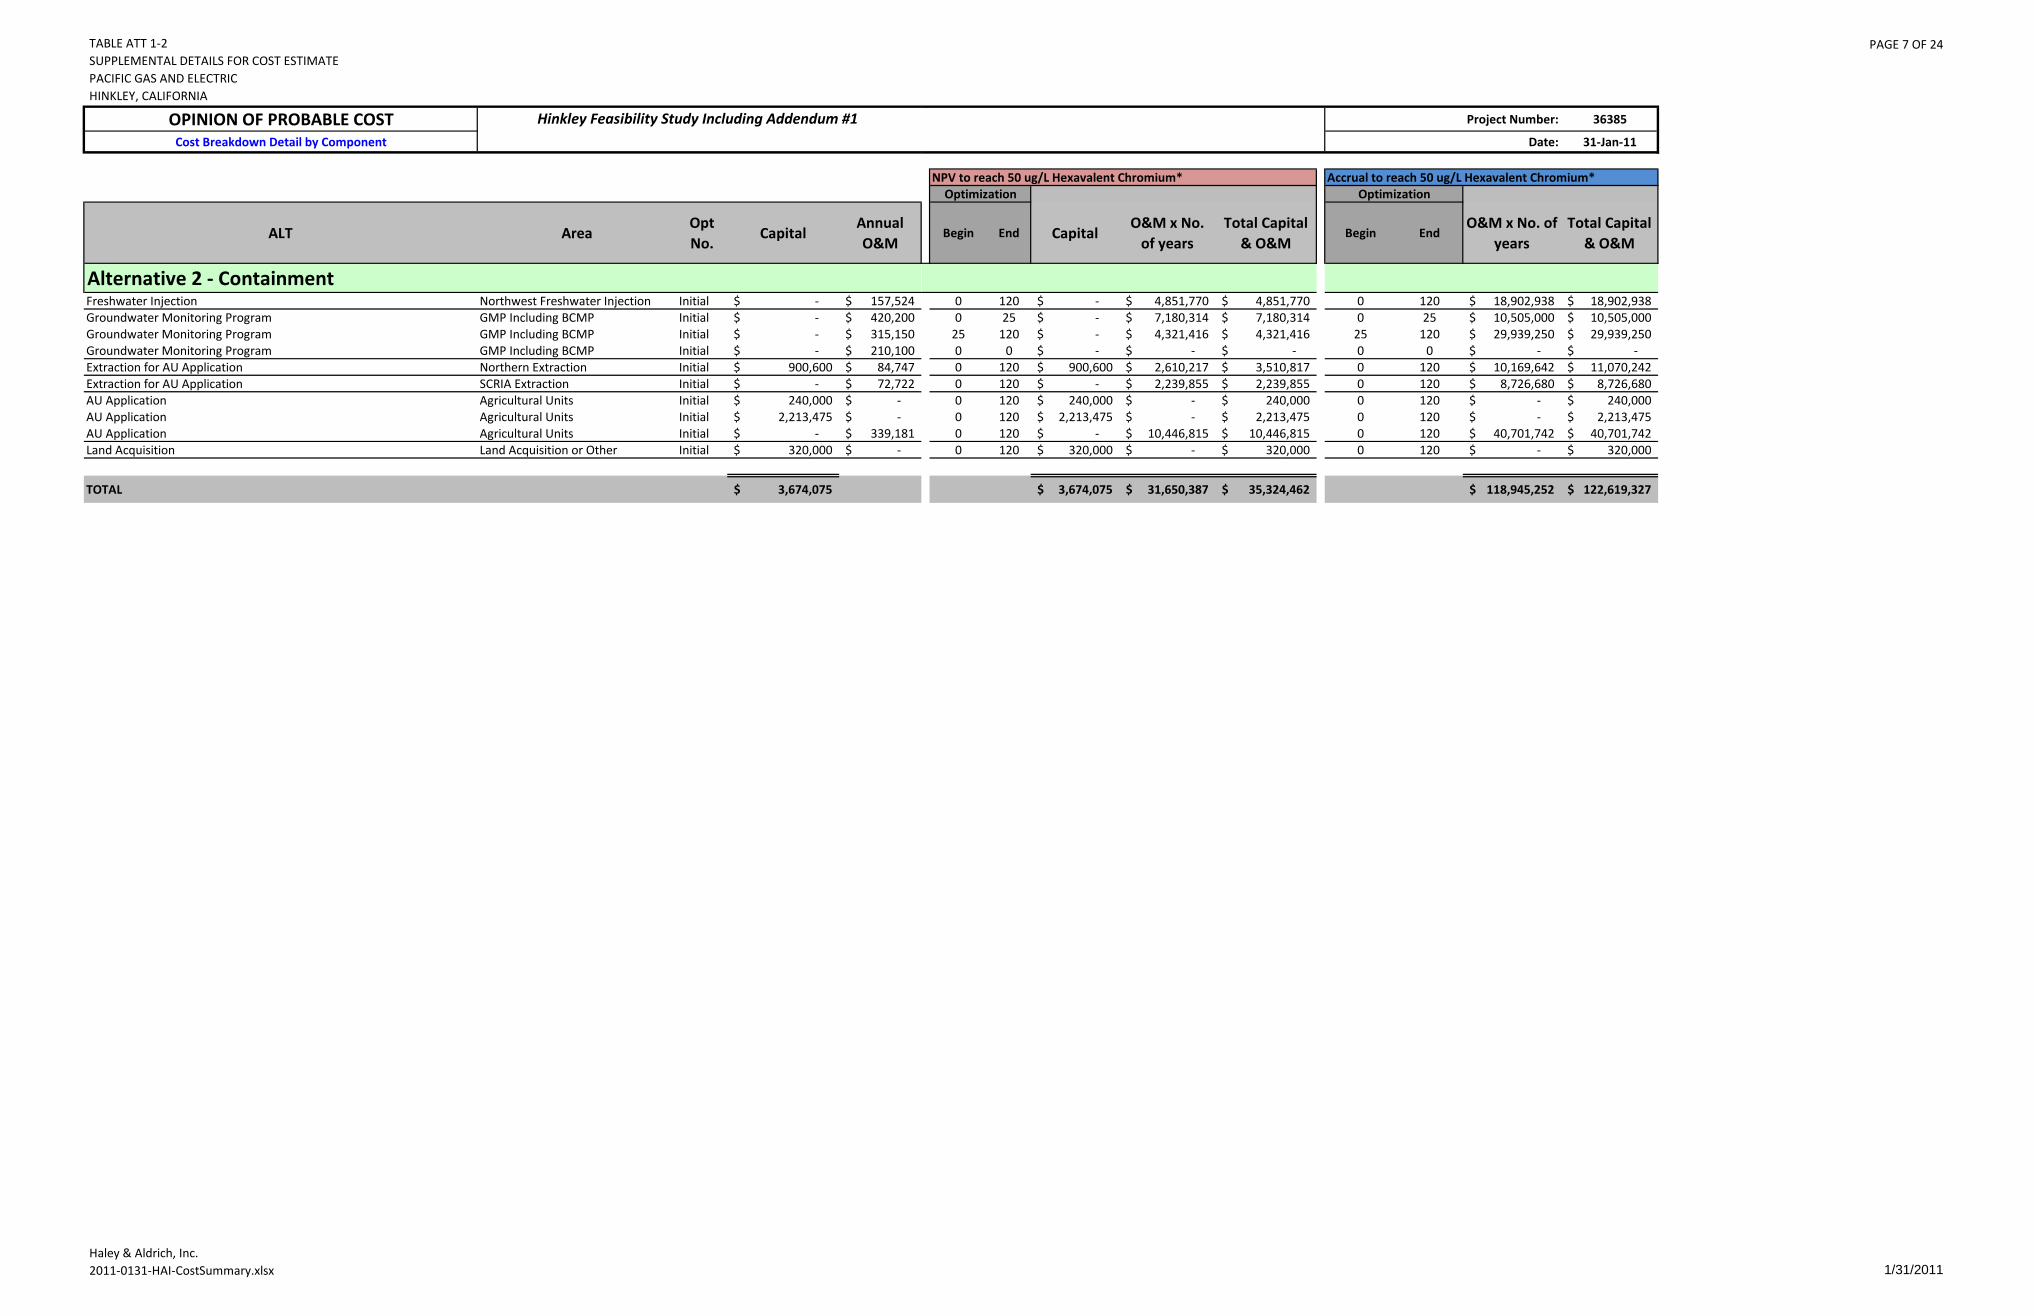
TABLE ATT 1-2SUPPLEMENTAL DETAILS FOR COST ESTIMATEPACIFIC GAS AND ELECTRICHINKLEY, CALIFORNIA
PAGE 7 OF 24
Haley & Aldrich, Inc.2011-0131-HAI-CostSummary.xlsx 1/31/2011
OPINION OF PROBABLE COSTCost Breakdown Detail by Component
ALT AreaOpt No.
CapitalAnnual O&M
Alternative 2 - ContainmentFreshwater Injection Northwest Freshwater Injection Initial -$ 157,524$ Groundwater Monitoring Program GMP Including BCMP Initial -$ 420,200$ Groundwater Monitoring Program GMP Including BCMP Initial -$ 315,150$ Groundwater Monitoring Program GMP Including BCMP Initial -$ 210,100$ Extraction for AU Application Northern Extraction Initial 900,600$ 84,747$ Extraction for AU Application SCRIA Extraction Initial -$ 72,722$ AU Application Agricultural Units Initial 240,000$ -$ AU Application Agricultural Units Initial 2,213,475$ -$ AU Application Agricultural Units Initial -$ 339,181$ Land Acquisition Land Acquisition or Other Initial 320,000$ -$
TOTAL 3,674,075$
Hinkley Feasibility Study Including Addendum #1 Project Number: 36385
Date: 31-Jan-11
NPV to reach 50 ug/L Hexavalent Chromium* Accrual to reach 50 ug/L Hexavalent Chromium*Optimization Optimization
Begin End CapitalO&M x No.
of yearsTotal Capital
& O&MBegin End
O&M x No. of years
Total Capital & O&M
0 120 -$ 4,851,770$ 4,851,770$ 0 120 18,902,938$ 18,902,938$ 0 25 -$ 7,180,314$ 7,180,314$ 0 25 10,505,000$ 10,505,000$
25 120 -$ 4,321,416$ 4,321,416$ 25 120 29,939,250$ 29,939,250$ 0 0 -$ -$ -$ 0 0 -$ -$ 0 120 900,600$ 2,610,217$ 3,510,817$ 0 120 10,169,642$ 11,070,242$ 0 120 -$ 2,239,855$ 2,239,855$ 0 120 8,726,680$ 8,726,680$ 0 120 240,000$ -$ 240,000$ 0 120 -$ 240,000$ 0 120 2,213,475$ -$ 2,213,475$ 0 120 -$ 2,213,475$ 0 120 -$ 10,446,815$ 10,446,815$ 0 120 40,701,742$ 40,701,742$ 0 120 320,000$ -$ 320,000$ 0 120 -$ 320,000$
3,674,075$ 31,650,387$ 35,324,462$ 118,945,252$ 122,619,327$
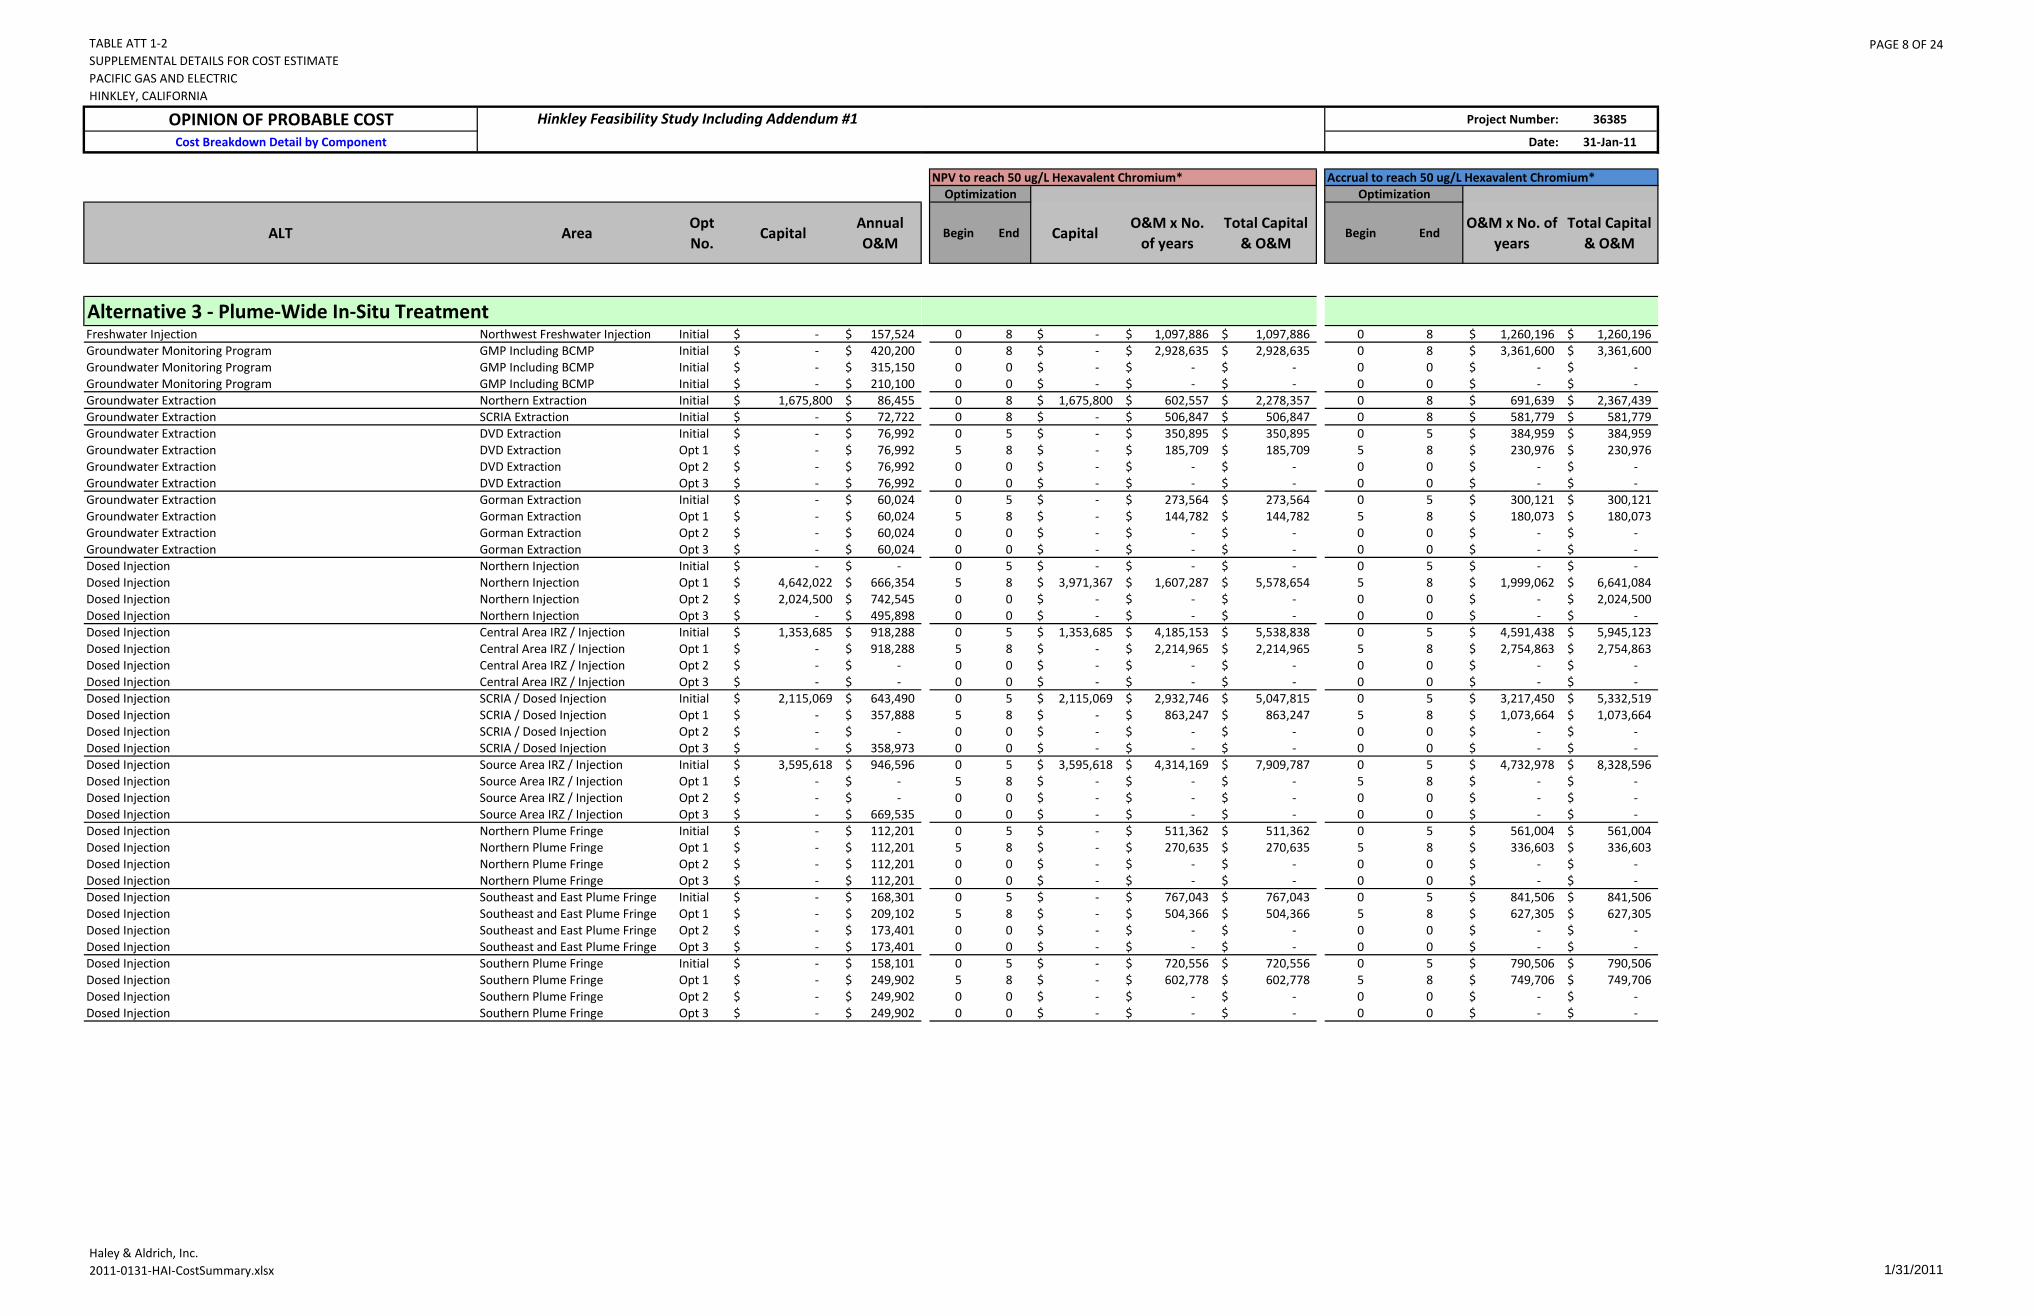
TABLE ATT 1-2SUPPLEMENTAL DETAILS FOR COST ESTIMATEPACIFIC GAS AND ELECTRICHINKLEY, CALIFORNIA
PAGE 8 OF 24
Haley & Aldrich, Inc.2011-0131-HAI-CostSummary.xlsx 1/31/2011
OPINION OF PROBABLE COSTCost Breakdown Detail by Component
ALT AreaOpt No.
CapitalAnnual O&M
Hinkley Feasibility Study Including Addendum #1
Alternative 3 - Plume-Wide In-Situ TreatmentFreshwater Injection Northwest Freshwater Injection Initial -$ 157,524$ Groundwater Monitoring Program GMP Including BCMP Initial -$ 420,200$ Groundwater Monitoring Program GMP Including BCMP Initial -$ 315,150$ Groundwater Monitoring Program GMP Including BCMP Initial -$ 210,100$ Groundwater Extraction Northern Extraction Initial 1,675,800$ 86,455$ Groundwater Extraction SCRIA Extraction Initial -$ 72,722$ Groundwater Extraction DVD Extraction Initial -$ 76,992$ Groundwater Extraction DVD Extraction Opt 1 -$ 76,992$ Groundwater Extraction DVD Extraction Opt 2 -$ 76,992$ Groundwater Extraction DVD Extraction Opt 3 -$ 76,992$ Groundwater Extraction Gorman Extraction Initial -$ 60,024$ Groundwater Extraction Gorman Extraction Opt 1 -$ 60,024$ Groundwater Extraction Gorman Extraction Opt 2 -$ 60,024$ Groundwater Extraction Gorman Extraction Opt 3 -$ 60,024$ Dosed Injection Northern Injection Initial -$ -$ Dosed Injection Northern Injection Opt 1 4,642,022$ 666,354$ Dosed Injection Northern Injection Opt 2 2,024,500$ 742,545$ Dosed Injection Northern Injection Opt 3 -$ 495,898$ Dosed Injection Central Area IRZ / Injection Initial 1,353,685$ 918,288$ Dosed Injection Central Area IRZ / Injection Opt 1 -$ 918,288$ Dosed Injection Central Area IRZ / Injection Opt 2 -$ -$ Dosed Injection Central Area IRZ / Injection Opt 3 -$ -$ Dosed Injection SCRIA / Dosed Injection Initial 2,115,069$ 643,490$ Dosed Injection SCRIA / Dosed Injection Opt 1 -$ 357,888$ Dosed Injection SCRIA / Dosed Injection Opt 2 -$ -$ Dosed Injection SCRIA / Dosed Injection Opt 3 -$ 358,973$ Dosed Injection Source Area IRZ / Injection Initial 3,595,618$ 946,596$ Dosed Injection Source Area IRZ / Injection Opt 1 -$ -$ Dosed Injection Source Area IRZ / Injection Opt 2 -$ -$ Dosed Injection Source Area IRZ / Injection Opt 3 -$ 669,535$ Dosed Injection Northern Plume Fringe Initial -$ 112,201$ Dosed Injection Northern Plume Fringe Opt 1 -$ 112,201$ Dosed Injection Northern Plume Fringe Opt 2 -$ 112,201$ Dosed Injection Northern Plume Fringe Opt 3 -$ 112,201$ Dosed Injection Southeast and East Plume Fringe Initial -$ 168,301$ Dosed Injection Southeast and East Plume Fringe Opt 1 -$ 209,102$ Dosed Injection Southeast and East Plume Fringe Opt 2 -$ 173,401$ Dosed Injection Southeast and East Plume Fringe Opt 3 -$ 173,401$ Dosed Injection Southern Plume Fringe Initial -$ 158,101$ Dosed Injection Southern Plume Fringe Opt 1 -$ 249,902$ Dosed Injection Southern Plume Fringe Opt 2 -$ 249,902$ Dosed Injection Southern Plume Fringe Opt 3 -$ 249,902$
Project Number: 36385
Date: 31-Jan-11
NPV to reach 50 ug/L Hexavalent Chromium* Accrual to reach 50 ug/L Hexavalent Chromium*Optimization Optimization
Begin End CapitalO&M x No.
of yearsTotal Capital
& O&MBegin End
O&M x No. of years
Total Capital & O&M
0 8 -$ 1,097,886$ 1,097,886$ 0 8 1,260,196$ 1,260,196$ 0 8 -$ 2,928,635$ 2,928,635$ 0 8 3,361,600$ 3,361,600$ 0 0 -$ -$ -$ 0 0 -$ -$ 0 0 -$ -$ -$ 0 0 -$ -$ 0 8 1,675,800$ 602,557$ 2,278,357$ 0 8 691,639$ 2,367,439$ 0 8 -$ 506,847$ 506,847$ 0 8 581,779$ 581,779$ 0 5 -$ 350,895$ 350,895$ 0 5 384,959$ 384,959$ 5 8 -$ 185,709$ 185,709$ 5 8 230,976$ 230,976$ 0 0 -$ -$ -$ 0 0 -$ -$ 0 0 -$ -$ -$ 0 0 -$ -$ 0 5 -$ 273,564$ 273,564$ 0 5 300,121$ 300,121$ 5 8 -$ 144,782$ 144,782$ 5 8 180,073$ 180,073$ 0 0 -$ -$ -$ 0 0 -$ -$ 0 0 -$ -$ -$ 0 0 -$ -$ 0 5 -$ -$ -$ 0 5 -$ -$ 5 8 3,971,367$ 1,607,287$ 5,578,654$ 5 8 1,999,062$ 6,641,084$ 0 0 -$ -$ -$ 0 0 -$ 2,024,500$ 0 0 -$ -$ -$ 0 0 -$ -$ 0 5 1,353,685$ 4,185,153$ 5,538,838$ 0 5 4,591,438$ 5,945,123$ 5 8 -$ 2,214,965$ 2,214,965$ 5 8 2,754,863$ 2,754,863$ 0 0 -$ -$ -$ 0 0 -$ -$ 0 0 -$ -$ -$ 0 0 -$ -$ 0 5 2,115,069$ 2,932,746$ 5,047,815$ 0 5 3,217,450$ 5,332,519$ 5 8 -$ 863,247$ 863,247$ 5 8 1,073,664$ 1,073,664$ 0 0 -$ -$ -$ 0 0 -$ -$ 0 0 -$ -$ -$ 0 0 -$ -$ 0 5 3,595,618$ 4,314,169$ 7,909,787$ 0 5 4,732,978$ 8,328,596$ 5 8 -$ -$ -$ 5 8 -$ -$ 0 0 -$ -$ -$ 0 0 -$ -$ 0 0 -$ -$ -$ 0 0 -$ -$ 0 5 -$ 511,362$ 511,362$ 0 5 561,004$ 561,004$ 5 8 -$ 270,635$ 270,635$ 5 8 336,603$ 336,603$ 0 0 -$ -$ -$ 0 0 -$ -$ 0 0 -$ -$ -$ 0 0 -$ -$ 0 5 -$ 767,043$ 767,043$ 0 5 841,506$ 841,506$ 5 8 -$ 504,366$ 504,366$ 5 8 627,305$ 627,305$ 0 0 -$ -$ -$ 0 0 -$ -$ 0 0 -$ -$ -$ 0 0 -$ -$ 0 5 -$ 720,556$ 720,556$ 0 5 790,506$ 790,506$ 5 8 -$ 602,778$ 602,778$ 5 8 749,706$ 749,706$ 0 0 -$ -$ -$ 0 0 -$ -$ 0 0 -$ -$ -$ 0 0 -$ -$
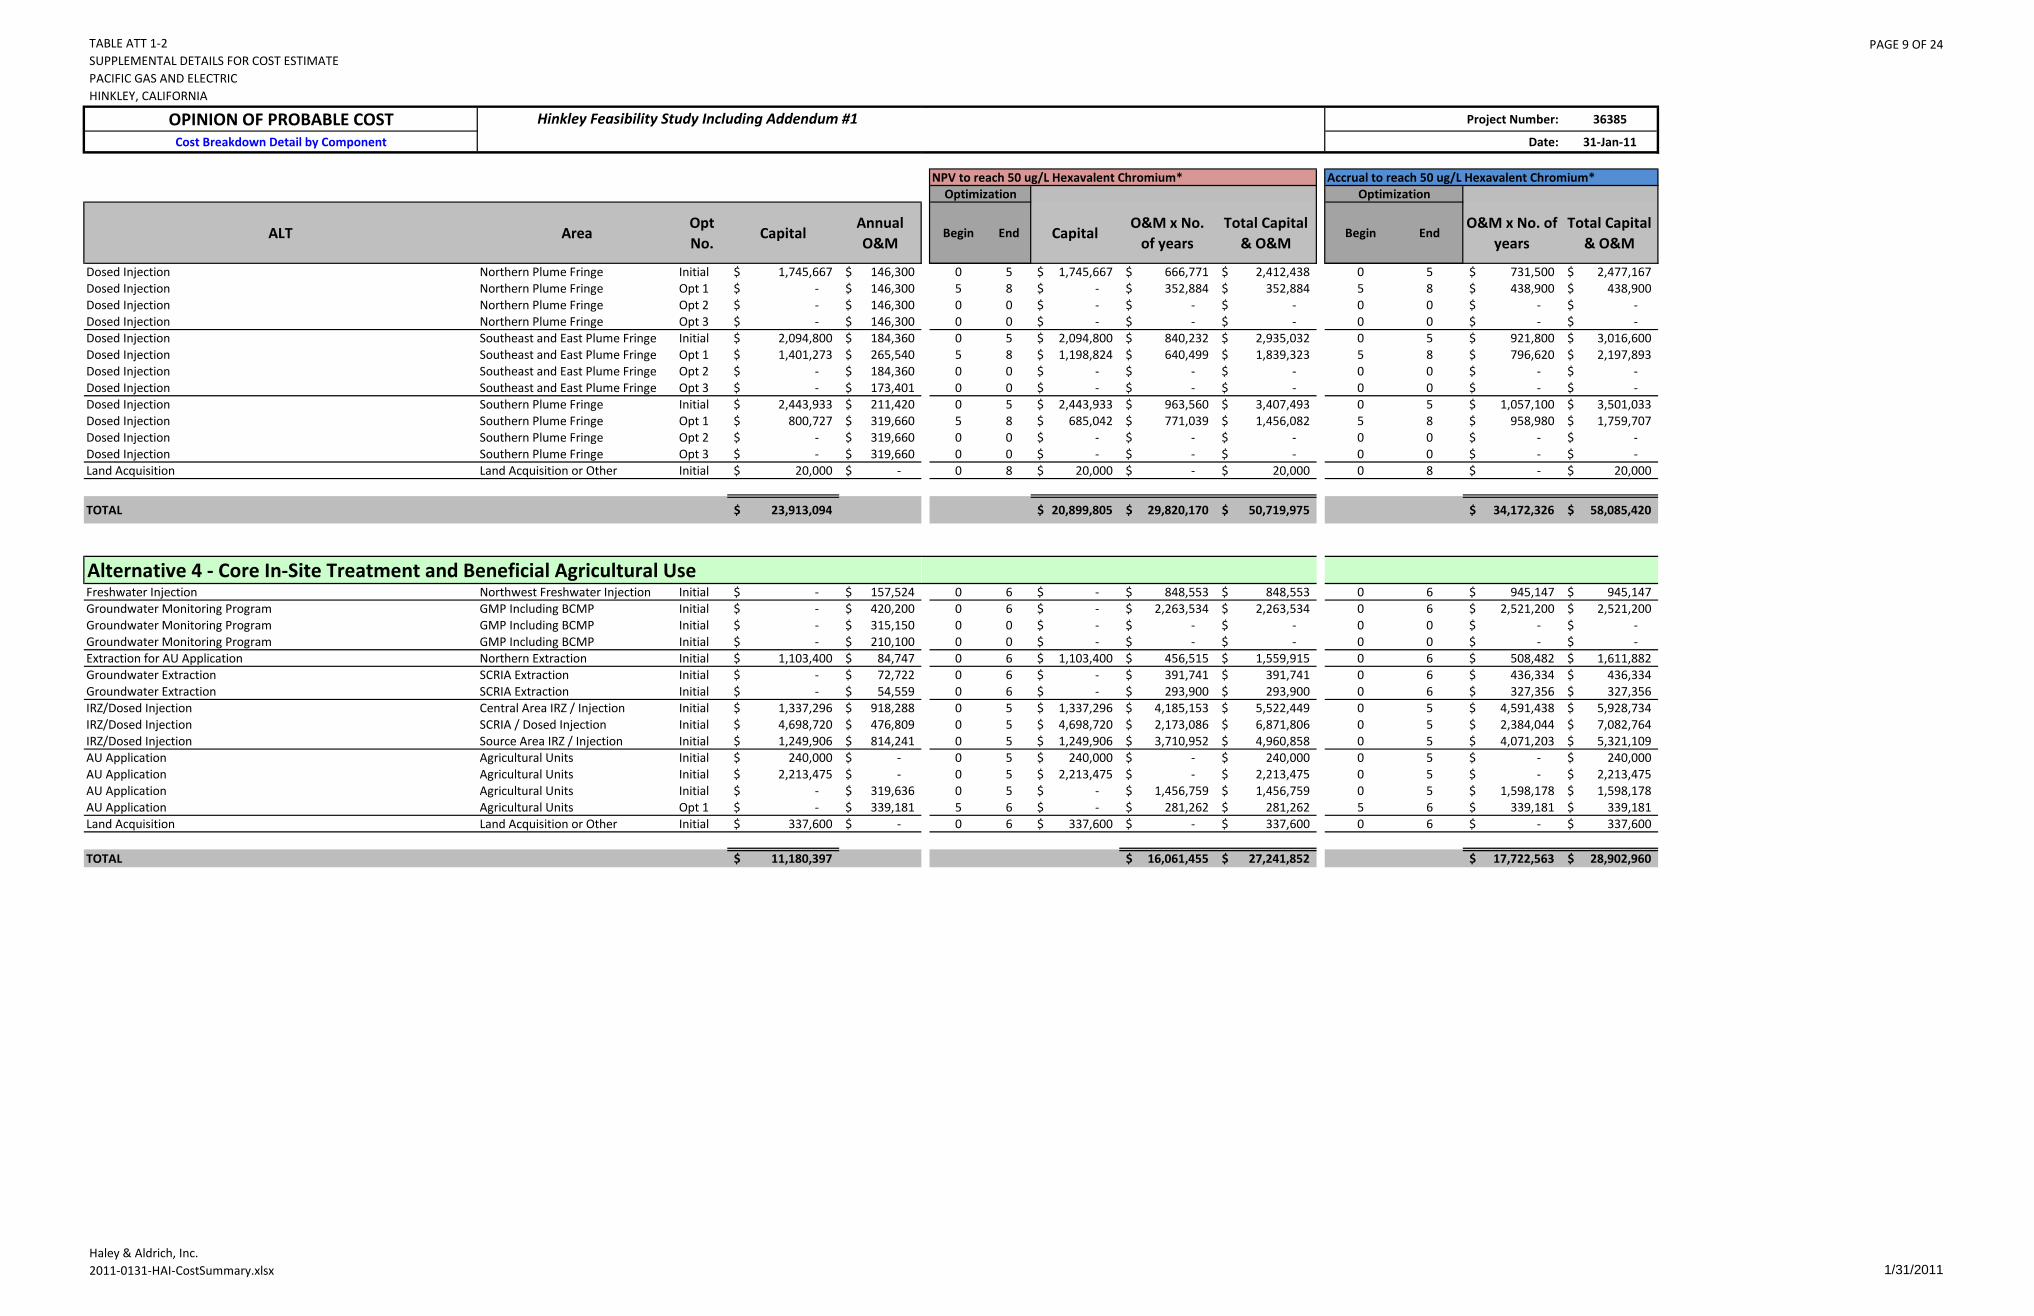
TABLE ATT 1-2SUPPLEMENTAL DETAILS FOR COST ESTIMATEPACIFIC GAS AND ELECTRICHINKLEY, CALIFORNIA
PAGE 9 OF 24
Haley & Aldrich, Inc.2011-0131-HAI-CostSummary.xlsx 1/31/2011
OPINION OF PROBABLE COSTCost Breakdown Detail by Component
ALT AreaOpt No.
CapitalAnnual O&M
Hinkley Feasibility Study Including Addendum #1
Dosed Injection Northern Plume Fringe Initial 1,745,667$ 146,300$ Dosed Injection Northern Plume Fringe Opt 1 -$ 146,300$ Dosed Injection Northern Plume Fringe Opt 2 -$ 146,300$ Dosed Injection Northern Plume Fringe Opt 3 -$ 146,300$ Dosed Injection Southeast and East Plume Fringe Initial 2,094,800$ 184,360$ Dosed Injection Southeast and East Plume Fringe Opt 1 1,401,273$ 265,540$ Dosed Injection Southeast and East Plume Fringe Opt 2 -$ 184,360$ Dosed Injection Southeast and East Plume Fringe Opt 3 -$ 173,401$ Dosed Injection Southern Plume Fringe Initial 2,443,933$ 211,420$ Dosed Injection Southern Plume Fringe Opt 1 800,727$ 319,660$ Dosed Injection Southern Plume Fringe Opt 2 -$ 319,660$ Dosed Injection Southern Plume Fringe Opt 3 -$ 319,660$ Land Acquisition Land Acquisition or Other Initial 20,000$ -$
TOTAL 23,913,094$
Alternative 4 - Core In-Site Treatment and Beneficial Agricultural UseFreshwater Injection Northwest Freshwater Injection Initial -$ 157,524$ Groundwater Monitoring Program GMP Including BCMP Initial -$ 420,200$ Groundwater Monitoring Program GMP Including BCMP Initial -$ 315,150$ Groundwater Monitoring Program GMP Including BCMP Initial -$ 210,100$ Extraction for AU Application Northern Extraction Initial 1,103,400$ 84,747$ Groundwater Extraction SCRIA Extraction Initial -$ 72,722$ Groundwater Extraction SCRIA Extraction Initial -$ 54,559$ IRZ/Dosed Injection Central Area IRZ / Injection Initial 1,337,296$ 918,288$ IRZ/Dosed Injection SCRIA / Dosed Injection Initial 4,698,720$ 476,809$ IRZ/Dosed Injection Source Area IRZ / Injection Initial 1,249,906$ 814,241$ AU Application Agricultural Units Initial 240,000$ -$ AU Application Agricultural Units Initial 2,213,475$ -$ AU Application Agricultural Units Initial -$ 319,636$ AU Application Agricultural Units Opt 1 -$ 339,181$ Land Acquisition Land Acquisition or Other Initial 337,600$ -$
TOTAL 11,180,397$
Project Number: 36385
Date: 31-Jan-11
NPV to reach 50 ug/L Hexavalent Chromium* Accrual to reach 50 ug/L Hexavalent Chromium*Optimization Optimization
Begin End CapitalO&M x No.
of yearsTotal Capital
& O&MBegin End
O&M x No. of years
Total Capital & O&M
0 5 1,745,667$ 666,771$ 2,412,438$ 0 5 731,500$ 2,477,167$ 5 8 -$ 352,884$ 352,884$ 5 8 438,900$ 438,900$ 0 0 -$ -$ -$ 0 0 -$ -$ 0 0 -$ -$ -$ 0 0 -$ -$ 0 5 2,094,800$ 840,232$ 2,935,032$ 0 5 921,800$ 3,016,600$ 5 8 1,198,824$ 640,499$ 1,839,323$ 5 8 796,620$ 2,197,893$ 0 0 -$ -$ -$ 0 0 -$ -$ 0 0 -$ -$ -$ 0 0 -$ -$ 0 5 2,443,933$ 963,560$ 3,407,493$ 0 5 1,057,100$ 3,501,033$ 5 8 685,042$ 771,039$ 1,456,082$ 5 8 958,980$ 1,759,707$ 0 0 -$ -$ -$ 0 0 -$ -$ 0 0 -$ -$ -$ 0 0 -$ -$ 0 8 20,000$ -$ 20,000$ 0 8 -$ 20,000$
20,899,805$ 29,820,170$ 50,719,975$ 34,172,326$ 58,085,420$
0 6 -$ 848,553$ 848,553$ 0 6 945,147$ 945,147$ 0 6 -$ 2,263,534$ 2,263,534$ 0 6 2,521,200$ 2,521,200$ 0 0 -$ -$ -$ 0 0 -$ -$ 0 0 -$ -$ -$ 0 0 -$ -$ 0 6 1,103,400$ 456,515$ 1,559,915$ 0 6 508,482$ 1,611,882$ 0 6 -$ 391,741$ 391,741$ 0 6 436,334$ 436,334$ 0 6 -$ 293,900$ 293,900$ 0 6 327,356$ 327,356$ 0 5 1,337,296$ 4,185,153$ 5,522,449$ 0 5 4,591,438$ 5,928,734$ 0 5 4,698,720$ 2,173,086$ 6,871,806$ 0 5 2,384,044$ 7,082,764$ 0 5 1,249,906$ 3,710,952$ 4,960,858$ 0 5 4,071,203$ 5,321,109$ 0 5 240,000$ -$ 240,000$ 0 5 -$ 240,000$ 0 5 2,213,475$ -$ 2,213,475$ 0 5 -$ 2,213,475$ 0 5 -$ 1,456,759$ 1,456,759$ 0 5 1,598,178$ 1,598,178$ 5 6 -$ 281,262$ 281,262$ 5 6 339,181$ 339,181$ 0 6 337,600$ -$ 337,600$ 0 6 -$ 337,600$
16,061,455$ 27,241,852$ 17,722,563$ 28,902,960$
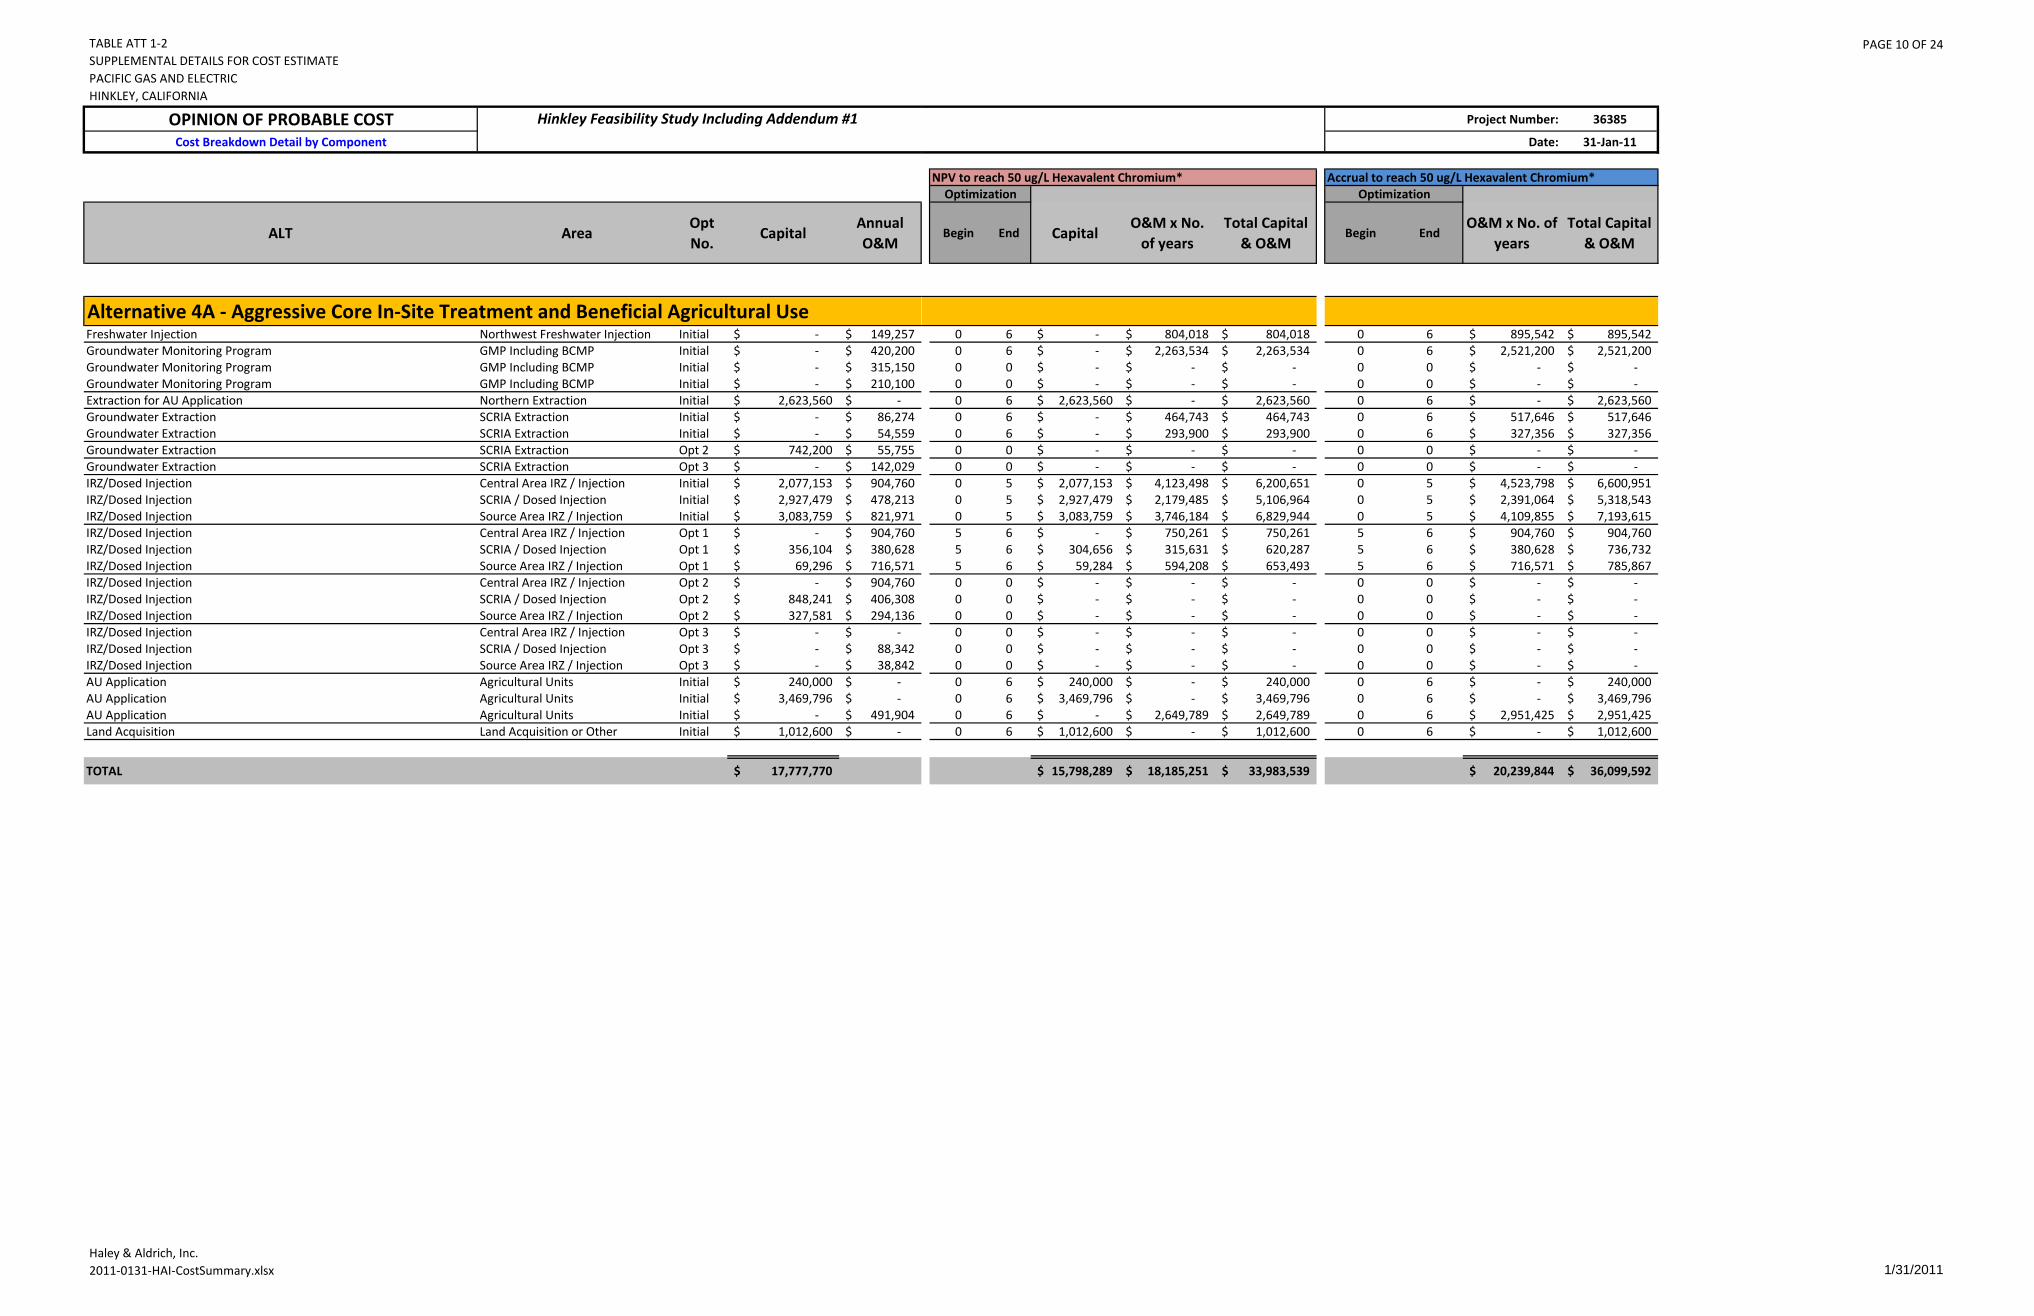
TABLE ATT 1-2SUPPLEMENTAL DETAILS FOR COST ESTIMATEPACIFIC GAS AND ELECTRICHINKLEY, CALIFORNIA
PAGE 10 OF 24
Haley & Aldrich, Inc.2011-0131-HAI-CostSummary.xlsx 1/31/2011
OPINION OF PROBABLE COSTCost Breakdown Detail by Component
ALT AreaOpt No.
CapitalAnnual O&M
Hinkley Feasibility Study Including Addendum #1
Alternative 4A - Aggressive Core In-Site Treatment and Beneficial Agricultural UseFreshwater Injection Northwest Freshwater Injection Initial -$ 149,257$ Groundwater Monitoring Program GMP Including BCMP Initial -$ 420,200$ Groundwater Monitoring Program GMP Including BCMP Initial -$ 315,150$ Groundwater Monitoring Program GMP Including BCMP Initial -$ 210,100$ Extraction for AU Application Northern Extraction Initial 2,623,560$ -$ Groundwater Extraction SCRIA Extraction Initial -$ 86,274$ Groundwater Extraction SCRIA Extraction Initial -$ 54,559$ Groundwater Extraction SCRIA Extraction Opt 2 742,200$ 55,755$ Groundwater Extraction SCRIA Extraction Opt 3 -$ 142,029$ IRZ/Dosed Injection Central Area IRZ / Injection Initial 2,077,153$ 904,760$ IRZ/Dosed Injection SCRIA / Dosed Injection Initial 2,927,479$ 478,213$ IRZ/Dosed Injection Source Area IRZ / Injection Initial 3,083,759$ 821,971$ IRZ/Dosed Injection Central Area IRZ / Injection Opt 1 -$ 904,760$ IRZ/Dosed Injection SCRIA / Dosed Injection Opt 1 356,104$ 380,628$ IRZ/Dosed Injection Source Area IRZ / Injection Opt 1 69,296$ 716,571$ IRZ/Dosed Injection Central Area IRZ / Injection Opt 2 -$ 904,760$ IRZ/Dosed Injection SCRIA / Dosed Injection Opt 2 848,241$ 406,308$ IRZ/Dosed Injection Source Area IRZ / Injection Opt 2 327,581$ 294,136$ IRZ/Dosed Injection Central Area IRZ / Injection Opt 3 -$ -$ IRZ/Dosed Injection SCRIA / Dosed Injection Opt 3 -$ 88,342$ IRZ/Dosed Injection Source Area IRZ / Injection Opt 3 -$ 38,842$ AU Application Agricultural Units Initial 240,000$ -$ AU Application Agricultural Units Initial 3,469,796$ -$ AU Application Agricultural Units Initial -$ 491,904$ Land Acquisition Land Acquisition or Other Initial 1,012,600$ -$
TOTAL 17,777,770$
Project Number: 36385
Date: 31-Jan-11
NPV to reach 50 ug/L Hexavalent Chromium* Accrual to reach 50 ug/L Hexavalent Chromium*Optimization Optimization
Begin End CapitalO&M x No.
of yearsTotal Capital
& O&MBegin End
O&M x No. of years
Total Capital & O&M
0 6 -$ 804,018$ 804,018$ 0 6 895,542$ 895,542$ 0 6 -$ 2,263,534$ 2,263,534$ 0 6 2,521,200$ 2,521,200$ 0 0 -$ -$ -$ 0 0 -$ -$ 0 0 -$ -$ -$ 0 0 -$ -$ 0 6 2,623,560$ -$ 2,623,560$ 0 6 -$ 2,623,560$ 0 6 -$ 464,743$ 464,743$ 0 6 517,646$ 517,646$ 0 6 -$ 293,900$ 293,900$ 0 6 327,356$ 327,356$ 0 0 -$ -$ -$ 0 0 -$ -$ 0 0 -$ -$ -$ 0 0 -$ -$ 0 5 2,077,153$ 4,123,498$ 6,200,651$ 0 5 4,523,798$ 6,600,951$ 0 5 2,927,479$ 2,179,485$ 5,106,964$ 0 5 2,391,064$ 5,318,543$ 0 5 3,083,759$ 3,746,184$ 6,829,944$ 0 5 4,109,855$ 7,193,615$ 5 6 -$ 750,261$ 750,261$ 5 6 904,760$ 904,760$ 5 6 304,656$ 315,631$ 620,287$ 5 6 380,628$ 736,732$ 5 6 59,284$ 594,208$ 653,493$ 5 6 716,571$ 785,867$ 0 0 -$ -$ -$ 0 0 -$ -$ 0 0 -$ -$ -$ 0 0 -$ -$ 0 0 -$ -$ -$ 0 0 -$ -$ 0 0 -$ -$ -$ 0 0 -$ -$ 0 0 -$ -$ -$ 0 0 -$ -$ 0 0 -$ -$ -$ 0 0 -$ -$ 0 6 240,000$ -$ 240,000$ 0 6 -$ 240,000$ 0 6 3,469,796$ -$ 3,469,796$ 0 6 -$ 3,469,796$ 0 6 -$ 2,649,789$ 2,649,789$ 0 6 2,951,425$ 2,951,425$ 0 6 1,012,600$ -$ 1,012,600$ 0 6 -$ 1,012,600$
15,798,289$ 18,185,251$ 33,983,539$ 20,239,844$ 36,099,592$
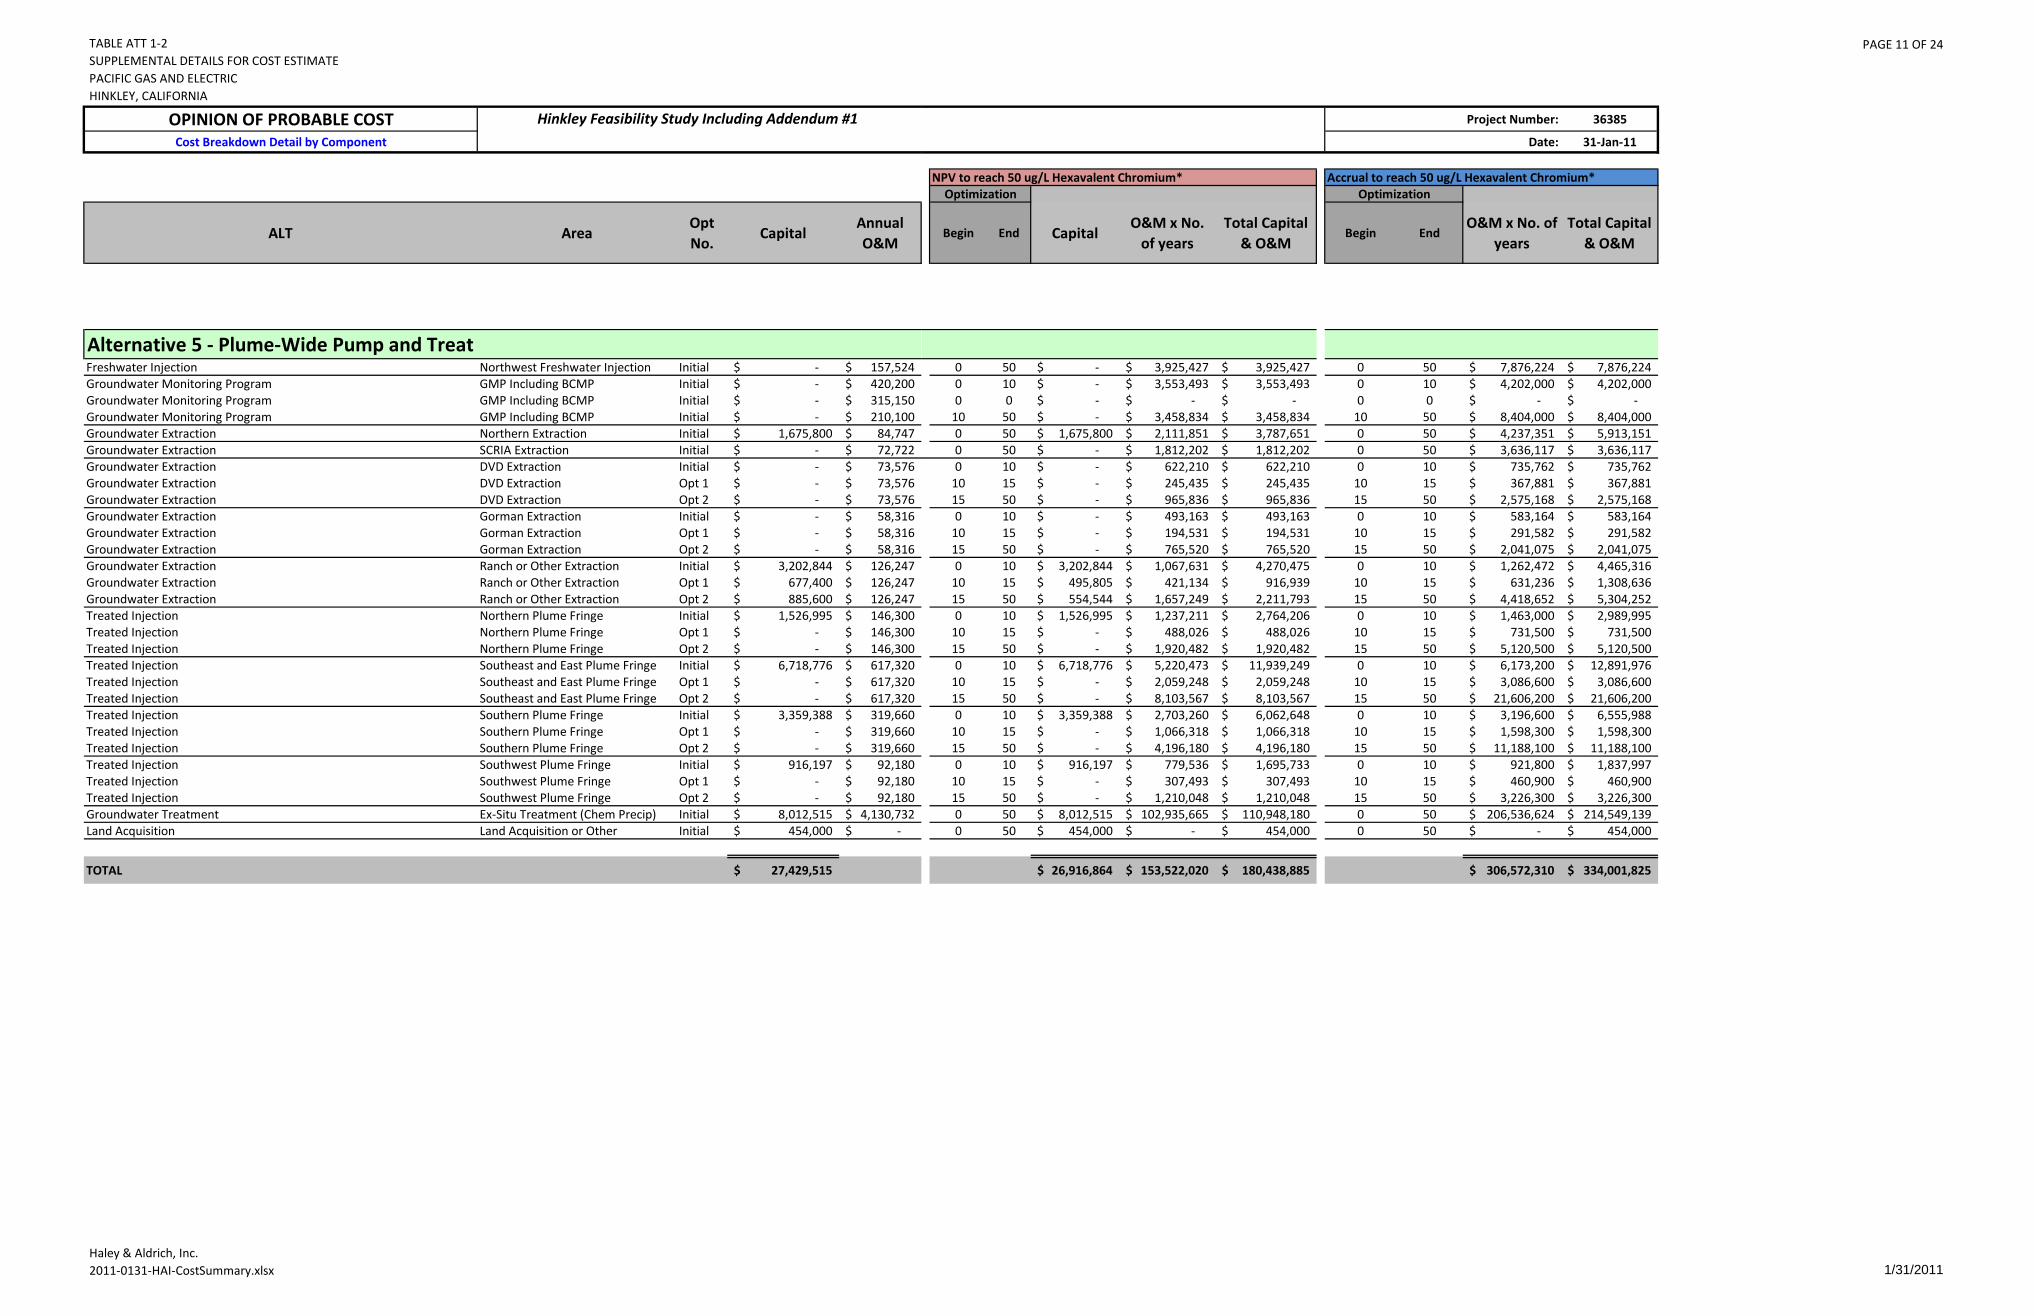
TABLE ATT 1-2SUPPLEMENTAL DETAILS FOR COST ESTIMATEPACIFIC GAS AND ELECTRICHINKLEY, CALIFORNIA
PAGE 11 OF 24
Haley & Aldrich, Inc.2011-0131-HAI-CostSummary.xlsx 1/31/2011
OPINION OF PROBABLE COSTCost Breakdown Detail by Component
ALT AreaOpt No.
CapitalAnnual O&M
Hinkley Feasibility Study Including Addendum #1
Alternative 5 - Plume-Wide Pump and TreatFreshwater Injection Northwest Freshwater Injection Initial -$ 157,524$ Groundwater Monitoring Program GMP Including BCMP Initial -$ 420,200$ Groundwater Monitoring Program GMP Including BCMP Initial -$ 315,150$ Groundwater Monitoring Program GMP Including BCMP Initial -$ 210,100$ Groundwater Extraction Northern Extraction Initial 1,675,800$ 84,747$ Groundwater Extraction SCRIA Extraction Initial -$ 72,722$ Groundwater Extraction DVD Extraction Initial -$ 73,576$ Groundwater Extraction DVD Extraction Opt 1 -$ 73,576$ Groundwater Extraction DVD Extraction Opt 2 -$ 73,576$ Groundwater Extraction Gorman Extraction Initial -$ 58,316$ Groundwater Extraction Gorman Extraction Opt 1 -$ 58,316$ Groundwater Extraction Gorman Extraction Opt 2 -$ 58,316$ Groundwater Extraction Ranch or Other Extraction Initial 3,202,844$ 126,247$ Groundwater Extraction Ranch or Other Extraction Opt 1 677,400$ 126,247$ Groundwater Extraction Ranch or Other Extraction Opt 2 885,600$ 126,247$ Treated Injection Northern Plume Fringe Initial 1,526,995$ 146,300$ Treated Injection Northern Plume Fringe Opt 1 -$ 146,300$ Treated Injection Northern Plume Fringe Opt 2 -$ 146,300$ Treated Injection Southeast and East Plume Fringe Initial 6,718,776$ 617,320$ Treated Injection Southeast and East Plume Fringe Opt 1 -$ 617,320$ Treated Injection Southeast and East Plume Fringe Opt 2 -$ 617,320$ Treated Injection Southern Plume Fringe Initial 3,359,388$ 319,660$ Treated Injection Southern Plume Fringe Opt 1 -$ 319,660$ Treated Injection Southern Plume Fringe Opt 2 -$ 319,660$ Treated Injection Southwest Plume Fringe Initial 916,197$ 92,180$ Treated Injection Southwest Plume Fringe Opt 1 -$ 92,180$ Treated Injection Southwest Plume Fringe Opt 2 -$ 92,180$ Groundwater Treatment Ex-Situ Treatment (Chem Precip) Initial 8,012,515$ 4,130,732$ Land Acquisition Land Acquisition or Other Initial 454,000$ -$
TOTAL 27,429,515$
Project Number: 36385
Date: 31-Jan-11
NPV to reach 50 ug/L Hexavalent Chromium* Accrual to reach 50 ug/L Hexavalent Chromium*Optimization Optimization
Begin End CapitalO&M x No.
of yearsTotal Capital
& O&MBegin End
O&M x No. of years
Total Capital & O&M
0 50 -$ 3,925,427$ 3,925,427$ 0 50 7,876,224$ 7,876,224$ 0 10 -$ 3,553,493$ 3,553,493$ 0 10 4,202,000$ 4,202,000$ 0 0 -$ -$ -$ 0 0 -$ -$
10 50 -$ 3,458,834$ 3,458,834$ 10 50 8,404,000$ 8,404,000$ 0 50 1,675,800$ 2,111,851$ 3,787,651$ 0 50 4,237,351$ 5,913,151$ 0 50 -$ 1,812,202$ 1,812,202$ 0 50 3,636,117$ 3,636,117$ 0 10 -$ 622,210$ 622,210$ 0 10 735,762$ 735,762$
10 15 -$ 245,435$ 245,435$ 10 15 367,881$ 367,881$ 15 50 -$ 965,836$ 965,836$ 15 50 2,575,168$ 2,575,168$ 0 10 -$ 493,163$ 493,163$ 0 10 583,164$ 583,164$
10 15 -$ 194,531$ 194,531$ 10 15 291,582$ 291,582$ 15 50 -$ 765,520$ 765,520$ 15 50 2,041,075$ 2,041,075$ 0 10 3,202,844$ 1,067,631$ 4,270,475$ 0 10 1,262,472$ 4,465,316$
10 15 495,805$ 421,134$ 916,939$ 10 15 631,236$ 1,308,636$ 15 50 554,544$ 1,657,249$ 2,211,793$ 15 50 4,418,652$ 5,304,252$ 0 10 1,526,995$ 1,237,211$ 2,764,206$ 0 10 1,463,000$ 2,989,995$
10 15 -$ 488,026$ 488,026$ 10 15 731,500$ 731,500$ 15 50 -$ 1,920,482$ 1,920,482$ 15 50 5,120,500$ 5,120,500$ 0 10 6,718,776$ 5,220,473$ 11,939,249$ 0 10 6,173,200$ 12,891,976$
10 15 -$ 2,059,248$ 2,059,248$ 10 15 3,086,600$ 3,086,600$ 15 50 -$ 8,103,567$ 8,103,567$ 15 50 21,606,200$ 21,606,200$ 0 10 3,359,388$ 2,703,260$ 6,062,648$ 0 10 3,196,600$ 6,555,988$
10 15 -$ 1,066,318$ 1,066,318$ 10 15 1,598,300$ 1,598,300$ 15 50 -$ 4,196,180$ 4,196,180$ 15 50 11,188,100$ 11,188,100$ 0 10 916,197$ 779,536$ 1,695,733$ 0 10 921,800$ 1,837,997$
10 15 -$ 307,493$ 307,493$ 10 15 460,900$ 460,900$ 15 50 -$ 1,210,048$ 1,210,048$ 15 50 3,226,300$ 3,226,300$ 0 50 8,012,515$ 102,935,665$ 110,948,180$ 0 50 206,536,624$ 214,549,139$ 0 50 454,000$ -$ 454,000$ 0 50 -$ 454,000$
26,916,864$ 153,522,020$ 180,438,885$ 306,572,310$ 334,001,825$
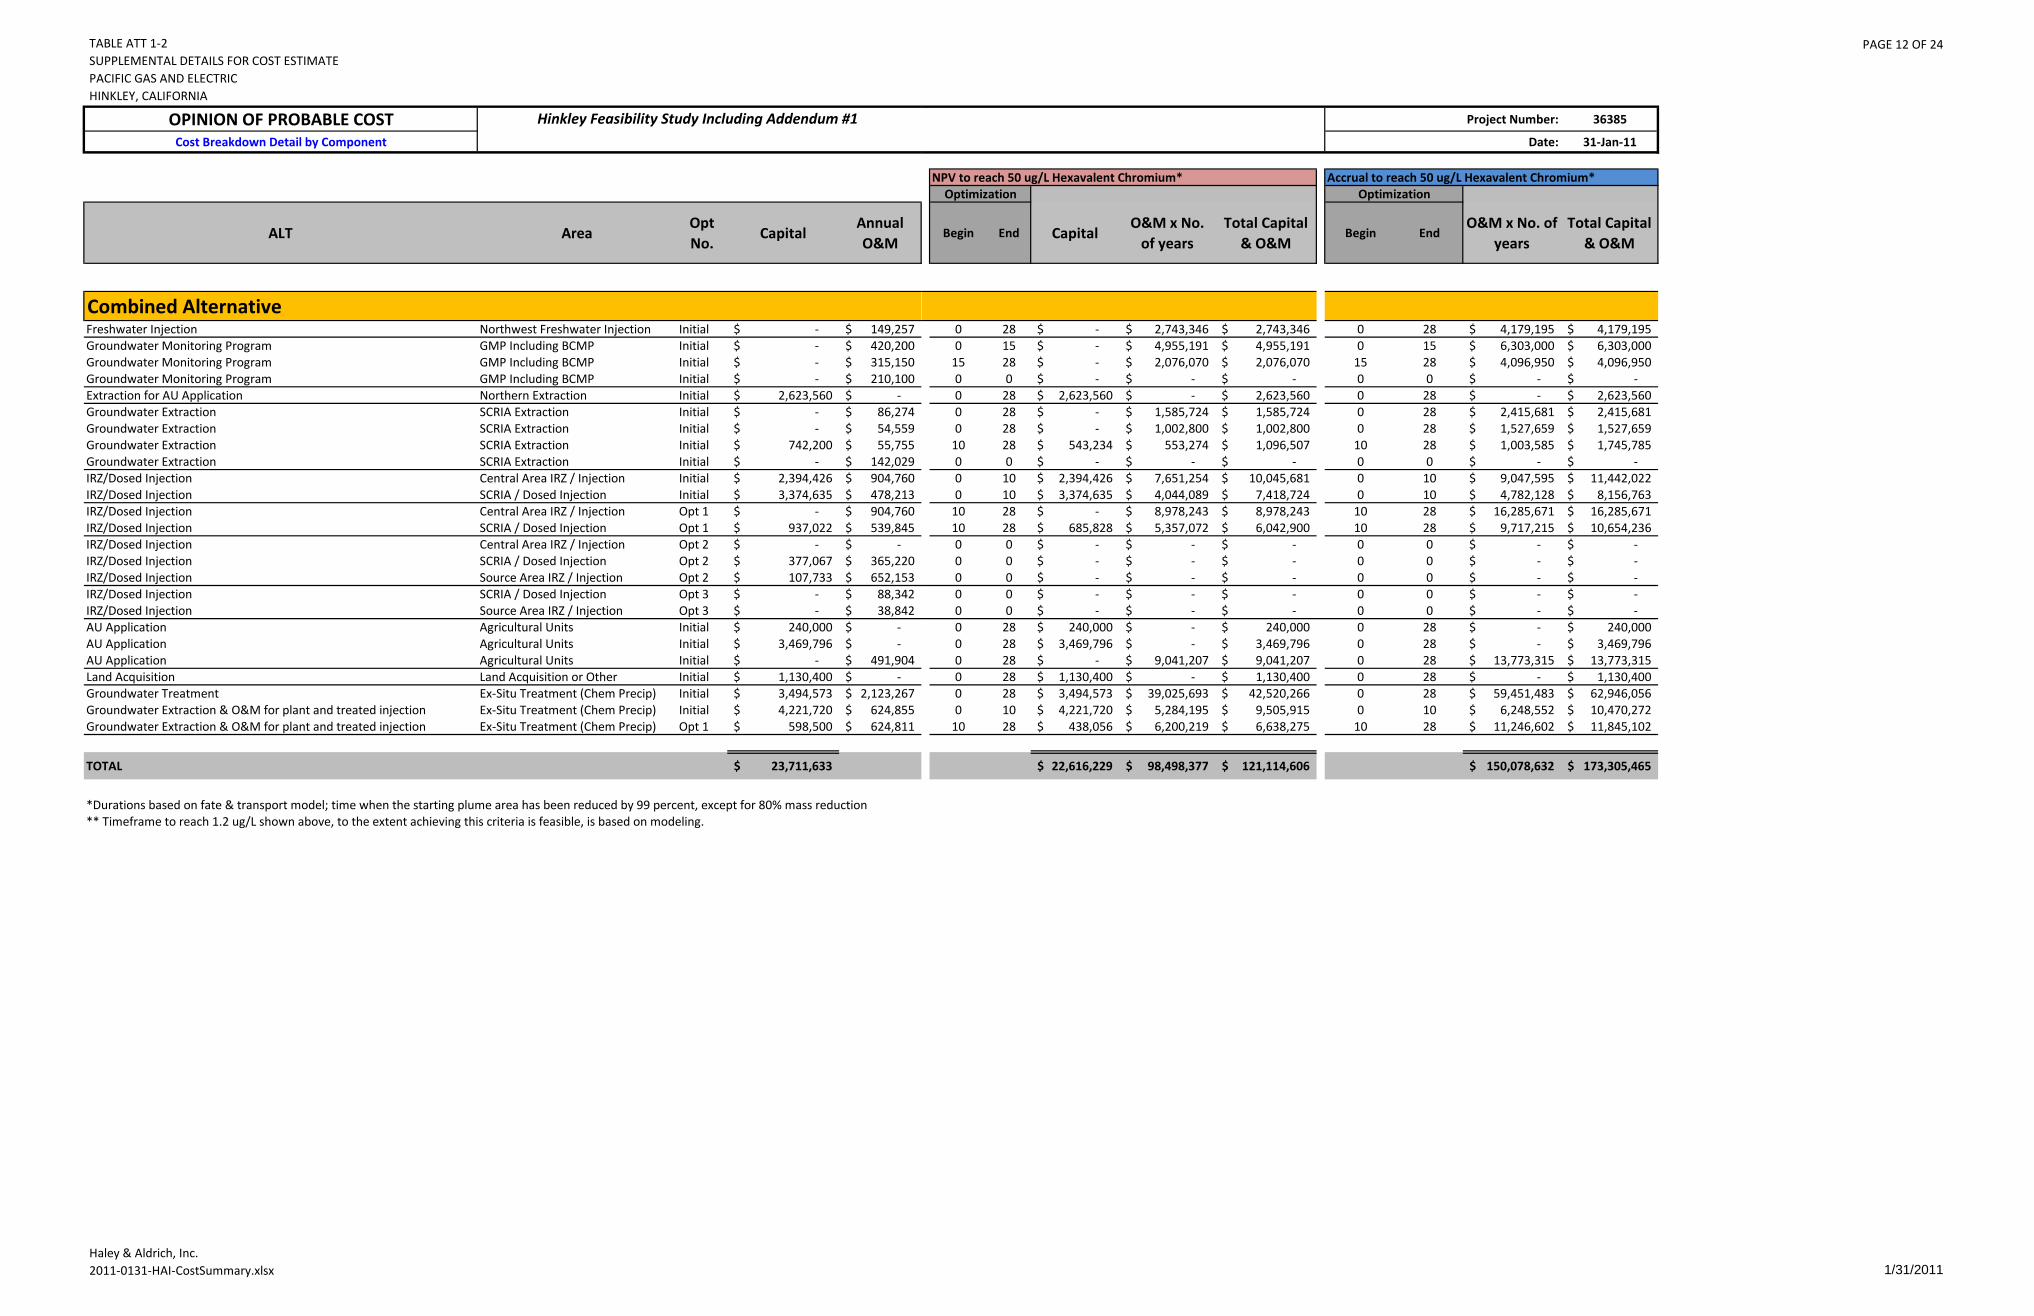
TABLE ATT 1-2SUPPLEMENTAL DETAILS FOR COST ESTIMATEPACIFIC GAS AND ELECTRICHINKLEY, CALIFORNIA
PAGE 12 OF 24
Haley & Aldrich, Inc.2011-0131-HAI-CostSummary.xlsx 1/31/2011
OPINION OF PROBABLE COSTCost Breakdown Detail by Component
ALT AreaOpt No.
CapitalAnnual O&M
Hinkley Feasibility Study Including Addendum #1
Combined AlternativeFreshwater Injection Northwest Freshwater Injection Initial -$ 149,257$ Groundwater Monitoring Program GMP Including BCMP Initial -$ 420,200$ Groundwater Monitoring Program GMP Including BCMP Initial -$ 315,150$ Groundwater Monitoring Program GMP Including BCMP Initial -$ 210,100$ Extraction for AU Application Northern Extraction Initial 2,623,560$ -$ Groundwater Extraction SCRIA Extraction Initial -$ 86,274$ Groundwater Extraction SCRIA Extraction Initial -$ 54,559$ Groundwater Extraction SCRIA Extraction Initial 742,200$ 55,755$ Groundwater Extraction SCRIA Extraction Initial -$ 142,029$ IRZ/Dosed Injection Central Area IRZ / Injection Initial 2,394,426$ 904,760$ IRZ/Dosed Injection SCRIA / Dosed Injection Initial 3,374,635$ 478,213$ IRZ/Dosed Injection Central Area IRZ / Injection Opt 1 -$ 904,760$ IRZ/Dosed Injection SCRIA / Dosed Injection Opt 1 937,022$ 539,845$ IRZ/Dosed Injection Central Area IRZ / Injection Opt 2 -$ -$ IRZ/Dosed Injection SCRIA / Dosed Injection Opt 2 377,067$ 365,220$ IRZ/Dosed Injection Source Area IRZ / Injection Opt 2 107,733$ 652,153$ IRZ/Dosed Injection SCRIA / Dosed Injection Opt 3 -$ 88,342$ IRZ/Dosed Injection Source Area IRZ / Injection Opt 3 -$ 38,842$ AU Application Agricultural Units Initial 240,000$ -$ AU Application Agricultural Units Initial 3,469,796$ -$ AU Application Agricultural Units Initial -$ 491,904$ Land Acquisition Land Acquisition or Other Initial 1,130,400$ -$ Groundwater Treatment Ex-Situ Treatment (Chem Precip) Initial 3,494,573$ 2,123,267$ Groundwater Extraction & O&M for plant and treated injection Ex-Situ Treatment (Chem Precip) Initial 4,221,720$ 624,855$ Groundwater Extraction & O&M for plant and treated injection Ex-Situ Treatment (Chem Precip) Opt 1 598,500$ 624,811$
TOTAL 23,711,633$
** Timeframe to reach 1.2 ug/L shown above, to the extent achieving this criteria is feasible, is based on modeling.*Durations based on fate & transport model; time when the starting plume area has been reduced by 99 percent, except for 80% mass reduction
Project Number: 36385
Date: 31-Jan-11
NPV to reach 50 ug/L Hexavalent Chromium* Accrual to reach 50 ug/L Hexavalent Chromium*Optimization Optimization
Begin End CapitalO&M x No.
of yearsTotal Capital
& O&MBegin End
O&M x No. of years
Total Capital & O&M
0 28 -$ 2,743,346$ 2,743,346$ 0 28 4,179,195$ 4,179,195$ 0 15 -$ 4,955,191$ 4,955,191$ 0 15 6,303,000$ 6,303,000$
15 28 -$ 2,076,070$ 2,076,070$ 15 28 4,096,950$ 4,096,950$ 0 0 -$ -$ -$ 0 0 -$ -$ 0 28 2,623,560$ -$ 2,623,560$ 0 28 -$ 2,623,560$ 0 28 -$ 1,585,724$ 1,585,724$ 0 28 2,415,681$ 2,415,681$ 0 28 -$ 1,002,800$ 1,002,800$ 0 28 1,527,659$ 1,527,659$
10 28 543,234$ 553,274$ 1,096,507$ 10 28 1,003,585$ 1,745,785$ 0 0 -$ -$ -$ 0 0 -$ -$ 0 10 2,394,426$ 7,651,254$ 10,045,681$ 0 10 9,047,595$ 11,442,022$ 0 10 3,374,635$ 4,044,089$ 7,418,724$ 0 10 4,782,128$ 8,156,763$
10 28 -$ 8,978,243$ 8,978,243$ 10 28 16,285,671$ 16,285,671$ 10 28 685,828$ 5,357,072$ 6,042,900$ 10 28 9,717,215$ 10,654,236$ 0 0 -$ -$ -$ 0 0 -$ -$ 0 0 -$ -$ -$ 0 0 -$ -$ 0 0 -$ -$ -$ 0 0 -$ -$ 0 0 -$ -$ -$ 0 0 -$ -$ 0 0 -$ -$ -$ 0 0 -$ -$ 0 28 240,000$ -$ 240,000$ 0 28 -$ 240,000$ 0 28 3,469,796$ -$ 3,469,796$ 0 28 -$ 3,469,796$ 0 28 -$ 9,041,207$ 9,041,207$ 0 28 13,773,315$ 13,773,315$ 0 28 1,130,400$ -$ 1,130,400$ 0 28 -$ 1,130,400$ 0 28 3,494,573$ 39,025,693$ 42,520,266$ 0 28 59,451,483$ 62,946,056$ 0 10 4,221,720$ 5,284,195$ 9,505,915$ 0 10 6,248,552$ 10,470,272$
10 28 438,056$ 6,200,219$ 6,638,275$ 10 28 11,246,602$ 11,845,102$
22,616,229$ 98,498,377$ 121,114,606$ 150,078,632$ 173,305,465$
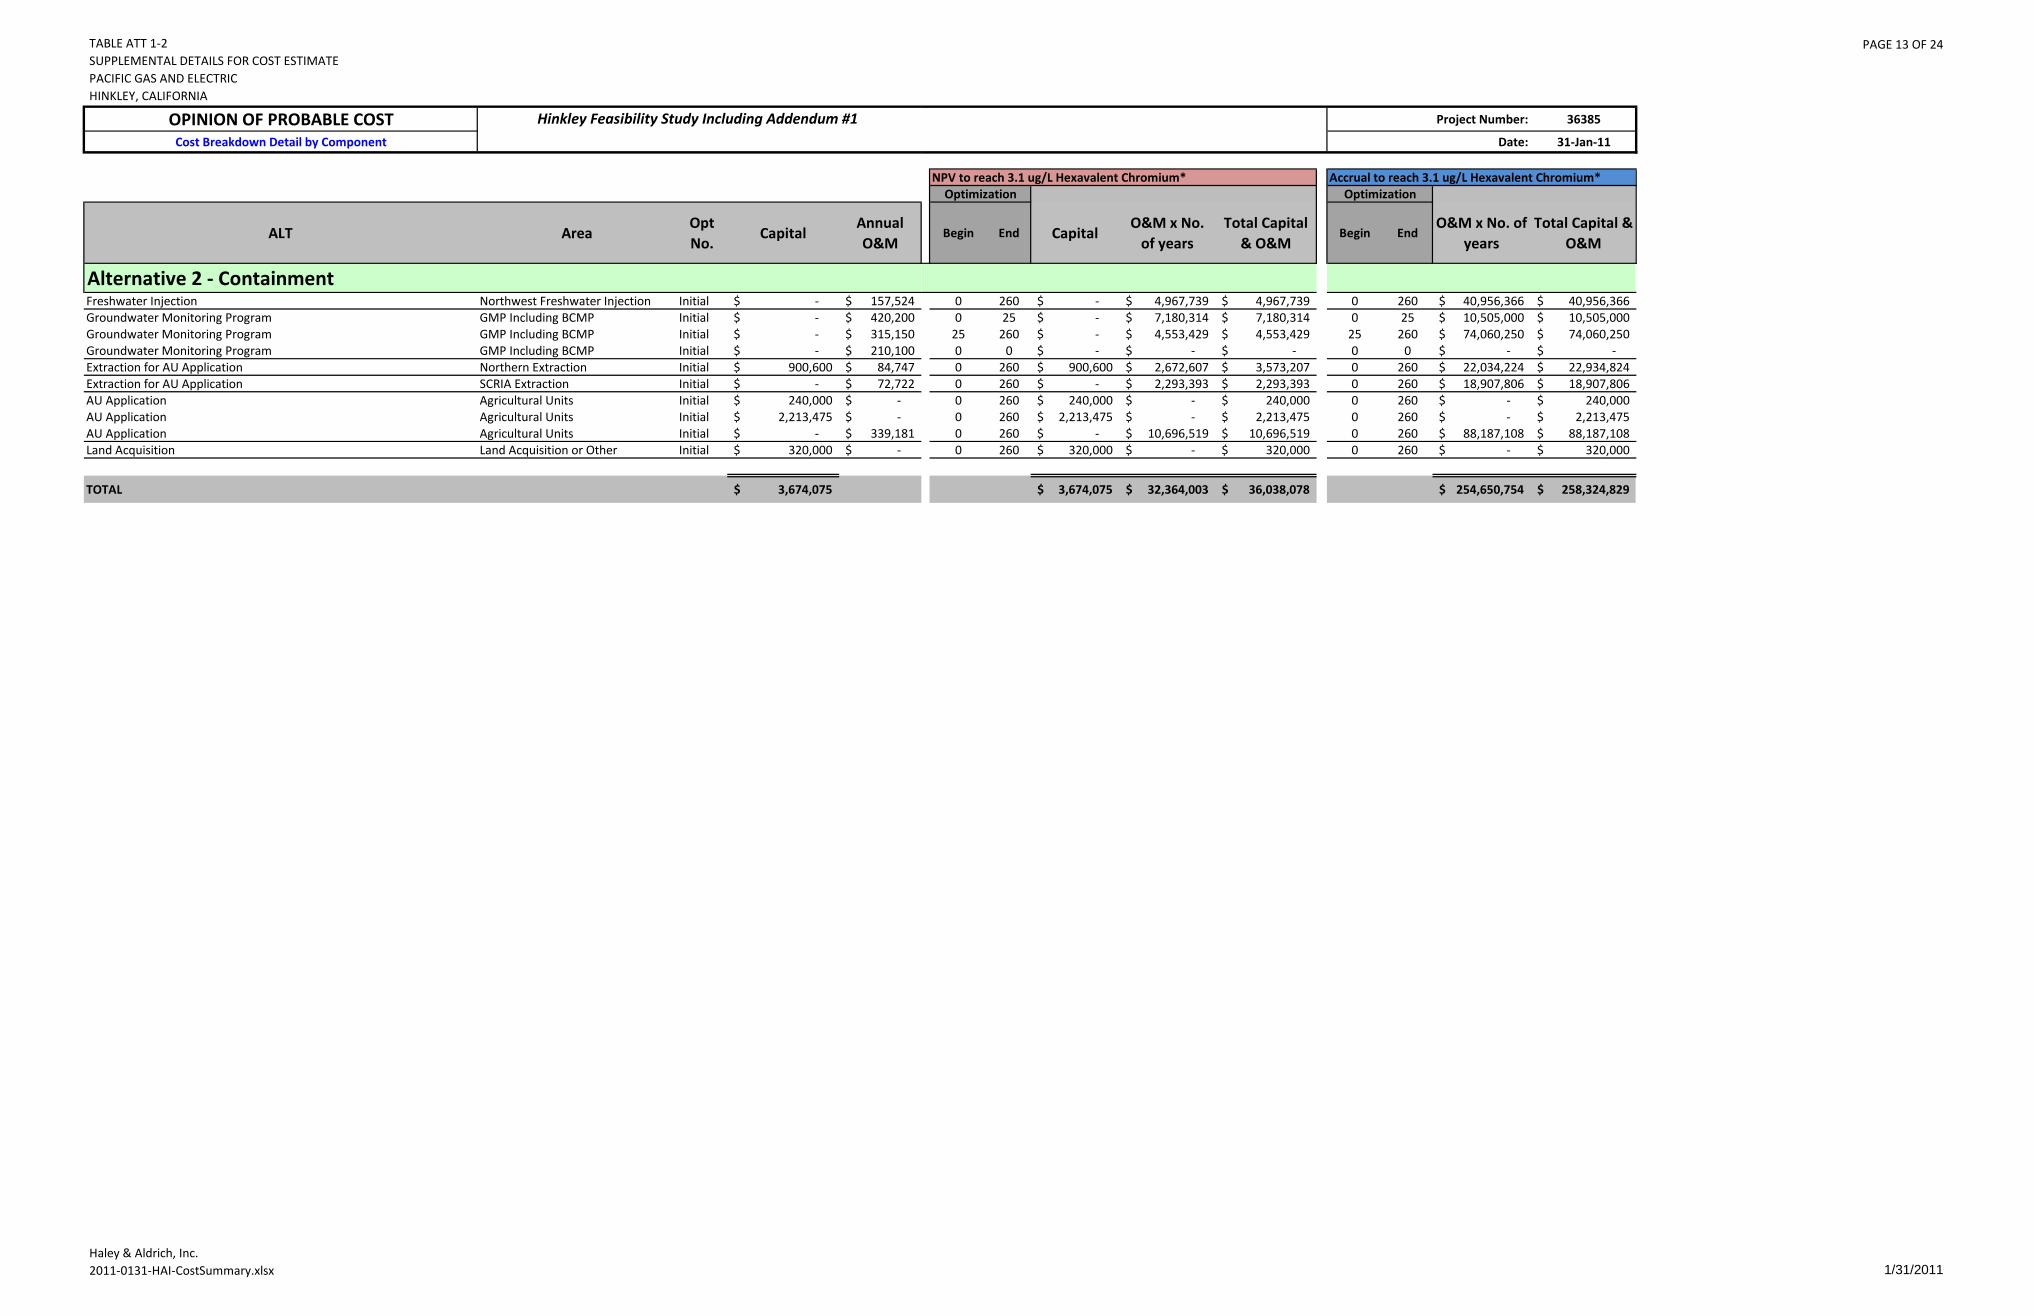
TABLE ATT 1-2SUPPLEMENTAL DETAILS FOR COST ESTIMATEPACIFIC GAS AND ELECTRICHINKLEY, CALIFORNIA
PAGE 13 OF 24
Haley & Aldrich, Inc.2011-0131-HAI-CostSummary.xlsx 1/31/2011
OPINION OF PROBABLE COSTCost Breakdown Detail by Component
ALT AreaOpt No.
CapitalAnnual O&M
Alternative 2 - ContainmentFreshwater Injection Northwest Freshwater Injection Initial -$ 157,524$ Groundwater Monitoring Program GMP Including BCMP Initial -$ 420,200$ Groundwater Monitoring Program GMP Including BCMP Initial -$ 315,150$ Groundwater Monitoring Program GMP Including BCMP Initial -$ 210,100$ Extraction for AU Application Northern Extraction Initial 900,600$ 84,747$ Extraction for AU Application SCRIA Extraction Initial -$ 72,722$ AU Application Agricultural Units Initial 240,000$ -$ AU Application Agricultural Units Initial 2,213,475$ -$ AU Application Agricultural Units Initial -$ 339,181$ Land Acquisition Land Acquisition or Other Initial 320,000$ -$
TOTAL 3,674,075$
Hinkley Feasibility Study Including Addendum #1 Project Number: 36385
Date: 31-Jan-11
NPV to reach 3.1 ug/L Hexavalent Chromium* Accrual to reach 3.1 ug/L Hexavalent Chromium*Optimization Optimization
Begin End CapitalO&M x No.
of yearsTotal Capital
& O&MBegin End
O&M x No. of years
Total Capital & O&M
0 260 -$ 4,967,739$ 4,967,739$ 0 260 40,956,366$ 40,956,366$ 0 25 -$ 7,180,314$ 7,180,314$ 0 25 10,505,000$ 10,505,000$
25 260 -$ 4,553,429$ 4,553,429$ 25 260 74,060,250$ 74,060,250$ 0 0 -$ -$ -$ 0 0 -$ -$ 0 260 900,600$ 2,672,607$ 3,573,207$ 0 260 22,034,224$ 22,934,824$ 0 260 -$ 2,293,393$ 2,293,393$ 0 260 18,907,806$ 18,907,806$ 0 260 240,000$ -$ 240,000$ 0 260 -$ 240,000$ 0 260 2,213,475$ -$ 2,213,475$ 0 260 -$ 2,213,475$ 0 260 -$ 10,696,519$ 10,696,519$ 0 260 88,187,108$ 88,187,108$ 0 260 320,000$ -$ 320,000$ 0 260 -$ 320,000$
3,674,075$ 32,364,003$ 36,038,078$ 254,650,754$ 258,324,829$
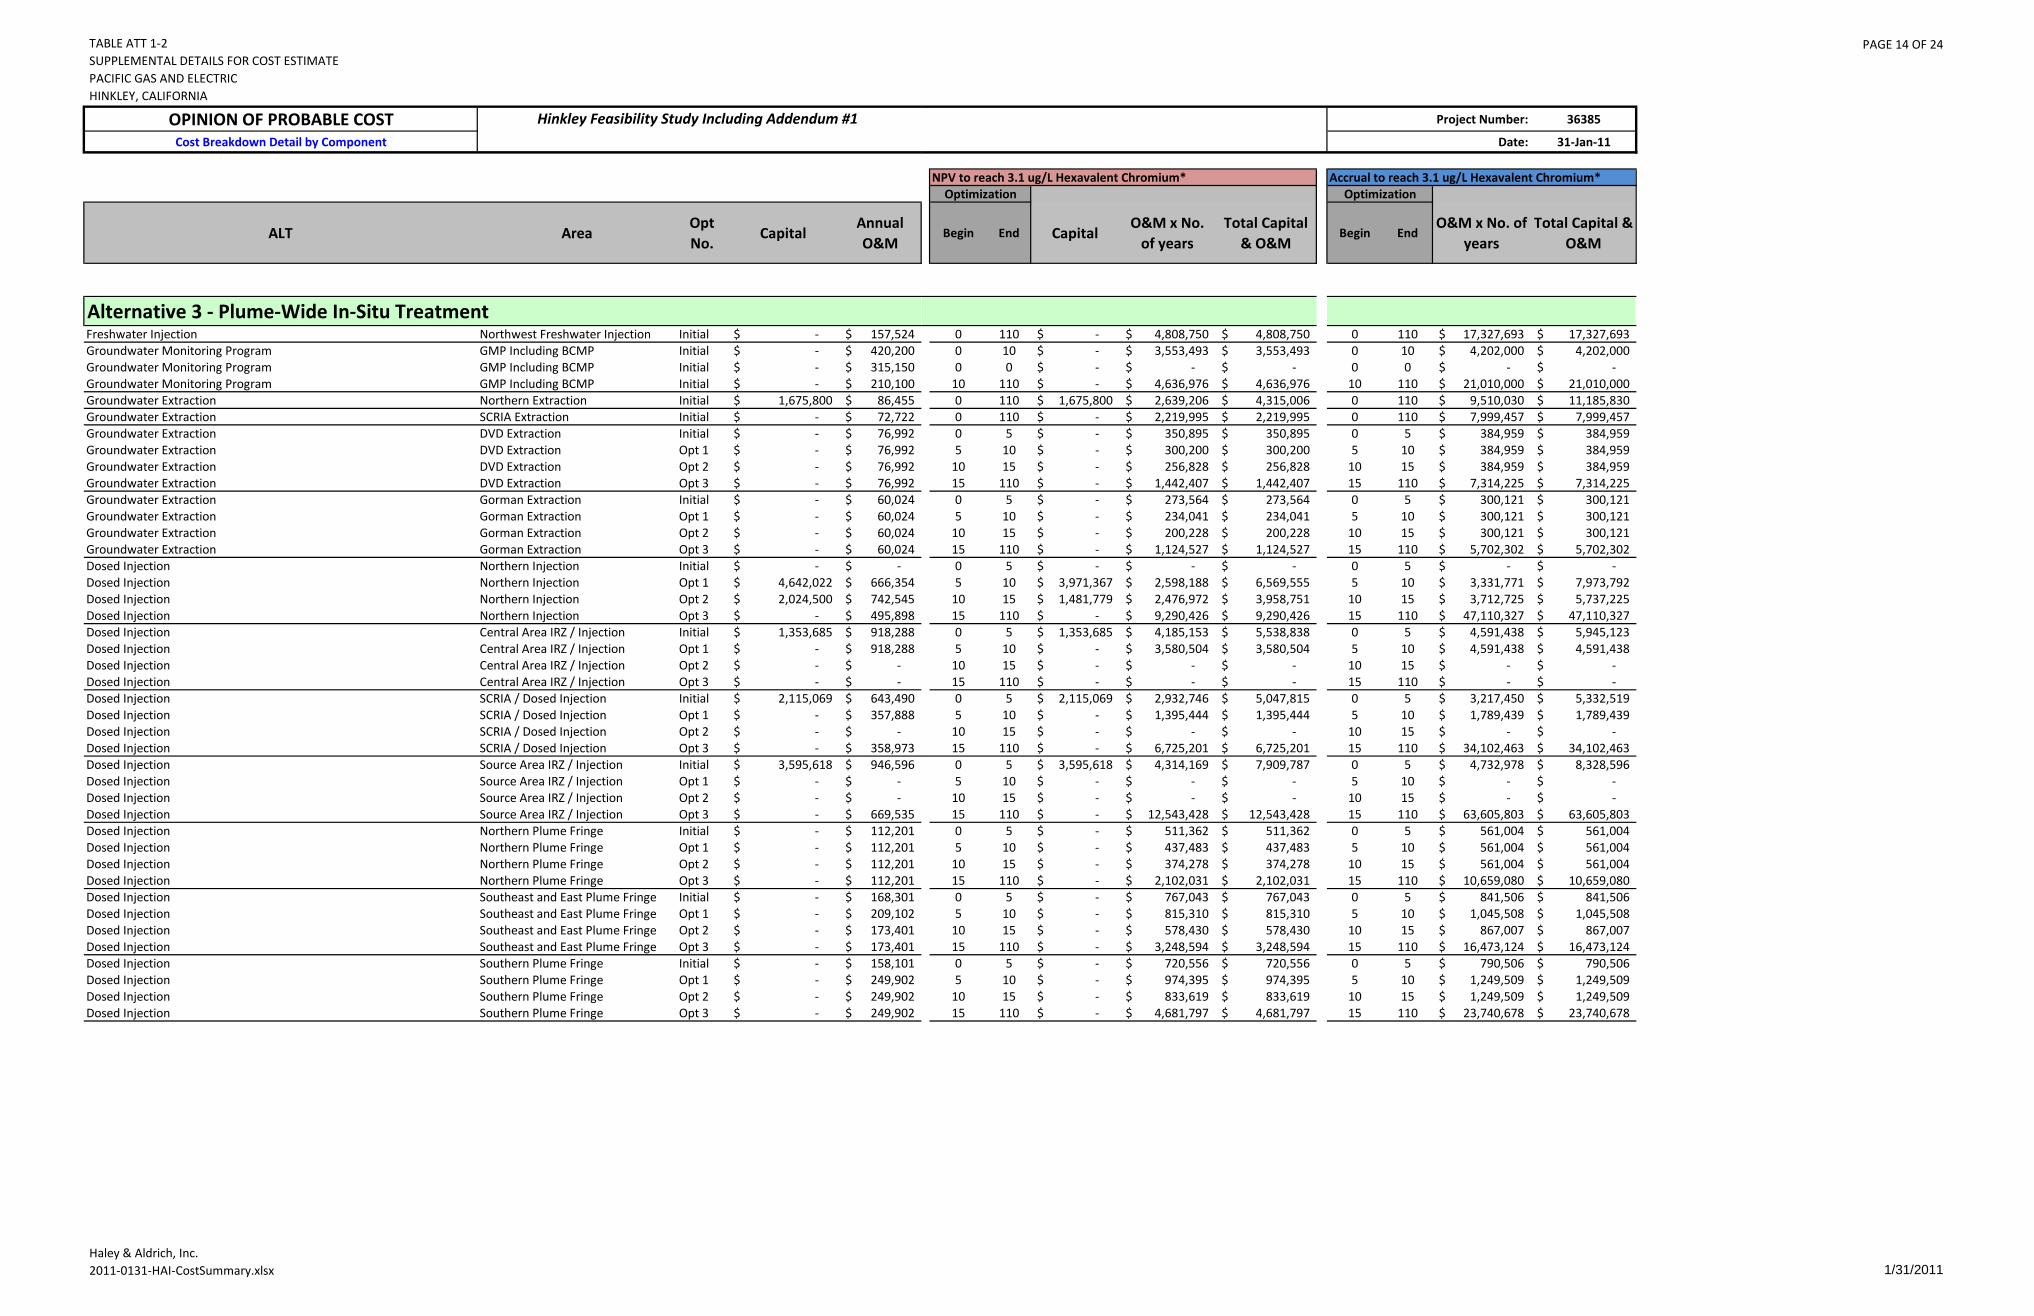
TABLE ATT 1-2SUPPLEMENTAL DETAILS FOR COST ESTIMATEPACIFIC GAS AND ELECTRICHINKLEY, CALIFORNIA
PAGE 14 OF 24
Haley & Aldrich, Inc.2011-0131-HAI-CostSummary.xlsx 1/31/2011
OPINION OF PROBABLE COSTCost Breakdown Detail by Component
ALT AreaOpt No.
CapitalAnnual O&M
Hinkley Feasibility Study Including Addendum #1
Alternative 3 - Plume-Wide In-Situ TreatmentFreshwater Injection Northwest Freshwater Injection Initial -$ 157,524$ Groundwater Monitoring Program GMP Including BCMP Initial -$ 420,200$ Groundwater Monitoring Program GMP Including BCMP Initial -$ 315,150$ Groundwater Monitoring Program GMP Including BCMP Initial -$ 210,100$ Groundwater Extraction Northern Extraction Initial 1,675,800$ 86,455$ Groundwater Extraction SCRIA Extraction Initial -$ 72,722$ Groundwater Extraction DVD Extraction Initial -$ 76,992$ Groundwater Extraction DVD Extraction Opt 1 -$ 76,992$ Groundwater Extraction DVD Extraction Opt 2 -$ 76,992$ Groundwater Extraction DVD Extraction Opt 3 -$ 76,992$ Groundwater Extraction Gorman Extraction Initial -$ 60,024$ Groundwater Extraction Gorman Extraction Opt 1 -$ 60,024$ Groundwater Extraction Gorman Extraction Opt 2 -$ 60,024$ Groundwater Extraction Gorman Extraction Opt 3 -$ 60,024$ Dosed Injection Northern Injection Initial -$ -$ Dosed Injection Northern Injection Opt 1 4,642,022$ 666,354$ Dosed Injection Northern Injection Opt 2 2,024,500$ 742,545$ Dosed Injection Northern Injection Opt 3 -$ 495,898$ Dosed Injection Central Area IRZ / Injection Initial 1,353,685$ 918,288$ Dosed Injection Central Area IRZ / Injection Opt 1 -$ 918,288$ Dosed Injection Central Area IRZ / Injection Opt 2 -$ -$ Dosed Injection Central Area IRZ / Injection Opt 3 -$ -$ Dosed Injection SCRIA / Dosed Injection Initial 2,115,069$ 643,490$ Dosed Injection SCRIA / Dosed Injection Opt 1 -$ 357,888$ Dosed Injection SCRIA / Dosed Injection Opt 2 -$ -$ Dosed Injection SCRIA / Dosed Injection Opt 3 -$ 358,973$ Dosed Injection Source Area IRZ / Injection Initial 3,595,618$ 946,596$ Dosed Injection Source Area IRZ / Injection Opt 1 -$ -$ Dosed Injection Source Area IRZ / Injection Opt 2 -$ -$ Dosed Injection Source Area IRZ / Injection Opt 3 -$ 669,535$ Dosed Injection Northern Plume Fringe Initial -$ 112,201$ Dosed Injection Northern Plume Fringe Opt 1 -$ 112,201$ Dosed Injection Northern Plume Fringe Opt 2 -$ 112,201$ Dosed Injection Northern Plume Fringe Opt 3 -$ 112,201$ Dosed Injection Southeast and East Plume Fringe Initial -$ 168,301$ Dosed Injection Southeast and East Plume Fringe Opt 1 -$ 209,102$ Dosed Injection Southeast and East Plume Fringe Opt 2 -$ 173,401$ Dosed Injection Southeast and East Plume Fringe Opt 3 -$ 173,401$ Dosed Injection Southern Plume Fringe Initial -$ 158,101$ Dosed Injection Southern Plume Fringe Opt 1 -$ 249,902$ Dosed Injection Southern Plume Fringe Opt 2 -$ 249,902$ Dosed Injection Southern Plume Fringe Opt 3 -$ 249,902$
Project Number: 36385
Date: 31-Jan-11
NPV to reach 3.1 ug/L Hexavalent Chromium* Accrual to reach 3.1 ug/L Hexavalent Chromium*Optimization Optimization
Begin End CapitalO&M x No.
of yearsTotal Capital
& O&MBegin End
O&M x No. of years
Total Capital & O&M
0 110 -$ 4,808,750$ 4,808,750$ 0 110 17,327,693$ 17,327,693$ 0 10 -$ 3,553,493$ 3,553,493$ 0 10 4,202,000$ 4,202,000$ 0 0 -$ -$ -$ 0 0 -$ -$
10 110 -$ 4,636,976$ 4,636,976$ 10 110 21,010,000$ 21,010,000$ 0 110 1,675,800$ 2,639,206$ 4,315,006$ 0 110 9,510,030$ 11,185,830$ 0 110 -$ 2,219,995$ 2,219,995$ 0 110 7,999,457$ 7,999,457$ 0 5 -$ 350,895$ 350,895$ 0 5 384,959$ 384,959$ 5 10 -$ 300,200$ 300,200$ 5 10 384,959$ 384,959$
10 15 -$ 256,828$ 256,828$ 10 15 384,959$ 384,959$ 15 110 -$ 1,442,407$ 1,442,407$ 15 110 7,314,225$ 7,314,225$ 0 5 -$ 273,564$ 273,564$ 0 5 300,121$ 300,121$ 5 10 -$ 234,041$ 234,041$ 5 10 300,121$ 300,121$
10 15 -$ 200,228$ 200,228$ 10 15 300,121$ 300,121$ 15 110 -$ 1,124,527$ 1,124,527$ 15 110 5,702,302$ 5,702,302$ 0 5 -$ -$ -$ 0 5 -$ -$ 5 10 3,971,367$ 2,598,188$ 6,569,555$ 5 10 3,331,771$ 7,973,792$
10 15 1,481,779$ 2,476,972$ 3,958,751$ 10 15 3,712,725$ 5,737,225$ 15 110 -$ 9,290,426$ 9,290,426$ 15 110 47,110,327$ 47,110,327$ 0 5 1,353,685$ 4,185,153$ 5,538,838$ 0 5 4,591,438$ 5,945,123$ 5 10 -$ 3,580,504$ 3,580,504$ 5 10 4,591,438$ 4,591,438$
10 15 -$ -$ -$ 10 15 -$ -$ 15 110 -$ -$ -$ 15 110 -$ -$ 0 5 2,115,069$ 2,932,746$ 5,047,815$ 0 5 3,217,450$ 5,332,519$ 5 10 -$ 1,395,444$ 1,395,444$ 5 10 1,789,439$ 1,789,439$
10 15 -$ -$ -$ 10 15 -$ -$ 15 110 -$ 6,725,201$ 6,725,201$ 15 110 34,102,463$ 34,102,463$ 0 5 3,595,618$ 4,314,169$ 7,909,787$ 0 5 4,732,978$ 8,328,596$ 5 10 -$ -$ -$ 5 10 -$ -$
10 15 -$ -$ -$ 10 15 -$ -$ 15 110 -$ 12,543,428$ 12,543,428$ 15 110 63,605,803$ 63,605,803$ 0 5 -$ 511,362$ 511,362$ 0 5 561,004$ 561,004$ 5 10 -$ 437,483$ 437,483$ 5 10 561,004$ 561,004$
10 15 -$ 374,278$ 374,278$ 10 15 561,004$ 561,004$ 15 110 -$ 2,102,031$ 2,102,031$ 15 110 10,659,080$ 10,659,080$ 0 5 -$ 767,043$ 767,043$ 0 5 841,506$ 841,506$ 5 10 -$ 815,310$ 815,310$ 5 10 1,045,508$ 1,045,508$
10 15 -$ 578,430$ 578,430$ 10 15 867,007$ 867,007$ 15 110 -$ 3,248,594$ 3,248,594$ 15 110 16,473,124$ 16,473,124$ 0 5 -$ 720,556$ 720,556$ 0 5 790,506$ 790,506$ 5 10 -$ 974,395$ 974,395$ 5 10 1,249,509$ 1,249,509$
10 15 -$ 833,619$ 833,619$ 10 15 1,249,509$ 1,249,509$ 15 110 -$ 4,681,797$ 4,681,797$ 15 110 23,740,678$ 23,740,678$
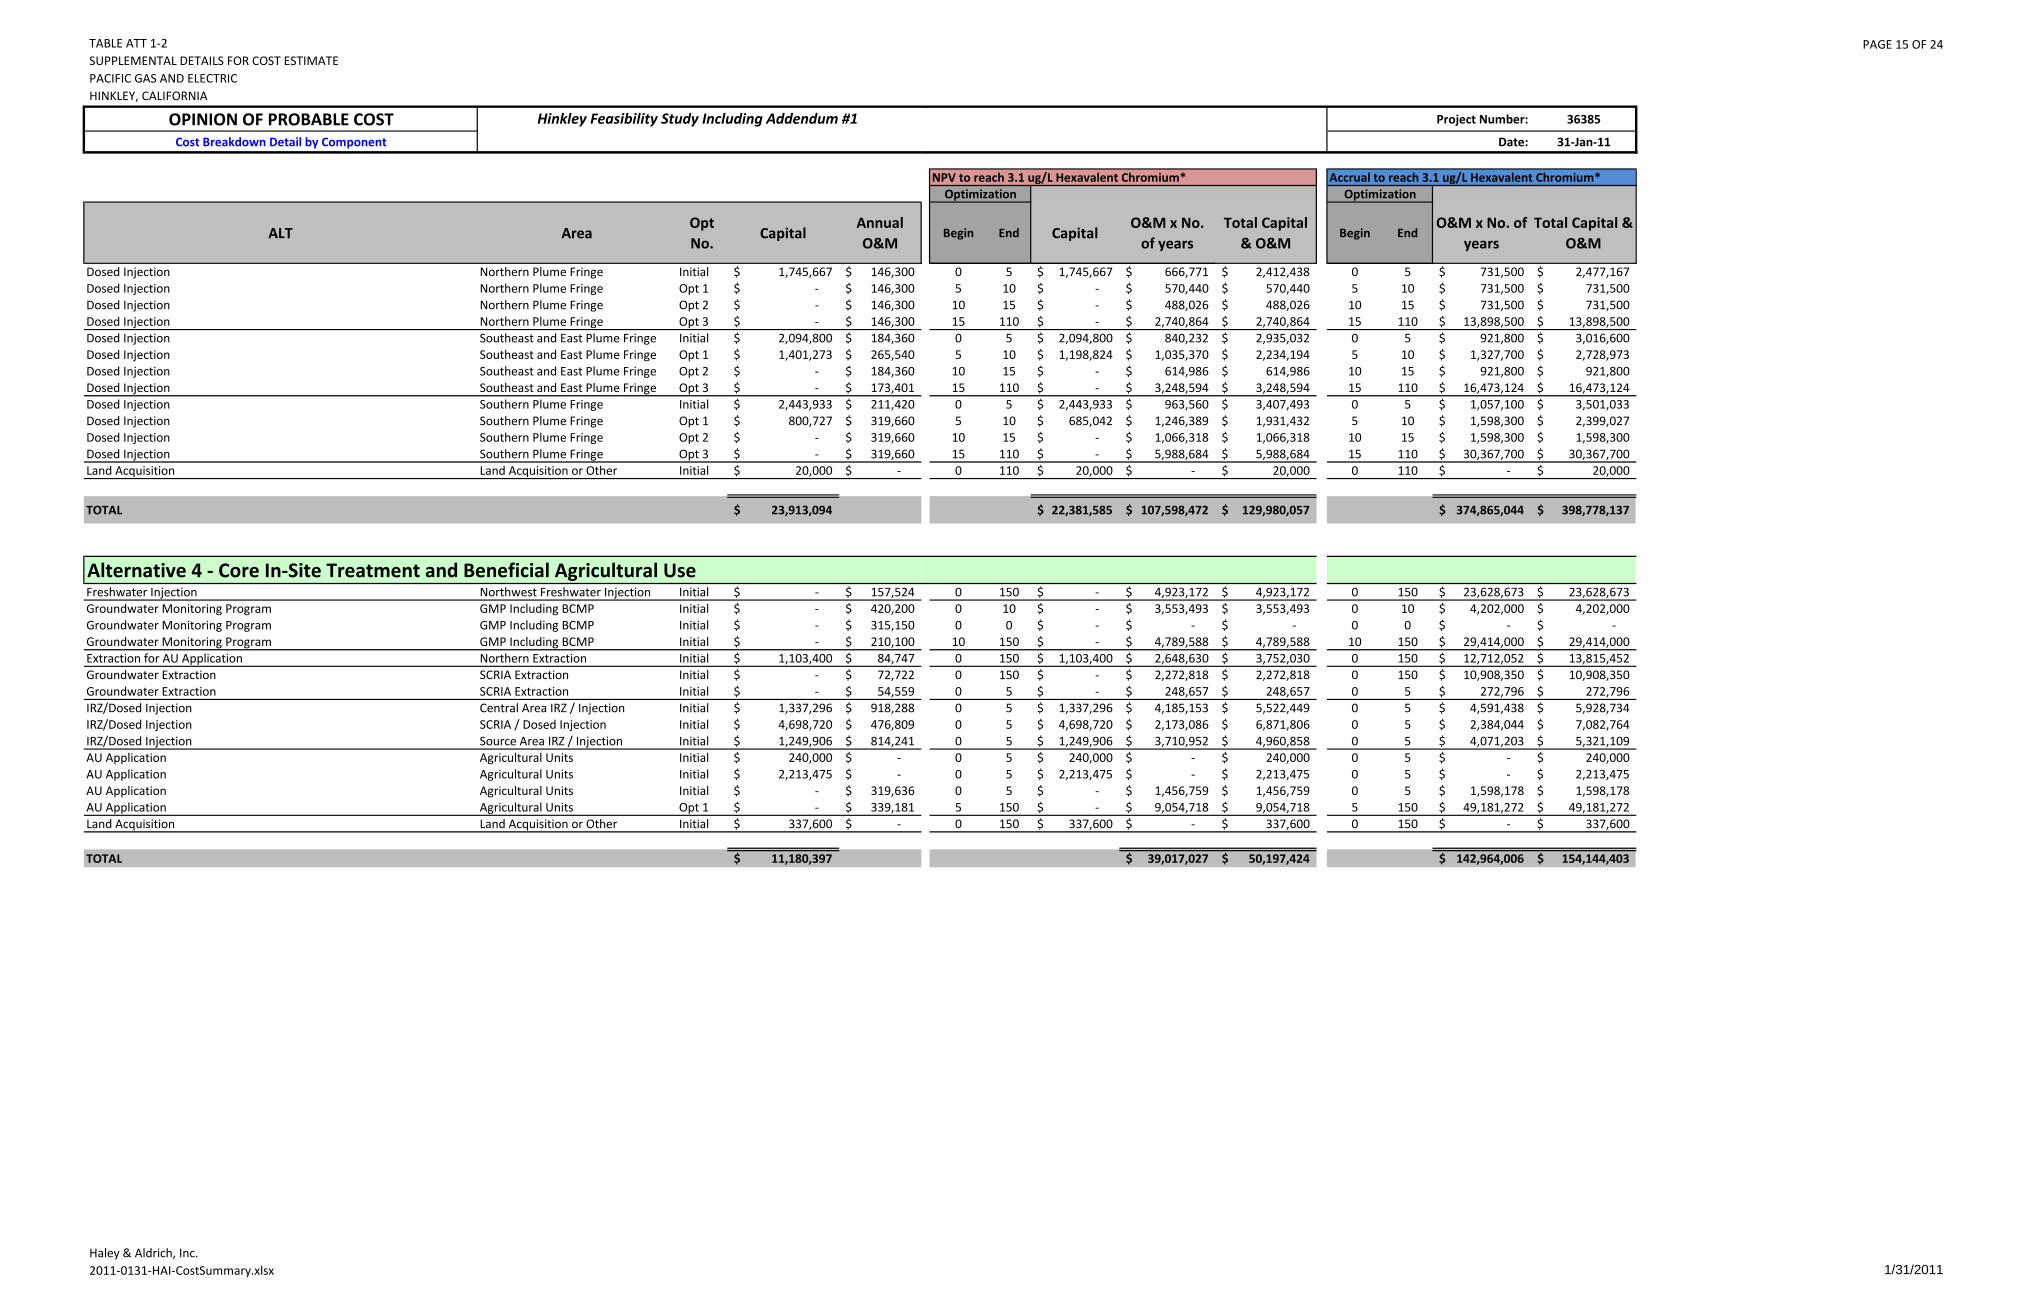
TABLE ATT 1-2SUPPLEMENTAL DETAILS FOR COST ESTIMATEPACIFIC GAS AND ELECTRICHINKLEY, CALIFORNIA
PAGE 15 OF 24
Haley & Aldrich, Inc.2011-0131-HAI-CostSummary.xlsx 1/31/2011
OPINION OF PROBABLE COSTCost Breakdown Detail by Component
ALT AreaOpt No.
CapitalAnnual O&M
Hinkley Feasibility Study Including Addendum #1
Dosed Injection Northern Plume Fringe Initial 1,745,667$ 146,300$ Dosed Injection Northern Plume Fringe Opt 1 -$ 146,300$ Dosed Injection Northern Plume Fringe Opt 2 -$ 146,300$ Dosed Injection Northern Plume Fringe Opt 3 -$ 146,300$ Dosed Injection Southeast and East Plume Fringe Initial 2,094,800$ 184,360$ Dosed Injection Southeast and East Plume Fringe Opt 1 1,401,273$ 265,540$ Dosed Injection Southeast and East Plume Fringe Opt 2 -$ 184,360$ Dosed Injection Southeast and East Plume Fringe Opt 3 -$ 173,401$ Dosed Injection Southern Plume Fringe Initial 2,443,933$ 211,420$ Dosed Injection Southern Plume Fringe Opt 1 800,727$ 319,660$ Dosed Injection Southern Plume Fringe Opt 2 -$ 319,660$ Dosed Injection Southern Plume Fringe Opt 3 -$ 319,660$ Land Acquisition Land Acquisition or Other Initial 20,000$ -$
TOTAL 23,913,094$
Alternative 4 - Core In-Site Treatment and Beneficial Agricultural UseFreshwater Injection Northwest Freshwater Injection Initial -$ 157,524$ Groundwater Monitoring Program GMP Including BCMP Initial -$ 420,200$ Groundwater Monitoring Program GMP Including BCMP Initial -$ 315,150$ Groundwater Monitoring Program GMP Including BCMP Initial -$ 210,100$ Extraction for AU Application Northern Extraction Initial 1,103,400$ 84,747$ Groundwater Extraction SCRIA Extraction Initial -$ 72,722$ Groundwater Extraction SCRIA Extraction Initial -$ 54,559$ IRZ/Dosed Injection Central Area IRZ / Injection Initial 1,337,296$ 918,288$ IRZ/Dosed Injection SCRIA / Dosed Injection Initial 4,698,720$ 476,809$ IRZ/Dosed Injection Source Area IRZ / Injection Initial 1,249,906$ 814,241$ AU Application Agricultural Units Initial 240,000$ -$ AU Application Agricultural Units Initial 2,213,475$ -$ AU Application Agricultural Units Initial -$ 319,636$ AU Application Agricultural Units Opt 1 -$ 339,181$ Land Acquisition Land Acquisition or Other Initial 337,600$ -$
TOTAL 11,180,397$
Project Number: 36385
Date: 31-Jan-11
NPV to reach 3.1 ug/L Hexavalent Chromium* Accrual to reach 3.1 ug/L Hexavalent Chromium*Optimization Optimization
Begin End CapitalO&M x No.
of yearsTotal Capital
& O&MBegin End
O&M x No. of years
Total Capital & O&M
0 5 1,745,667$ 666,771$ 2,412,438$ 0 5 731,500$ 2,477,167$ 5 10 -$ 570,440$ 570,440$ 5 10 731,500$ 731,500$
10 15 -$ 488,026$ 488,026$ 10 15 731,500$ 731,500$ 15 110 -$ 2,740,864$ 2,740,864$ 15 110 13,898,500$ 13,898,500$ 0 5 2,094,800$ 840,232$ 2,935,032$ 0 5 921,800$ 3,016,600$ 5 10 1,198,824$ 1,035,370$ 2,234,194$ 5 10 1,327,700$ 2,728,973$
10 15 -$ 614,986$ 614,986$ 10 15 921,800$ 921,800$ 15 110 -$ 3,248,594$ 3,248,594$ 15 110 16,473,124$ 16,473,124$ 0 5 2,443,933$ 963,560$ 3,407,493$ 0 5 1,057,100$ 3,501,033$ 5 10 685,042$ 1,246,389$ 1,931,432$ 5 10 1,598,300$ 2,399,027$
10 15 -$ 1,066,318$ 1,066,318$ 10 15 1,598,300$ 1,598,300$ 15 110 -$ 5,988,684$ 5,988,684$ 15 110 30,367,700$ 30,367,700$ 0 110 20,000$ -$ 20,000$ 0 110 -$ 20,000$
22,381,585$ 107,598,472$ 129,980,057$ 374,865,044$ 398,778,137$
0 150 -$ 4,923,172$ 4,923,172$ 0 150 23,628,673$ 23,628,673$ 0 10 -$ 3,553,493$ 3,553,493$ 0 10 4,202,000$ 4,202,000$ 0 0 -$ -$ -$ 0 0 -$ -$
10 150 -$ 4,789,588$ 4,789,588$ 10 150 29,414,000$ 29,414,000$ 0 150 1,103,400$ 2,648,630$ 3,752,030$ 0 150 12,712,052$ 13,815,452$ 0 150 -$ 2,272,818$ 2,272,818$ 0 150 10,908,350$ 10,908,350$ 0 5 -$ 248,657$ 248,657$ 0 5 272,796$ 272,796$ 0 5 1,337,296$ 4,185,153$ 5,522,449$ 0 5 4,591,438$ 5,928,734$ 0 5 4,698,720$ 2,173,086$ 6,871,806$ 0 5 2,384,044$ 7,082,764$ 0 5 1,249,906$ 3,710,952$ 4,960,858$ 0 5 4,071,203$ 5,321,109$ 0 5 240,000$ -$ 240,000$ 0 5 -$ 240,000$ 0 5 2,213,475$ -$ 2,213,475$ 0 5 -$ 2,213,475$ 0 5 -$ 1,456,759$ 1,456,759$ 0 5 1,598,178$ 1,598,178$ 5 150 -$ 9,054,718$ 9,054,718$ 5 150 49,181,272$ 49,181,272$ 0 150 337,600$ -$ 337,600$ 0 150 -$ 337,600$
39,017,027$ 50,197,424$ 142,964,006$ 154,144,403$
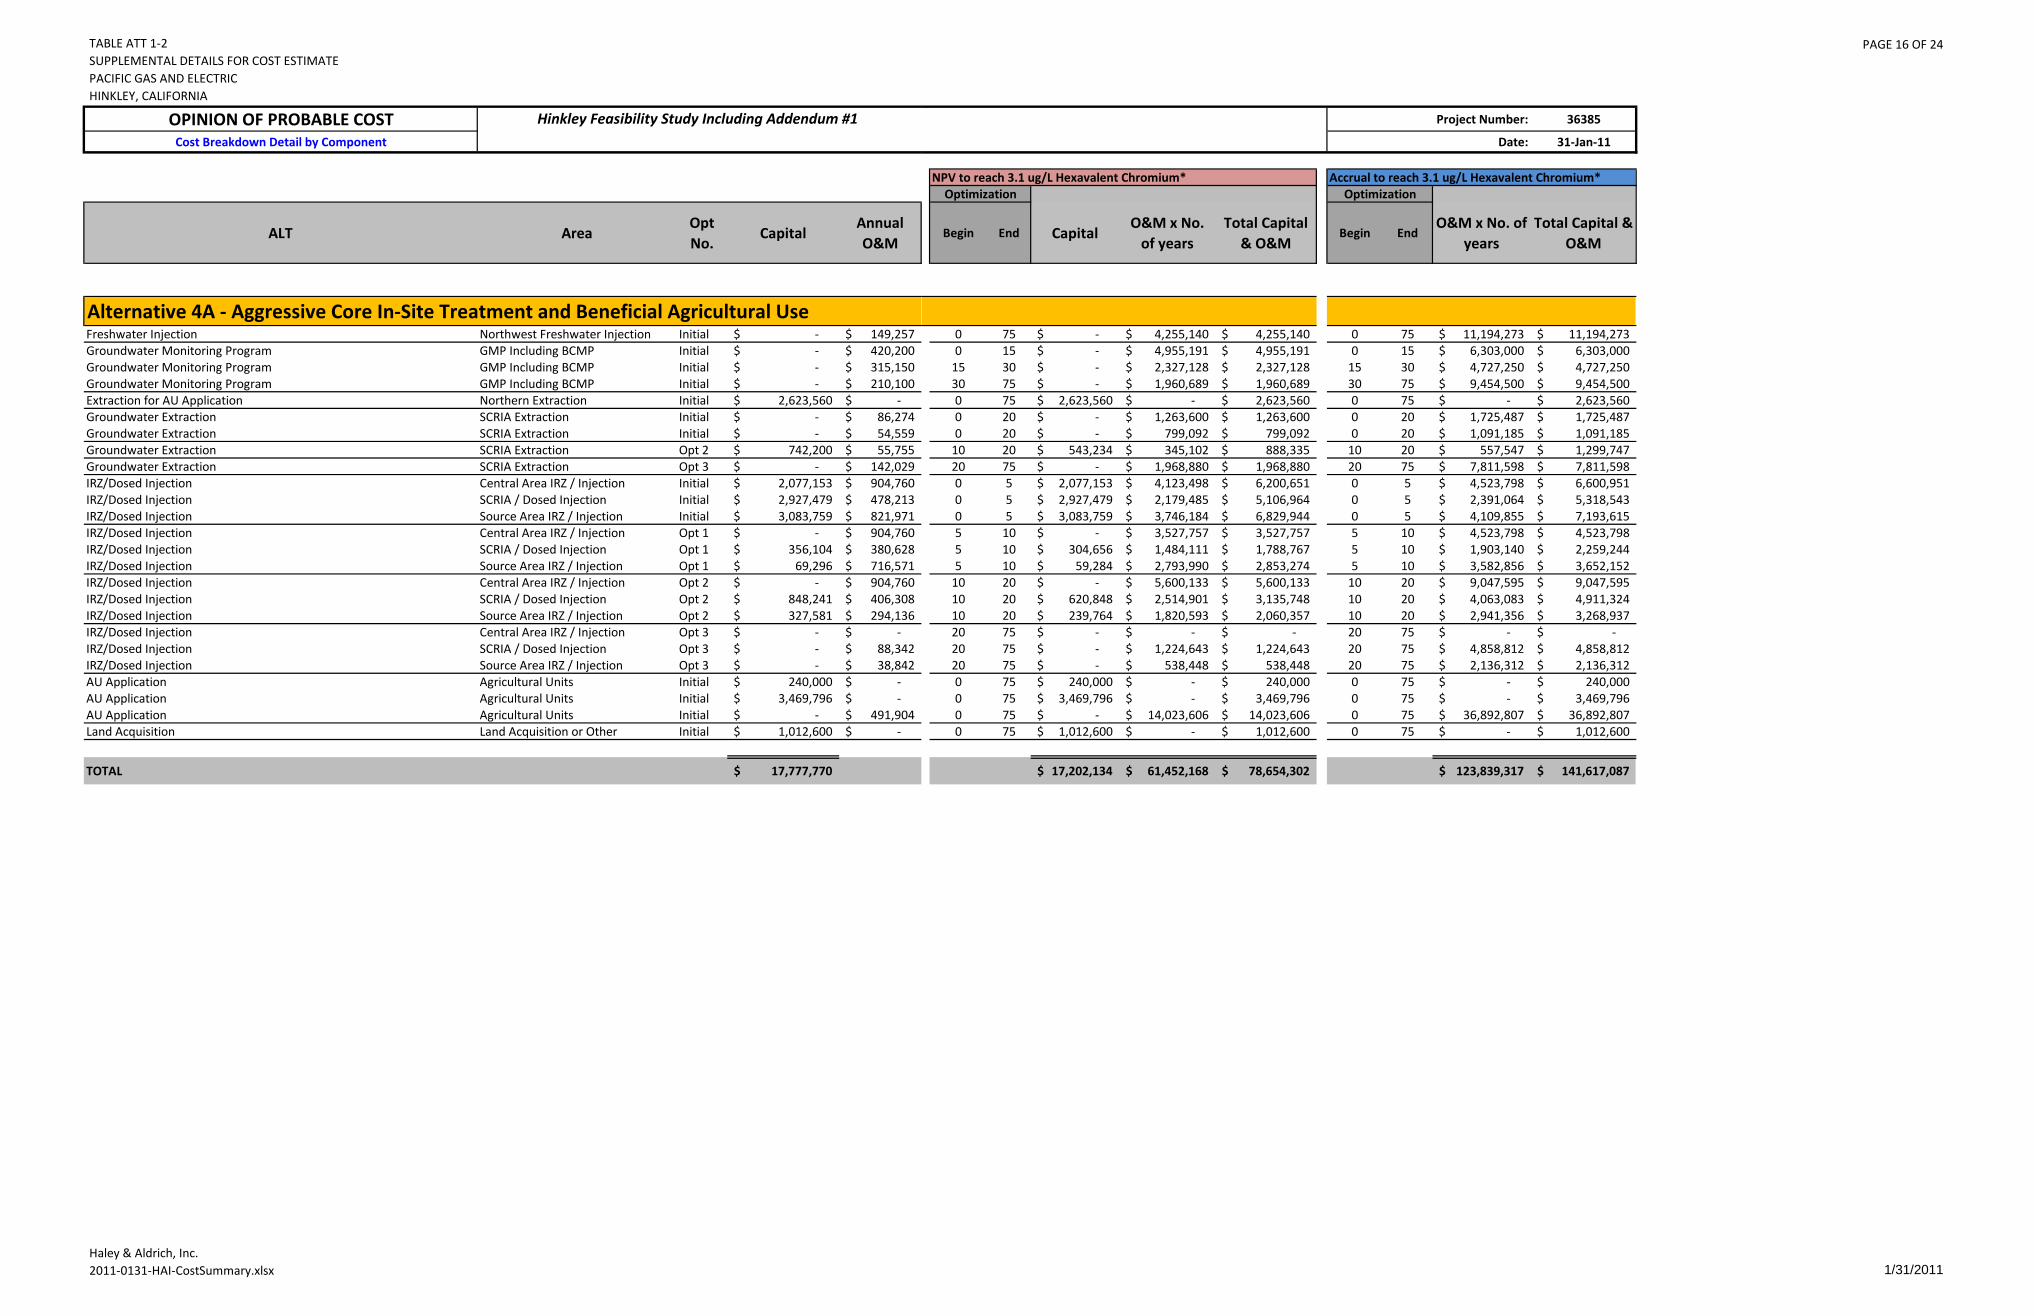
TABLE ATT 1-2SUPPLEMENTAL DETAILS FOR COST ESTIMATEPACIFIC GAS AND ELECTRICHINKLEY, CALIFORNIA
PAGE 16 OF 24
Haley & Aldrich, Inc.2011-0131-HAI-CostSummary.xlsx 1/31/2011
OPINION OF PROBABLE COSTCost Breakdown Detail by Component
ALT AreaOpt No.
CapitalAnnual O&M
Hinkley Feasibility Study Including Addendum #1
Alternative 4A - Aggressive Core In-Site Treatment and Beneficial Agricultural UseFreshwater Injection Northwest Freshwater Injection Initial -$ 149,257$ Groundwater Monitoring Program GMP Including BCMP Initial -$ 420,200$ Groundwater Monitoring Program GMP Including BCMP Initial -$ 315,150$ Groundwater Monitoring Program GMP Including BCMP Initial -$ 210,100$ Extraction for AU Application Northern Extraction Initial 2,623,560$ -$ Groundwater Extraction SCRIA Extraction Initial -$ 86,274$ Groundwater Extraction SCRIA Extraction Initial -$ 54,559$ Groundwater Extraction SCRIA Extraction Opt 2 742,200$ 55,755$ Groundwater Extraction SCRIA Extraction Opt 3 -$ 142,029$ IRZ/Dosed Injection Central Area IRZ / Injection Initial 2,077,153$ 904,760$ IRZ/Dosed Injection SCRIA / Dosed Injection Initial 2,927,479$ 478,213$ IRZ/Dosed Injection Source Area IRZ / Injection Initial 3,083,759$ 821,971$ IRZ/Dosed Injection Central Area IRZ / Injection Opt 1 -$ 904,760$ IRZ/Dosed Injection SCRIA / Dosed Injection Opt 1 356,104$ 380,628$ IRZ/Dosed Injection Source Area IRZ / Injection Opt 1 69,296$ 716,571$ IRZ/Dosed Injection Central Area IRZ / Injection Opt 2 -$ 904,760$ IRZ/Dosed Injection SCRIA / Dosed Injection Opt 2 848,241$ 406,308$ IRZ/Dosed Injection Source Area IRZ / Injection Opt 2 327,581$ 294,136$ IRZ/Dosed Injection Central Area IRZ / Injection Opt 3 -$ -$ IRZ/Dosed Injection SCRIA / Dosed Injection Opt 3 -$ 88,342$ IRZ/Dosed Injection Source Area IRZ / Injection Opt 3 -$ 38,842$ AU Application Agricultural Units Initial 240,000$ -$ AU Application Agricultural Units Initial 3,469,796$ -$ AU Application Agricultural Units Initial -$ 491,904$ Land Acquisition Land Acquisition or Other Initial 1,012,600$ -$
TOTAL 17,777,770$
Project Number: 36385
Date: 31-Jan-11
NPV to reach 3.1 ug/L Hexavalent Chromium* Accrual to reach 3.1 ug/L Hexavalent Chromium*Optimization Optimization
Begin End CapitalO&M x No.
of yearsTotal Capital
& O&MBegin End
O&M x No. of years
Total Capital & O&M
0 75 -$ 4,255,140$ 4,255,140$ 0 75 11,194,273$ 11,194,273$ 0 15 -$ 4,955,191$ 4,955,191$ 0 15 6,303,000$ 6,303,000$
15 30 -$ 2,327,128$ 2,327,128$ 15 30 4,727,250$ 4,727,250$ 30 75 -$ 1,960,689$ 1,960,689$ 30 75 9,454,500$ 9,454,500$ 0 75 2,623,560$ -$ 2,623,560$ 0 75 -$ 2,623,560$ 0 20 -$ 1,263,600$ 1,263,600$ 0 20 1,725,487$ 1,725,487$ 0 20 -$ 799,092$ 799,092$ 0 20 1,091,185$ 1,091,185$
10 20 543,234$ 345,102$ 888,335$ 10 20 557,547$ 1,299,747$ 20 75 -$ 1,968,880$ 1,968,880$ 20 75 7,811,598$ 7,811,598$ 0 5 2,077,153$ 4,123,498$ 6,200,651$ 0 5 4,523,798$ 6,600,951$ 0 5 2,927,479$ 2,179,485$ 5,106,964$ 0 5 2,391,064$ 5,318,543$ 0 5 3,083,759$ 3,746,184$ 6,829,944$ 0 5 4,109,855$ 7,193,615$ 5 10 -$ 3,527,757$ 3,527,757$ 5 10 4,523,798$ 4,523,798$ 5 10 304,656$ 1,484,111$ 1,788,767$ 5 10 1,903,140$ 2,259,244$ 5 10 59,284$ 2,793,990$ 2,853,274$ 5 10 3,582,856$ 3,652,152$
10 20 -$ 5,600,133$ 5,600,133$ 10 20 9,047,595$ 9,047,595$ 10 20 620,848$ 2,514,901$ 3,135,748$ 10 20 4,063,083$ 4,911,324$ 10 20 239,764$ 1,820,593$ 2,060,357$ 10 20 2,941,356$ 3,268,937$ 20 75 -$ -$ -$ 20 75 -$ -$ 20 75 -$ 1,224,643$ 1,224,643$ 20 75 4,858,812$ 4,858,812$ 20 75 -$ 538,448$ 538,448$ 20 75 2,136,312$ 2,136,312$ 0 75 240,000$ -$ 240,000$ 0 75 -$ 240,000$ 0 75 3,469,796$ -$ 3,469,796$ 0 75 -$ 3,469,796$ 0 75 -$ 14,023,606$ 14,023,606$ 0 75 36,892,807$ 36,892,807$ 0 75 1,012,600$ -$ 1,012,600$ 0 75 -$ 1,012,600$
17,202,134$ 61,452,168$ 78,654,302$ 123,839,317$ 141,617,087$

TABLE ATT 1-2SUPPLEMENTAL DETAILS FOR COST ESTIMATEPACIFIC GAS AND ELECTRICHINKLEY, CALIFORNIA
PAGE 17 OF 24
Haley & Aldrich, Inc.2011-0131-HAI-CostSummary.xlsx 1/31/2011
OPINION OF PROBABLE COSTCost Breakdown Detail by Component
ALT AreaOpt No.
CapitalAnnual O&M
Hinkley Feasibility Study Including Addendum #1
Alternative 5 - Plume-Wide Pump and TreatFreshwater Injection Northwest Freshwater Injection Initial -$ 157,524$ Groundwater Monitoring Program GMP Including BCMP Initial -$ 420,200$ Groundwater Monitoring Program GMP Including BCMP Initial -$ 315,150$ Groundwater Monitoring Program GMP Including BCMP Initial -$ 210,100$ Groundwater Extraction Northern Extraction Initial 1,675,800$ 84,747$ Groundwater Extraction SCRIA Extraction Initial -$ 72,722$ Groundwater Extraction DVD Extraction Initial -$ 73,576$ Groundwater Extraction DVD Extraction Opt 1 -$ 73,576$ Groundwater Extraction DVD Extraction Opt 2 -$ 73,576$ Groundwater Extraction Gorman Extraction Initial -$ 58,316$ Groundwater Extraction Gorman Extraction Opt 1 -$ 58,316$ Groundwater Extraction Gorman Extraction Opt 2 -$ 58,316$ Groundwater Extraction Ranch or Other Extraction Initial 3,202,844$ 126,247$ Groundwater Extraction Ranch or Other Extraction Opt 1 677,400$ 126,247$ Groundwater Extraction Ranch or Other Extraction Opt 2 885,600$ 126,247$ Treated Injection Northern Plume Fringe Initial 1,526,995$ 146,300$ Treated Injection Northern Plume Fringe Opt 1 -$ 146,300$ Treated Injection Northern Plume Fringe Opt 2 -$ 146,300$ Treated Injection Southeast and East Plume Fringe Initial 6,718,776$ 617,320$ Treated Injection Southeast and East Plume Fringe Opt 1 -$ 617,320$ Treated Injection Southeast and East Plume Fringe Opt 2 -$ 617,320$ Treated Injection Southern Plume Fringe Initial 3,359,388$ 319,660$ Treated Injection Southern Plume Fringe Opt 1 -$ 319,660$ Treated Injection Southern Plume Fringe Opt 2 -$ 319,660$ Treated Injection Southwest Plume Fringe Initial 916,197$ 92,180$ Treated Injection Southwest Plume Fringe Opt 1 -$ 92,180$ Treated Injection Southwest Plume Fringe Opt 2 -$ 92,180$ Groundwater Treatment Ex-Situ Treatment (Chem Precip) Initial 8,012,515$ 4,130,732$ Land Acquisition Land Acquisition or Other Initial 454,000$ -$
TOTAL 27,429,515$
Project Number: 36385
Date: 31-Jan-11
NPV to reach 3.1 ug/L Hexavalent Chromium* Accrual to reach 3.1 ug/L Hexavalent Chromium*Optimization Optimization
Begin End CapitalO&M x No.
of yearsTotal Capital
& O&MBegin End
O&M x No. of years
Total Capital & O&M
0 140 -$ 4,906,304$ 4,906,304$ 0 140 22,053,428$ 22,053,428$ 0 10 -$ 3,553,493$ 3,553,493$ 0 10 4,202,000$ 4,202,000$ 0 0 -$ -$ -$ 0 0 -$ -$
10 140 -$ 4,767,089$ 4,767,089$ 10 140 27,313,000$ 27,313,000$ 0 140 1,675,800$ 2,639,555$ 4,315,355$ 0 140 11,864,582$ 13,540,382$ 0 140 -$ 2,265,031$ 2,265,031$ 0 140 10,181,126$ 10,181,126$ 0 10 -$ 622,210$ 622,210$ 0 10 735,762$ 735,762$
10 15 -$ 245,435$ 245,435$ 10 15 367,881$ 367,881$ 15 140 -$ 1,423,982$ 1,423,982$ 15 140 9,197,029$ 9,197,029$ 0 10 -$ 493,163$ 493,163$ 0 10 583,164$ 583,164$
10 15 -$ 194,531$ 194,531$ 10 15 291,582$ 291,582$ 15 140 -$ 1,128,647$ 1,128,647$ 15 140 7,289,554$ 7,289,554$ 0 10 3,202,844$ 1,067,631$ 4,270,475$ 0 10 1,262,472$ 4,465,316$
10 15 495,805$ 421,134$ 916,939$ 10 15 631,236$ 1,308,636$ 15 140 554,544$ 2,443,368$ 2,997,912$ 15 140 15,780,901$ 16,666,501$ 0 10 1,526,995$ 1,237,211$ 2,764,206$ 0 10 1,463,000$ 2,989,995$
10 15 -$ 488,026$ 488,026$ 10 15 731,500$ 731,500$ 15 140 -$ 2,831,466$ 2,831,466$ 15 140 18,287,500$ 18,287,500$ 0 10 6,718,776$ 5,220,473$ 11,939,249$ 0 10 6,173,200$ 12,891,976$
10 15 -$ 2,059,248$ 2,059,248$ 10 15 3,086,600$ 3,086,600$ 15 140 -$ 11,947,509$ 11,947,509$ 15 140 77,165,000$ 77,165,000$ 0 10 3,359,388$ 2,703,260$ 6,062,648$ 0 10 3,196,600$ 6,555,988$
10 15 -$ 1,066,318$ 1,066,318$ 10 15 1,598,300$ 1,598,300$ 15 140 -$ 6,186,647$ 6,186,647$ 15 140 39,957,500$ 39,957,500$ 0 10 916,197$ 779,536$ 1,695,733$ 0 10 921,800$ 1,837,997$
10 15 -$ 307,493$ 307,493$ 10 15 460,900$ 460,900$ 15 140 -$ 1,784,036$ 1,784,036$ 15 140 11,522,500$ 11,522,500$ 0 140 8,012,515$ 128,657,005$ 136,669,520$ 0 140 578,302,548$ 586,315,063$ 0 140 454,000$ -$ 454,000$ 0 140 -$ 454,000$
26,916,864$ 191,439,800$ 218,356,664$ 854,620,667$ 882,050,182$
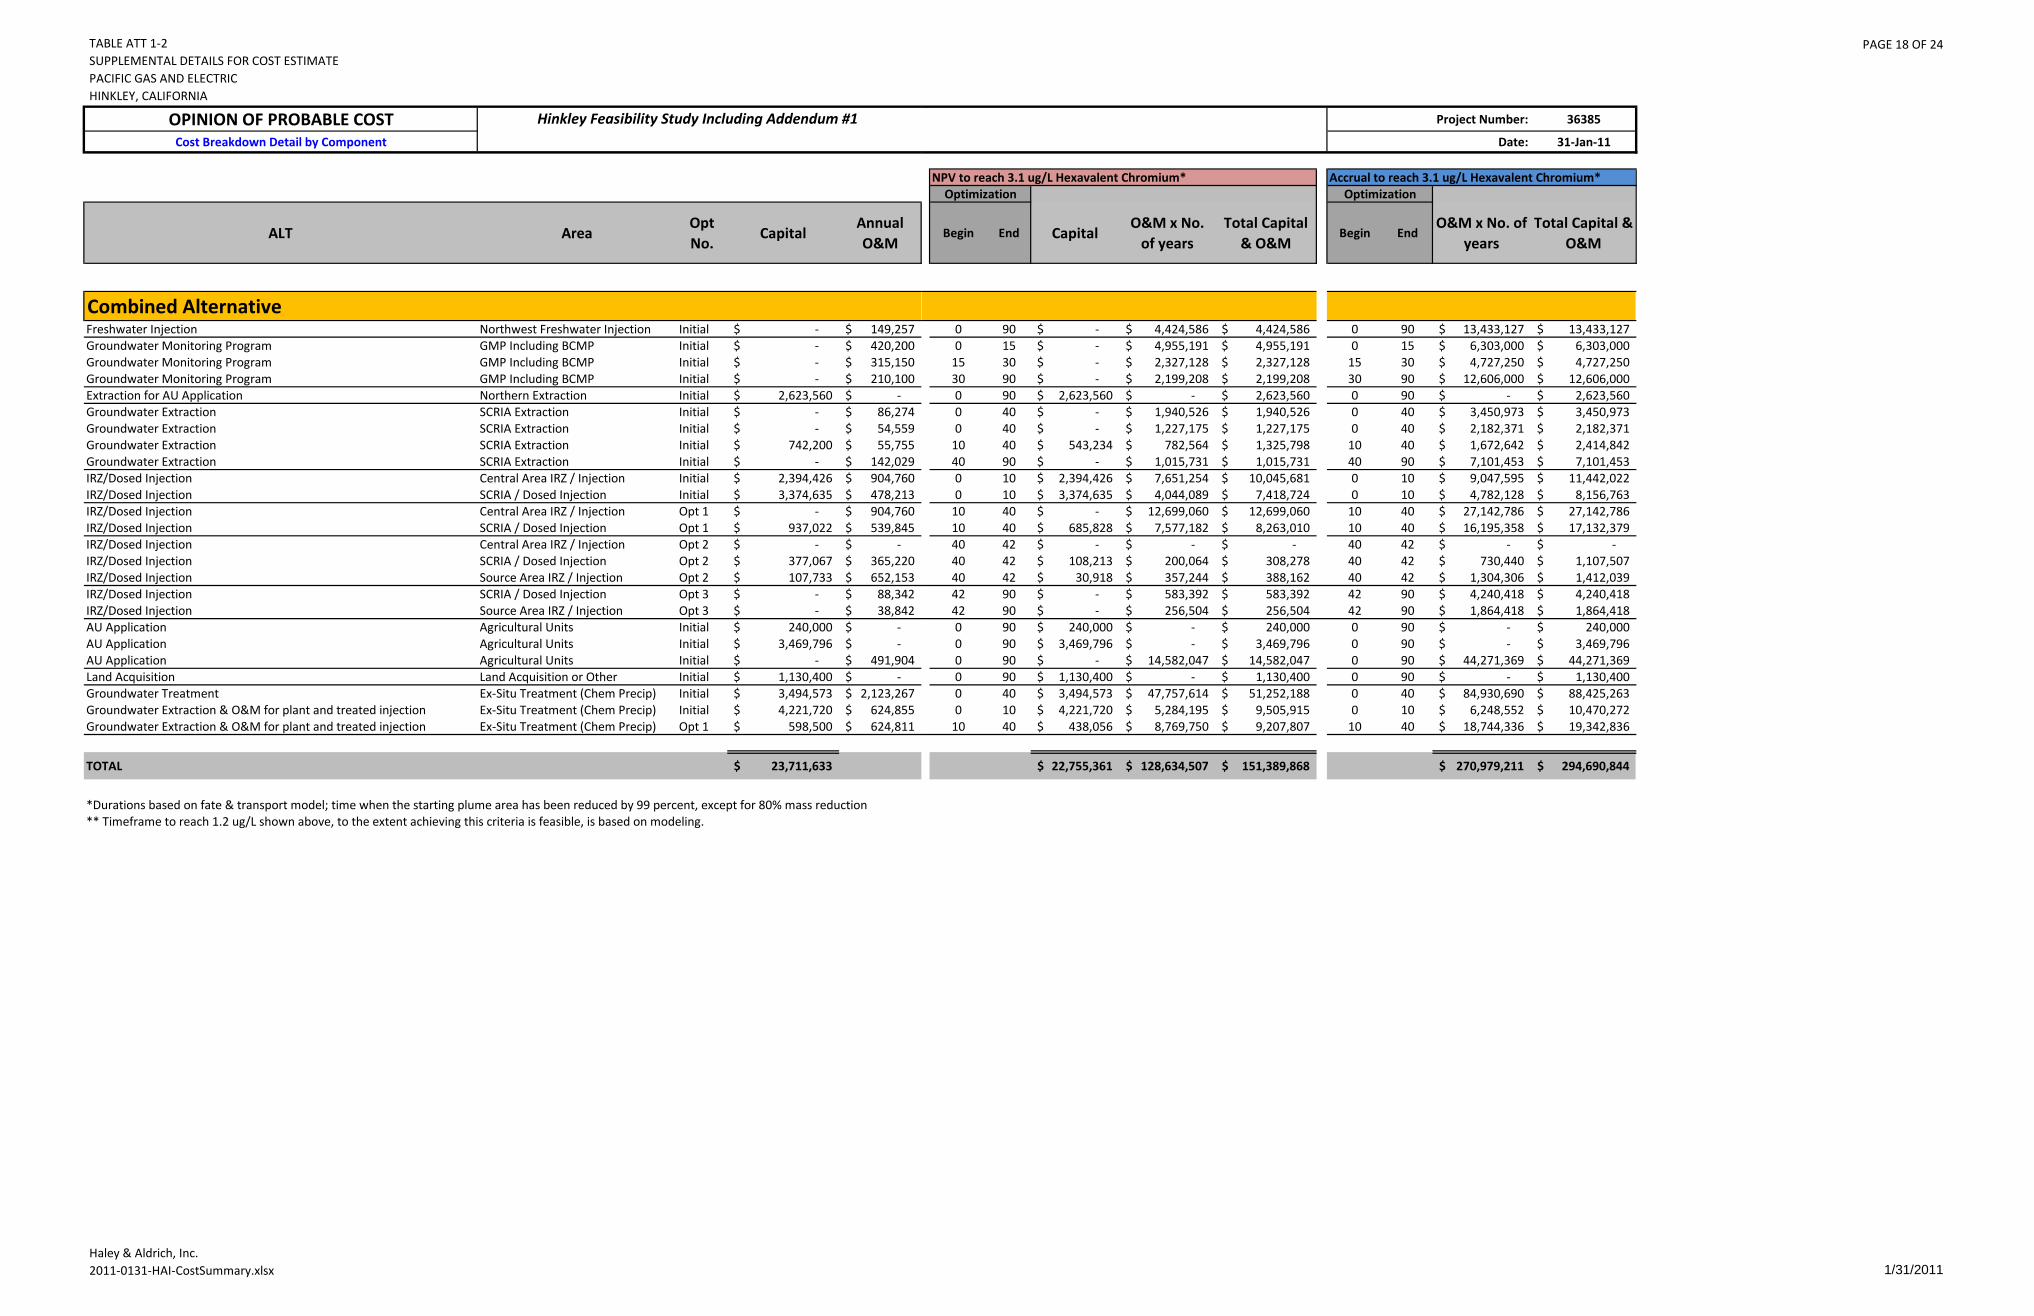
TABLE ATT 1-2SUPPLEMENTAL DETAILS FOR COST ESTIMATEPACIFIC GAS AND ELECTRICHINKLEY, CALIFORNIA
PAGE 18 OF 24
Haley & Aldrich, Inc.2011-0131-HAI-CostSummary.xlsx 1/31/2011
OPINION OF PROBABLE COSTCost Breakdown Detail by Component
ALT AreaOpt No.
CapitalAnnual O&M
Hinkley Feasibility Study Including Addendum #1
Combined AlternativeFreshwater Injection Northwest Freshwater Injection Initial -$ 149,257$ Groundwater Monitoring Program GMP Including BCMP Initial -$ 420,200$ Groundwater Monitoring Program GMP Including BCMP Initial -$ 315,150$ Groundwater Monitoring Program GMP Including BCMP Initial -$ 210,100$ Extraction for AU Application Northern Extraction Initial 2,623,560$ -$ Groundwater Extraction SCRIA Extraction Initial -$ 86,274$ Groundwater Extraction SCRIA Extraction Initial -$ 54,559$ Groundwater Extraction SCRIA Extraction Initial 742,200$ 55,755$ Groundwater Extraction SCRIA Extraction Initial -$ 142,029$ IRZ/Dosed Injection Central Area IRZ / Injection Initial 2,394,426$ 904,760$ IRZ/Dosed Injection SCRIA / Dosed Injection Initial 3,374,635$ 478,213$ IRZ/Dosed Injection Central Area IRZ / Injection Opt 1 -$ 904,760$ IRZ/Dosed Injection SCRIA / Dosed Injection Opt 1 937,022$ 539,845$ IRZ/Dosed Injection Central Area IRZ / Injection Opt 2 -$ -$ IRZ/Dosed Injection SCRIA / Dosed Injection Opt 2 377,067$ 365,220$ IRZ/Dosed Injection Source Area IRZ / Injection Opt 2 107,733$ 652,153$ IRZ/Dosed Injection SCRIA / Dosed Injection Opt 3 -$ 88,342$ IRZ/Dosed Injection Source Area IRZ / Injection Opt 3 -$ 38,842$ AU Application Agricultural Units Initial 240,000$ -$ AU Application Agricultural Units Initial 3,469,796$ -$ AU Application Agricultural Units Initial -$ 491,904$ Land Acquisition Land Acquisition or Other Initial 1,130,400$ -$ Groundwater Treatment Ex-Situ Treatment (Chem Precip) Initial 3,494,573$ 2,123,267$ Groundwater Extraction & O&M for plant and treated injection Ex-Situ Treatment (Chem Precip) Initial 4,221,720$ 624,855$ Groundwater Extraction & O&M for plant and treated injection Ex-Situ Treatment (Chem Precip) Opt 1 598,500$ 624,811$
TOTAL 23,711,633$
** Timeframe to reach 1.2 ug/L shown above, to the extent achieving this criteria is feasible, is based on modeling.*Durations based on fate & transport model; time when the starting plume area has been reduced by 99 percent, except for 80% mass reduction
Project Number: 36385
Date: 31-Jan-11
NPV to reach 3.1 ug/L Hexavalent Chromium* Accrual to reach 3.1 ug/L Hexavalent Chromium*Optimization Optimization
Begin End CapitalO&M x No.
of yearsTotal Capital
& O&MBegin End
O&M x No. of years
Total Capital & O&M
0 90 -$ 4,424,586$ 4,424,586$ 0 90 13,433,127$ 13,433,127$ 0 15 -$ 4,955,191$ 4,955,191$ 0 15 6,303,000$ 6,303,000$
15 30 -$ 2,327,128$ 2,327,128$ 15 30 4,727,250$ 4,727,250$ 30 90 -$ 2,199,208$ 2,199,208$ 30 90 12,606,000$ 12,606,000$ 0 90 2,623,560$ -$ 2,623,560$ 0 90 -$ 2,623,560$ 0 40 -$ 1,940,526$ 1,940,526$ 0 40 3,450,973$ 3,450,973$ 0 40 -$ 1,227,175$ 1,227,175$ 0 40 2,182,371$ 2,182,371$
10 40 543,234$ 782,564$ 1,325,798$ 10 40 1,672,642$ 2,414,842$ 40 90 -$ 1,015,731$ 1,015,731$ 40 90 7,101,453$ 7,101,453$ 0 10 2,394,426$ 7,651,254$ 10,045,681$ 0 10 9,047,595$ 11,442,022$ 0 10 3,374,635$ 4,044,089$ 7,418,724$ 0 10 4,782,128$ 8,156,763$
10 40 -$ 12,699,060$ 12,699,060$ 10 40 27,142,786$ 27,142,786$ 10 40 685,828$ 7,577,182$ 8,263,010$ 10 40 16,195,358$ 17,132,379$ 40 42 -$ -$ -$ 40 42 -$ -$ 40 42 108,213$ 200,064$ 308,278$ 40 42 730,440$ 1,107,507$ 40 42 30,918$ 357,244$ 388,162$ 40 42 1,304,306$ 1,412,039$ 42 90 -$ 583,392$ 583,392$ 42 90 4,240,418$ 4,240,418$ 42 90 -$ 256,504$ 256,504$ 42 90 1,864,418$ 1,864,418$ 0 90 240,000$ -$ 240,000$ 0 90 -$ 240,000$ 0 90 3,469,796$ -$ 3,469,796$ 0 90 -$ 3,469,796$ 0 90 -$ 14,582,047$ 14,582,047$ 0 90 44,271,369$ 44,271,369$ 0 90 1,130,400$ -$ 1,130,400$ 0 90 -$ 1,130,400$ 0 40 3,494,573$ 47,757,614$ 51,252,188$ 0 40 84,930,690$ 88,425,263$ 0 10 4,221,720$ 5,284,195$ 9,505,915$ 0 10 6,248,552$ 10,470,272$
10 40 438,056$ 8,769,750$ 9,207,807$ 10 40 18,744,336$ 19,342,836$
22,755,361$ 128,634,507$ 151,389,868$ 270,979,211$ 294,690,844$
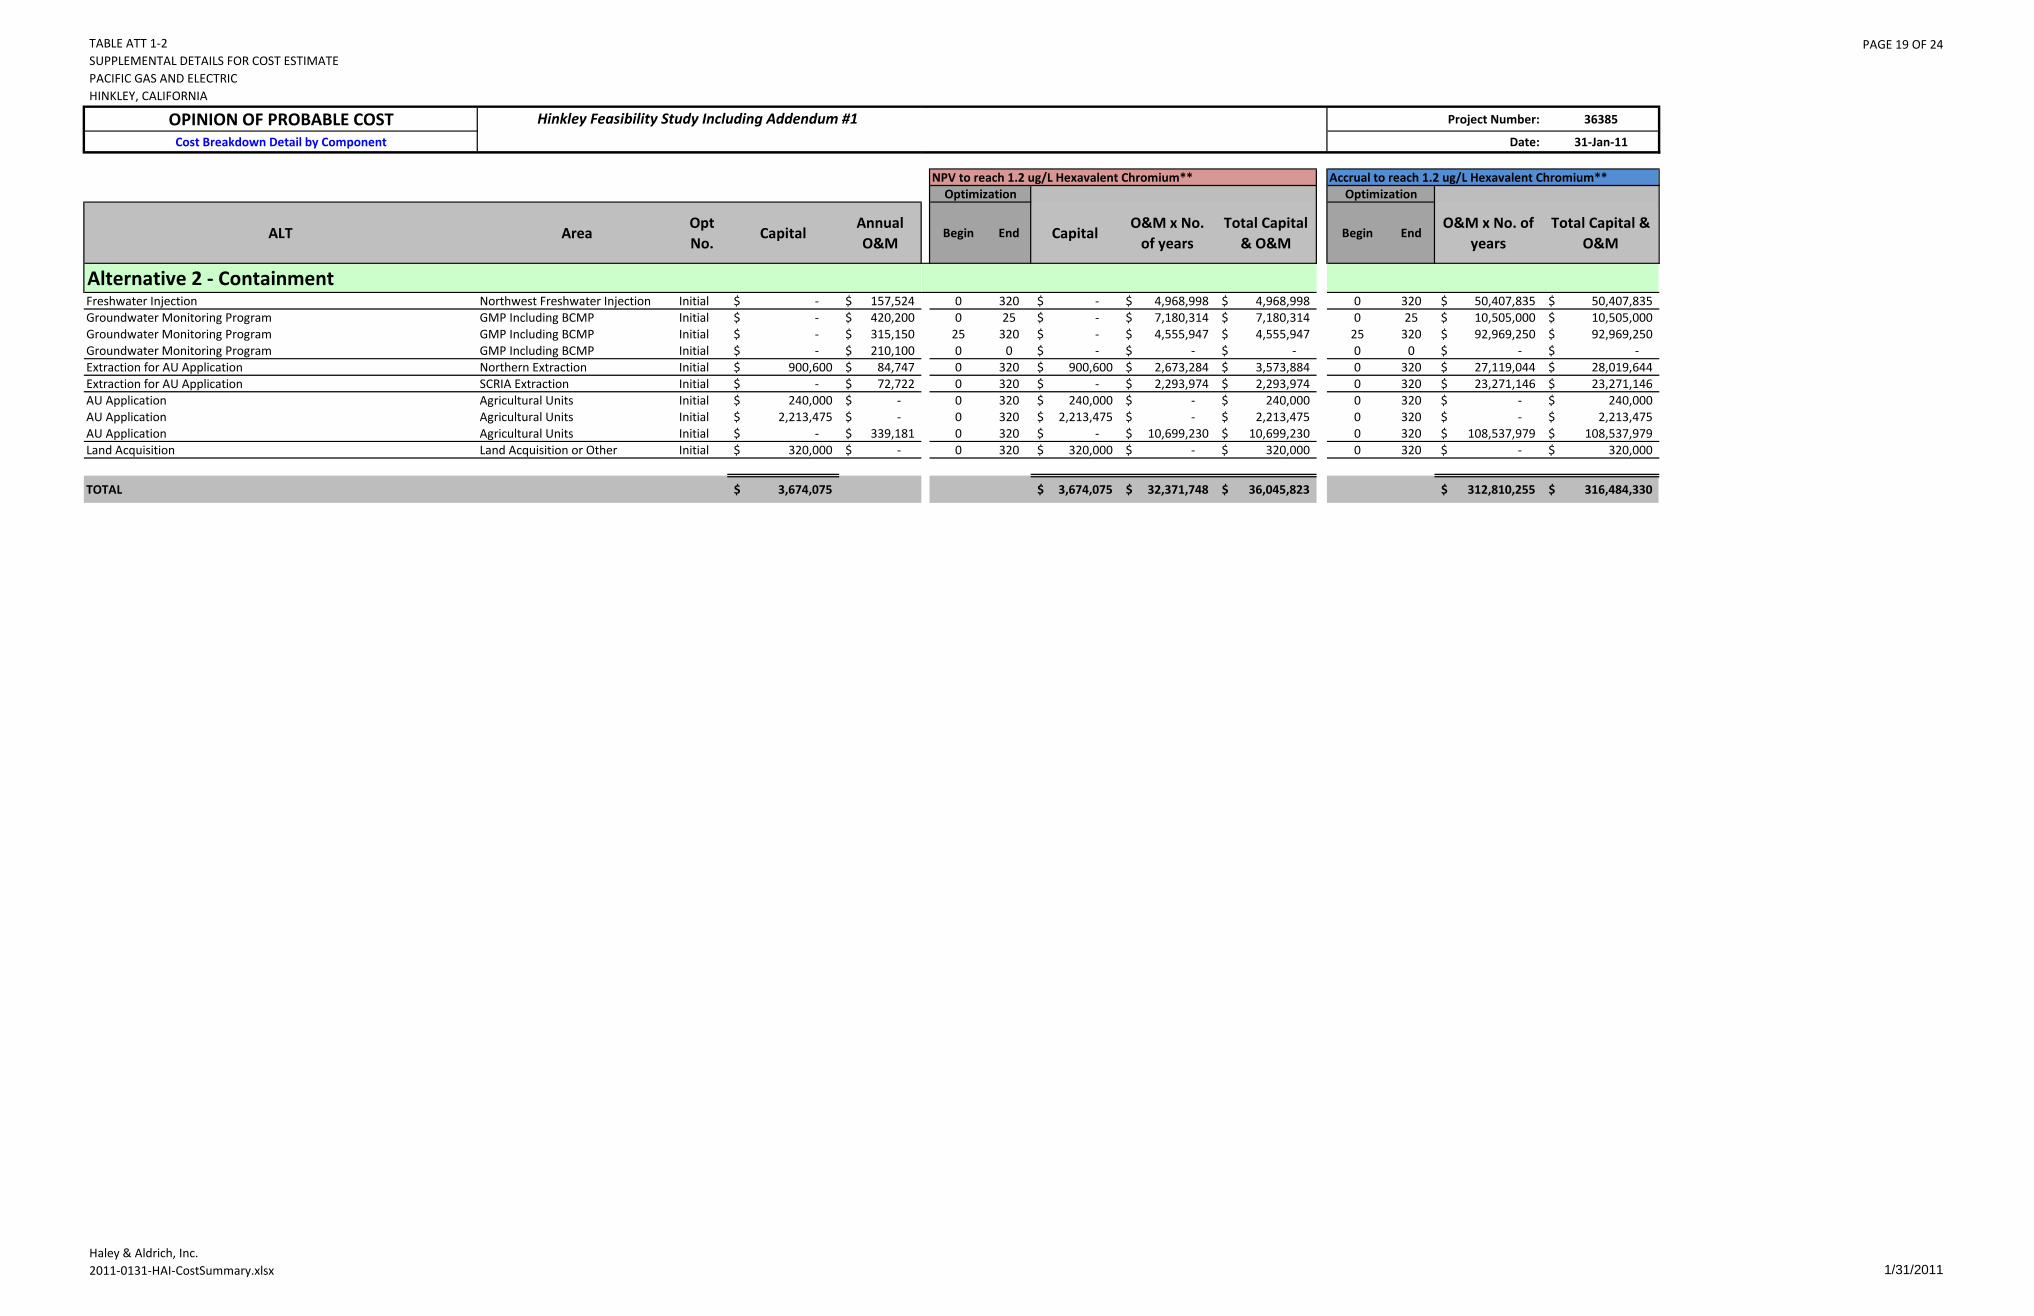
TABLE ATT 1-2SUPPLEMENTAL DETAILS FOR COST ESTIMATEPACIFIC GAS AND ELECTRICHINKLEY, CALIFORNIA
PAGE 19 OF 24
Haley & Aldrich, Inc.2011-0131-HAI-CostSummary.xlsx 1/31/2011
OPINION OF PROBABLE COSTCost Breakdown Detail by Component
ALT AreaOpt No.
CapitalAnnual O&M
Alternative 2 - ContainmentFreshwater Injection Northwest Freshwater Injection Initial -$ 157,524$ Groundwater Monitoring Program GMP Including BCMP Initial -$ 420,200$ Groundwater Monitoring Program GMP Including BCMP Initial -$ 315,150$ Groundwater Monitoring Program GMP Including BCMP Initial -$ 210,100$ Extraction for AU Application Northern Extraction Initial 900,600$ 84,747$ Extraction for AU Application SCRIA Extraction Initial -$ 72,722$ AU Application Agricultural Units Initial 240,000$ -$ AU Application Agricultural Units Initial 2,213,475$ -$ AU Application Agricultural Units Initial -$ 339,181$ Land Acquisition Land Acquisition or Other Initial 320,000$ -$
TOTAL 3,674,075$
Hinkley Feasibility Study Including Addendum #1 Project Number: 36385
Date: 31-Jan-11
NPV to reach 1.2 ug/L Hexavalent Chromium** Accrual to reach 1.2 ug/L Hexavalent Chromium**Optimization Optimization
Begin End CapitalO&M x No.
of yearsTotal Capital
& O&MBegin End
O&M x No. of years
Total Capital & O&M
0 320 -$ 4,968,998$ 4,968,998$ 0 320 50,407,835$ 50,407,835$ 0 25 -$ 7,180,314$ 7,180,314$ 0 25 10,505,000$ 10,505,000$
25 320 -$ 4,555,947$ 4,555,947$ 25 320 92,969,250$ 92,969,250$ 0 0 -$ -$ -$ 0 0 -$ -$ 0 320 900,600$ 2,673,284$ 3,573,884$ 0 320 27,119,044$ 28,019,644$ 0 320 -$ 2,293,974$ 2,293,974$ 0 320 23,271,146$ 23,271,146$ 0 320 240,000$ -$ 240,000$ 0 320 -$ 240,000$ 0 320 2,213,475$ -$ 2,213,475$ 0 320 -$ 2,213,475$ 0 320 -$ 10,699,230$ 10,699,230$ 0 320 108,537,979$ 108,537,979$ 0 320 320,000$ -$ 320,000$ 0 320 -$ 320,000$
3,674,075$ 32,371,748$ 36,045,823$ 312,810,255$ 316,484,330$

TABLE ATT 1-2SUPPLEMENTAL DETAILS FOR COST ESTIMATEPACIFIC GAS AND ELECTRICHINKLEY, CALIFORNIA
PAGE 20 OF 24
Haley & Aldrich, Inc.2011-0131-HAI-CostSummary.xlsx 1/31/2011
OPINION OF PROBABLE COSTCost Breakdown Detail by Component
ALT AreaOpt No.
CapitalAnnual O&M
Hinkley Feasibility Study Including Addendum #1
Alternative 3 - Plume-Wide In-Situ TreatmentFreshwater Injection Northwest Freshwater Injection Initial -$ 157,524$ Groundwater Monitoring Program GMP Including BCMP Initial -$ 420,200$ Groundwater Monitoring Program GMP Including BCMP Initial -$ 315,150$ Groundwater Monitoring Program GMP Including BCMP Initial -$ 210,100$ Groundwater Extraction Northern Extraction Initial 1,675,800$ 86,455$ Groundwater Extraction SCRIA Extraction Initial -$ 72,722$ Groundwater Extraction DVD Extraction Initial -$ 76,992$ Groundwater Extraction DVD Extraction Opt 1 -$ 76,992$ Groundwater Extraction DVD Extraction Opt 2 -$ 76,992$ Groundwater Extraction DVD Extraction Opt 3 -$ 76,992$ Groundwater Extraction Gorman Extraction Initial -$ 60,024$ Groundwater Extraction Gorman Extraction Opt 1 -$ 60,024$ Groundwater Extraction Gorman Extraction Opt 2 -$ 60,024$ Groundwater Extraction Gorman Extraction Opt 3 -$ 60,024$ Dosed Injection Northern Injection Initial -$ -$ Dosed Injection Northern Injection Opt 1 4,642,022$ 666,354$ Dosed Injection Northern Injection Opt 2 2,024,500$ 742,545$ Dosed Injection Northern Injection Opt 3 -$ 495,898$ Dosed Injection Central Area IRZ / Injection Initial 1,353,685$ 918,288$ Dosed Injection Central Area IRZ / Injection Opt 1 -$ 918,288$ Dosed Injection Central Area IRZ / Injection Opt 2 -$ -$ Dosed Injection Central Area IRZ / Injection Opt 3 -$ -$ Dosed Injection SCRIA / Dosed Injection Initial 2,115,069$ 643,490$ Dosed Injection SCRIA / Dosed Injection Opt 1 -$ 357,888$ Dosed Injection SCRIA / Dosed Injection Opt 2 -$ -$ Dosed Injection SCRIA / Dosed Injection Opt 3 -$ 358,973$ Dosed Injection Source Area IRZ / Injection Initial 3,595,618$ 946,596$ Dosed Injection Source Area IRZ / Injection Opt 1 -$ -$ Dosed Injection Source Area IRZ / Injection Opt 2 -$ -$ Dosed Injection Source Area IRZ / Injection Opt 3 -$ 669,535$ Dosed Injection Northern Plume Fringe Initial -$ 112,201$ Dosed Injection Northern Plume Fringe Opt 1 -$ 112,201$ Dosed Injection Northern Plume Fringe Opt 2 -$ 112,201$ Dosed Injection Northern Plume Fringe Opt 3 -$ 112,201$ Dosed Injection Southeast and East Plume Fringe Initial -$ 168,301$ Dosed Injection Southeast and East Plume Fringe Opt 1 -$ 209,102$ Dosed Injection Southeast and East Plume Fringe Opt 2 -$ 173,401$ Dosed Injection Southeast and East Plume Fringe Opt 3 -$ 173,401$ Dosed Injection Southern Plume Fringe Initial -$ 158,101$ Dosed Injection Southern Plume Fringe Opt 1 -$ 249,902$ Dosed Injection Southern Plume Fringe Opt 2 -$ 249,902$ Dosed Injection Southern Plume Fringe Opt 3 -$ 249,902$
Project Number: 36385
Date: 31-Jan-11
NPV to reach 1.2 ug/L Hexavalent Chromium** Accrual to reach 1.2 ug/L Hexavalent Chromium**Optimization Optimization
Begin End CapitalO&M x No.
of yearsTotal Capital
& O&MBegin End
O&M x No. of years
Total Capital & O&M
0 180 -$ 4,951,169$ 4,951,169$ 0 180 28,354,407$ 28,354,407$ 0 10 -$ 3,553,493$ 3,553,493$ 0 10 4,202,000$ 4,202,000$ 0 0 -$ -$ -$ 0 0 -$ -$
10 180 -$ 4,826,928$ 4,826,928$ 10 180 35,717,000$ 35,717,000$ 0 180 1,675,800$ 2,717,370$ 4,393,170$ 0 180 15,561,867$ 17,237,667$ 0 180 -$ 2,285,743$ 2,285,743$ 0 180 13,090,020$ 13,090,020$ 0 5 -$ 350,895$ 350,895$ 0 5 384,959$ 384,959$ 5 10 -$ 300,200$ 300,200$ 5 10 384,959$ 384,959$
10 15 -$ 256,828$ 256,828$ 10 15 384,959$ 384,959$ 15 180 -$ 1,512,015$ 1,512,015$ 15 180 12,703,653$ 12,703,653$ 0 5 -$ 273,564$ 273,564$ 0 5 300,121$ 300,121$ 5 10 -$ 234,041$ 234,041$ 5 10 300,121$ 300,121$
10 15 -$ 200,228$ 200,228$ 10 15 300,121$ 300,121$ 15 180 -$ 1,178,795$ 1,178,795$ 15 180 9,903,999$ 9,903,999$ 0 5 -$ -$ -$ 0 5 -$ -$ 5 10 3,971,367$ 2,598,188$ 6,569,555$ 5 10 3,331,771$ 7,973,792$
10 15 1,481,779$ 2,476,972$ 3,958,751$ 10 15 3,712,725$ 5,737,225$ 15 180 -$ 9,738,769$ 9,738,769$ 15 180 81,823,199$ 81,823,199$ 0 5 1,353,685$ 4,185,153$ 5,538,838$ 0 5 4,591,438$ 5,945,123$ 5 10 -$ 3,580,504$ 3,580,504$ 5 10 4,591,438$ 4,591,438$
10 15 -$ -$ -$ 10 15 -$ -$ 15 180 -$ -$ -$ 15 180 -$ -$ 0 5 2,115,069$ 2,932,746$ 5,047,815$ 0 5 3,217,450$ 5,332,519$ 5 10 -$ 1,395,444$ 1,395,444$ 5 10 1,789,439$ 1,789,439$
10 15 -$ -$ -$ 10 15 -$ -$ 15 180 -$ 7,049,750$ 7,049,750$ 15 180 59,230,594$ 59,230,594$ 0 5 3,595,618$ 4,314,169$ 7,909,787$ 0 5 4,732,978$ 8,328,596$ 5 10 -$ -$ -$ 5 10 -$ -$
10 15 -$ -$ -$ 10 15 -$ -$ 15 180 -$ 13,148,756$ 13,148,756$ 15 180 110,473,236$ 110,473,236$ 0 5 -$ 511,362$ 511,362$ 0 5 561,004$ 561,004$ 5 10 -$ 437,483$ 437,483$ 5 10 561,004$ 561,004$
10 15 -$ 374,278$ 374,278$ 10 15 561,004$ 561,004$ 15 180 -$ 2,203,473$ 2,203,473$ 15 180 18,513,139$ 18,513,139$ 0 5 -$ 767,043$ 767,043$ 0 5 841,506$ 841,506$ 5 10 -$ 815,310$ 815,310$ 5 10 1,045,508$ 1,045,508$
10 15 -$ 578,430$ 578,430$ 10 15 867,007$ 867,007$ 15 180 -$ 3,405,367$ 3,405,367$ 15 180 28,611,215$ 28,611,215$ 0 5 -$ 720,556$ 720,556$ 0 5 790,506$ 790,506$ 5 10 -$ 974,395$ 974,395$ 5 10 1,249,509$ 1,249,509$
10 15 -$ 833,619$ 833,619$ 10 15 1,249,509$ 1,249,509$ 15 180 -$ 4,907,735$ 4,907,735$ 15 180 41,233,810$ 41,233,810$
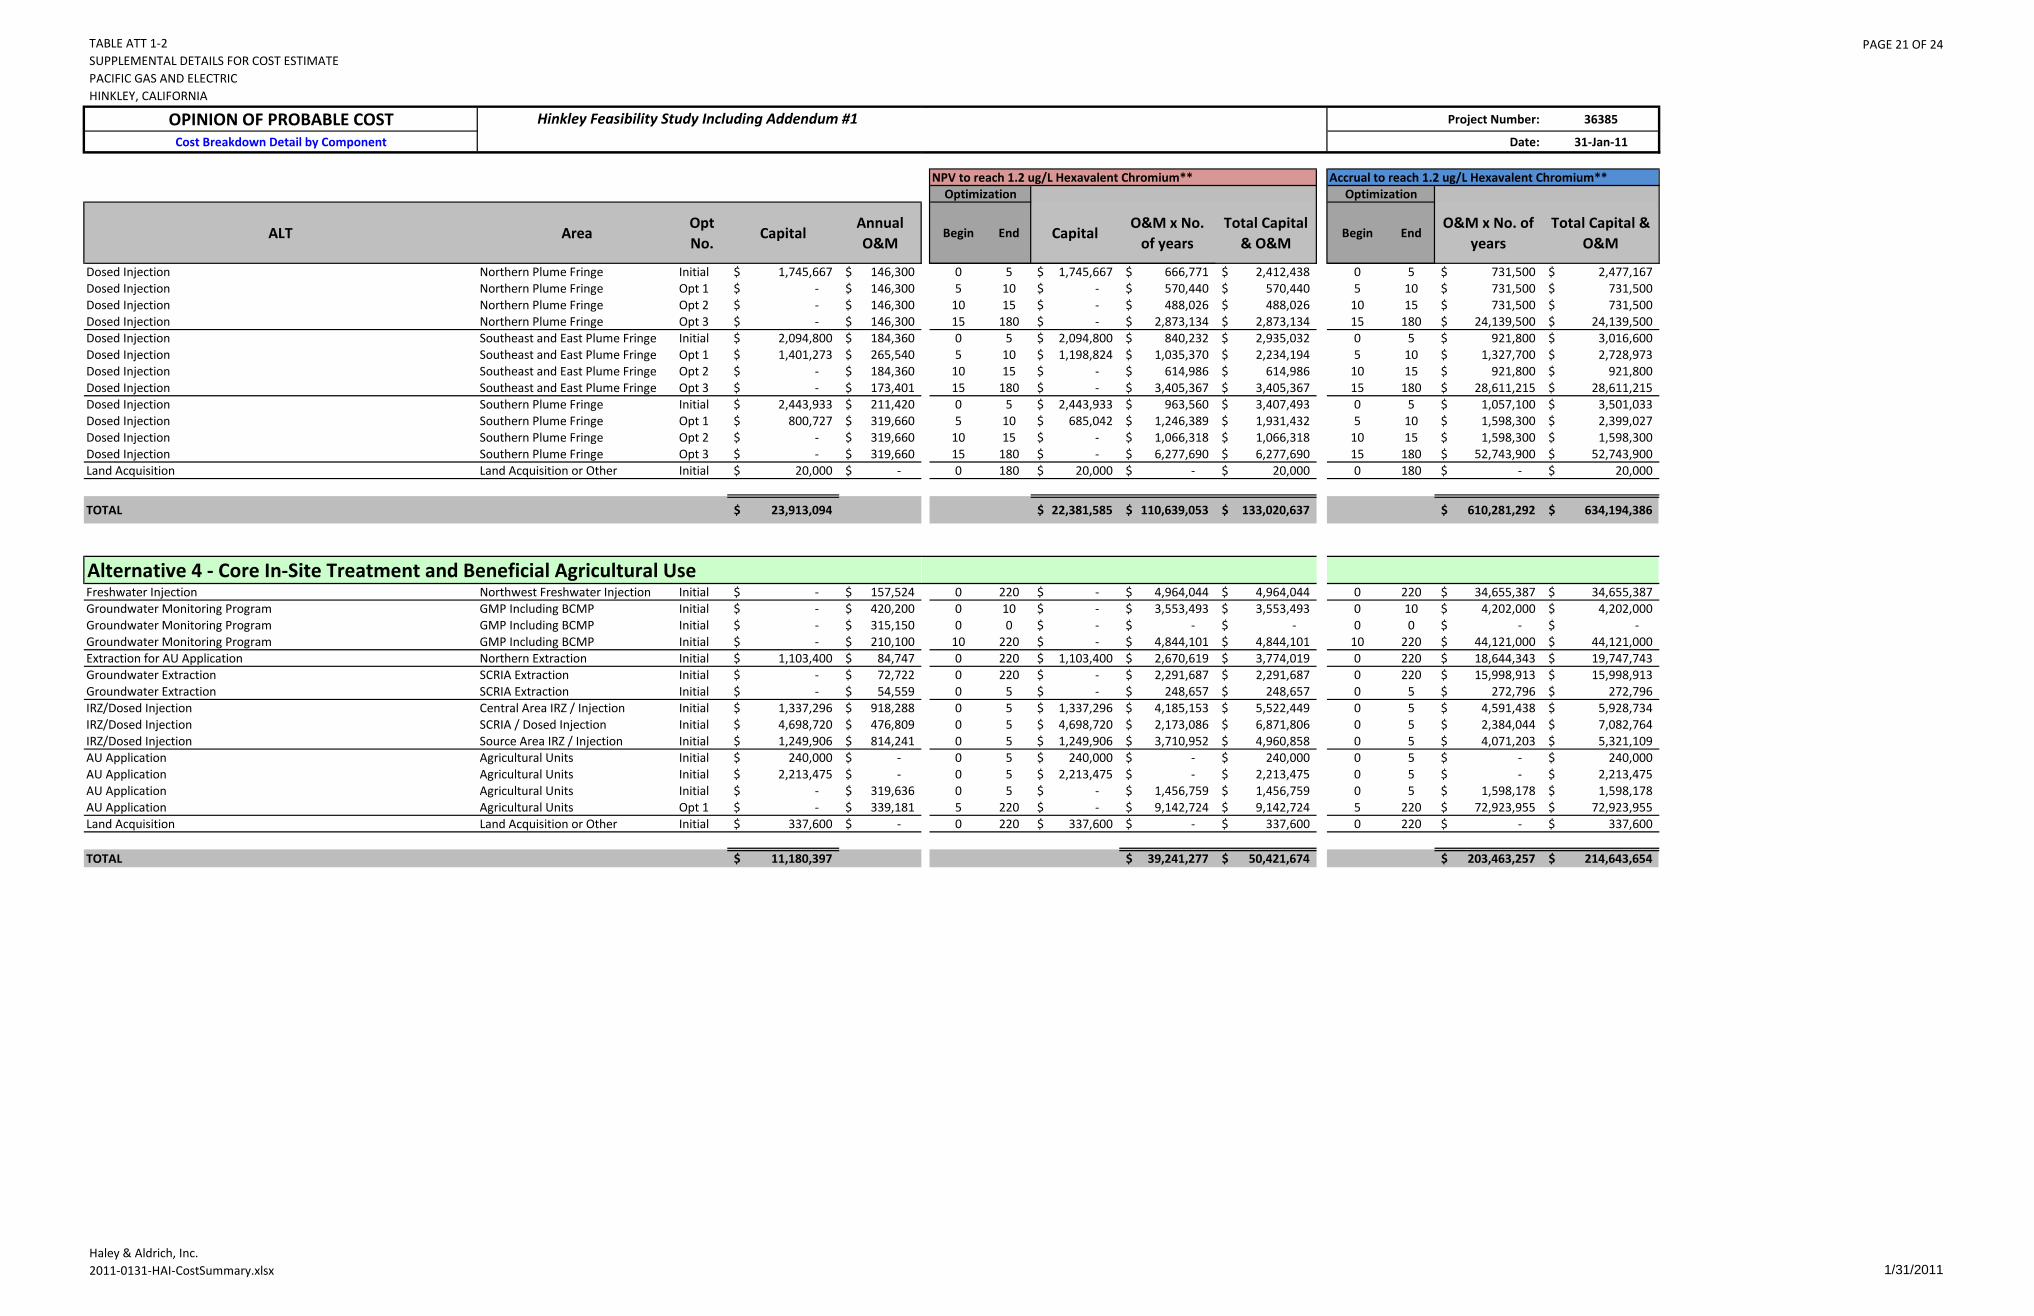
TABLE ATT 1-2SUPPLEMENTAL DETAILS FOR COST ESTIMATEPACIFIC GAS AND ELECTRICHINKLEY, CALIFORNIA
PAGE 21 OF 24
Haley & Aldrich, Inc.2011-0131-HAI-CostSummary.xlsx 1/31/2011
OPINION OF PROBABLE COSTCost Breakdown Detail by Component
ALT AreaOpt No.
CapitalAnnual O&M
Hinkley Feasibility Study Including Addendum #1
Dosed Injection Northern Plume Fringe Initial 1,745,667$ 146,300$ Dosed Injection Northern Plume Fringe Opt 1 -$ 146,300$ Dosed Injection Northern Plume Fringe Opt 2 -$ 146,300$ Dosed Injection Northern Plume Fringe Opt 3 -$ 146,300$ Dosed Injection Southeast and East Plume Fringe Initial 2,094,800$ 184,360$ Dosed Injection Southeast and East Plume Fringe Opt 1 1,401,273$ 265,540$ Dosed Injection Southeast and East Plume Fringe Opt 2 -$ 184,360$ Dosed Injection Southeast and East Plume Fringe Opt 3 -$ 173,401$ Dosed Injection Southern Plume Fringe Initial 2,443,933$ 211,420$ Dosed Injection Southern Plume Fringe Opt 1 800,727$ 319,660$ Dosed Injection Southern Plume Fringe Opt 2 -$ 319,660$ Dosed Injection Southern Plume Fringe Opt 3 -$ 319,660$ Land Acquisition Land Acquisition or Other Initial 20,000$ -$
TOTAL 23,913,094$
Alternative 4 - Core In-Site Treatment and Beneficial Agricultural UseFreshwater Injection Northwest Freshwater Injection Initial -$ 157,524$ Groundwater Monitoring Program GMP Including BCMP Initial -$ 420,200$ Groundwater Monitoring Program GMP Including BCMP Initial -$ 315,150$ Groundwater Monitoring Program GMP Including BCMP Initial -$ 210,100$ Extraction for AU Application Northern Extraction Initial 1,103,400$ 84,747$ Groundwater Extraction SCRIA Extraction Initial -$ 72,722$ Groundwater Extraction SCRIA Extraction Initial -$ 54,559$ IRZ/Dosed Injection Central Area IRZ / Injection Initial 1,337,296$ 918,288$ IRZ/Dosed Injection SCRIA / Dosed Injection Initial 4,698,720$ 476,809$ IRZ/Dosed Injection Source Area IRZ / Injection Initial 1,249,906$ 814,241$ AU Application Agricultural Units Initial 240,000$ -$ AU Application Agricultural Units Initial 2,213,475$ -$ AU Application Agricultural Units Initial -$ 319,636$ AU Application Agricultural Units Opt 1 -$ 339,181$ Land Acquisition Land Acquisition or Other Initial 337,600$ -$
TOTAL 11,180,397$
Project Number: 36385
Date: 31-Jan-11
NPV to reach 1.2 ug/L Hexavalent Chromium** Accrual to reach 1.2 ug/L Hexavalent Chromium**Optimization Optimization
Begin End CapitalO&M x No.
of yearsTotal Capital
& O&MBegin End
O&M x No. of years
Total Capital & O&M
0 5 1,745,667$ 666,771$ 2,412,438$ 0 5 731,500$ 2,477,167$ 5 10 -$ 570,440$ 570,440$ 5 10 731,500$ 731,500$
10 15 -$ 488,026$ 488,026$ 10 15 731,500$ 731,500$ 15 180 -$ 2,873,134$ 2,873,134$ 15 180 24,139,500$ 24,139,500$ 0 5 2,094,800$ 840,232$ 2,935,032$ 0 5 921,800$ 3,016,600$ 5 10 1,198,824$ 1,035,370$ 2,234,194$ 5 10 1,327,700$ 2,728,973$
10 15 -$ 614,986$ 614,986$ 10 15 921,800$ 921,800$ 15 180 -$ 3,405,367$ 3,405,367$ 15 180 28,611,215$ 28,611,215$ 0 5 2,443,933$ 963,560$ 3,407,493$ 0 5 1,057,100$ 3,501,033$ 5 10 685,042$ 1,246,389$ 1,931,432$ 5 10 1,598,300$ 2,399,027$
10 15 -$ 1,066,318$ 1,066,318$ 10 15 1,598,300$ 1,598,300$ 15 180 -$ 6,277,690$ 6,277,690$ 15 180 52,743,900$ 52,743,900$ 0 180 20,000$ -$ 20,000$ 0 180 -$ 20,000$
22,381,585$ 110,639,053$ 133,020,637$ 610,281,292$ 634,194,386$
0 220 -$ 4,964,044$ 4,964,044$ 0 220 34,655,387$ 34,655,387$ 0 10 -$ 3,553,493$ 3,553,493$ 0 10 4,202,000$ 4,202,000$ 0 0 -$ -$ -$ 0 0 -$ -$
10 220 -$ 4,844,101$ 4,844,101$ 10 220 44,121,000$ 44,121,000$ 0 220 1,103,400$ 2,670,619$ 3,774,019$ 0 220 18,644,343$ 19,747,743$ 0 220 -$ 2,291,687$ 2,291,687$ 0 220 15,998,913$ 15,998,913$ 0 5 -$ 248,657$ 248,657$ 0 5 272,796$ 272,796$ 0 5 1,337,296$ 4,185,153$ 5,522,449$ 0 5 4,591,438$ 5,928,734$ 0 5 4,698,720$ 2,173,086$ 6,871,806$ 0 5 2,384,044$ 7,082,764$ 0 5 1,249,906$ 3,710,952$ 4,960,858$ 0 5 4,071,203$ 5,321,109$ 0 5 240,000$ -$ 240,000$ 0 5 -$ 240,000$ 0 5 2,213,475$ -$ 2,213,475$ 0 5 -$ 2,213,475$ 0 5 -$ 1,456,759$ 1,456,759$ 0 5 1,598,178$ 1,598,178$ 5 220 -$ 9,142,724$ 9,142,724$ 5 220 72,923,955$ 72,923,955$ 0 220 337,600$ -$ 337,600$ 0 220 -$ 337,600$
39,241,277$ 50,421,674$ 203,463,257$ 214,643,654$
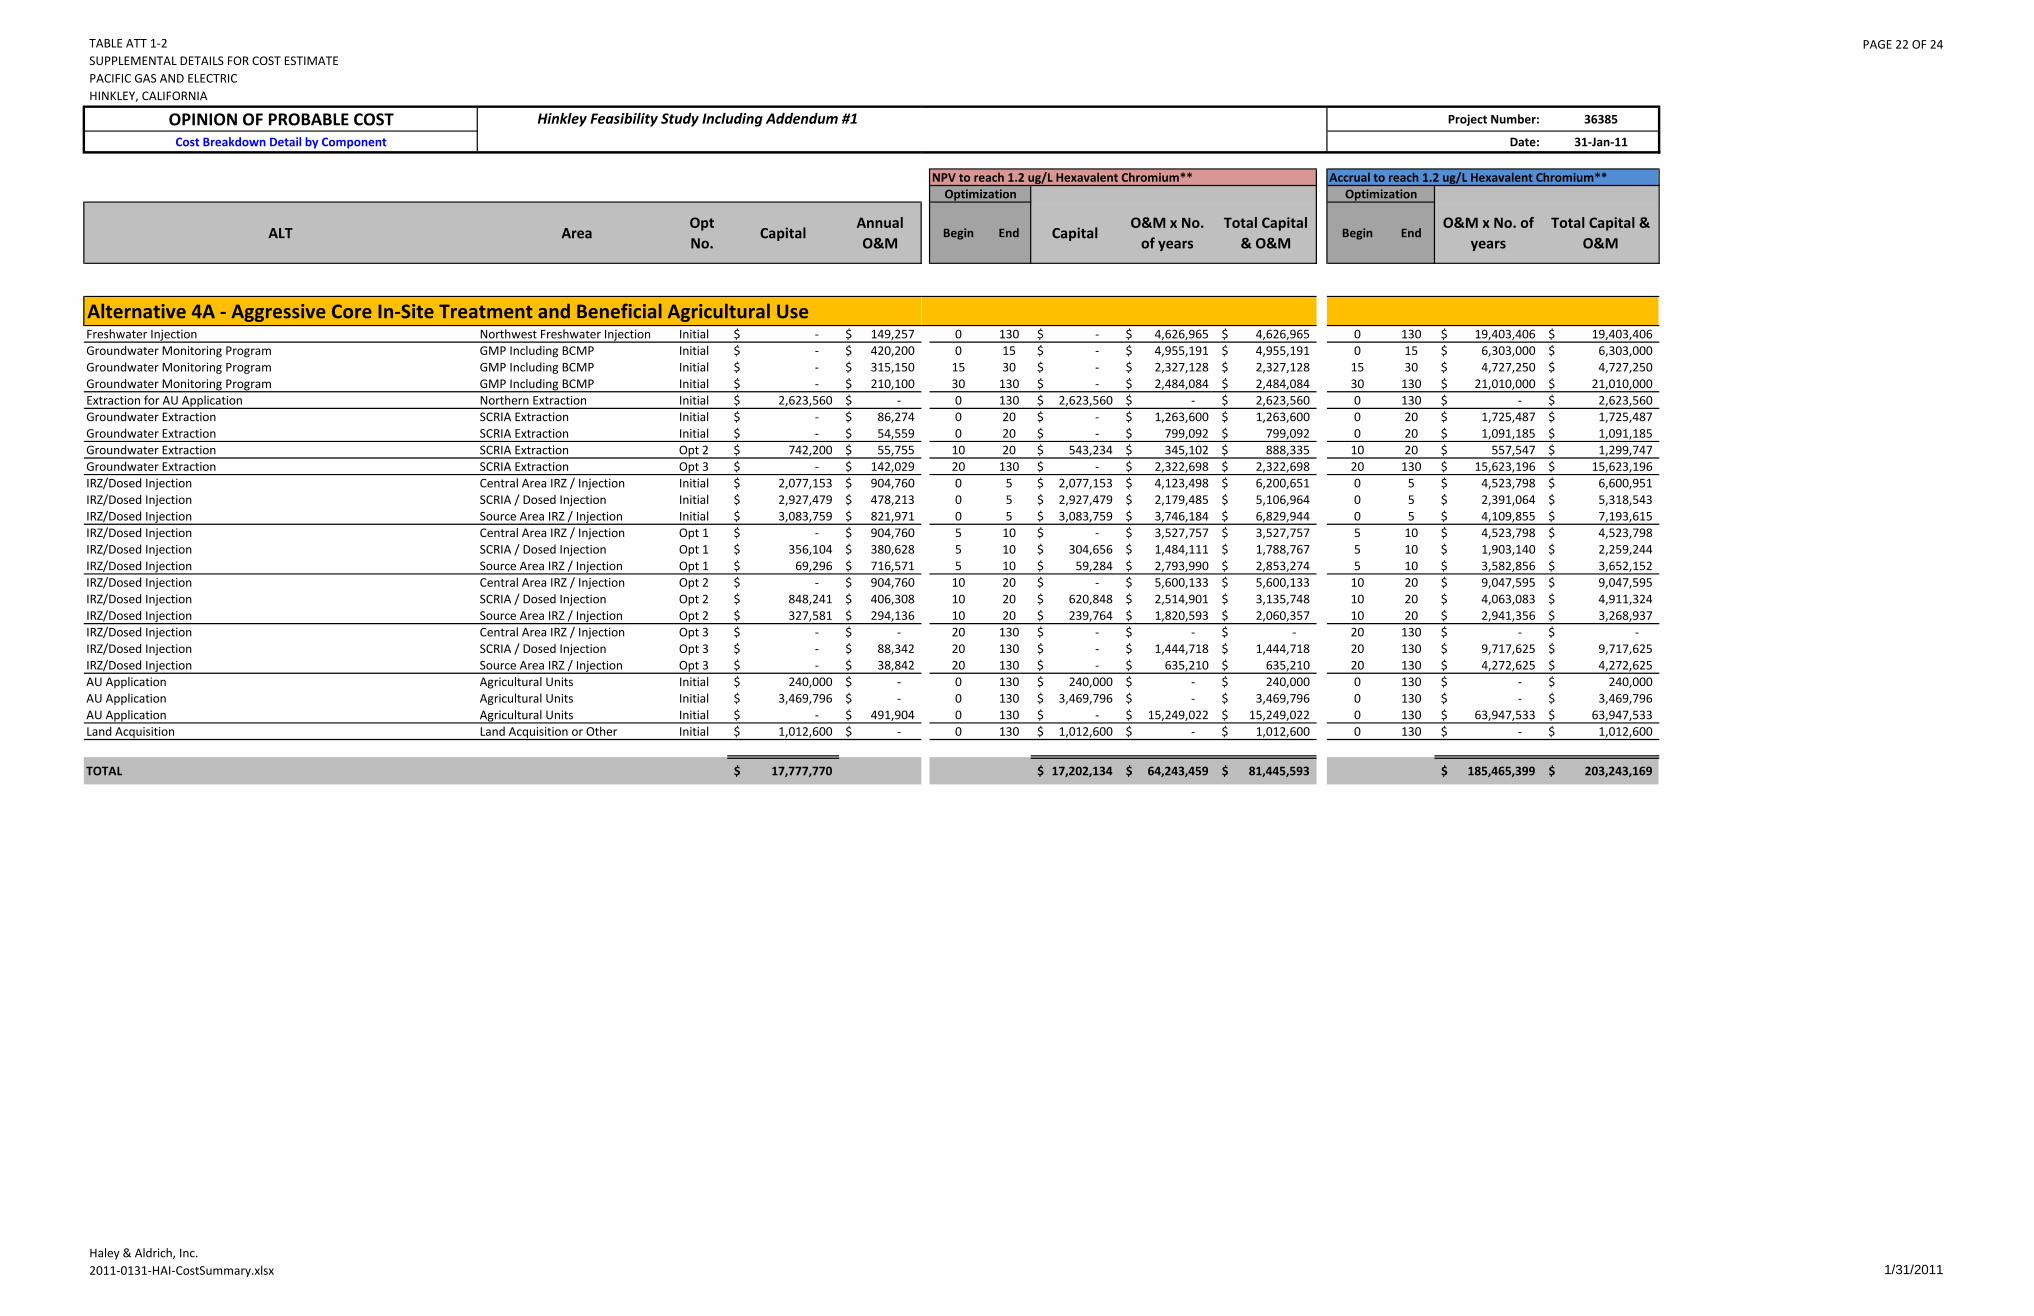
TABLE ATT 1-2SUPPLEMENTAL DETAILS FOR COST ESTIMATEPACIFIC GAS AND ELECTRICHINKLEY, CALIFORNIA
PAGE 22 OF 24
Haley & Aldrich, Inc.2011-0131-HAI-CostSummary.xlsx 1/31/2011
OPINION OF PROBABLE COSTCost Breakdown Detail by Component
ALT AreaOpt No.
CapitalAnnual O&M
Hinkley Feasibility Study Including Addendum #1
Alternative 4A - Aggressive Core In-Site Treatment and Beneficial Agricultural UseFreshwater Injection Northwest Freshwater Injection Initial -$ 149,257$ Groundwater Monitoring Program GMP Including BCMP Initial -$ 420,200$ Groundwater Monitoring Program GMP Including BCMP Initial -$ 315,150$ Groundwater Monitoring Program GMP Including BCMP Initial -$ 210,100$ Extraction for AU Application Northern Extraction Initial 2,623,560$ -$ Groundwater Extraction SCRIA Extraction Initial -$ 86,274$ Groundwater Extraction SCRIA Extraction Initial -$ 54,559$ Groundwater Extraction SCRIA Extraction Opt 2 742,200$ 55,755$ Groundwater Extraction SCRIA Extraction Opt 3 -$ 142,029$ IRZ/Dosed Injection Central Area IRZ / Injection Initial 2,077,153$ 904,760$ IRZ/Dosed Injection SCRIA / Dosed Injection Initial 2,927,479$ 478,213$ IRZ/Dosed Injection Source Area IRZ / Injection Initial 3,083,759$ 821,971$ IRZ/Dosed Injection Central Area IRZ / Injection Opt 1 -$ 904,760$ IRZ/Dosed Injection SCRIA / Dosed Injection Opt 1 356,104$ 380,628$ IRZ/Dosed Injection Source Area IRZ / Injection Opt 1 69,296$ 716,571$ IRZ/Dosed Injection Central Area IRZ / Injection Opt 2 -$ 904,760$ IRZ/Dosed Injection SCRIA / Dosed Injection Opt 2 848,241$ 406,308$ IRZ/Dosed Injection Source Area IRZ / Injection Opt 2 327,581$ 294,136$ IRZ/Dosed Injection Central Area IRZ / Injection Opt 3 -$ -$ IRZ/Dosed Injection SCRIA / Dosed Injection Opt 3 -$ 88,342$ IRZ/Dosed Injection Source Area IRZ / Injection Opt 3 -$ 38,842$ AU Application Agricultural Units Initial 240,000$ -$ AU Application Agricultural Units Initial 3,469,796$ -$ AU Application Agricultural Units Initial -$ 491,904$ Land Acquisition Land Acquisition or Other Initial 1,012,600$ -$
TOTAL 17,777,770$
Project Number: 36385
Date: 31-Jan-11
NPV to reach 1.2 ug/L Hexavalent Chromium** Accrual to reach 1.2 ug/L Hexavalent Chromium**Optimization Optimization
Begin End CapitalO&M x No.
of yearsTotal Capital
& O&MBegin End
O&M x No. of years
Total Capital & O&M
0 130 -$ 4,626,965$ 4,626,965$ 0 130 19,403,406$ 19,403,406$ 0 15 -$ 4,955,191$ 4,955,191$ 0 15 6,303,000$ 6,303,000$
15 30 -$ 2,327,128$ 2,327,128$ 15 30 4,727,250$ 4,727,250$ 30 130 -$ 2,484,084$ 2,484,084$ 30 130 21,010,000$ 21,010,000$ 0 130 2,623,560$ -$ 2,623,560$ 0 130 -$ 2,623,560$ 0 20 -$ 1,263,600$ 1,263,600$ 0 20 1,725,487$ 1,725,487$ 0 20 -$ 799,092$ 799,092$ 0 20 1,091,185$ 1,091,185$
10 20 543,234$ 345,102$ 888,335$ 10 20 557,547$ 1,299,747$ 20 130 -$ 2,322,698$ 2,322,698$ 20 130 15,623,196$ 15,623,196$ 0 5 2,077,153$ 4,123,498$ 6,200,651$ 0 5 4,523,798$ 6,600,951$ 0 5 2,927,479$ 2,179,485$ 5,106,964$ 0 5 2,391,064$ 5,318,543$ 0 5 3,083,759$ 3,746,184$ 6,829,944$ 0 5 4,109,855$ 7,193,615$ 5 10 -$ 3,527,757$ 3,527,757$ 5 10 4,523,798$ 4,523,798$ 5 10 304,656$ 1,484,111$ 1,788,767$ 5 10 1,903,140$ 2,259,244$ 5 10 59,284$ 2,793,990$ 2,853,274$ 5 10 3,582,856$ 3,652,152$
10 20 -$ 5,600,133$ 5,600,133$ 10 20 9,047,595$ 9,047,595$ 10 20 620,848$ 2,514,901$ 3,135,748$ 10 20 4,063,083$ 4,911,324$ 10 20 239,764$ 1,820,593$ 2,060,357$ 10 20 2,941,356$ 3,268,937$ 20 130 -$ -$ -$ 20 130 -$ -$ 20 130 -$ 1,444,718$ 1,444,718$ 20 130 9,717,625$ 9,717,625$ 20 130 -$ 635,210$ 635,210$ 20 130 4,272,625$ 4,272,625$ 0 130 240,000$ -$ 240,000$ 0 130 -$ 240,000$ 0 130 3,469,796$ -$ 3,469,796$ 0 130 -$ 3,469,796$ 0 130 -$ 15,249,022$ 15,249,022$ 0 130 63,947,533$ 63,947,533$ 0 130 1,012,600$ -$ 1,012,600$ 0 130 -$ 1,012,600$
17,202,134$ 64,243,459$ 81,445,593$ 185,465,399$ 203,243,169$

TABLE ATT 1-2SUPPLEMENTAL DETAILS FOR COST ESTIMATEPACIFIC GAS AND ELECTRICHINKLEY, CALIFORNIA
PAGE 23 OF 24
Haley & Aldrich, Inc.2011-0131-HAI-CostSummary.xlsx 1/31/2011
OPINION OF PROBABLE COSTCost Breakdown Detail by Component
ALT AreaOpt No.
CapitalAnnual O&M
Hinkley Feasibility Study Including Addendum #1
Alternative 5 - Plume-Wide Pump and TreatFreshwater Injection Northwest Freshwater Injection Initial -$ 157,524$ Groundwater Monitoring Program GMP Including BCMP Initial -$ 420,200$ Groundwater Monitoring Program GMP Including BCMP Initial -$ 315,150$ Groundwater Monitoring Program GMP Including BCMP Initial -$ 210,100$ Groundwater Extraction Northern Extraction Initial 1,675,800$ 84,747$ Groundwater Extraction SCRIA Extraction Initial -$ 72,722$ Groundwater Extraction DVD Extraction Initial -$ 73,576$ Groundwater Extraction DVD Extraction Opt 1 -$ 73,576$ Groundwater Extraction DVD Extraction Opt 2 -$ 73,576$ Groundwater Extraction Gorman Extraction Initial -$ 58,316$ Groundwater Extraction Gorman Extraction Opt 1 -$ 58,316$ Groundwater Extraction Gorman Extraction Opt 2 -$ 58,316$ Groundwater Extraction Ranch or Other Extraction Initial 3,202,844$ 126,247$ Groundwater Extraction Ranch or Other Extraction Opt 1 677,400$ 126,247$ Groundwater Extraction Ranch or Other Extraction Opt 2 885,600$ 126,247$ Treated Injection Northern Plume Fringe Initial 1,526,995$ 146,300$ Treated Injection Northern Plume Fringe Opt 1 -$ 146,300$ Treated Injection Northern Plume Fringe Opt 2 -$ 146,300$ Treated Injection Southeast and East Plume Fringe Initial 6,718,776$ 617,320$ Treated Injection Southeast and East Plume Fringe Opt 1 -$ 617,320$ Treated Injection Southeast and East Plume Fringe Opt 2 -$ 617,320$ Treated Injection Southern Plume Fringe Initial 3,359,388$ 319,660$ Treated Injection Southern Plume Fringe Opt 1 -$ 319,660$ Treated Injection Southern Plume Fringe Opt 2 -$ 319,660$ Treated Injection Southwest Plume Fringe Initial 916,197$ 92,180$ Treated Injection Southwest Plume Fringe Opt 1 -$ 92,180$ Treated Injection Southwest Plume Fringe Opt 2 -$ 92,180$ Groundwater Treatment Ex-Situ Treatment (Chem Precip) Initial 8,012,515$ 4,130,732$ Land Acquisition Land Acquisition or Other Initial 454,000$ -$
TOTAL 27,429,515$
Project Number: 36385
Date: 31-Jan-11
NPV to reach 1.2 ug/L Hexavalent Chromium** Accrual to reach 1.2 ug/L Hexavalent Chromium**Optimization Optimization
Begin End CapitalO&M x No.
of yearsTotal Capital
& O&MBegin End
O&M x No. of years
Total Capital & O&M
0 210 -$ 4,962,146$ 4,962,146$ 0 210 33,080,142$ 33,080,142$ 0 10 -$ 3,553,493$ 3,553,493$ 0 10 4,202,000$ 4,202,000$ 0 0 -$ -$ -$ 0 0 -$ -$
10 210 -$ 4,841,570$ 4,841,570$ 10 210 42,020,000$ 42,020,000$ 0 210 1,675,800$ 2,669,598$ 4,345,398$ 0 210 17,796,873$ 19,472,673$ 0 210 -$ 2,290,811$ 2,290,811$ 0 210 15,271,690$ 15,271,690$ 0 10 -$ 622,210$ 622,210$ 0 10 735,762$ 735,762$
10 15 -$ 245,435$ 245,435$ 10 15 367,881$ 367,881$ 15 210 -$ 1,450,065$ 1,450,065$ 15 210 14,347,366$ 14,347,366$ 0 10 -$ 493,163$ 493,163$ 0 10 583,164$ 583,164$
10 15 -$ 194,531$ 194,531$ 10 15 291,582$ 291,582$ 15 210 -$ 1,149,320$ 1,149,320$ 15 210 11,371,704$ 11,371,704$ 0 10 3,202,844$ 1,067,631$ 4,270,475$ 0 10 1,262,472$ 4,465,316$
10 15 495,805$ 421,134$ 916,939$ 10 15 631,236$ 1,308,636$ 15 210 554,544$ 2,488,122$ 3,042,666$ 15 210 24,618,206$ 25,503,806$ 0 10 1,526,995$ 1,237,211$ 2,764,206$ 0 10 1,463,000$ 2,989,995$
10 15 -$ 488,026$ 488,026$ 10 15 731,500$ 731,500$ 15 210 -$ 2,883,329$ 2,883,329$ 15 210 28,528,500$ 28,528,500$ 0 10 6,718,776$ 5,220,473$ 11,939,249$ 0 10 6,173,200$ 12,891,976$
10 15 -$ 2,059,248$ 2,059,248$ 10 15 3,086,600$ 3,086,600$ 15 210 -$ 12,166,349$ 12,166,349$ 15 210 120,377,400$ 120,377,400$ 0 10 3,359,388$ 2,703,260$ 6,062,648$ 0 10 3,196,600$ 6,555,988$
10 15 -$ 1,066,318$ 1,066,318$ 10 15 1,598,300$ 1,598,300$ 15 210 -$ 6,299,966$ 6,299,966$ 15 210 62,333,700$ 62,333,700$ 0 10 916,197$ 779,536$ 1,695,733$ 0 10 921,800$ 1,837,997$
10 15 -$ 307,493$ 307,493$ 10 15 460,900$ 460,900$ 15 210 -$ 1,816,714$ 1,816,714$ 15 210 17,975,100$ 17,975,100$ 0 210 8,012,515$ 130,121,346$ 138,133,861$ 0 210 867,453,822$ 875,466,337$ 0 210 454,000$ -$ 454,000$ 0 210 -$ 454,000$
26,916,864$ 193,598,496$ 220,515,361$ 1,280,880,500$ 1,308,310,015$
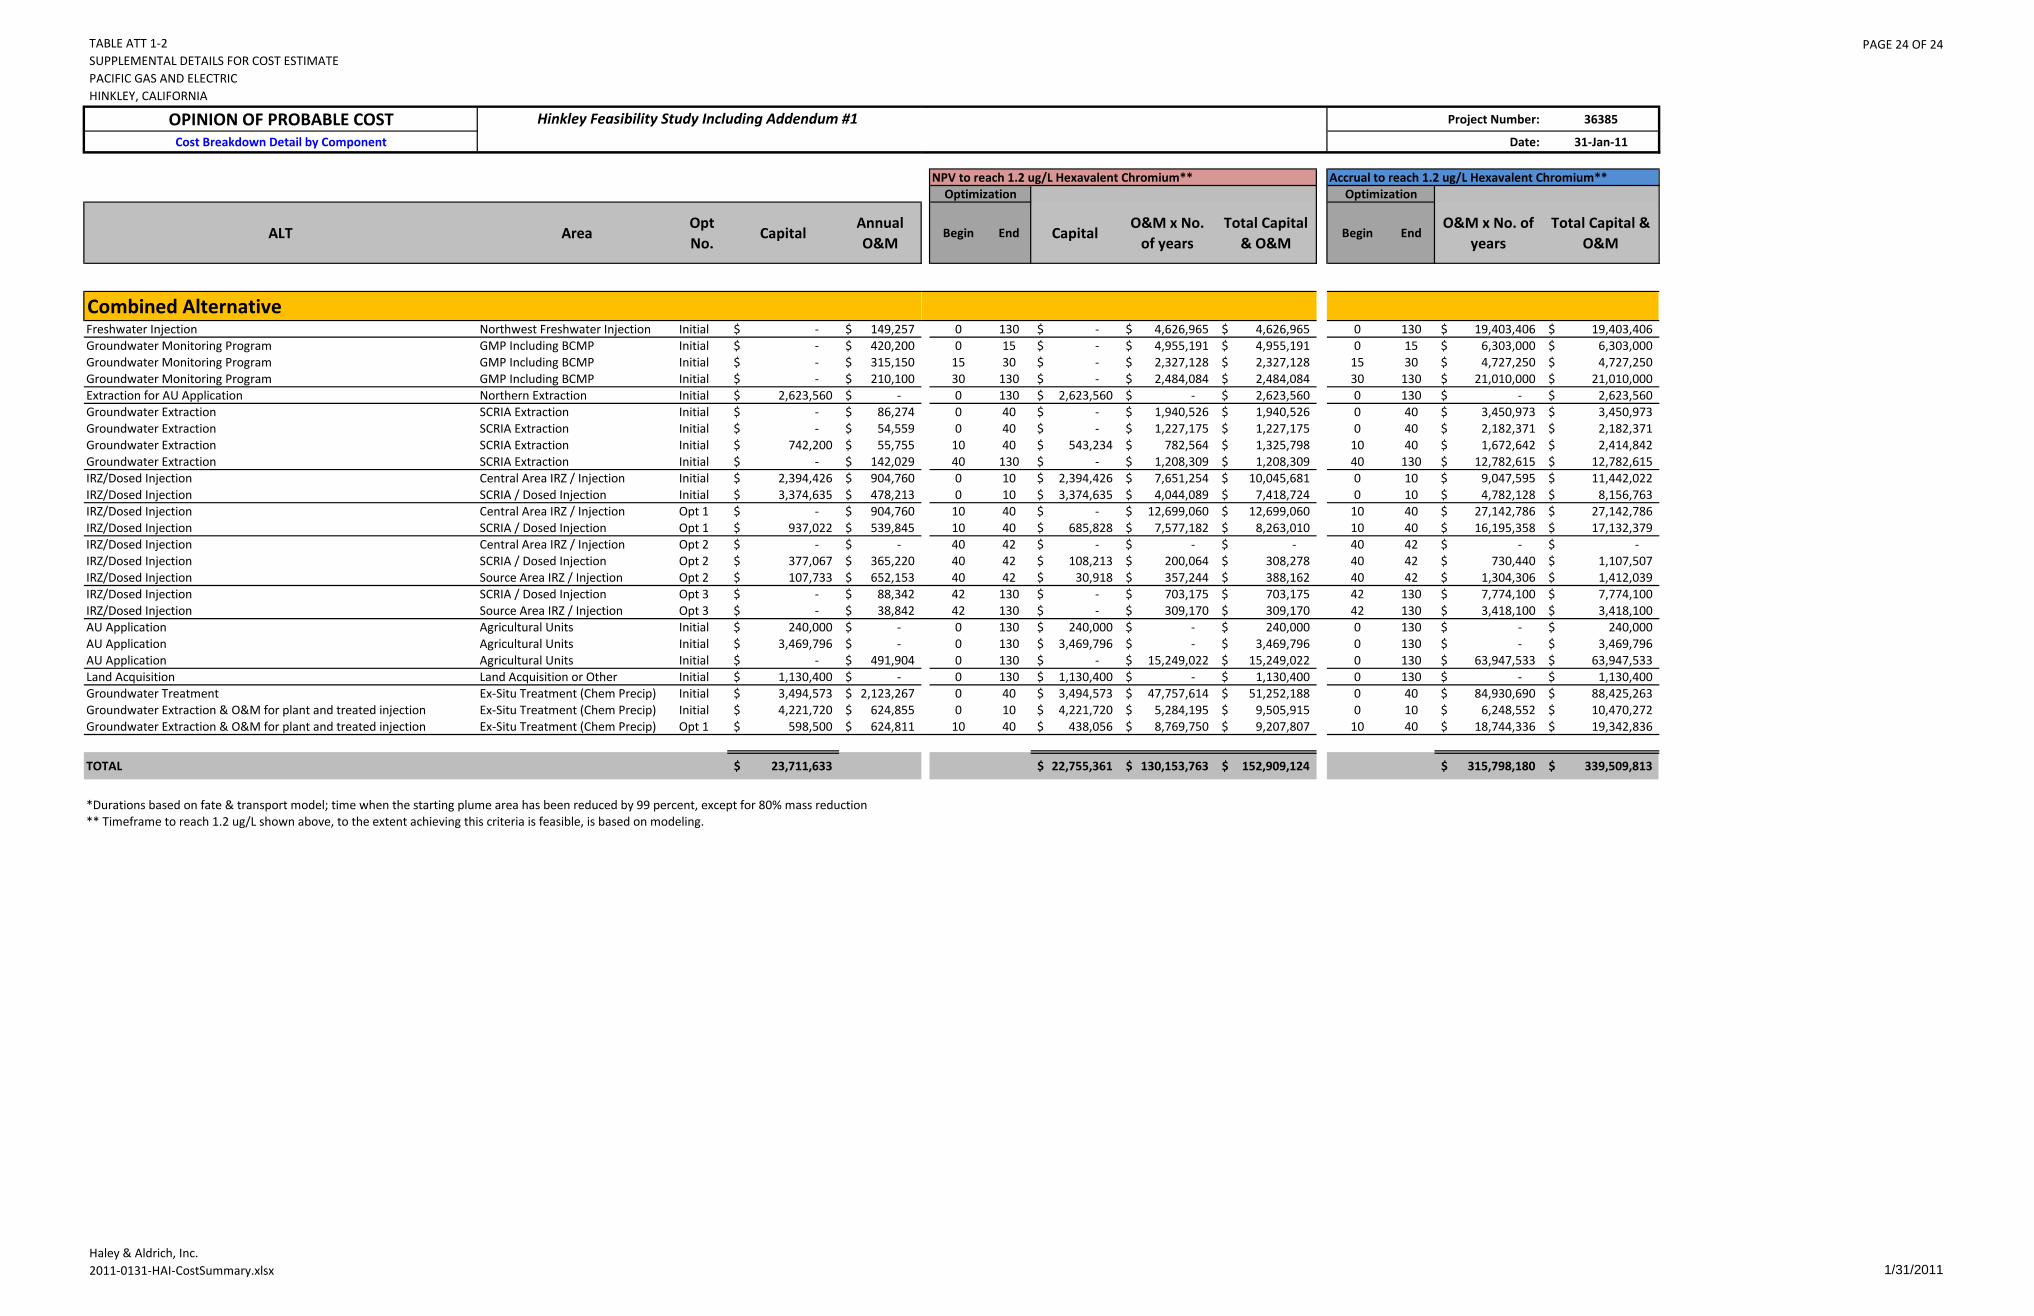
TABLE ATT 1-2SUPPLEMENTAL DETAILS FOR COST ESTIMATEPACIFIC GAS AND ELECTRICHINKLEY, CALIFORNIA
PAGE 24 OF 24
Haley & Aldrich, Inc.2011-0131-HAI-CostSummary.xlsx 1/31/2011
OPINION OF PROBABLE COSTCost Breakdown Detail by Component
ALT AreaOpt No.
CapitalAnnual O&M
Hinkley Feasibility Study Including Addendum #1
Combined AlternativeFreshwater Injection Northwest Freshwater Injection Initial -$ 149,257$ Groundwater Monitoring Program GMP Including BCMP Initial -$ 420,200$ Groundwater Monitoring Program GMP Including BCMP Initial -$ 315,150$ Groundwater Monitoring Program GMP Including BCMP Initial -$ 210,100$ Extraction for AU Application Northern Extraction Initial 2,623,560$ -$ Groundwater Extraction SCRIA Extraction Initial -$ 86,274$ Groundwater Extraction SCRIA Extraction Initial -$ 54,559$ Groundwater Extraction SCRIA Extraction Initial 742,200$ 55,755$ Groundwater Extraction SCRIA Extraction Initial -$ 142,029$ IRZ/Dosed Injection Central Area IRZ / Injection Initial 2,394,426$ 904,760$ IRZ/Dosed Injection SCRIA / Dosed Injection Initial 3,374,635$ 478,213$ IRZ/Dosed Injection Central Area IRZ / Injection Opt 1 -$ 904,760$ IRZ/Dosed Injection SCRIA / Dosed Injection Opt 1 937,022$ 539,845$ IRZ/Dosed Injection Central Area IRZ / Injection Opt 2 -$ -$ IRZ/Dosed Injection SCRIA / Dosed Injection Opt 2 377,067$ 365,220$ IRZ/Dosed Injection Source Area IRZ / Injection Opt 2 107,733$ 652,153$ IRZ/Dosed Injection SCRIA / Dosed Injection Opt 3 -$ 88,342$ IRZ/Dosed Injection Source Area IRZ / Injection Opt 3 -$ 38,842$ AU Application Agricultural Units Initial 240,000$ -$ AU Application Agricultural Units Initial 3,469,796$ -$ AU Application Agricultural Units Initial -$ 491,904$ Land Acquisition Land Acquisition or Other Initial 1,130,400$ -$ Groundwater Treatment Ex-Situ Treatment (Chem Precip) Initial 3,494,573$ 2,123,267$ Groundwater Extraction & O&M for plant and treated injection Ex-Situ Treatment (Chem Precip) Initial 4,221,720$ 624,855$ Groundwater Extraction & O&M for plant and treated injection Ex-Situ Treatment (Chem Precip) Opt 1 598,500$ 624,811$
TOTAL 23,711,633$
** Timeframe to reach 1.2 ug/L shown above, to the extent achieving this criteria is feasible, is based on modeling.*Durations based on fate & transport model; time when the starting plume area has been reduced by 99 percent, except for 80% mass reduction
Project Number: 36385
Date: 31-Jan-11
NPV to reach 1.2 ug/L Hexavalent Chromium** Accrual to reach 1.2 ug/L Hexavalent Chromium**Optimization Optimization
Begin End CapitalO&M x No.
of yearsTotal Capital
& O&MBegin End
O&M x No. of years
Total Capital & O&M
0 130 -$ 4,626,965$ 4,626,965$ 0 130 19,403,406$ 19,403,406$ 0 15 -$ 4,955,191$ 4,955,191$ 0 15 6,303,000$ 6,303,000$
15 30 -$ 2,327,128$ 2,327,128$ 15 30 4,727,250$ 4,727,250$ 30 130 -$ 2,484,084$ 2,484,084$ 30 130 21,010,000$ 21,010,000$ 0 130 2,623,560$ -$ 2,623,560$ 0 130 -$ 2,623,560$ 0 40 -$ 1,940,526$ 1,940,526$ 0 40 3,450,973$ 3,450,973$ 0 40 -$ 1,227,175$ 1,227,175$ 0 40 2,182,371$ 2,182,371$
10 40 543,234$ 782,564$ 1,325,798$ 10 40 1,672,642$ 2,414,842$ 40 130 -$ 1,208,309$ 1,208,309$ 40 130 12,782,615$ 12,782,615$ 0 10 2,394,426$ 7,651,254$ 10,045,681$ 0 10 9,047,595$ 11,442,022$ 0 10 3,374,635$ 4,044,089$ 7,418,724$ 0 10 4,782,128$ 8,156,763$
10 40 -$ 12,699,060$ 12,699,060$ 10 40 27,142,786$ 27,142,786$ 10 40 685,828$ 7,577,182$ 8,263,010$ 10 40 16,195,358$ 17,132,379$ 40 42 -$ -$ -$ 40 42 -$ -$ 40 42 108,213$ 200,064$ 308,278$ 40 42 730,440$ 1,107,507$ 40 42 30,918$ 357,244$ 388,162$ 40 42 1,304,306$ 1,412,039$ 42 130 -$ 703,175$ 703,175$ 42 130 7,774,100$ 7,774,100$ 42 130 -$ 309,170$ 309,170$ 42 130 3,418,100$ 3,418,100$ 0 130 240,000$ -$ 240,000$ 0 130 -$ 240,000$ 0 130 3,469,796$ -$ 3,469,796$ 0 130 -$ 3,469,796$ 0 130 -$ 15,249,022$ 15,249,022$ 0 130 63,947,533$ 63,947,533$ 0 130 1,130,400$ -$ 1,130,400$ 0 130 -$ 1,130,400$ 0 40 3,494,573$ 47,757,614$ 51,252,188$ 0 40 84,930,690$ 88,425,263$ 0 10 4,221,720$ 5,284,195$ 9,505,915$ 0 10 6,248,552$ 10,470,272$
10 40 438,056$ 8,769,750$ 9,207,807$ 10 40 18,744,336$ 19,342,836$
22,755,361$ 130,153,763$ 152,909,124$ 315,798,180$ 339,509,813$
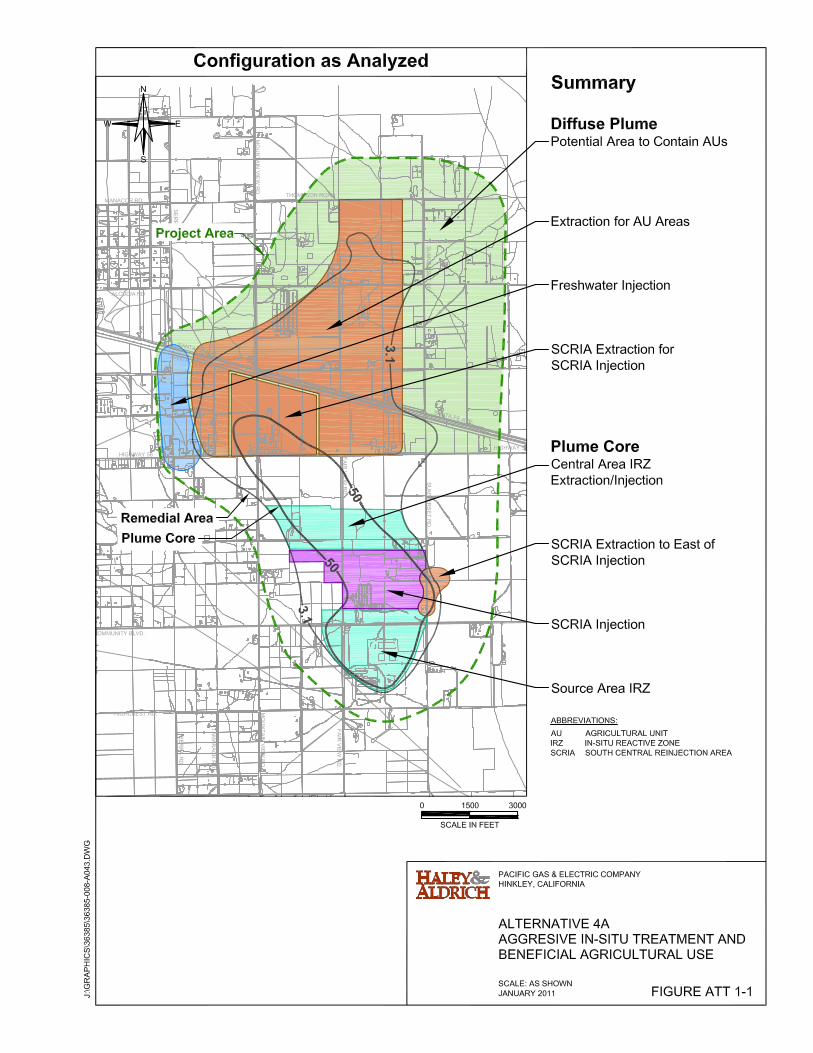
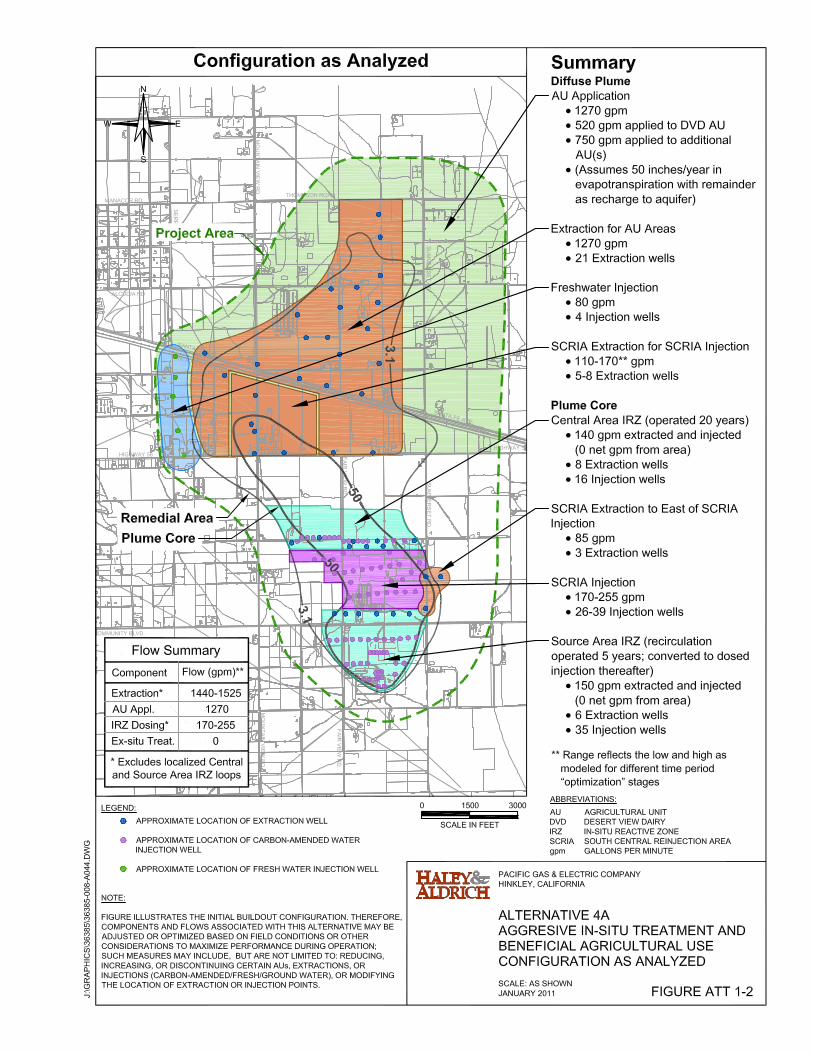
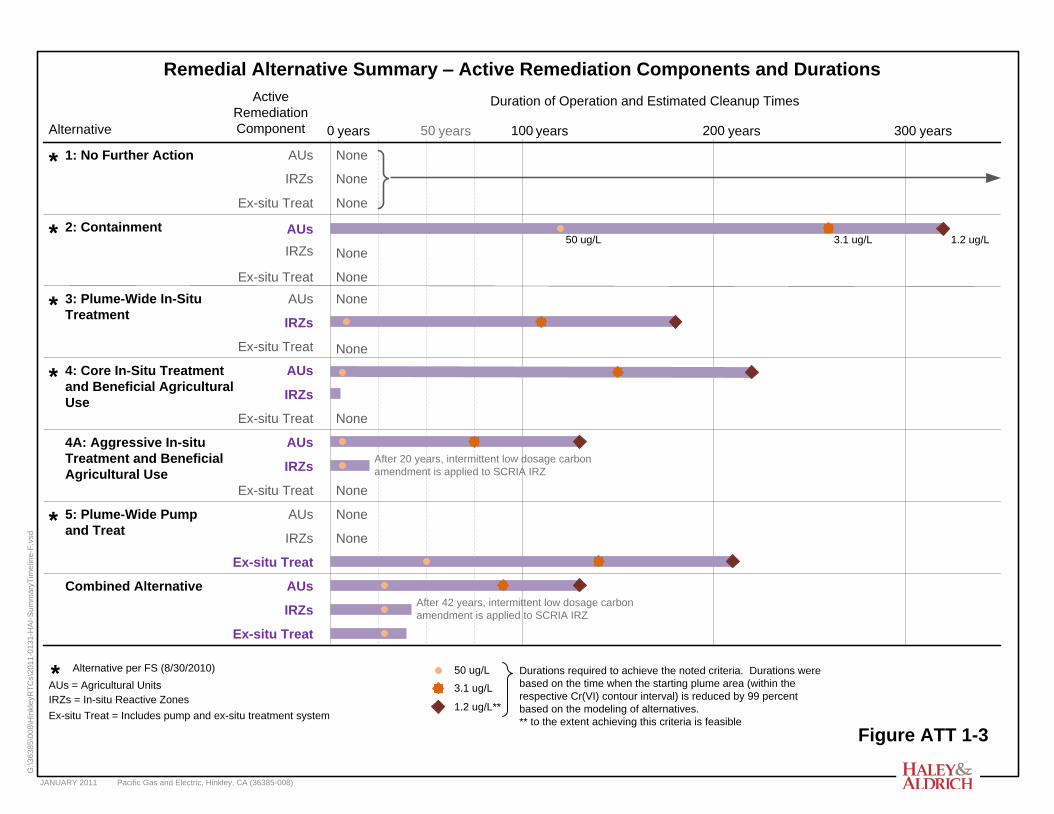
JANUARY 2011
G:\3
6385
\008
\Hin
kley
RTC
s\20
11-0
131-
HA
I-Sum
mar
yTim
elin
e-F.
vsd
Pacific Gas and Electric, Hinkley, CA (36385-008)
4: Core In-Situ Treatment and Beneficial Agricultural Use
1: No Further Action
2: Containment
3: Plume-Wide In-Situ Treatment
Combined Alternative
4A: Aggressive In-situ Treatment and Beneficial Agricultural Use
5: Plume-Wide Pump and Treat
*
*
*
*
*
Alternative
Active Remediation Component
AUs
IRZs
Ex-situ Treat
AUsIRZs
Ex-situ TreatAUs
IRZs
Ex-situ Treat
AUs
IRZs
Ex-situ Treat
Duration of Operation and Estimated Cleanup Times
0 300
None
AUs
IRZs
Ex-situ Treat
AUs
IRZs
Ex-situ Treat
None
None
None
NoneNone
None
None
None
None
None
years 100 years years
* Alternative per FS (8/30/2010)
After 42 years, intermittent low dosage carbon amendment is applied to SCRIA IRZ
Remedial Alternative Summary – Active Remediation Components and Durations
50 ug/L 3.1 ug/L 1.2 ug/L
AUs = Agricultural UnitsIRZs = In-situ Reactive ZonesEx-situ Treat = Includes pump and ex-situ treatment system
AUs
IRZs
Ex-situ Treat
200 years
After 20 years, intermittent low dosage carbon amendment is applied to SCRIA IRZ
Durations required to achieve the noted criteria. Durations were based on the time when the starting plume area (within the respective Cr(VI) contour interval) is reduced by 99 percent based on the modeling of alternatives.** to the extent achieving this criteria is feasible
50 ug/L
3.1 ug/L
1.2 ug/L**
50 years
Figure ATT 1-3
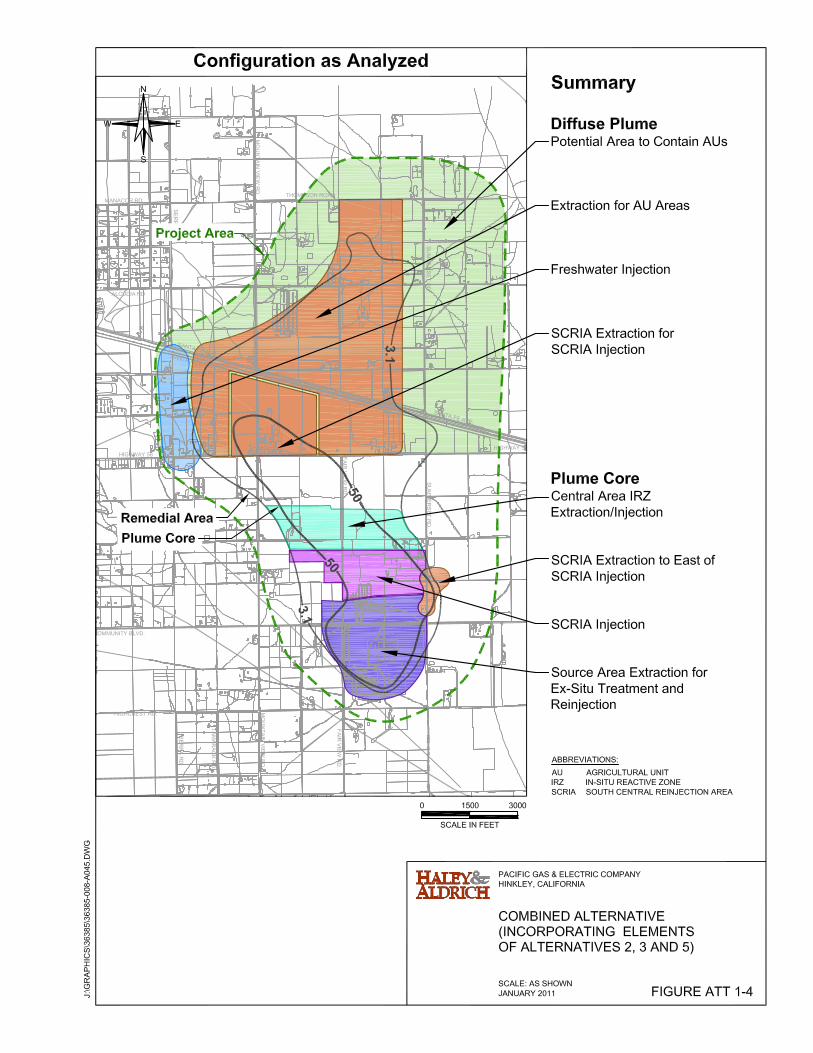
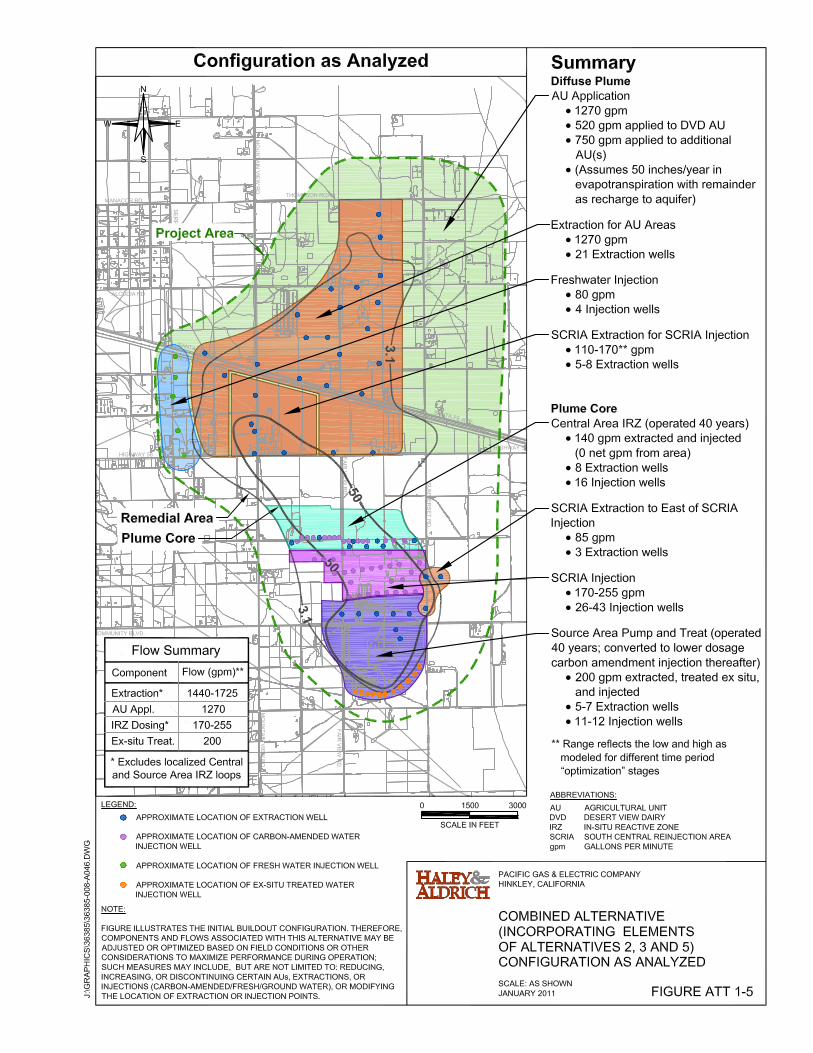
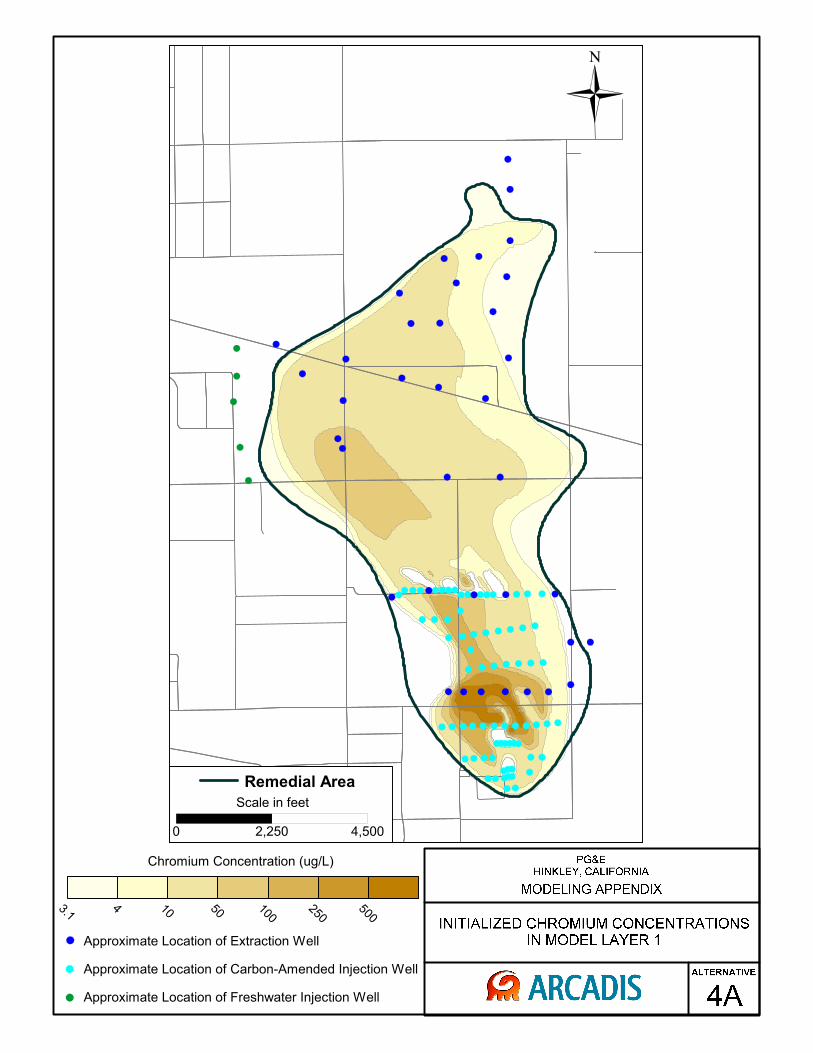
0 2,250 4,500
Scale in feet
Remedial Area
3.14 10 50 100
250500
Chromium Concentration (ug/L)
Approximate Location of Extraction Well
Approximate Location of Carbon-Amended Injection Well
Approximate Location of Freshwater Injection Well
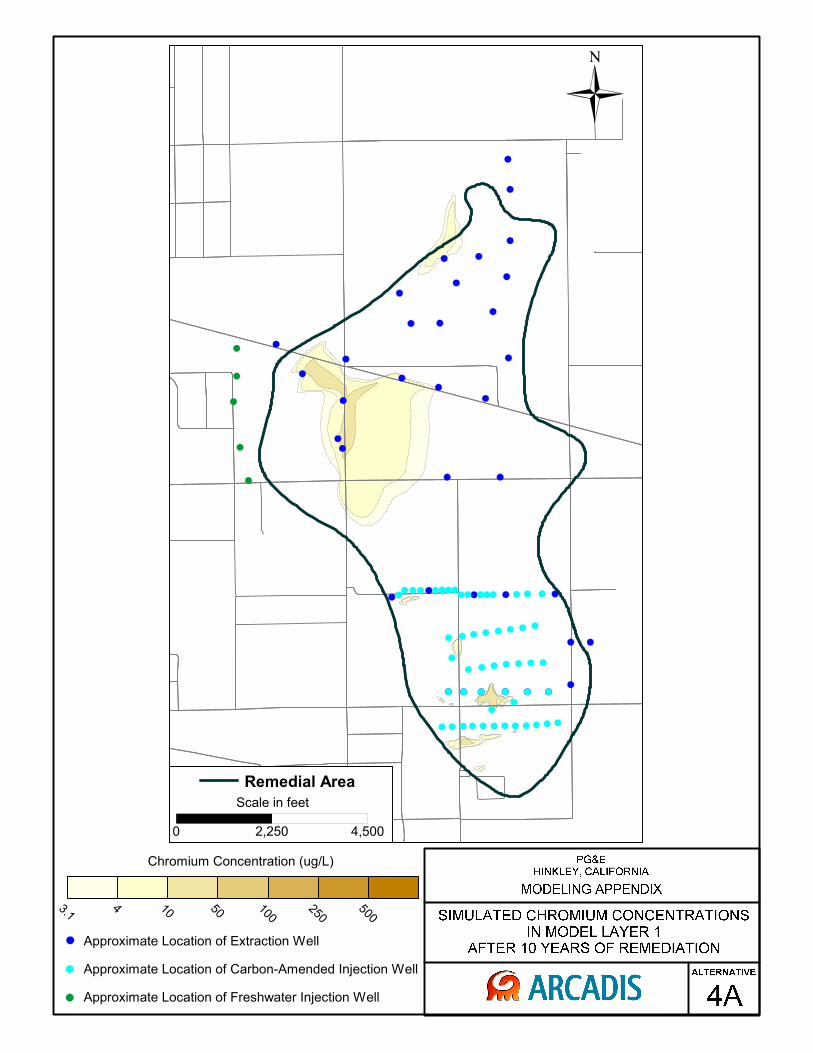
0 2,250 4,500
Scale in feet
Remedial Area
3.14 10 50 100
250500
Chromium Concentration (ug/L)
Approximate Location of Extraction Well
Approximate Location of Carbon-Amended Injection Well
Approximate Location of Freshwater Injection Well
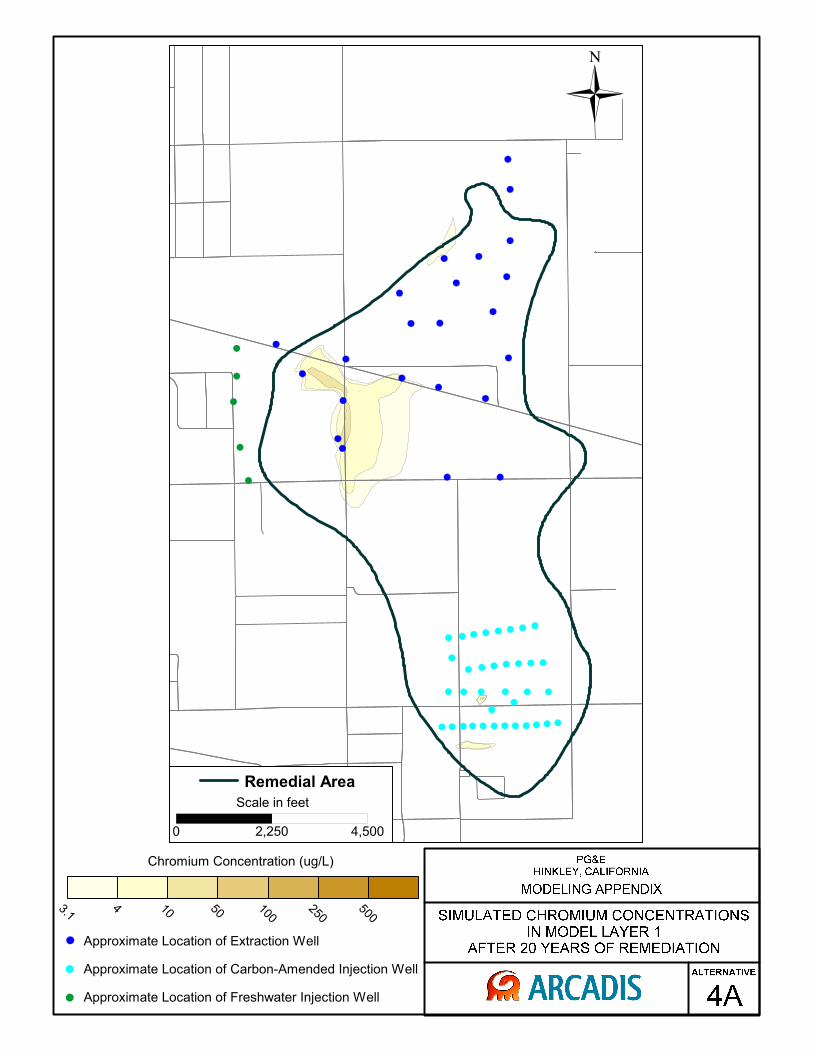
0 2,250 4,500
Scale in feet
Remedial Area
3.14 10 50 100
250500
Chromium Concentration (ug/L)
Approximate Location of Extraction Well
Approximate Location of Carbon-Amended Injection Well
Approximate Location of Freshwater Injection Well
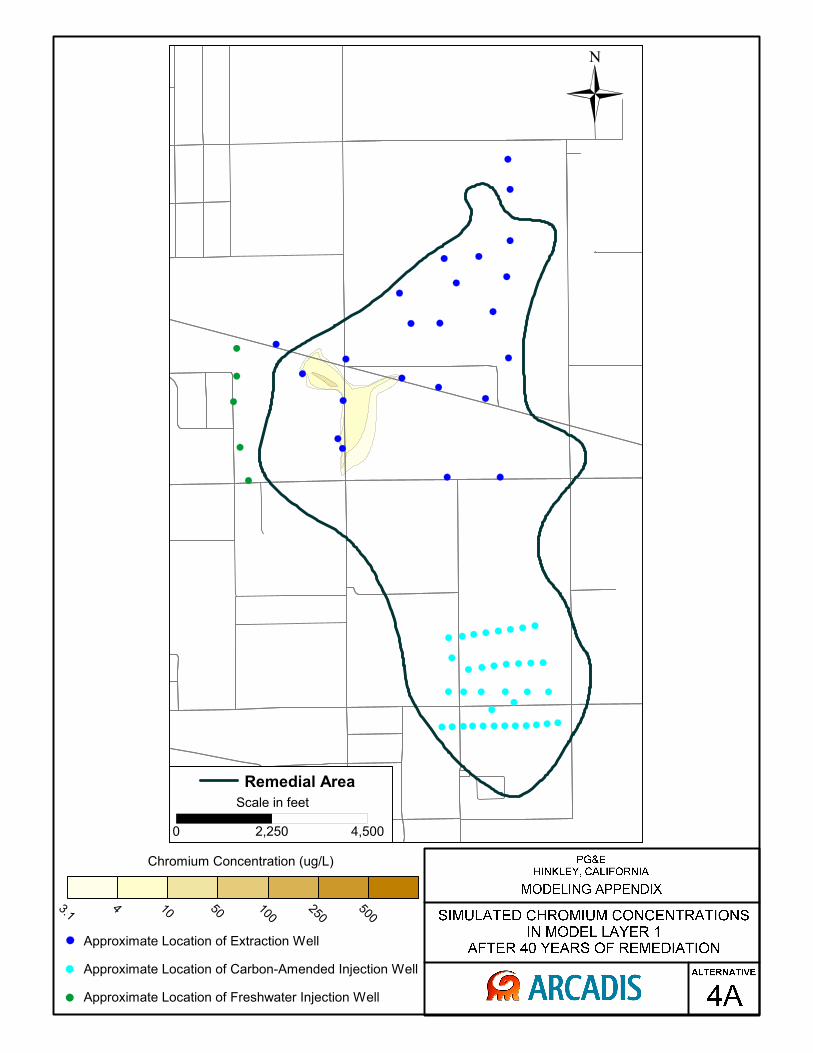
0 2,250 4,500
Scale in feet
Remedial Area
3.14 10 50 100
250500
Chromium Concentration (ug/L)
Approximate Location of Extraction Well
Approximate Location of Carbon-Amended Injection Well
Approximate Location of Freshwater Injection Well

0 2,250 4,500
Scale in feet
Remedial Area
3.14 10 50 100
250500
Chromium Concentration (ug/L)
Approximate Location of Extraction Well
Approximate Location of Carbon-Amended Injection Well
Approximate Location of Freshwater Injection Well
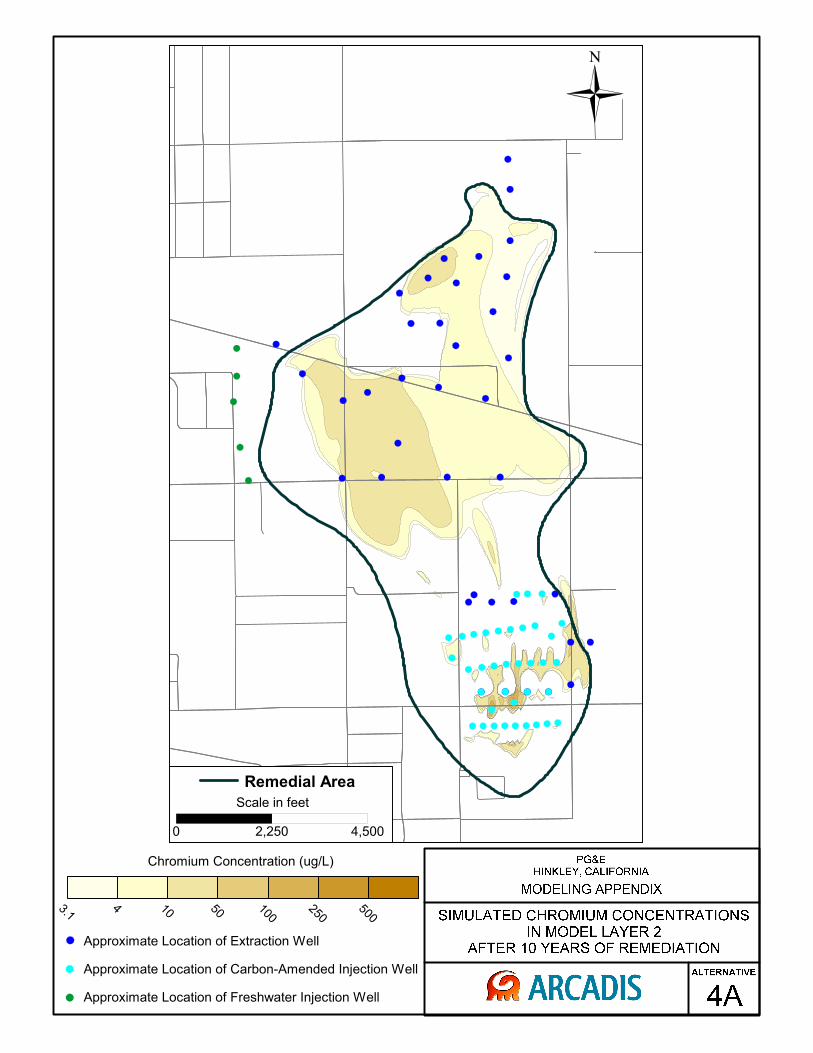
0 2,250 4,500
Scale in feet
Remedial Area
3.14 10 50 100
250500
Chromium Concentration (ug/L)
Approximate Location of Extraction Well
Approximate Location of Carbon-Amended Injection Well
Approximate Location of Freshwater Injection Well
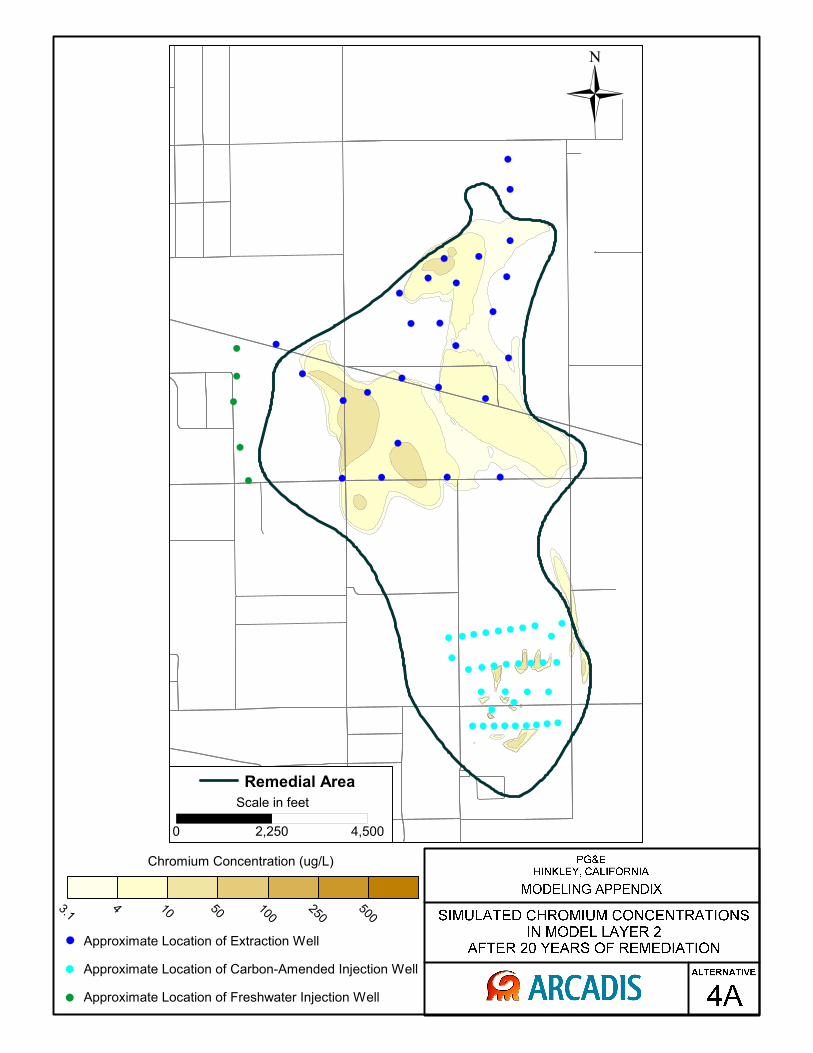
0 2,250 4,500
Scale in feet
Remedial Area
3.14 10 50 100
250500
Chromium Concentration (ug/L)
Approximate Location of Extraction Well
Approximate Location of Carbon-Amended Injection Well
Approximate Location of Freshwater Injection Well
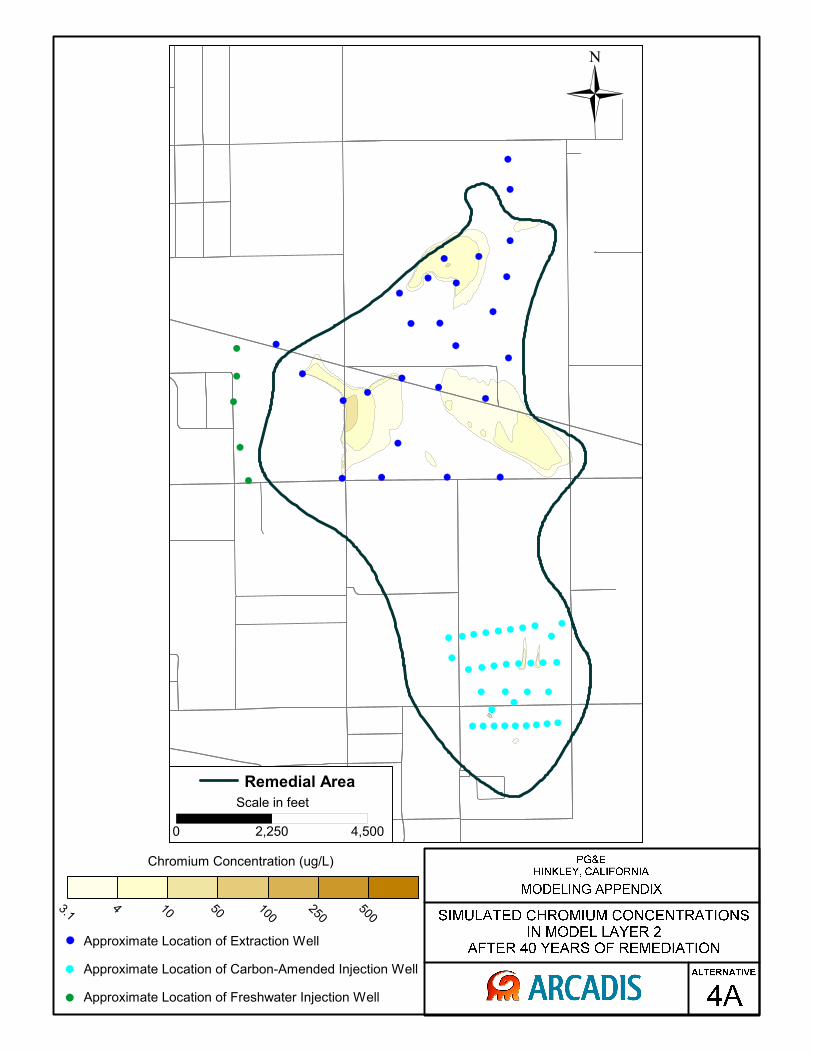
0 2,250 4,500
Scale in feet
Remedial Area
3.14 10 50 100
250500
Chromium Concentration (ug/L)
Approximate Location of Extraction Well
Approximate Location of Carbon-Amended Injection Well
Approximate Location of Freshwater Injection Well
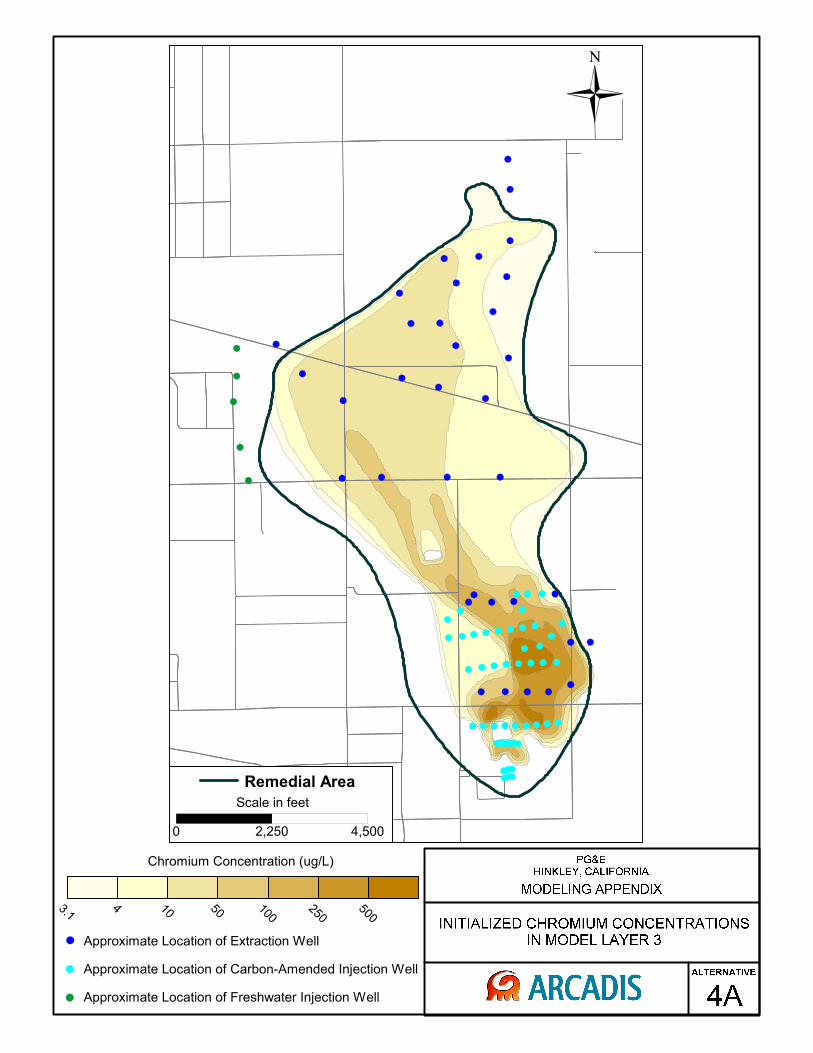
0 2,250 4,500
Scale in feet
Remedial Area
3.14 10 50 100
250500
Chromium Concentration (ug/L)
Approximate Location of Extraction Well
Approximate Location of Carbon-Amended Injection Well
Approximate Location of Freshwater Injection Well
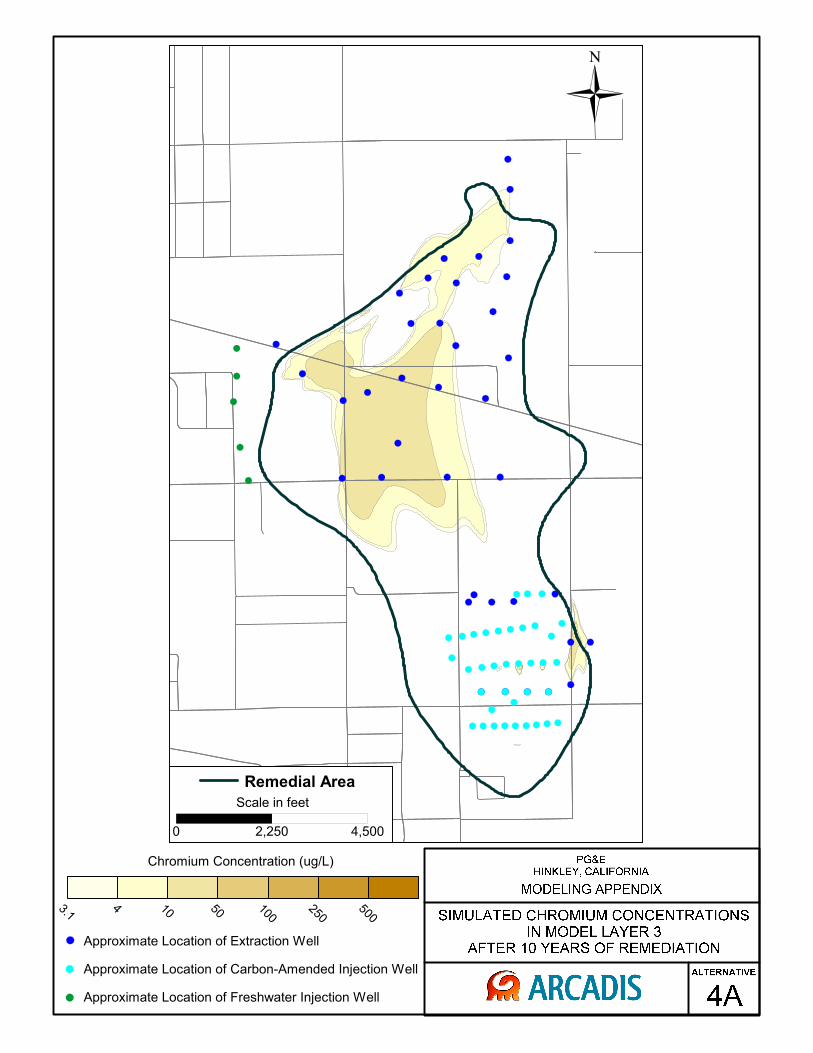
0 2,250 4,500
Scale in feet
Remedial Area
3.14 10 50 100
250500
Chromium Concentration (ug/L)
Approximate Location of Extraction Well
Approximate Location of Carbon-Amended Injection Well
Approximate Location of Freshwater Injection Well
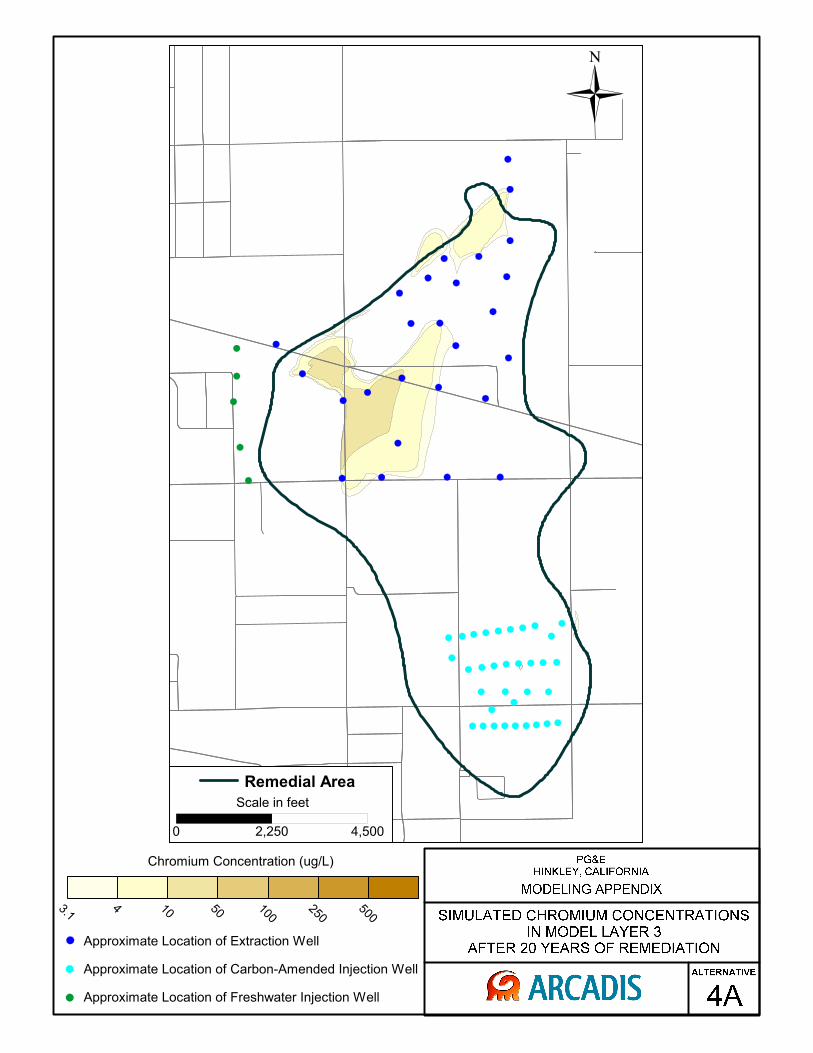
0 2,250 4,500
Scale in feet
Remedial Area
3.14 10 50 100
250500
Chromium Concentration (ug/L)
Approximate Location of Extraction Well
Approximate Location of Carbon-Amended Injection Well
Approximate Location of Freshwater Injection Well
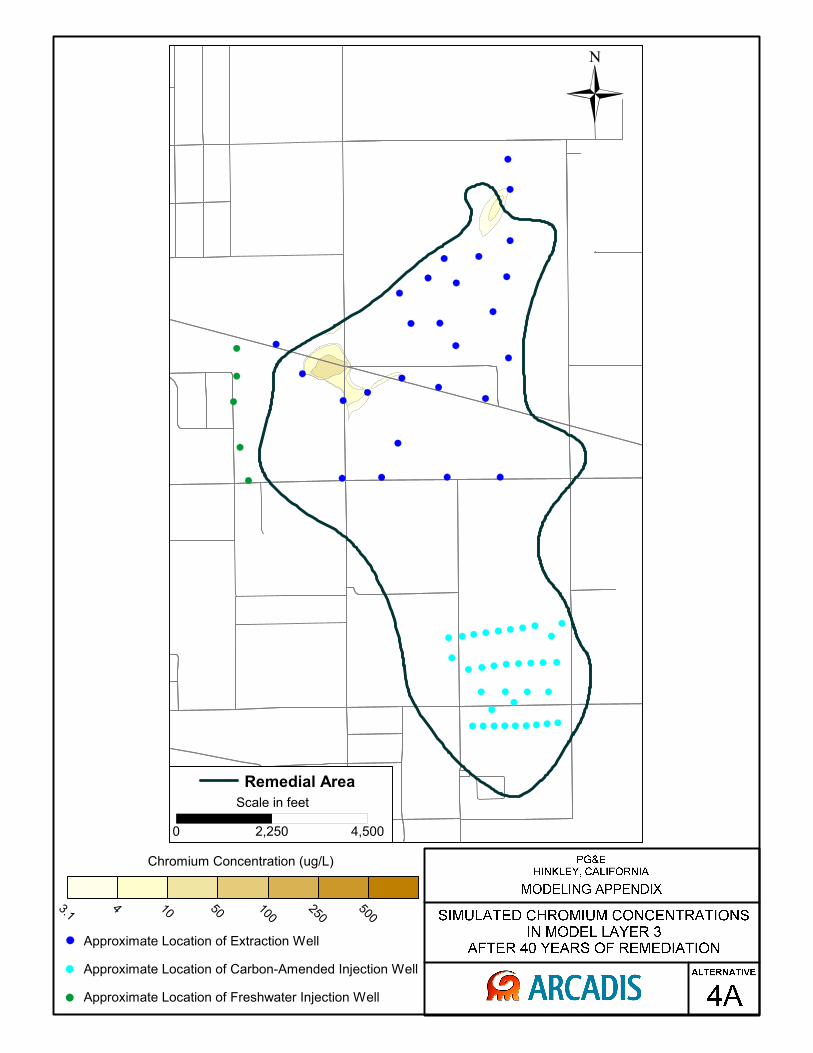
0 2,250 4,500
Scale in feet
Remedial Area
3.14 10 50 100
250500
Chromium Concentration (ug/L)
Approximate Location of Extraction Well
Approximate Location of Carbon-Amended Injection Well
Approximate Location of Freshwater Injection Well
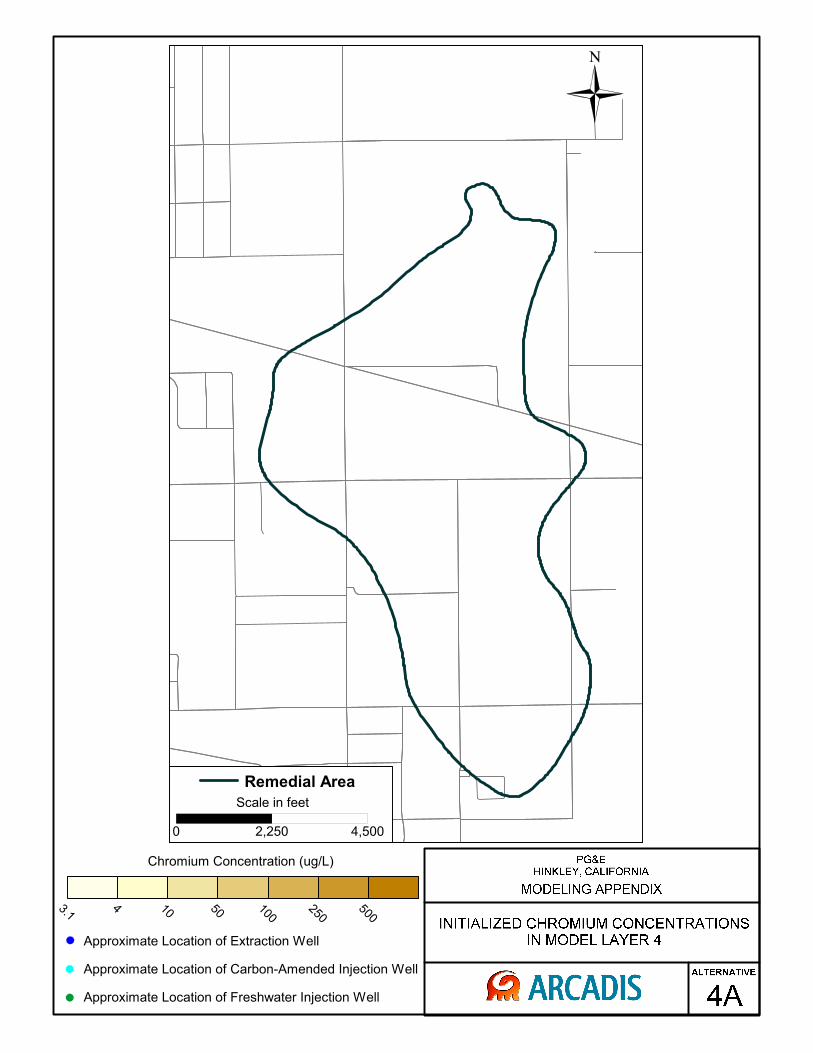
0 2,250 4,500
Scale in feet
Remedial Area
3.14 10 50 100
250500
Chromium Concentration (ug/L)
Approximate Location of Extraction Well
Approximate Location of Carbon-Amended Injection Well
Approximate Location of Freshwater Injection Well

0 2,250 4,500
Scale in feet
Remedial Area
3.14 10 50 100
250500
Chromium Concentration (ug/L)
Approximate Location of Extraction Well
Approximate Location of Carbon-Amended Injection Well
Approximate Location of Freshwater Injection Well

0 2,250 4,500
Scale in feet
Remedial Area
3.14 10 50 100
250500
Chromium Concentration (ug/L)
Approximate Location of Extraction Well
Approximate Location of Carbon-Amended Injection Well
Approximate Location of Freshwater Injection Well

0 2,250 4,500
Scale in feet
Remedial Area
3.14 10 50 100
250500
Chromium Concentration (ug/L)
Approximate Location of Extraction Well
Approximate Location of Carbon-Amended Injection Well
Approximate Location of Freshwater Injection Well
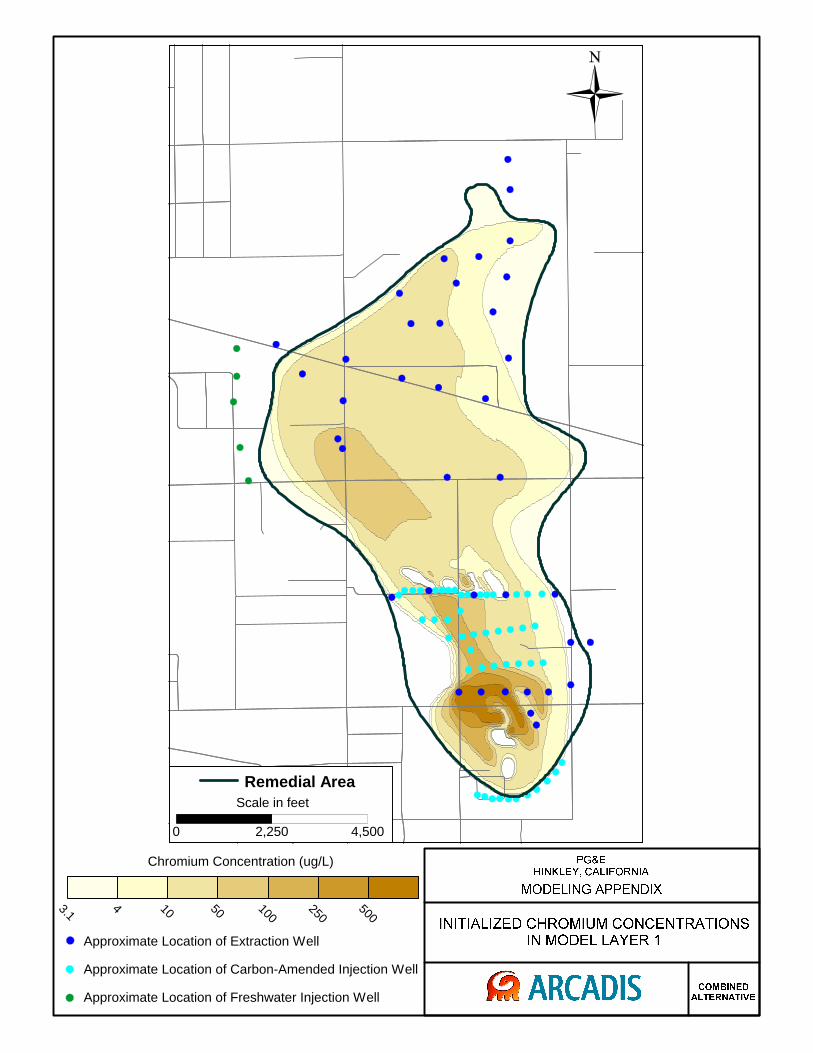
0 2,250 4,500
Scale in feetRemedial Area
3.1 4 10 50 100250
500
Chromium Concentration (ug/L)
Approximate Location of Extraction Well
Approximate Location of Carbon-Amended Injection Well
Approximate Location of Freshwater Injection Well
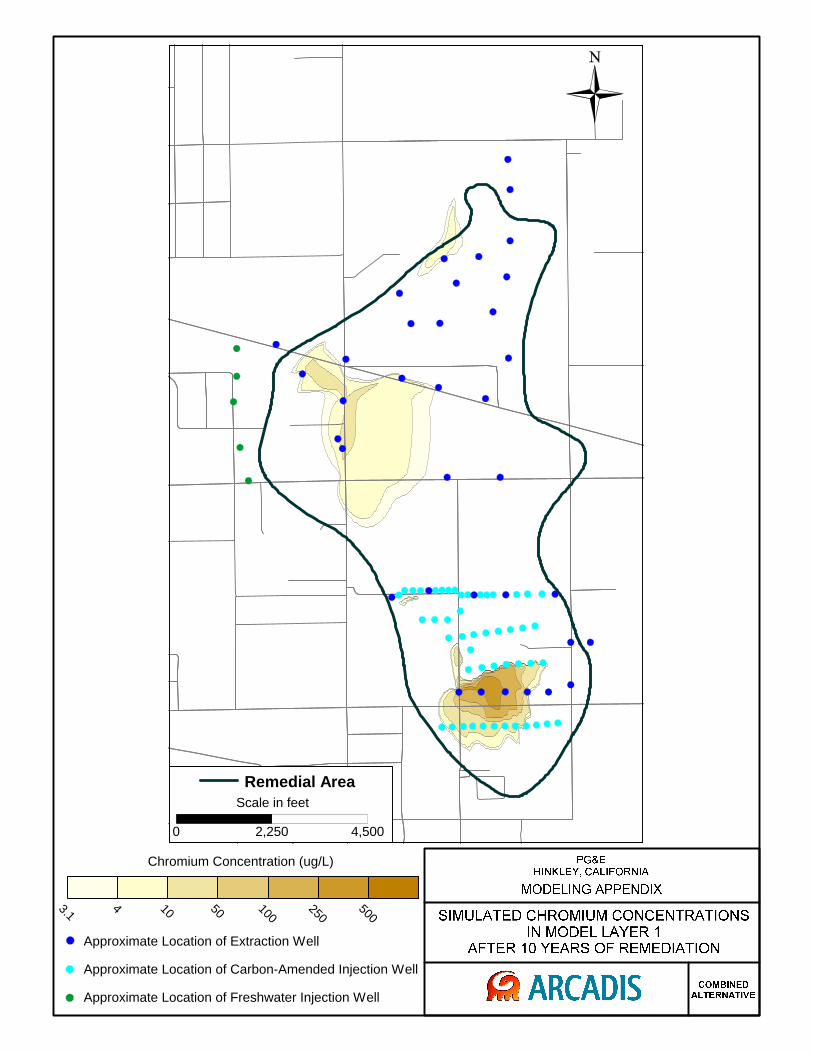
0 2,250 4,500
Scale in feetRemedial Area
3.1 4 10 50 100250
500
Chromium Concentration (ug/L)
Approximate Location of Extraction Well
Approximate Location of Carbon-Amended Injection Well
Approximate Location of Freshwater Injection Well
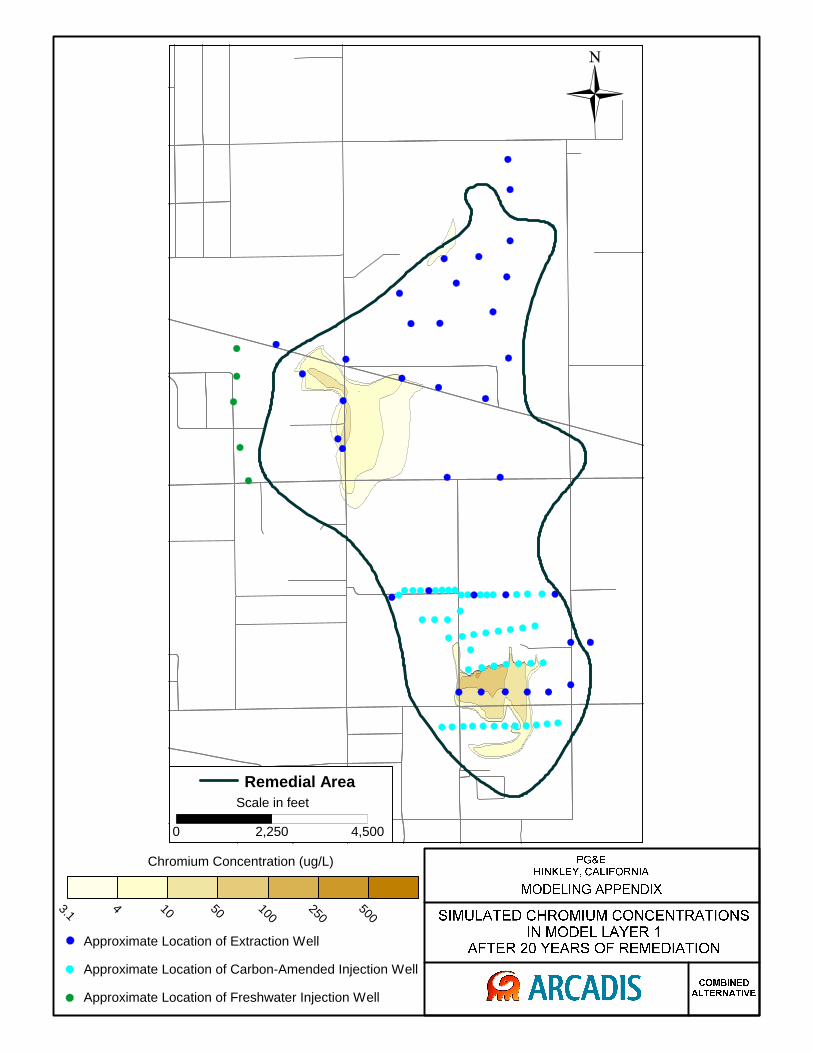
0 2,250 4,500
Scale in feetRemedial Area
3.1 4 10 50 100250
500
Chromium Concentration (ug/L)
Approximate Location of Extraction Well
Approximate Location of Carbon-Amended Injection Well
Approximate Location of Freshwater Injection Well
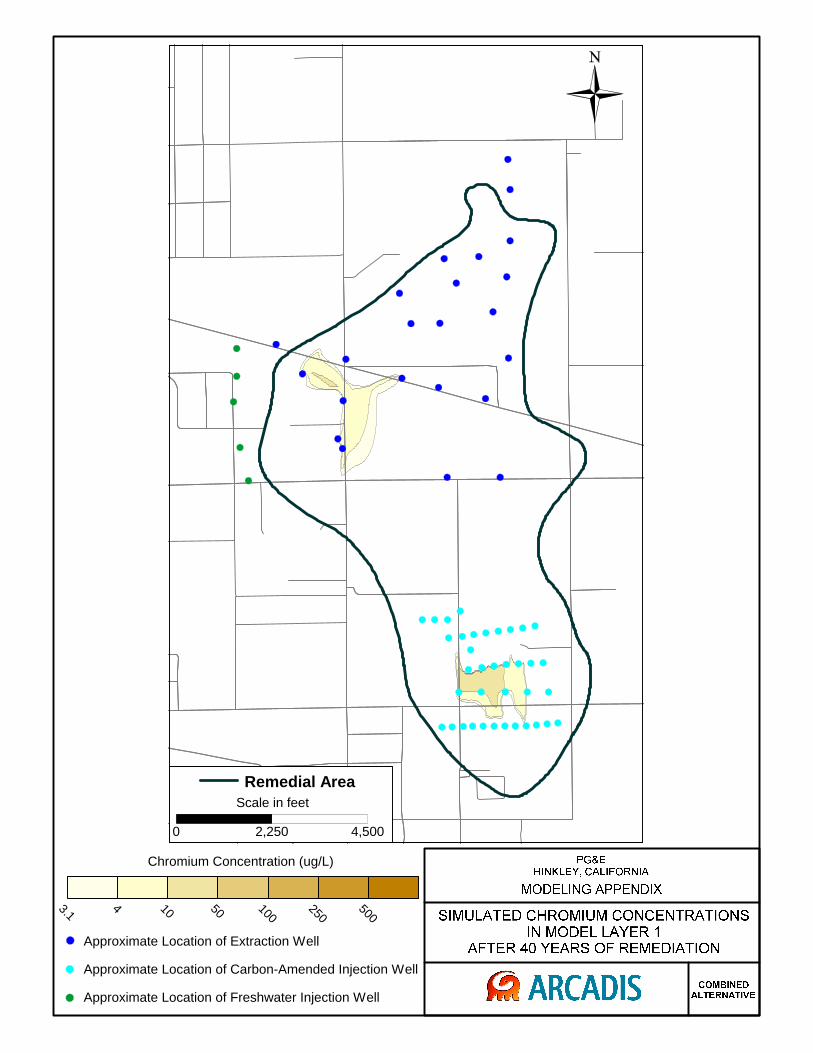
0 2,250 4,500
Scale in feetRemedial Area
3.1 4 10 50 100250
500
Chromium Concentration (ug/L)
Approximate Location of Extraction Well
Approximate Location of Carbon-Amended Injection Well
Approximate Location of Freshwater Injection Well
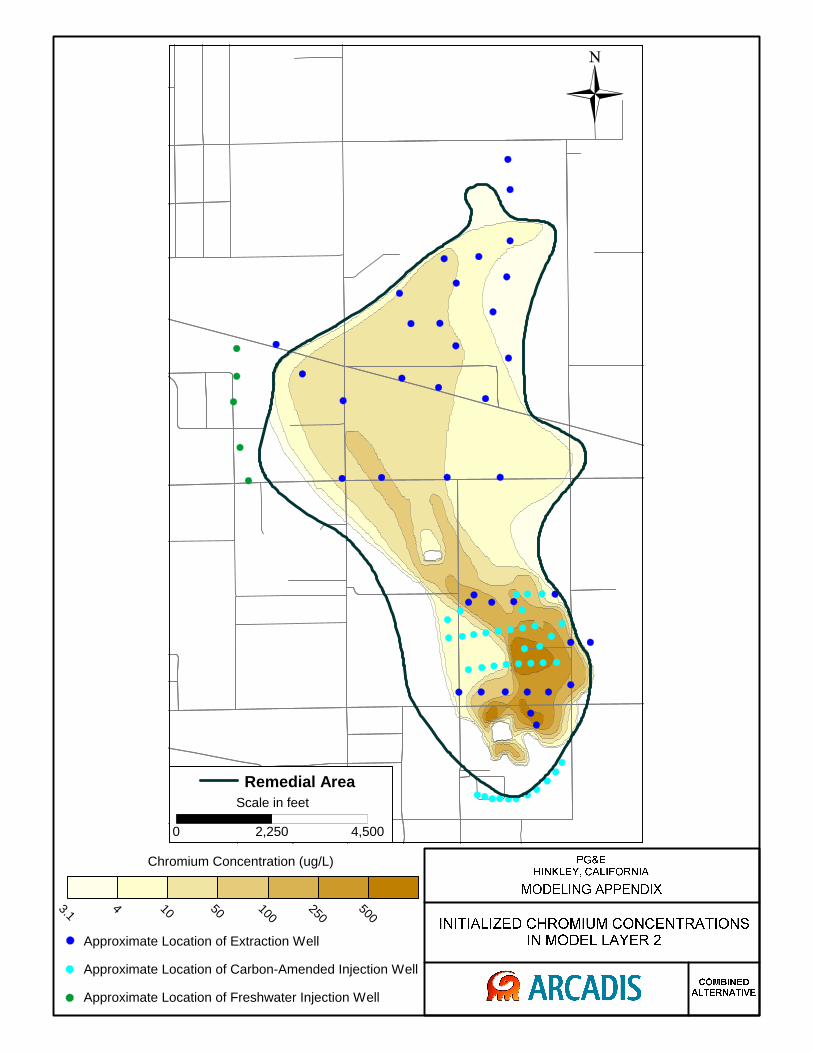
0 2,250 4,500
Scale in feetRemedial Area
3.1 4 10 50 100250
500
Chromium Concentration (ug/L)
Approximate Location of Extraction Well
Approximate Location of Carbon-Amended Injection Well
Approximate Location of Freshwater Injection Well
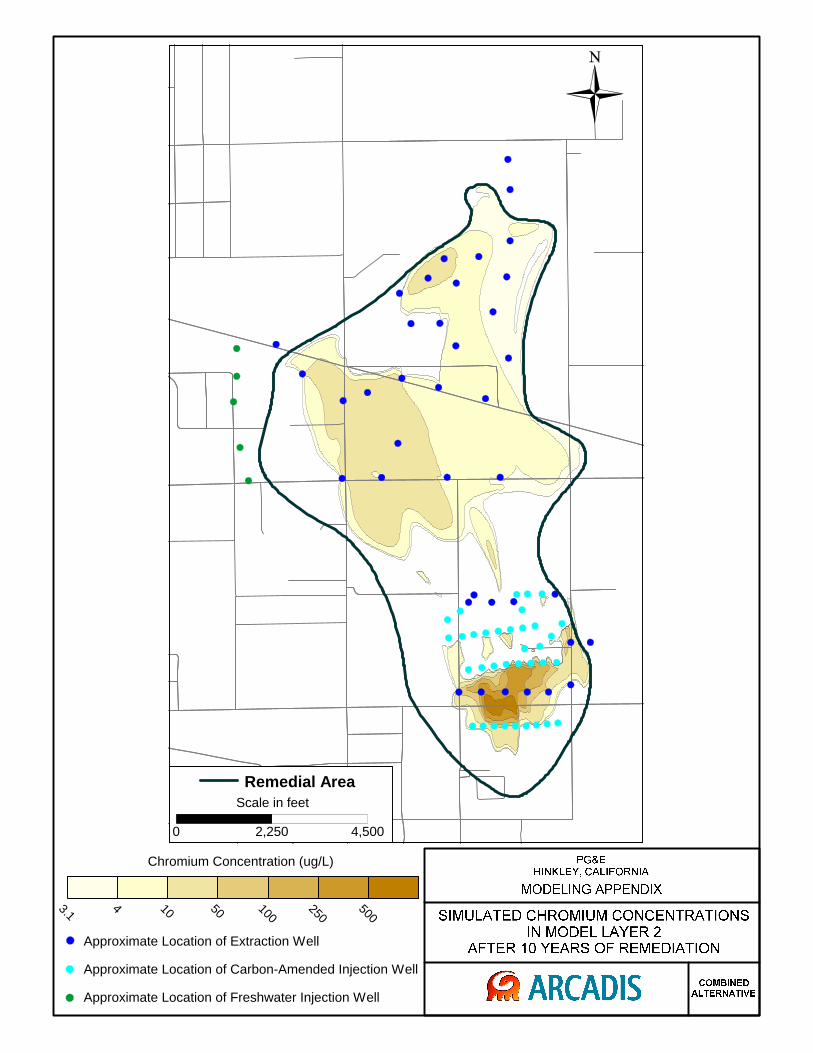
0 2,250 4,500
Scale in feetRemedial Area
3.1 4 10 50 100250
500
Chromium Concentration (ug/L)
Approximate Location of Extraction Well
Approximate Location of Carbon-Amended Injection Well
Approximate Location of Freshwater Injection Well
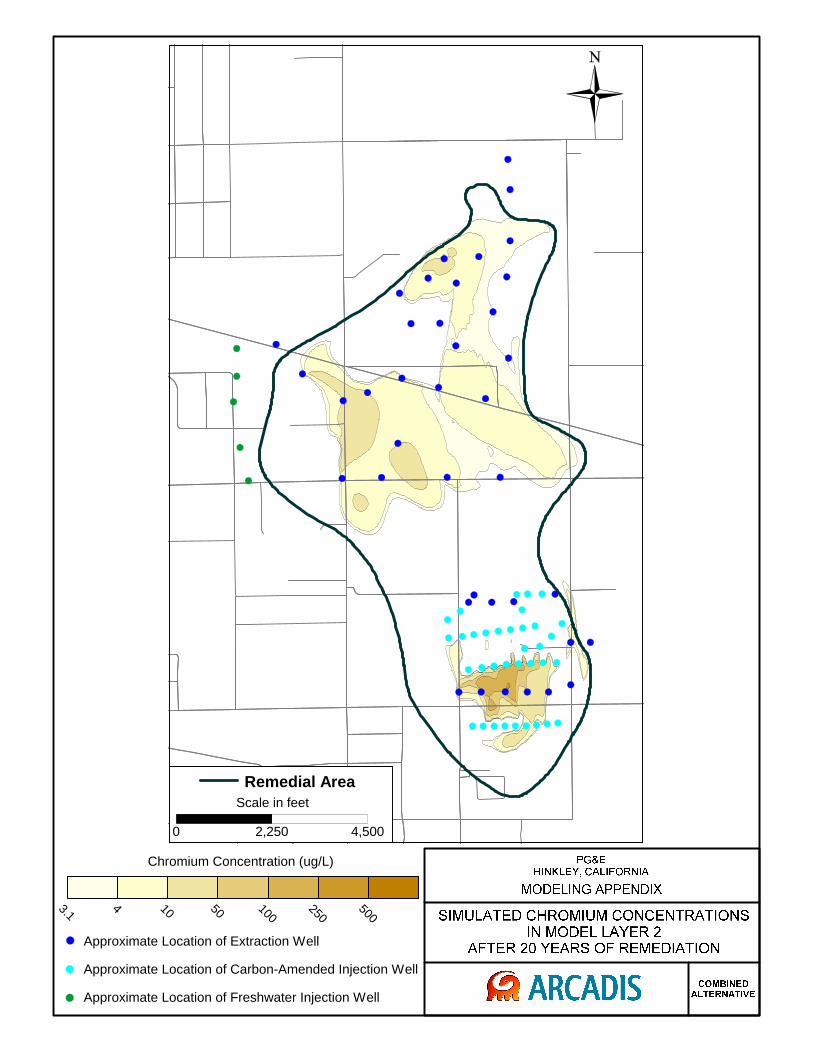
0 2,250 4,500
Scale in feetRemedial Area
3.1 4 10 50 100250
500
Chromium Concentration (ug/L)
Approximate Location of Extraction Well
Approximate Location of Carbon-Amended Injection Well
Approximate Location of Freshwater Injection Well
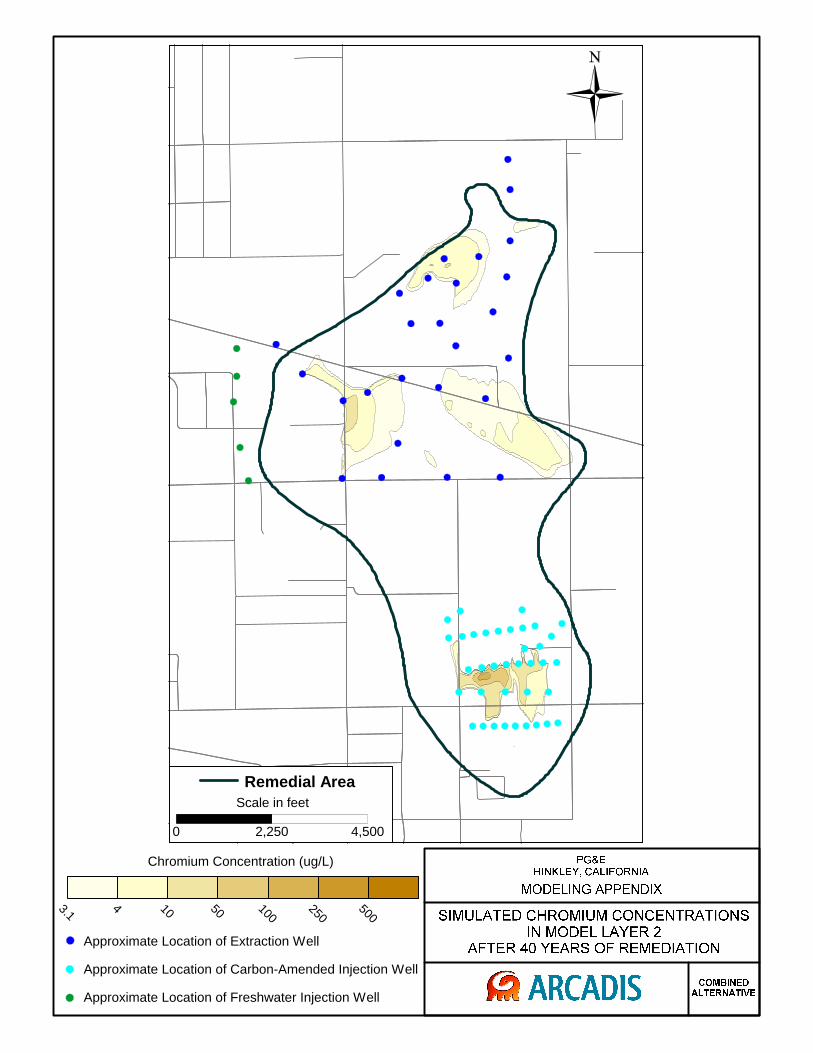
0 2,250 4,500
Scale in feetRemedial Area
3.1 4 10 50 100250
500
Chromium Concentration (ug/L)
Approximate Location of Extraction Well
Approximate Location of Carbon-Amended Injection Well
Approximate Location of Freshwater Injection Well

0 2,250 4,500
Scale in feetRemedial Area
3.1 4 10 50 100250
500
Chromium Concentration (ug/L)
Approximate Location of Extraction Well
Approximate Location of Carbon-Amended Injection Well
Approximate Location of Freshwater Injection Well
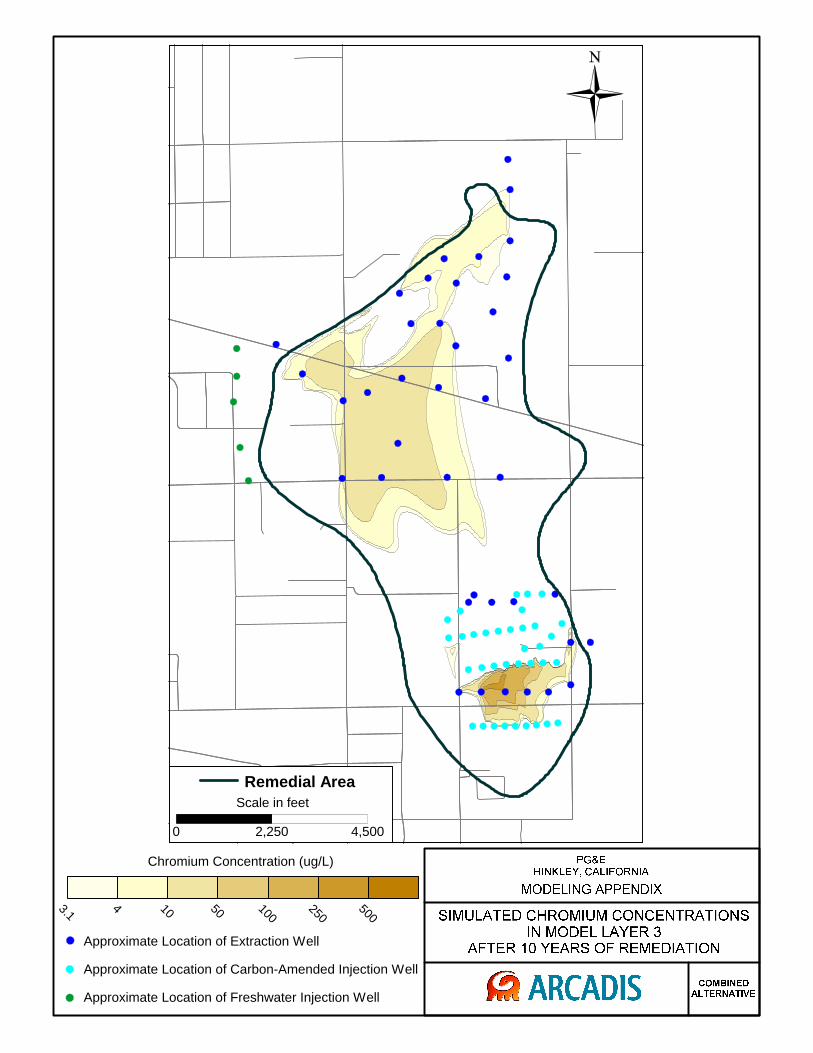
0 2,250 4,500
Scale in feetRemedial Area
3.1 4 10 50 100250
500
Chromium Concentration (ug/L)
Approximate Location of Extraction Well
Approximate Location of Carbon-Amended Injection Well
Approximate Location of Freshwater Injection Well

0 2,250 4,500
Scale in feetRemedial Area
3.1 4 10 50 100250
500
Chromium Concentration (ug/L)
Approximate Location of Extraction Well
Approximate Location of Carbon-Amended Injection Well
Approximate Location of Freshwater Injection Well
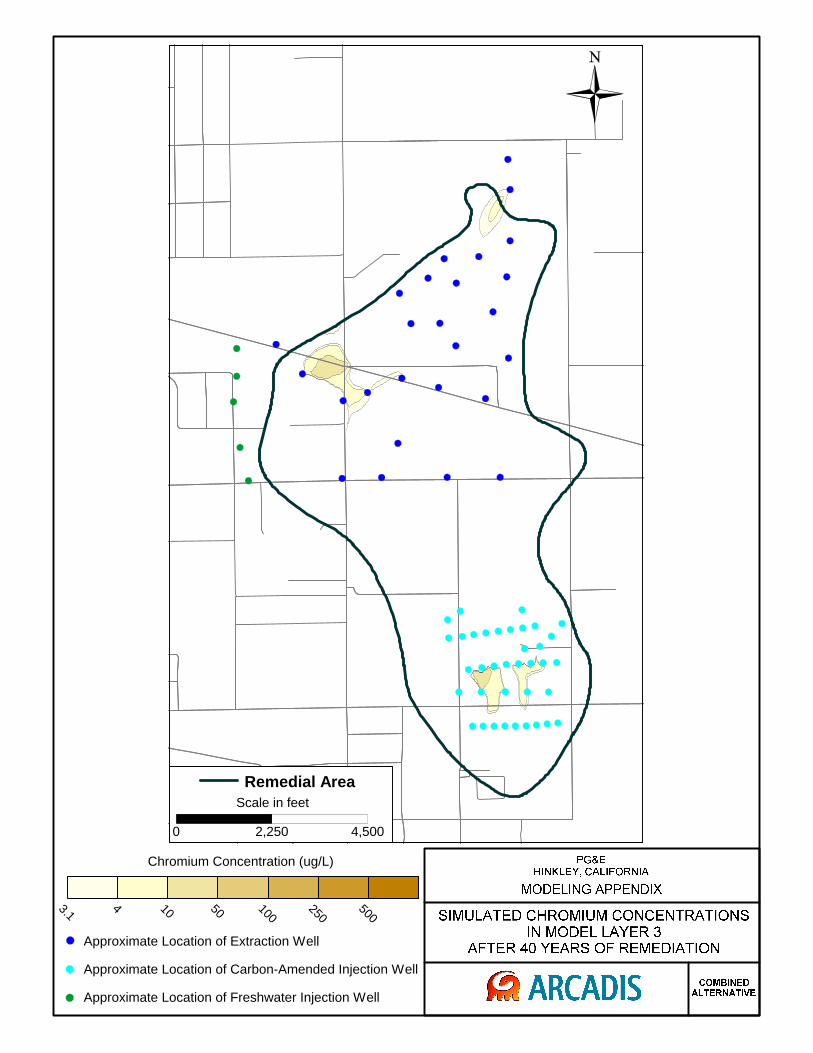
0 2,250 4,500
Scale in feetRemedial Area
3.1 4 10 50 100250
500
Chromium Concentration (ug/L)
Approximate Location of Extraction Well
Approximate Location of Carbon-Amended Injection Well
Approximate Location of Freshwater Injection Well
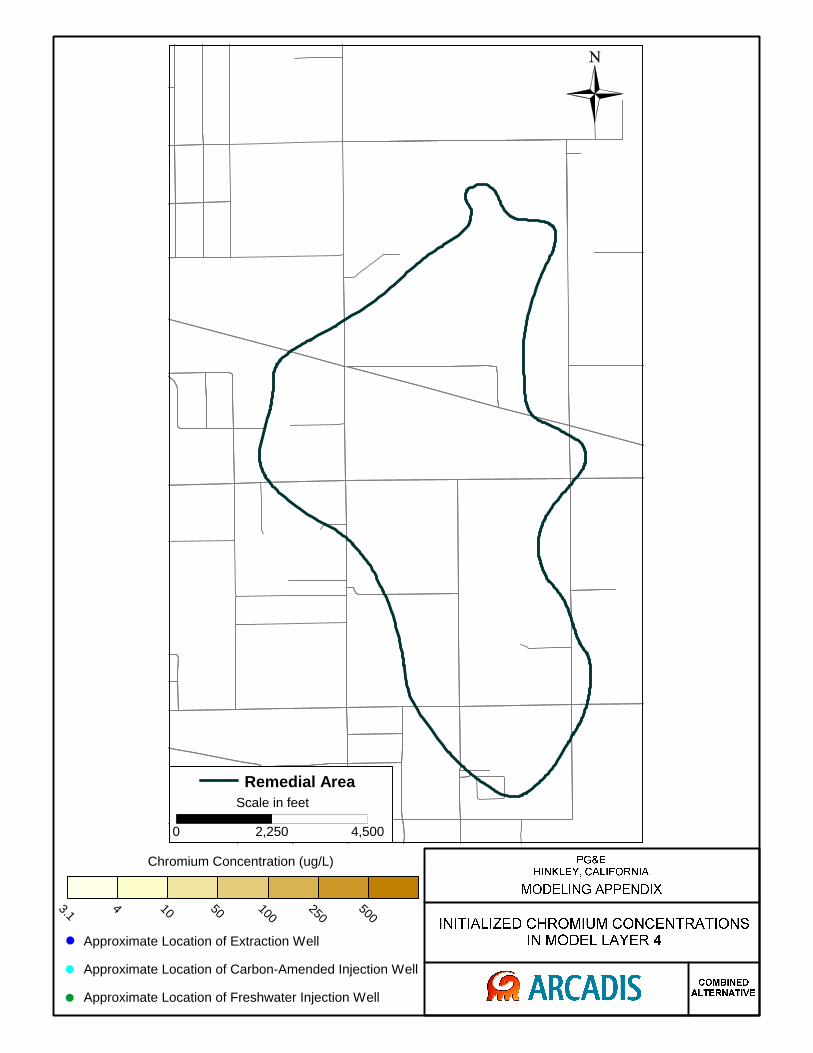
0 2,250 4,500
Scale in feetRemedial Area
3.1 4 10 50 100250
500
Chromium Concentration (ug/L)
Approximate Location of Extraction Well
Approximate Location of Carbon-Amended Injection Well
Approximate Location of Freshwater Injection Well

0 2,250 4,500
Scale in feetRemedial Area
3.1 4 10 50 100250
500
Chromium Concentration (ug/L)
Approximate Location of Extraction Well
Approximate Location of Carbon-Amended Injection Well
Approximate Location of Freshwater Injection Well

0 2,250 4,500
Scale in feetRemedial Area
3.1 4 10 50 100250
500
Chromium Concentration (ug/L)
Approximate Location of Extraction Well
Approximate Location of Carbon-Amended Injection Well
Approximate Location of Freshwater Injection Well
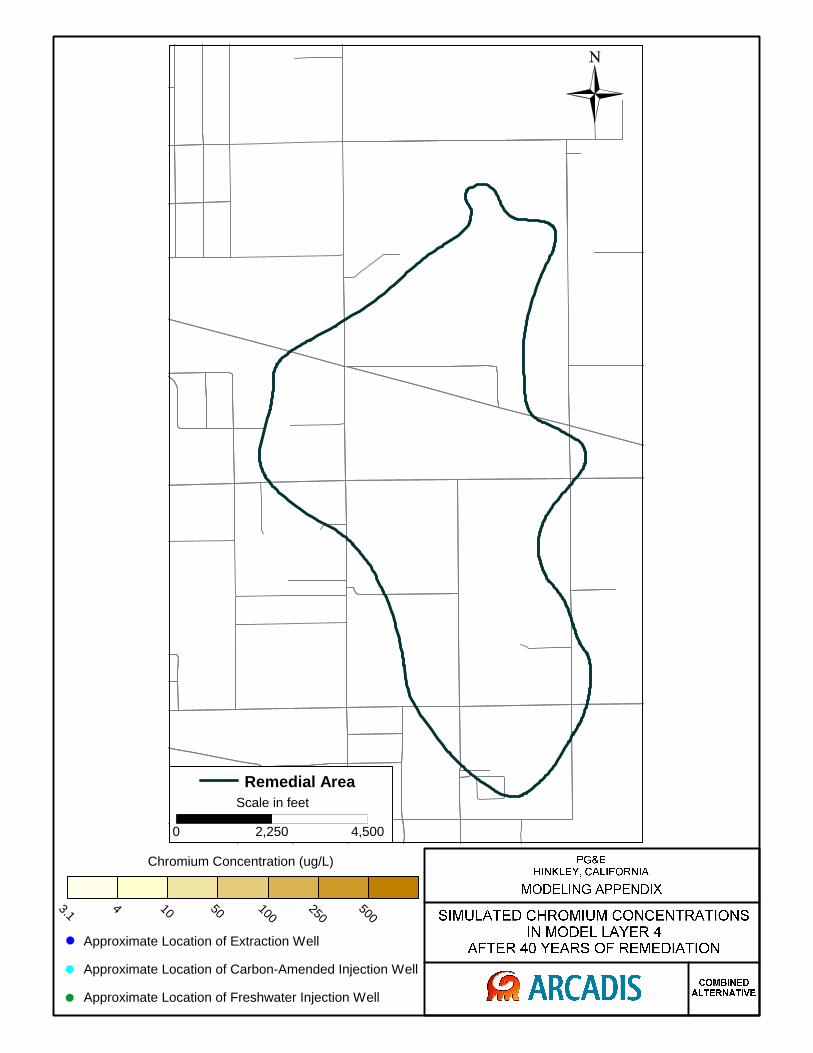
0 2,250 4,500
Scale in feetRemedial Area
3.1 4 10 50 100250
500
Chromium Concentration (ug/L)
Approximate Location of Extraction Well
Approximate Location of Carbon-Amended Injection Well
Approximate Location of Freshwater Injection Well
Attachment 2
Residual Post-Treatment Chromium Concentration Calculation Assumptions
The following summarizes the assumptions made in estimating the distribution and increases in soil chromium concentrations for the various alternatives. Alternative 1: All of the mass is left within the saturated aquifer.
Alternative 2: All of the mass is removed from the aquifer via extraction and treated within the vadose zone soils beneath agricultural units.
Alternative 3: All of the mass is treated via in-situ treatment within the saturated aquifer.
Alternatives 4 and 4A. All of the mass south of Frontier Road, estimated to be 80 percent of the total mass, is treated with in-situ treatment and remains in the saturated aquifer. The mass north of Frontier Road, estimated to be 20 percent of the total mass, is extracted and treated within the vadose zone soils beneath the agricultural units.
Alternative 5: All of the mass is extracted, treated by pump and treat and ultimately disposed of off-site.
The Combined Alternative: Assumes that the mass south of the line of pump and treat extraction wells, estimated at 40 percent of the total mass, is extracted, treated by pump and treat, and ultimately disposed of off-site. The remaining mass south of Frontier Road, estimated at 40 percent, is immobilized in the saturated aquifer via in-situ treatment and the remaining mass north of Frontier Road, estimated at 20 percent, is extracted and treated within vadose zone soils beneath the agricultural units.
For the agricultural components of each remedy, estimates of chromium deposited by treatment in vadose zone soils were determined with the following assumptions: Groundwater will be extracted and applied to the agricultural units at the rates described in
Appendix E of the FS.
The average concentration of hexavalent chromium in the extracted groundwater will be 20 g/L. Extracted concentrations are expected to be higher during the initial period of operation, and to decrease over the course of operation. For reference, the combined extraction concentration for the DVD LTU was 13 to15 g/L during 2010.
The agricultural units will remove the portion of the mass that will significantly drive increased soil concentrations over the course of 60 years for Alternative 2 and 30 years for Alternatives 4, 4A, and 6.
The volume of soil over which the chromium is deposited will be 5 feet thick and cover the following areas:
– Alternatives 2 and 4: the DVD and Gorman fields
– Alternatives 4A and 6: the DVD, Gorman fields, and 3 new fields comparable in area to one of the Gorman pivots.
Increases in soil concentrations for the in-situ components of each remedy were estimated considering two scenarios: A scenario in which organic carbon reagent is distributed throughout the treated area in which a
relatively high concentration of chromium, e.g. 4,000 g/L, is present in groundwater and chromium is precipitated from the groundwater onto soils, typical of source area treatment. Increases in soil concentrations within source area in-situ reactive zones (IRZs) were estimated to be up to 0.8 mg/kg based on the precipitation of 4,000 g/L of hexavalent chromium. There
is one well on-site with concentrations above 4,000 g/L, well SA-MW-05D. The maximum hexavalent chromium concentration measured in SA-MW-05D was 9,030 g/L. The increase in soil concentration in the small area within the immediate vicinity of this location is estimated to be 1.8 mg/kg based on a concentration of 9,000 g/L, which is within the range of variability of background chromium soil concentrations in the aquifer. This estimate was not included in Table 1, given the relatively small area of with groundwater with concentrations over 4,000 g/L.
A scenario in which an in-situ reductive barrier is established and chromium is precipitated from groundwater onto aquifer soils as it fluxes through the barrier, typical of central area treatment. Increases in soil concentrations within a barrier IRZ were estimated to be 0.02 to 0.2 mg/kg. Assumptions used for this estimate included:
– Groundwater velocity of 2 feet per day.
– Hexavalent chromium concentrations of 10 to 100 g/L.
– Treatment of chromium in groundwater fluxing through the barrier over 5 years.
– Chromium deposited over a 100 foot longitudinal IRZ with a saturated thickness of 55 feet.
G:\36385_Hinkley\008_Final FS Report\FS Addendum #1 Jan 2011\Attachment 2\2011_0131_HA__PG&EAttch2_F.docx
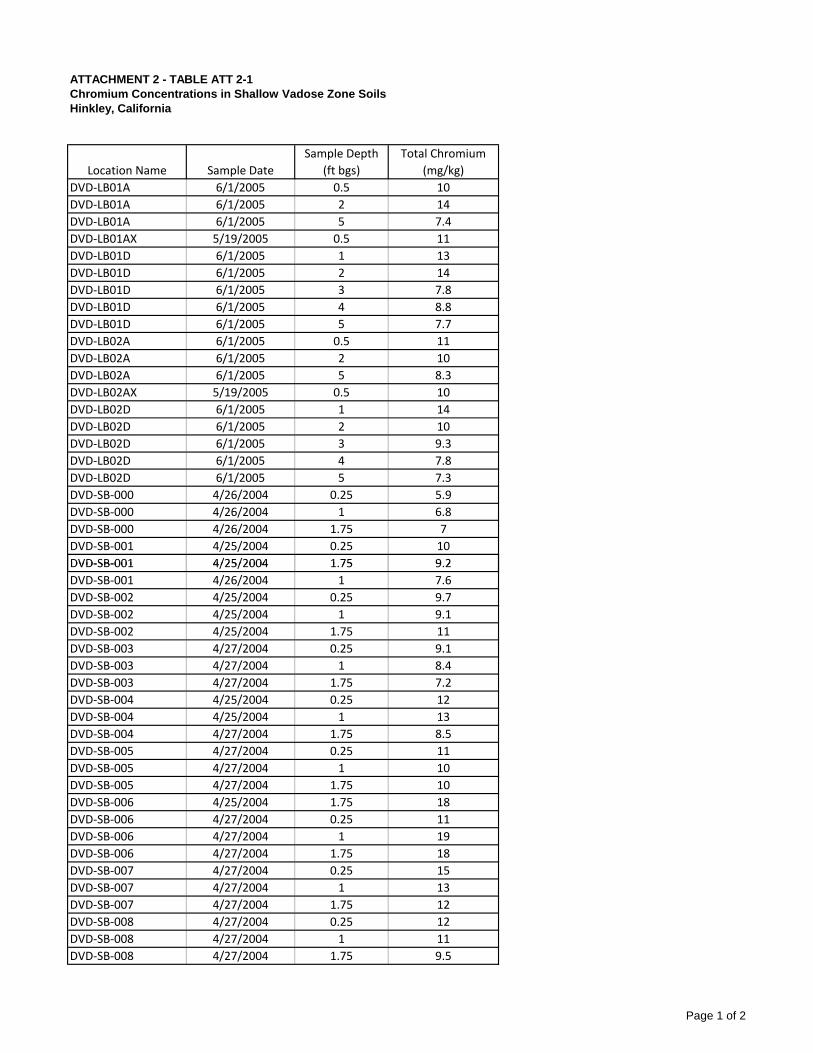
ATTACHMENT 2 - TABLE ATT 2-1Chromium Concentrations in Shallow Vadose Zone SoilsHinkley, California
Location Name Sample Date
Sample Depth
(ft bgs)
Total Chromium
(mg/kg)
DVD‐LB01A 6/1/2005 0.5 10
DVD‐LB01A 6/1/2005 2 14
DVD‐LB01A 6/1/2005 5 7.4
DVD‐LB01AX 5/19/2005 0.5 11
DVD‐LB01D 6/1/2005 1 13
DVD‐LB01D 6/1/2005 2 14
DVD‐LB01D 6/1/2005 3 7.8
DVD‐LB01D 6/1/2005 4 8.8
DVD‐LB01D 6/1/2005 5 7.7
DVD‐LB02A 6/1/2005 0.5 11
DVD‐LB02A 6/1/2005 2 10
DVD‐LB02A 6/1/2005 5 8.3
DVD‐LB02AX 5/19/2005 0.5 10
DVD‐LB02D 6/1/2005 1 14
DVD‐LB02D 6/1/2005 2 10
DVD‐LB02D 6/1/2005 3 9.3
DVD‐LB02D 6/1/2005 4 7.8
DVD‐LB02D 6/1/2005 5 7.3
DVD‐SB‐000 4/26/2004 0.25 5.9
DVD‐SB‐000 4/26/2004 1 6.8
DVD‐SB‐000 4/26/2004 1.75 7
DVD‐SB‐001 4/25/2004 0.25 10
DVD‐SB‐001 4/25/2004 1 75 9 2DVD‐SB‐001 4/25/2004 1.75 9.2
DVD‐SB‐001 4/26/2004 1 7.6
DVD‐SB‐002 4/25/2004 0.25 9.7
DVD‐SB‐002 4/25/2004 1 9.1
DVD‐SB‐002 4/25/2004 1.75 11
DVD‐SB‐003 4/27/2004 0.25 9.1
DVD‐SB‐003 4/27/2004 1 8.4
DVD‐SB‐003 4/27/2004 1.75 7.2
DVD‐SB‐004 4/25/2004 0.25 12
DVD‐SB‐004 4/25/2004 1 13
DVD‐SB‐004 4/27/2004 1.75 8.5
DVD‐SB‐005 4/27/2004 0.25 11
DVD‐SB‐005 4/27/2004 1 10
DVD‐SB‐005 4/27/2004 1.75 10
DVD‐SB‐006 4/25/2004 1.75 18
DVD‐SB‐006 4/27/2004 0.25 11
DVD‐SB‐006 4/27/2004 1 19
DVD‐SB‐006 4/27/2004 1.75 18
DVD‐SB‐007 4/27/2004 0.25 15
DVD‐SB‐007 4/27/2004 1 13
DVD‐SB‐007 4/27/2004 1.75 12
DVD‐SB‐008 4/27/2004 0.25 12
DVD‐SB‐008 4/27/2004 1 11
DVD‐SB‐008 4/27/2004 1.75 9.5
Page 1 of 2
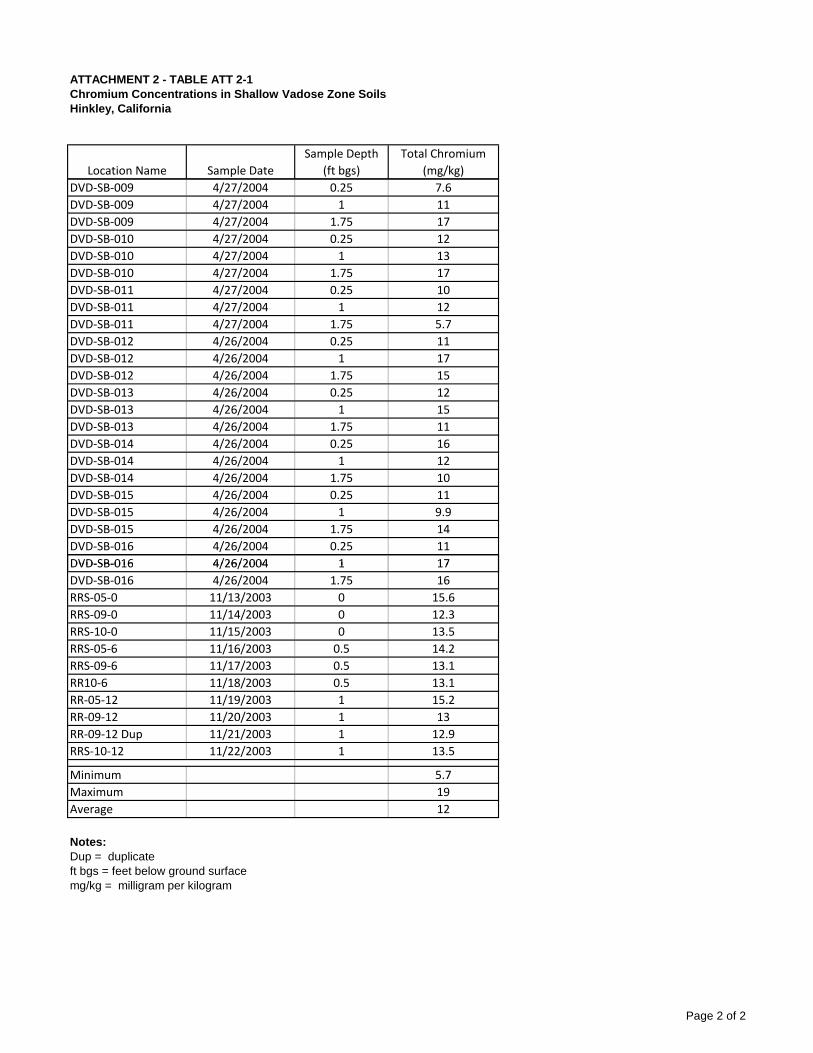
ATTACHMENT 2 - TABLE ATT 2-1Chromium Concentrations in Shallow Vadose Zone SoilsHinkley, California
Location Name Sample Date
Sample Depth
(ft bgs)
Total Chromium
(mg/kg)
DVD‐SB‐009 4/27/2004 0.25 7.6
DVD‐SB‐009 4/27/2004 1 11
DVD‐SB‐009 4/27/2004 1.75 17
DVD‐SB‐010 4/27/2004 0.25 12
DVD‐SB‐010 4/27/2004 1 13
DVD‐SB‐010 4/27/2004 1.75 17
DVD‐SB‐011 4/27/2004 0.25 10
DVD‐SB‐011 4/27/2004 1 12
DVD‐SB‐011 4/27/2004 1.75 5.7
DVD‐SB‐012 4/26/2004 0.25 11
DVD‐SB‐012 4/26/2004 1 17
DVD‐SB‐012 4/26/2004 1.75 15
DVD‐SB‐013 4/26/2004 0.25 12
DVD‐SB‐013 4/26/2004 1 15
DVD‐SB‐013 4/26/2004 1.75 11
DVD‐SB‐014 4/26/2004 0.25 16
DVD‐SB‐014 4/26/2004 1 12
DVD‐SB‐014 4/26/2004 1.75 10
DVD‐SB‐015 4/26/2004 0.25 11
DVD‐SB‐015 4/26/2004 1 9.9
DVD‐SB‐015 4/26/2004 1.75 14
DVD‐SB‐016 4/26/2004 0.25 11
DVD‐SB‐016 4/26/2004 1 17DVD‐SB‐016 4/26/2004 1 17
DVD‐SB‐016 4/26/2004 1.75 16
RRS‐05‐0 11/13/2003 0 15.6
RRS‐09‐0 11/14/2003 0 12.3
RRS‐10‐0 11/15/2003 0 13.5
RRS‐05‐6 11/16/2003 0.5 14.2
RRS‐09‐6 11/17/2003 0.5 13.1
RR10‐6 11/18/2003 0.5 13.1
RR‐05‐12 11/19/2003 1 15.2
RR‐09‐12 11/20/2003 1 13
RR‐09‐12 Dup 11/21/2003 1 12.9
RRS‐10‐12 11/22/2003 1 13.5
Minimum 5.7
Maximum 19
Average 12
Notes:Dup = duplicateft bgs = feet below ground surfacemg/kg = milligram per kilogram
Page 2 of 2
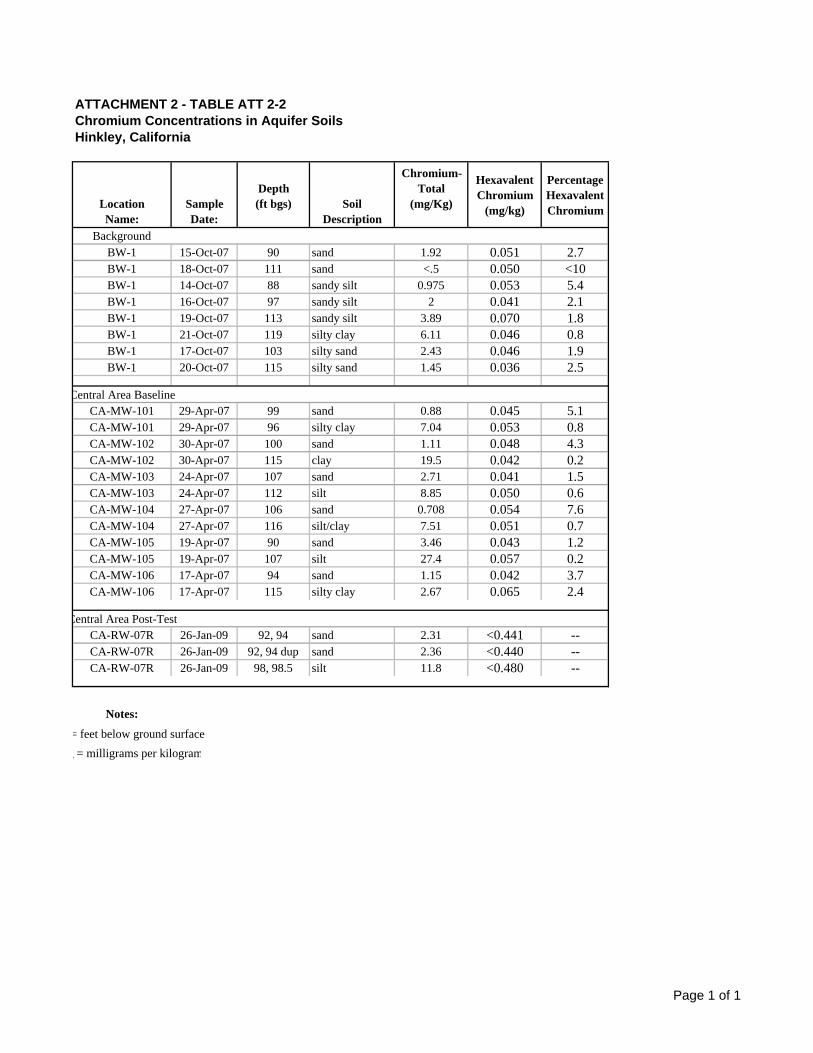
ATTACHMENT 2 - TABLE ATT 2-2Chromium Concentrations in Aquifer SoilsHinkley, California
LocationName:
SampleDate:
Depth (ft bgs) Soil
Description
Chromium-Total
(mg/Kg)
Hexavalent Chromium
(mg/kg)
Percentage Hexavalent Chromium
BackgroundBW-1 15-Oct-07 90 sand 1.92 0.051 2.7BW-1 18-Oct-07 111 sand <.5 0.050 <10BW-1 14-Oct-07 88 sandy silt 0.975 0.053 5.4BW-1 16-Oct-07 97 sandy silt 2 0.041 2.1BW-1 19-Oct-07 113 sandy silt 3.89 0.070 1.8BW-1 21-Oct-07 119 silty clay 6.11 0.046 0.8BW-1 17-Oct-07 103 silty sand 2.43 0.046 1.9BW-1 20-Oct-07 115 silty sand 1.45 0.036 2.5
Central Area BaselineCA-MW-101 29-Apr-07 99 sand 0.88 0.045 5.1CA-MW-101 29-Apr-07 96 silty clay 7.04 0.053 0.8CA-MW-102 30-Apr-07 100 sand 1.11 0.048 4.3CA-MW-102 30-Apr-07 115 clay 19.5 0.042 0.2CA-MW-103 24-Apr-07 107 sand 2.71 0.041 1.5CA-MW-103 24-Apr-07 112 silt 8.85 0.050 0.6CA-MW-104 27-Apr-07 106 sand 0.708 0.054 7.6CA-MW-104 27-Apr-07 116 silt/clay 7.51 0.051 0.7CA-MW-105 19-Apr-07 90 sand 3.46 0.043 1.2CA-MW-105 19-Apr-07 107 silt 27.4 0.057 0.2CA-MW-106 17-Apr-07 94 sand 1.15 0.042 3.7CA-MW-106 17-Apr-07 115 silty clay 2.67 0.065 2.4
Central Area Post-TestCA-RW-07R 26-Jan-09 92, 94 sand 2.31 <0.441 --CA-RW-07R 26-Jan-09 92, 94 dup sand 2.36 <0.440 --CA-RW-07R 26-Jan-09 98, 98.5 silt 11.8 <0.480 --
Notes:
= feet below ground surface
g = milligrams per kilogram
Page 1 of 1