eric peterson - abc conference jan 2015
TRANSCRIPT

Pipeline Access to MarketsDetailing Pipeline Perspectives on Bakken and Niobrara Market
Destinations to Increase Takeaway Capacity Out of the Region
Eric Peterson
Senior Business Analyst
Bakken & Niobrara Crude Takeaway and Markets
Denver, CO
January 2015

Introduction to ARB Midstream
• Denver based infrastructure development company providing midstream solutions
• Strong financial support from private equity
• Utilize in-depth fundamental analysis to identify value propositions of our assets
• Emphasis on early stage development opportunities
• Developing a new crude-by-rail terminal• Niobrara Connector “NiCon”
• Centrally located in the DJ Basin
• Unit train capable
• Scheduled in-service date: June 2015
2

Observations
3
• Rockies crude oil fights for market share in Gulf Coast refining market
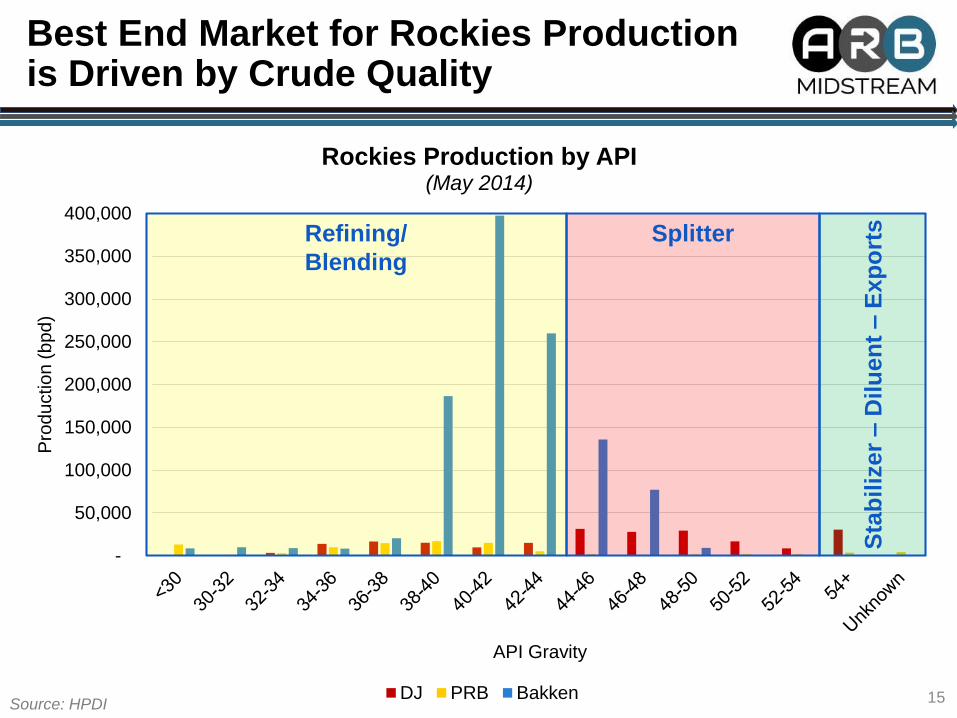
• Crude quality varies significantly between Bakken, DJ & PRB and it is crude quality that determines the best end market
• Most of the imported lights in the Gulf Coast have been pushed out – East and West Coasts still importing significant volumes
• Best end markets for Bakken are the West and East Coasts. Best markets for the DJ are West Coast and Gulf Coast by pipe.

DJ Basin Hitting an Inflection Point in Production, But Still Way Below “Big 3”
-
200,000
400,000
600,000
800,000
1,000,000
1,200,000
1,400,000
1,600,000
0 12 24 36 48 60 72
Incre
me
nta
l P
rod
uctio
n (
bp
d)
Months Developed
Bakken
PRB
DJ Basin
Permian
Eagle Ford
4
Mature Plays
Growing Plays
Source: HPDI, ARB Midstream

Pipeline Routes Out of Rockies Basins
5
DJ
PRB
NECL (90)
Bakken
Cushing
Existing
Under
Construction/Planned
Open Season

Crude Quality by Basin

Homogeneous Crude Quality From the Bakken
7
Cru
de A
PI G
ravity
Source: HPDI, Rig Data

Bakken Has An Average Production Quality of 42 API
8
-
50,000
100,000
150,000
200,000
250,000
300,000
350,000
400,000
Pro
du
ctio
n (
bp
d)
API Gravity
Bakken Production by API(May 2014)
Source: HPDI

Wide Variety of Crude Quality Produced Throughout the PRB
9
Cru
de A
PI G
ravity
Source: HPDI, Rig Data

PRB Produces Some of the Heaviest Crude in the Rockies
10
-
2,000
4,000
6,000
8,000
10,000
12,000
14,000
16,000
18,000
Pro
du
ctio
n (
bp
d)
API Gravity
PRB Production by API(May 2014)
Source: HPDI

High API Production Centered in the Core Area of the Wattenberg Field
11
Cru
de A
PI G
ravity
Source: HPDI, Rig Data

Bulk of DJ Basin Production Volumes are +45 API
12
-
5,000
10,000
15,000
20,000
25,000
30,000
35,000
Pro
du
ctio
n (
bp
d)
API Gravity
DJ Production by API(May 2014)
Source: HPDI, F.E.R.C.

Market Destinations and End Users

14
Bakken
Niobrara
Anadarko
Permian
Eagle Ford
Pipe with Firm Commitments
Under Construction
Completed Pipelines
No
Pipelines
to the West
Coast
New Pipelines Move Crude to Cushing and Gulf Coast – Nothing Going to the West
Source: Company Data, ARB Midstream
-
50,000
100,000
150,000
200,000
250,000
300,000
350,000
400,000
Pro
du
ctio
n (
bp
d)
API Gravity
Rockies Production by API(May 2014)
DJ PRB Bakken
Best End Market for Rockies Production is Driven by Crude Quality
15
Splitter
Sta
bil
izer
–D
ilu
en
t –
Exp
ort
sRefining/
Blending
Source: HPDI

Gulf Coast Waterborne Imports –Q3 2009 vs Q3 2014
-
200,000
400,000
600,000
800,000
1,000,000
1,200,000
Wa
terb
orn
e Im
po
rts (
bp
d)
API Gravity
Q3 2009 Q3 201416
Imports have decreased from
4.8MM to 3.2MMbpd (-32%)
Source: EIA Company Level Imports
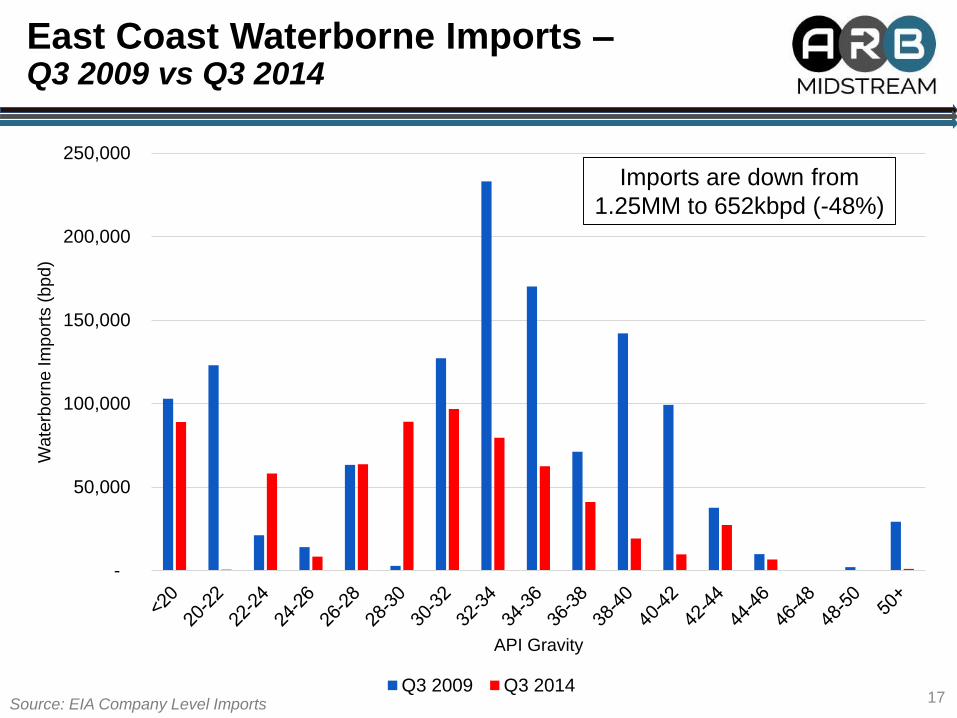
East Coast Waterborne Imports –Q3 2009 vs Q3 2014
-
50,000
100,000
150,000
200,000
250,000
Wate
rborn
e Im
port
s (
bp
d)
API Gravity
Q3 2009 Q3 201417
Imports are down from
1.25MM to 652kbpd (-48%)
Source: EIA Company Level Imports

West Coast Waterborne Imports –Q3 2009 vs Q3 2014
-
50,000
100,000
150,000
200,000
250,000
300,000
Wa
terb
orn
e Im
po
rts (
bp
d)
API Gravity
Q3 2009 Q3 201418
Imports have increased from
1.06MM to 1.18MMbpd (+11%)
Source: EIA Company Level Imports

Comparing Economics of Pipe vs Rail Out of Rockies Basins

Diffs Between Interior and Coastal Markets Drive Infrastructure Build Out
20
ANSWTI + 5
BakkenWTI - 6
LLSWTI + 4
BrentWTI + 6
WTI
Based off of 2014 Average Prices and DifferentialsSource: Argus

Bakken: LLS – ANS Price Differential Greater Than $1.58 = Pipe to LLS Wins
21
-15
-10
-5
0
5
10
LLS
–A
NS
Diffe
ren
tia
l
LLS - ANS Rail to West Coast
Pipe to Gulf Coast Wins
Rail to Washington Wins
Source: EIA, Argus, F.E.R.C.

Bakken : LLS – Brent Price Differential Greater Than -$0.35 = Pipe to LLS Wins
22
-20
-15
-10
-5
0
5
10
LLS
–B
ren
t D
iffe
ren
tia
l
LLS - Brent Rail to East Coast
Pipe to Gulf Coast Wins
Rail to East Coast Wins
Source: EIA, Argus, F.E.R.C.

23
$(5)
$-
$5
$10
$15
$20
0
200
400
600
800
1,000
1,200
Vo
lum
es T
ran
sp
ort
ed
(M
bp
d)
Refining Demand Pipe Volumes Rail Volumes ANS-WTISource: NDPA, BTU Analytics, Argus
Historical Bakken Demand Shows a Correlation Between the ANS-WTI Spread and Crude Pipeline Volumes

Rail Offers Optionality to Better Netbacks Based on Economics
24
BakkenWTI-6
ANSWTI +5
LLSWTI +4
BrentWTI +6
ANSWTI +5
~$10
~$12
~$12~$11
+$1
-$1
-$2+$1
Source: EIA, Argus, F.E.R.C.
~$11-$1
~$14-$4
1
234
5
6

DJ: LLS – ANS Price Differential greater than -$0.96 = Pipe to LLS Wins
25
-15
-10
-5
0
5
10
LLS
–A
NS
Diffe
ren
tia
l
LLS - ANS Rail to West Coast
Pipe to Gulf Coast Wins
Rail to West Coast Wins
Source: EIA, Argus, F.E.R.C.

DJ: LLS – Brent Price Differential greater than -$3.09 = Pipe to LLS Wins
26
-20
-15
-10
-5
0
5
10
LLS
–B
ren
t D
iffe
ren
tia
l
LLS - Brent Rail to East Coast
Pipe to Gulf Coast Wins
Rail to East Coast Wins
Source: EIA, Argus, F.E.R.C.

Rail to the West Coast and Pipe to LLS Market Tie for Best Netbacks
27
DJ*WTI-6
ANSWTI +5
LLSWTI +4
BrentWTI +6~$10
~$10
~$12$0+$1
Source: EIA, Argus, F.E.R.C.
$0~$9
~$12
+$1
-$2
11
34
5

Niobrara Connector “NiCon” Crude by Rail Terminal

Niobrara Connector “NiCon” –Centrally located in the DJ Basin
29
PXP NECL

A Look at Niobrara Connector “NiCon” Crude-by-Rail Terminal Specifications
30
• 79,000 bpd nameplate capacity
• 120 car unit train capable
• 224 Acres
• Industrial spur serviced by the UP
• In Service date June 2015
• Segregation of product in up to 4 - 100,000 bbl tanks

Summary
31
• Rockies crude oil fights for market share in Gulf Coast refining market
• Crude quality varies significantly between Bakken, DJ & PRB and it is crude quality that determines the best end market
• Most of the imported lights in the Gulf Coast have been pushed out – East and West Coasts still importing significant volumes
• Best end markets for Bakken are the West and East Coasts. Best markets for the DJ are West Coast and Gulf Coast by pipe.
