ericsson reports continued solid performance see dramatic data traffic increases in the hspa...
TRANSCRIPT

Second quarter report 2007 July 20, 2007
[Ericsson discloses the information provided herein pursuant to the Swedish Securities Exchange and Clearing Operations Act and/or the Swedish Financial Instruments Trading Act. The information was submitted for publication at 07.30 CET, on July 20, 2007.]
Ericsson reports continued solid performance
• Net sales SEK 47.6 (44.0) b. in the quarter, up 8%, SEK 89.8 (83.2) b. first six months1) • Operating income SEK 9.3 (8.3) b. in the quarter, up 12%, SEK 17.4 (14.9) b. first six months • Operating margin 19.4% (18.4%) in the quarter, 19.4% (17.6%) first six months • Cash flow from operations SEK 4.2 (0.2) b. in the quarter, SEK 8.8 (2.6) b. first six months • Net income SEK 6.4 (5.7) b. in the quarter, up 12%, SEK 12.2 (10.3) b. first six months2) • Earnings per share SEK 0.40 (0.36) in the quarter, up 11%, SEK 0.77 (0.65) first six months2)
CEO COMMENTS “We continue to outpace the market,” said Carl-Henric Svanberg, President and CEO of Ericsson (NASDAQ:ERIC). “Sales showed an encouraging year-over-year increase this quarter, primarily driven by Asia Pacific. Europe, Middle East and Africa were softer while we see improving trends in the Americas. Margins were stable with improved cash generation. The total number of mobile subscriptions has now reached three billion, a milestone for our industry. GSM shipments reach new record levels every quarter and we continue to see growing demand for mobile and fixed broadband. We see dramatic data traffic increases in the HSPA networks that we monitor. We have strengthened our position through the recent acquisitions, and the announced IP broadband agreement with AT&T was a breakthrough in the North American market, confirming our strong offering in next-generation networks. Our services business continues to expand faster than the market and several managed services contracts will start to be revenue generating in coming quarters. We are in a start-up phase in multimedia, where sales and margins will vary. Tandberg Television is now part of our group and will add significant strength. On the handset side, Sony Ericsson had another quarter of strong performance and market share increase. In the ongoing industry consolidation we are expanding our footprint in mobile as well as fixed communications. Our scale advantage from over 40% market share in GSM and WCDMA is obvious and enables technology leading and affordable solutions to an expanding and increasingly demanding market,” concluded Carl-Henric Svanberg.
FINANCIAL HIGHLIGHTS Income statement and cash flow
Second quarter First quarter Six months
SEK b. 2007 20061) Change 2007 Change 2007 20061) Change Net sales, excl. divested operations 47.6 44.0 8% 42.2 13% 89.8 83.2 8% Net sales 47.6 44.8 6% 42.2 13% 89.8 84.3 6% Gross margin 43.0% 42.6% - 43.0% - 43.0% 43.0% - EBITDA margin 23.9% 22,3% - 23.8% - 23.8% 22.0% - Operating income 9.3 8.3 12% 8.2 14% 17.4 14.9 17% Operating margin 19.4% 18.4% - 19.3% - 19.4% 17.6% - Operating margin ex Sony Ericsson 16.4% 16.3% - 15.5% - 16.0% 15.7% - Income after financial items 9.3 8.3 12% 8.3 12% 17.5 15.0 17% Net income2) 6.4 5.7 12% 5.8 10% 12.2 10.3 18% Cash flow from operations 4.2 0.2 - 4.6 - 8.8 2.6 - EPS, SEK2) 0.40 0.36 11% 0.37 8% 0.77 0.65 18%
1)Excludes sales from the in 2006 divested defense business, Ericsson Microwave systems. 2)Attributable to stockholders of the parent company, excluding minority interest.
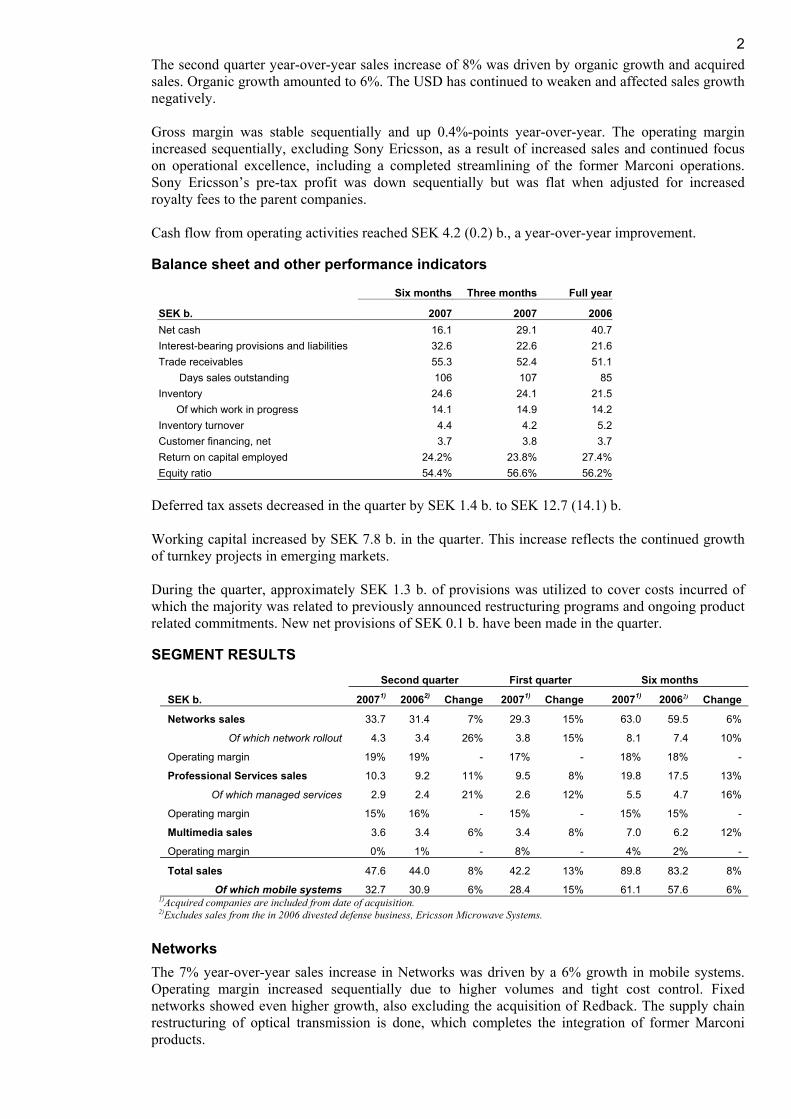
2The second quarter year-over-year sales increase of 8% was driven by organic growth and acquired sales. Organic growth amounted to 6%. The USD has continued to weaken and affected sales growth negatively. Gross margin was stable sequentially and up 0.4%-points year-over-year. The operating margin increased sequentially, excluding Sony Ericsson, as a result of increased sales and continued focus on operational excellence, including a completed streamlining of the former Marconi operations. Sony Ericsson’s pre-tax profit was down sequentially but was flat when adjusted for increased royalty fees to the parent companies. Cash flow from operating activities reached SEK 4.2 (0.2) b., a year-over-year improvement.
Balance sheet and other performance indicators
Six months Three months Full year
SEK b. 2007 2007 2006 Net cash 16.1 29.1 40.7 Interest-bearing provisions and liabilities 32.6 22.6 21.6 Trade receivables 55.3 52.4 51.1 Days sales outstanding 106 107 85 Inventory 24.6 24.1 21.5 Of which work in progress 14.1 14.9 14.2 Inventory turnover 4.4 4.2 5.2 Customer financing, net 3.7 3.8 3.7 Return on capital employed 24.2% 23.8% 27.4% Equity ratio 54.4% 56.6% 56.2%
Deferred tax assets decreased in the quarter by SEK 1.4 b. to SEK 12.7 (14.1) b. Working capital increased by SEK 7.8 b. in the quarter. This increase reflects the continued growth of turnkey projects in emerging markets. During the quarter, approximately SEK 1.3 b. of provisions was utilized to cover costs incurred of which the majority was related to previously announced restructuring programs and ongoing product related commitments. New net provisions of SEK 0.1 b. have been made in the quarter.
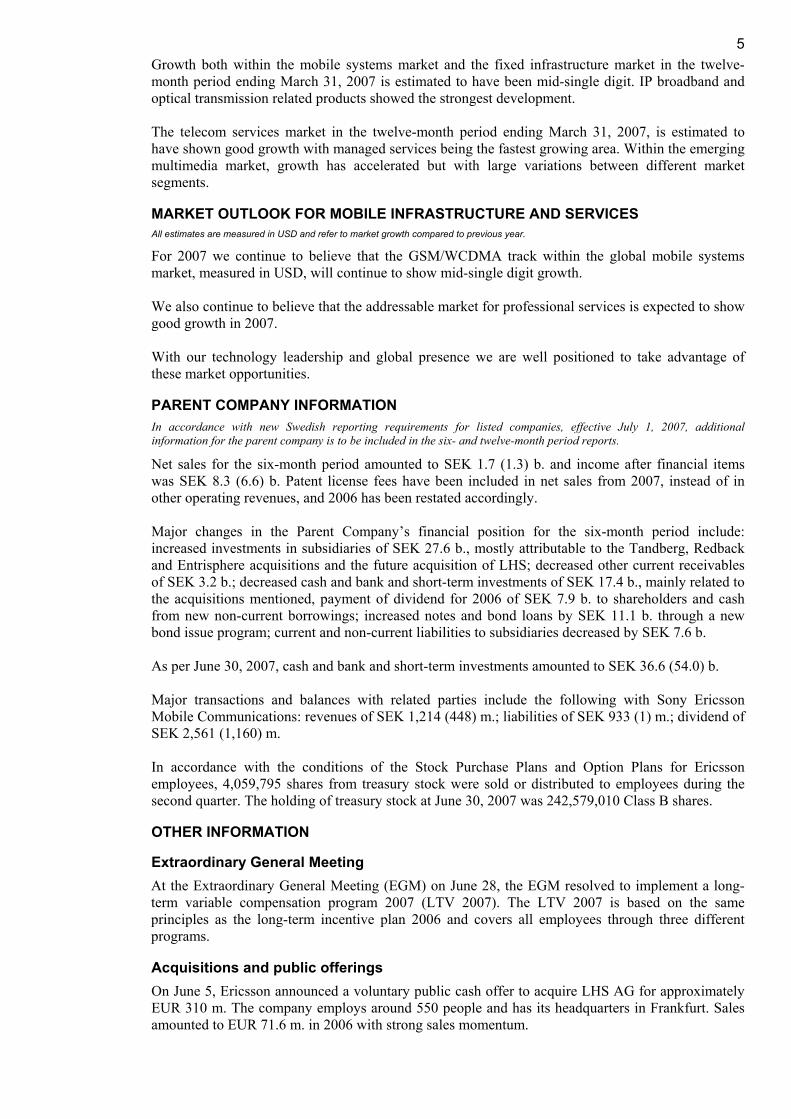
SEGMENT RESULTS Second quarter First quarter Six months
SEK b. 20071) 20062) Change 20071) Change 20071) 20062) Change
Networks sales 33.7 31.4 7% 29.3 15% 63.0 59.5 6%
Of which network rollout 4.3 3.4 26% 3.8 15% 8.1 7.4 10%
Operating margin 19% 19% - 17% - 18% 18% -
Professional Services sales 10.3 9.2 11% 9.5 8% 19.8 17.5 13%
Of which managed services 2.9 2.4 21% 2.6 12% 5.5 4.7 16%
Operating margin 15% 16% - 15% - 15% 15% -
Multimedia sales 3.6 3.4 6% 3.4 8% 7.0 6.2 12%
Operating margin 0% 1% - 8% - 4% 2% -
Total sales 47.6 44.0 8% 42.2 13% 89.8 83.2 8%
Of which mobile systems 32.7 30.9 6% 28.4 15% 61.1 57.6 6% 1)Acquired companies are included from date of acquisition. 2)Excludes sales from the in 2006 divested defense business, Ericsson Microwave Systems.
Networks The 7% year-over-year sales increase in Networks was driven by a 6% growth in mobile systems. Operating margin increased sequentially due to higher volumes and tight cost control. Fixed networks showed even higher growth, also excluding the acquisition of Redback. The supply chain restructuring of optical transmission is done, which completes the integration of former Marconi products.

3The demand for GSM continues with new delivery records and during the quarter Ericsson delivered its millionth GSM base station. Growth is primarily driven by new network deployments and capacity expansions in high-growth markets. Basically all WCDMA network rollouts are HSPA-enabled. Upgrades are ongoing in previously deployed WCDMA networks, laying the foundation for the accelerated migration to mobile broadband. The combination of Redback and Ericsson’s global sales organization is generating considerable business opportunities and several new contracts have been announced. We have completed the first critical integration phase, including leveraging Ericsson’s supply chain capabilities, and we are now entering the next phase, which includes the alignment of sales channels.
Professional Services Sales in Professional Services grew by 11% year-over-year and continue to outpace the market. Growth in local currencies amounted to 14%. Growth was slower in network design and systems integration. The high activity level in previous quarters has now translated into increased network rollout activities, reported in Networks. Operating margin was stable. Managed services grew by 21%, or 24% in local currencies, and recent key wins confirm our strong lead. A new agreement with Oi in Brazil, as well as earlier announced agreements with Orange in the Netherlands and Belgium, Vodafone and KPN in the Netherlands, and the European-wide spare part contract with Vodafone, will start to contribute to sales in the third quarter. Ericsson is managing networks that together serve more than 135 million subscribers worldwide.
Multimedia Growth was 6% year-over-year. We continue to build a strong position in this growing business segment. As previously indicated, Multimedia sales will vary between quarters. Sales, excluding Tandberg Television, were down sequentially, affected by timing of completion of several larger revenue management projects. Operating margin was negatively affected as a result. During the quarter, Mobeon and Drutt were acquired and a public offer was made for LHS, a world leader in post-paid billing systems. Tandberg Television is consolidated from May 2007. During the quarter, Tandberg secured new contracts from broadcasters and operators who are launching IPTV, HDTV and on-demand interactive video services.
Sony Ericsson Mobile Communications For information on transactions with Sony Ericsson Mobile Communications, please see Financial statements and Additional information.
Second quarter First quarter Six months
EUR m. 2007 2006 Change 2007 Change 2007 2006 Change
Number of units shipped (m.) 24.9 15.7 59% 21.8 15% 46.7 29.0 61%
Average selling price (EUR) 125 145 -14% 134 -7% 129 147 -12%
Net sales 3,112 2,272 37% 2,925 6% 6,037 4,264 42%
Gross margin 29.5% 28.5% - 30.3% - 29.9% 27.4% -
Operating margin 10.1% 8.9% - 11.8% - 11.0% 8.1% -
Income before taxes 327 211 55% 362 -10% 689 362 90%
Net income 220 143 54% 254 -13% 474 252 88% Sony Ericsson continued to show profitable growth and market share gains. The company continued to strengthen its product line by announcing a large number of new products across a variety of price points, including the K850, a HSPA, 5 mega-pixel, flag-ship, Cyber-shot phone, and the W960, a high-end Walkman phone with 8 GB of on-board storage. Sony Ericsson is building premium positions also in the low- and mid-tier segments. The volumes increased faster in these segments, resulting in a decline in average selling price. The underlying gross margin, when adjusted for increased parent company royalties, was stable. Ericsson’s share in Sony Ericsson’s income before tax was SEK 1.5 (1.0) b. in the quarter.

4REGIONAL OVERVIEW
Second quarter First quarter Six months
Sales, SEK b. 2007 20061) Change 2007 Change 2007 20061) Change
Western Europe 12.4 12.4 0% 12.5 -1% 24.9 23.7 5% Central and Eastern Europe, Middle East and Africa 11.5 11.5 0% 11.0 4% 22.5 20.8 8%
Asia Pacific 16.6 12.6 32% 12.3 36% 28.9 22.3 30%
Latin America 4.1 3.8 7% 3.3 23% 7.4 7.5 -1%
North America 3.0 3.7 -18% 3.1 -3% 6.1 8.9 -31% 1) Excludes sales from the in 2006 divested defense business, Ericsson Microwave Systems.
The market in Western Europe was soft. This development is primarily a result of ongoing operator consolidation in Italy and shared networks discussions in UK, putting investment decisions on temporary hold. A 3G/HSPA contract was signed with Vodafone Spain. Other significant contracts were announced with Telefónica Deutschland and Wind in Italy. New managed services contracts were announced with Vodafone and KPN in the Netherlands. In Central and Eastern Europe, Middle East and Africa, the high business activity continues, but the large new network rollouts and expansion projects create sales fluctuations between quarters. A number of new contracts have been awarded in the quarter, especially in the Middle East, and major rollouts continue in sub-Sahara. GSM sales to Russia are lower while 3G preparations are ongoing. Asia Pacific’s sales development was very strong and primarily driven by continued expansions in China, India, Bangladesh, Japan and South East Asia. A USD 1 billion GSM expansion agreement with China Mobile was signed. New GSM business with Orascom in Bangladesh was awarded. A USD 2 billion contract, Ericsson’s largest to date, has been signed with Bharti Airtel for GSM/EDGE network infrastructure. Latin America is recovering as expected. Sales during the quarter were mainly driven by GSM rollouts and expansions in most markets, however, Brazil and Mexico are still slow. 3G rollouts are accelerating throughout the region. In North America, the sales gap versus last year is closing. HSPA is now available in more than 165 AT&T markets, the demand is strong and rollout continues. During the quarter, an agreement was reached with AT&T for their “U-verse” IP broadband rollout. This was a breakthrough for Ericsson in next-generation networks and a vote of confidence in our expanded product portfolio and capabilities.
MARKET DEVELOPMENT Growth rates based on Ericsson and market estimates.
Fixed and mobile traffic accelerates due to increased coverage, usage and new multimedia services. Operator investments in infrastructure equipment over the long-term should continue to grow along historical trends of mid- to high-single digits. Infrastructure investments vary over time and between regions depending on regulatory developments, license awards and new technology deployments. Mobile subscriptions grew with some 140 million in the quarter to 3 billion, ahead of previous estimates. 2.6 billion are GSM/WCDMA subscriptions. 135 million are WCDMA subscriptions, growing by 17 million in the quarter. There are 164 WCDMA networks in 73 countries, of which 117 are upgraded to HSPA services. Data traffic in mobile networks accelerates and HSPA has generated a dramatic step up in data traffic. In networks we monitor data traffic has doubled the last six months. In the twelve-month period ending March 31, 2007, fixed broadband connections grew by 17 million per quarter, to a total of approximately 300 million.
5Growth both within the mobile systems market and the fixed infrastructure market in the twelve-month period ending March 31, 2007 is estimated to have been mid-single digit. IP broadband and optical transmission related products showed the strongest development. The telecom services market in the twelve-month period ending March 31, 2007, is estimated to have shown good growth with managed services being the fastest growing area. Within the emerging multimedia market, growth has accelerated but with large variations between different market segments.
MARKET OUTLOOK FOR MOBILE INFRASTRUCTURE AND SERVICES All estimates are measured in USD and refer to market growth compared to previous year.
For 2007 we continue to believe that the GSM/WCDMA track within the global mobile systems market, measured in USD, will continue to show mid-single digit growth. We also continue to believe that the addressable market for professional services is expected to show good growth in 2007. With our technology leadership and global presence we are well positioned to take advantage of these market opportunities.
PARENT COMPANY INFORMATION In accordance with new Swedish reporting requirements for listed companies, effective July 1, 2007, additional information for the parent company is to be included in the six- and twelve-month period reports.
Net sales for the six-month period amounted to SEK 1.7 (1.3) b. and income after financial items was SEK 8.3 (6.6) b. Patent license fees have been included in net sales from 2007, instead of in other operating revenues, and 2006 has been restated accordingly. Major changes in the Parent Company’s financial position for the six-month period include: increased investments in subsidiaries of SEK 27.6 b., mostly attributable to the Tandberg, Redback and Entrisphere acquisitions and the future acquisition of LHS; decreased other current receivables of SEK 3.2 b.; decreased cash and bank and short-term investments of SEK 17.4 b., mainly related to the acquisitions mentioned, payment of dividend for 2006 of SEK 7.9 b. to shareholders and cash from new non-current borrowings; increased notes and bond loans by SEK 11.1 b. through a new bond issue program; current and non-current liabilities to subsidiaries decreased by SEK 7.6 b. As per June 30, 2007, cash and bank and short-term investments amounted to SEK 36.6 (54.0) b. Major transactions and balances with related parties include the following with Sony Ericsson Mobile Communications: revenues of SEK 1,214 (448) m.; liabilities of SEK 933 (1) m.; dividend of SEK 2,561 (1,160) m. In accordance with the conditions of the Stock Purchase Plans and Option Plans for Ericsson employees, 4,059,795 shares from treasury stock were sold or distributed to employees during the second quarter. The holding of treasury stock at June 30, 2007 was 242,579,010 Class B shares.
OTHER INFORMATION
Extraordinary General Meeting At the Extraordinary General Meeting (EGM) on June 28, the EGM resolved to implement a long-term variable compensation program 2007 (LTV 2007). The LTV 2007 is based on the same principles as the long-term incentive plan 2006 and covers all employees through three different programs.
Acquisitions and public offerings On June 5, Ericsson announced a voluntary public cash offer to acquire LHS AG for approximately EUR 310 m. The company employs around 550 people and has its headquarters in Frankfurt. Sales amounted to EUR 71.6 m. in 2006 with strong sales momentum.
6On June 27, the acquisition of Drutt Corporation was closed. Drutt is a leading provider of service delivery platform solutions with operations in Sweden, China, Canada and Mexico and employs around 85 people.
Credit rating On May 14, Moody’s Investors Service upgraded Ericsson’s long-term debt ratings to Baa1 from Baa2 and affirmed the Company’s Prime 2 short-term debt ratings. According to Moody’s, the upgrade was based on Ericsson’s growing track record of robust profitability and very conservative financial structure. On June 15, Standard & Poor’s upgraded Ericsson’s credit rating two notches to BBB+/A-2 from BBB-/A-3. The upgrade is predicated on Standard & Poor’s expectations that Ericsson will continue to benefit significantly from the expansion of the global mobile systems market, thanks to its leading market positions in key second and third generation mobile network systems technologies and its low cost breakeven point. Standard & Poor’s said that the rating reflects Ericsson’s remarkably strong capital structure and liquidity position.
Funding program In the quarter, Ericsson completed a multi-currency bond issue program of SEK 11.1 b. The proceeds of the offering are mainly intended for the re-financing of existing loans. On July 16, Ericsson signed a new seven-year USD 2 b. committed back-up facility with its core group of banks, which replaces the existing USD 1 b. five-year back-up facility.
New information sections In accordance with new Swedish reporting requirements for listed companies, effective July 1, 2007, two additional sections have been added to the report for the six-month period; Assessment of risk environment and Board assurance. The full Board is also required to sign the six-month interim report. The same requirements apply to the report for the twelve-month period.
Assessment of risk environment We have reviewed Ericsson’s operational and financial risk factors and exposures as described under “Risk factors” in our 2006 Annual Report and have determined that the risk environment has not materially changed. However, the increased activities related to the new Multimedia segment may result in a more volatile quarterly sales pattern. Specific additional risks for the near term are associated with the acquisitions made during 2007, as a timely and effective integration of these is essential to make them accretive as planned.
Risk factors and exposures in focus for the Parent Company and the Ericsson Group for the forthcoming six-month period include: changes in foreign exchange rates, in particular a continued weakness or further deterioration of the USD/SEK rate; increases in interest rates and the potential effect on our customers’ willingness to invest in network development; effects of the ongoing industry consolidation among our customers as well as between our largest competitors; an increased volume of turn-key projects, which may result in working capital build-up which in turn puts pressure on our cash conversion rate.
Ericsson conducts business in certain countries subject to trade restrictions or which are focused on by certain investors. We stringently follow all relevant regulations and trade embargos applicable to us in our dealings with customers operating in such countries. Moreover, Ericsson operates globally in accordance with Group level policies and directives for ethics and conduct. In no way should our business activities in these countries be construed as supporting a particular political agenda or regime. We have activities in such countries mainly due to certain customers with multi-country operations puts demands on us to support them in all of their markets.
Please further refer to Ericsson’s Annual report 2006 to learn more about our risks and uncertainties along with our strategies and tactics to mitigate the risk exposures or limit unfavorable outcomes which remains valid also for 2007.
7
BOARD ASSURANCE The Board of Directors and the CEO certify that the half-yearly financial report gives a fair review of the performance of the business, position and profit or loss of the Company and the Group, and describes the principal risks and uncertainties that the Company and the companies in the Group face. Stockholm, July 20, 2007
Telefonaktiebolaget LM Ericsson (publ)
Org. Nr. 556016-0680
Sverker Martin-Löf Deputy chairman
Michael Treschow Chairman
Marcus Wallenberg Deputy chairman
Nancy McKinstry Member of the board
Sir Peter L. Bonfield Member of the board
Anders Nyrén Member of the board
Börje Ekholm Member of the board
Ulf J. Johansson Member of the board
Katherine Hudson Member of the board
Torbjörn Nyman Member of the board
Monica Bergström Member of the board
Jan Hedlund Member of the board
Carl-Henric Svanberg Member of the board and President and CEO

8
REVIEW REPORT We have reviewed this report for the period January 1 to June 30, 2007, for Telefonaktiebolaget LM Ericsson (publ). The board of directors and the CEO are responsible for the preparation and presentation of this interim financial information in accordance with IAS 34 and the Annual Accounts Act. Our responsibility is to express a conclusion on this interim financial information based on our review. We conducted our review in accordance with the Standard on Review Engagements SÖG 2410, Review of Interim Financial Information Performed by the Independent Auditor of the Entity, issued by FAR. A review consists of making inquiries, primarily of persons responsible for financial and accounting matters, and applying analytical and other review procedures. A review is substantially less in scope than an audit conducted in accordance with Standards on Auditing in Sweden, RS, and other generally accepted auditing practices. The procedures performed in a review do not enable us to obtain a level of assurance that would make us aware of all significant matters that might be identified in an audit. Therefore, the conclusion expressed based on a review does not give the same level of assurance as a conclusion expressed based on an audit. Based on our review, nothing has come to our attention that causes us to believe that the accompanying interim financial information is not, in all material respects, in accordance with IAS 34 and the Annual Accounts Act. Stockholm, July 20, 2007 PricewaterhouseCoopers AB
www.ericsson.com/investors/financial_reports/2007/6month07-en.pdf
Bo Hjalmarsson Peter Clemedtson Authorized Public Accountant Authorized Public Accountant Lead partner Date for next report: October 25, 2007
EDITOR’S NOTE To read the complete report with tables, please go to:
Ericsson invites media, investors and analysts to a press conference at the Ericsson headquarters, Torshamnsgatan 23, Stockholm, at 09.00 (CET), July 20. An analyst and media conference call will begin at 14.00 (CET). Live audio webcasts of the press conference and conference call as well as supporting slides will be available at www.ericsson.com/press and www.ericsson.com/investors FOR FURTHER INFORMATION, PLEASE CONTACT Henry Sténson, Senior Vice President, Communications Phone: +46 8 719 4044 E-mail: [email protected] or [email protected] Investors Gary Pinkham, Vice President, Investor Relations Phone: +46 8 719 0000 E-mail: [email protected] Susanne Andersson, Investor Relations Phone: +46 8 719 4631 E-mail: [email protected]
Glenn Sapadin, Investor Relations, North America Phone: +1 212 843 8435 E-mail: [email protected] Media Åse Lindskog, Vice President, Head of Media Relations Phone: +46 8 719 9725, +46 730 244 872 E-mail: [email protected] Ola Rembe, Vice President Phone: +46 8 719 9727, +46 730 244 873 E-mail:[email protected]

Telefonaktiebolaget LM Ericsson (publ) Org. number: 556016-0680
Torshamnsgatan 23 SE-164 83 Stockholm
Phone: +46 8 719 00 00 www.ericsson.com
Safe Harbor Statement of Ericsson under the Private Securities Litigation Reform Act of 1995; All statements made or incorporated by reference in this release, other than statements or characterizations of historical facts, are forward-looking statements. These forward-looking statements are based on our current expectations, estimates and projections about our industry, management’s beliefs and certain assumptions made by us. Forward-looking statements can often be identified by words such as “anticipates”, “expects”, “intends”, “plans”, “predicts”, “believes”, “seeks”, “estimates”, “may”, “will”, “should”, “would”, “potential”, “continue”, and variations or negatives of these words, and include, among others, statements regarding: (i) strategies, outlook and growth prospects; (ii) positioning to deliver future plans and to realize potential for future growth; (iii) liquidity and capital resources and expenditure, and our credit ratings; (iv) growth in demand for our products and services; (v) our joint venture activities; (vi) economic outlook and industry trends; (vii) developments of our markets; (viii) the impact of regulatory initiatives; (ix) research and development expenditures; (x) the strength of our competitors; (xi) future cost savings; (xii) plans to launch new products and services; (xiii) assessments of risks; (xiv) integration of acquired businesses; (xv) compliance with rules and regulations and (xvi) infringements of intellectual property rights of others. In addition, any statements that refer to expectations, projections or other characterizations of future events or circumstances, including any underlying assumptions, are forward-looking statements. These forward-looking statements speak only as of the date hereof and are based upon the information available to us at this time. Such information is subject to change, and we will not necessarily inform you of such changes. These statements are not guarantees of future performance and are subject to risks, uncertainties and assumptions that are difficult to predict. Therefore, our actual results could differ materially and adversely from those expressed in any forward-looking statements as a result of various factors. Important factors that may cause such a difference for Ericsson include, but are not limited to: (i) material adverse changes in the markets in which we operate or in global economic conditions; (ii) increased product and price competition; (iii) further reductions in capital expenditure by network operators; (iv) the cost of technological innovation and increased expenditure to improve quality of service; (v) significant changes in market share for our principal products and services; (vi) foreign exchange rate or interest rate fluctuations; and (vii) the successful implementation of our business and operational initiatives.
FINANCIAL STATEMENTS AND ADDITIONAL INFORMATION Financial statements Page Consolidated income statement 10 Consolidated balance sheet 11 Consolidated statement of cash flows 12 Consolidated statement of recognized income and expense 13 Consolidated income statement - isolated quarters 14 Parent company income statement 15 Parent company balance sheet 16 Additional information Page Accounting policies 17 Net sales by segment by quarter 19 Operating margin by segment by quarter 20 Number of employees 20 Net sales by market area by quarter 21 Top ten markets in sales 22 External net sales by market area by segment 22 Transactions with Sony Ericsson Mobile Communications 22 Other information 23 Ericsson planning assumptions for year 2007 23 Acquisition of Tandberg Television 24

10
ERICSSONCONSOLIDATED INCOME STATEMENT
SEK million 2007 2006 Change 2007 2006 Change
Net sales 47,619 44,768 6% 89,775 84,339 6%Cost of sales -27,166 -25,692 -51,200 -48,038Gross margin 20,453 19,076 7% 38,575 36,301 6%Gross margin % 43.0% 42.6% 43.0% 43.0%
Research and development expenses -7,208 -6,767 7% -13,661 -13,388 2%Selling and administrative expenses -5,856 -5,263 11% -11,178 -10,055 11%Operating expenses -13,064 -12,030 -24,839 -23,443
Other operating income 389 215 81% 551 330 67%Share in earnings of JVs and associated companies 1,477 992 49% 3,119 1,689 85%Operating income 9,255 8,253 12% 17,406 14,877 17%Operating margin % 19.4% 18.4% 19.4% 17.6%
Financial income 322 567 878 1,089Financial expenses -292 -529 -735 -996Income after financial items 9,285 8,291 12% 17,549 14,970 17%
Taxes -2,776 -2,559 -5,191 -4,633Net income 6,509 5,732 14% 12,358 10,337 20%
Net income attributable to:Stockholders of the parent company 6,409 5,712 12,224 10,287Minority interest 100 20 134 50
Other information
Average number of shares, basic (million) 15,890 15,869 15,886 15,867Earnings per share, basic (SEK) 1) 0.40 0.36 0.77 0.65Earnings per share, diluted (SEK) 1) 0.40 0.36 0.77 0.65
1) Based on Net income attributable to stockholders of the parent company
Apr - Jun Jan - Jun

11
ERICSSONCONSOLIDATED BALANCE SHEET
Jun 30 Mar 31 Dec 31SEK million 2007 2007 2006
ASSETS
Non-current assets Intangible assets Capitalized development expenses 4,325 4,659 4,995 Goodwill 22,448 16,533 6,824 Intellectual property rights 25,045 21,050 15,649
Property, plant and equipment 8,439 8,178 7,881
Financial assets Equity in JVs and associated companies 9,205 10,957 9,409 Other investments in shares and participations 805 2,592 721 Customer financing, non-current 1,468 896 1,921 Other financial assets, non-current 3,031 2,639 2,409
Deferred tax assets 12,717 14,135 13,564
87,483 81,639 63,373
Current assets Inventories 24,631 24,070 21,470
Trade receivables 55,296 52,399 51,070Customer financing, current 2,278 2,932 1,735Other current receivables 14,606 12,355 15,012
Short-term investments 23,110 25,510 32,311Cash and cash equivalents 25,561 26,192 29,969
145,482 143,458 151,567
Total assets 232,965 225,097 214,940
EQUITY AND LIABILITIES
EquityStockholders' equity 125,747 126,475 120,113Minority interest in equity of consolidated subsidiaries 889 829 782
126,636 127,304 120,895
Non-current liabilities Post-employment benefits 6,018 6,877 6,968Provisions, non-current 437 684 602Deferred tax liabilities 3,992 2,710 382Borrowings, non-current 21,110 13,352 12,904Other non-current liabilities 1,836 2,690 2,868
33,393 26,313 23,724
Current liabilitiesProvisions, current 11,238 11,607 13,280Borrowings, current 5,447 2,346 1,680Trade payables 17,668 17,362 18,183Other current liabilities 38,583 40,165 37,178
72,936 71,480 70,321
Total equity and liabilities 232,965 225,097 214,940
Of which interest-bearing liabilities and post-employment benefits 32,575 22,575 21,552
Net cash 16,096 29,127 40,728
Assets pledged as collateral 345 329 285Contingent liabilities 1,333 1,287 1,392

12
ERICSSONCONSOLIDATED STATEMENT OF CASH FLOWS
Jan - Dec
SEK million 2007 2006 2007 2006 2006
Net income 6,509 5,732 12,358 10,337 26,436Adjustments to reconcile net income to cash- taxes 1,424 1,397 1,135 1,874 4,282- undistributed earnings in JVs and associated companies 1,915 -514 411 242 -2,971- depreciation, amortization and impairment losses 2,140 1,716 4,003 3,713 7,516- other 33 39 -131 29 -2,767 12,021 8,370 17,776 16,195 32,496
Operating net assetsInventories -496 -433 -2,283 -2,903 -2,553Customer financing, current and non-current 94 -1,586 -26 246 1,186Trade receivables -2,276 -3,269 -2,076 -4,505 -10,563Provisions and post-employment benefits -507 -2,427 -2,566 -4,340 -3,729Other operating assets and liabilities, net -4,616 -422 -2,029 -2,054 1,652
-7,801 -8,137 -8,980 -13,556 -14,007
Cash flow from operating activities 4 220 233 8,796 2,639 18,489
Investing activitiesInvestments in property, plant and equipment -1 024 -1 371 -1,792 -2,071 -3,827Sales of property, plant and equipment 38 46 77 60 185Acquisitions and divestments of subsidiaries and other operations, net -8 264 - 21 -23,960 -17,632 -14,992Product development - 251 - 412 -457 -770 -1,353Other investing activities - 42 - 462 -116 -271 -1,070Short-term investments 1 654 9 700 9,177 6,862 6,180Cash flow from investing activities -7,889 7,480 -17,071 -13,822 -14,877
Cash flow before financing activities -3 669 7,713 -8,275 -11,183 3,612
Financing activitiesDividends paid -7 948 -7 154 -7,948 -7,160 -7,343Other financing activities 11 323 -8 147 11,895 -7,249 -8,096Cash flow from financing activities 3 375 -15 301 3,947 -14,409 -15,439
Effect of exchange rate changes on cash - 337 485 -80 500 58
Net change in cash - 631 -7 103 -4,408 -25,092 -11,769
Cash and cash equivalents, beginning of period 26 192 23 749 29,969 41,738 41,738Cash and cash equivalents, end of period 25 561 16 646 25,561 16,646 29,969
Jan - JunApr - Jun
13
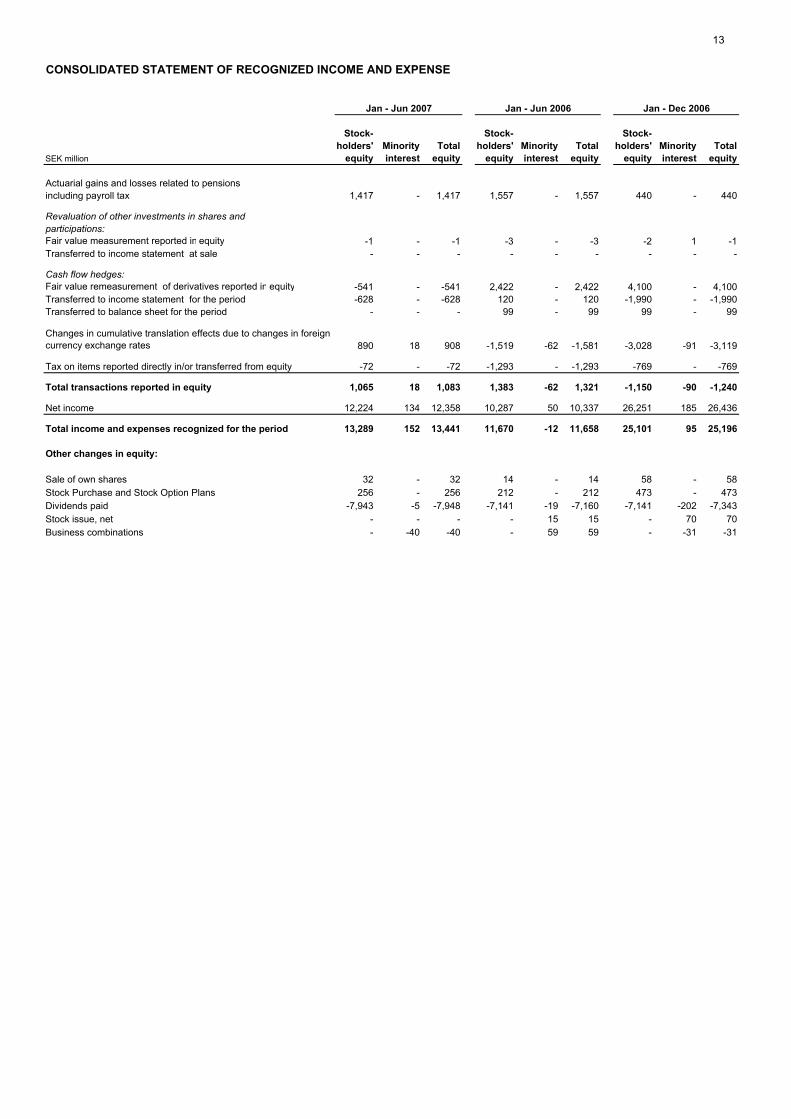
CONSOLIDATED STATEMENT OF RECOGNIZED INCOME AND EXPENSE
Stock- Stock- Stock-holders' Minority Total holders' Minority Total holders' Minority Total
SEK million equity interest equity equity interest equity equity interest equity
Actuarial gains and losses related to pensionsincluding payroll tax 1,417 - 1,417 1,557 - 1,557 440 - 440
Revaluation of other investments in shares and participations:Fair value measurement reported in equity -1 - -1 -3 - -3 -2 1 -1Transferred to income statement at sale - - - - - - - - -
Cash flow hedges: Fair value remeasurement of derivatives reported in equity -541 - -541 2,422 - 2,422 4,100 - 4,100Transferred to income statement for the period -628 - -628 120 - 120 -1,990 - -1,990Transferred to balance sheet for the period - - - 99 - 99 99 - 99
Changes in cumulative translation effects due to changes in foreign currency exchange rates 890 18 908 -1,519 -62 -1,581 -3,028 -91 -3,119
Tax on items reported directly in/or transferred from equity -72 - -72 -1,293 - -1,293 -769 - -769
Total transactions reported in equity 1,065 18 1,083 1,383 -62 1,321 -1,150 -90 -1,240
Net income 12,224 134 12,358 10,287 50 10,337 26,251 185 26,436
Total income and expenses recognized for the period 13,289 152 13,441 11,670 -12 11,658 25,101 95 25,196
Other changes in equity:
Sale of own shares 32 - 32 14 - 14 58 - 58Stock Purchase and Stock Option Plans 256 - 256 212 - 212 473 - 473Dividends paid -7,943 -5 -7,948 -7,141 -19 -7,160 -7,141 -202 -7,343Stock issue, net - - - - 15 15 - 70 70Business combinations - -40 -40 - 59 59 - -31 -31
Jan - Jun 2007 Jan - Jun 2006 Jan - Dec 2006

14
ERICSSONCONSOLIDATED INCOME STATEMENT - ISOLATED QUARTERS
SEK million Q2 Q1 Q4 Q3 Q2 Q1
Net sales 47,619 42,156 54,211 41,271 44,768 39,571Cost of sales -27,166 -24,034 -31,331 -25,506 -25,692 -22,346Gross margin 20,453 18,122 22,880 15,765 19,076 17,225Gross margin % 43.0% 43.0% 42.2% 38.2% 42.6% 43.5%
Research and development expenses -7,208 -6,453 -7,155 -6,990 -6,767 -6,621Selling and administrative expenses -5,856 -5,322 -6,071 -5,296 -5,263 -4,792Operating expenses -13,064 -11,775 -13,226 -12,286 -12,030 -11,413
Other operating income 389 162 321 3,252 215 115Share in earnings of JVs and assoc. companies 1,477 1,642 2,210 2,035 992 697Operating income 9,255 8,151 12,185 8,766 8,253 6,624Operating margin % 19.4% 19.3% 22.5% 21.2% 18.4% 16.7%
Financial income 322 556 366 499 567 522Financial expenses -292 -443 -396 -397 -529 -467Income after financial items 9,285 8,264 12,155 8,868 8,291 6,679
Taxes -2,776 -2,415 -2,352 -2,572 -2,559 -2,074Net income 6,509 5,849 9,803 6,296 5,732 4,605
Net income attributable to:Stockholders of the parent company 6,409 5,815 9,731 6,233 5,712 4,575Minority interest 100 34 72 63 20 30
Other information
Average number of shares, basic (million) 15,890 15,883 15,877 15,872 15,869 15,866Earnings per share, basic (SEK)1) 0.40 0.37 0.61 0.39 0.36 0.29Earnings per share, diluted (SEK)1) 0.40 0.36 0.61 0.39 0.36 0.29
1) Based on Net income attributable to stockholders of the parent company
20062007

15
ERICSSONPARENT COMPANY INCOME STATEMENT
SEK million 2007 2006
Net sales 1,710 1,313Cost of sales -9 -125Gross margin 1,701 1,188
Operating expenses 1) -722 -36
Other operating revenues and costs 1,143 977Operating income 2,122 2,129
Financial net 6,183 4,460Income after financial items 8,305 6,589
Taxes -721 -547Net income 7,584 6,042
1) Operating expenses include the net effect of risk provisions for customer financing of SEK +108 million (SEK +1,262 million in 2006).
Jan - Jun
16
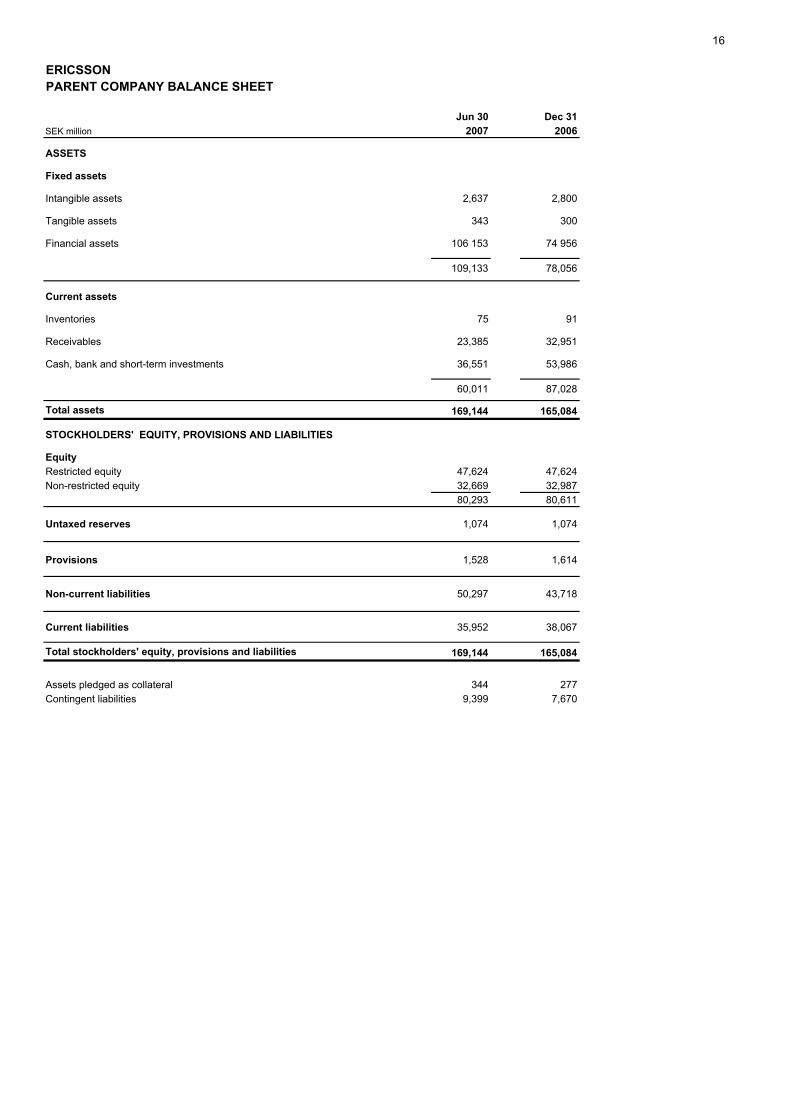
ERICSSONPARENT COMPANY BALANCE SHEET
Jun 30 Dec 31SEK million 2007 2006
ASSETS
Fixed assets
Intangible assets 2,637 2,800
Tangible assets 343 300
Financial assets 106 153 74 956
109,133 78,056
Current assets
Inventories 75 91
Receivables 23,385 32,951
Cash, bank and short-term investments 36,551 53,986
60,011 87,028
Total assets 169,144 165,084
STOCKHOLDERS' EQUITY, PROVISIONS AND LIABILITIES
EquityRestricted equity 47,624 47,624Non-restricted equity 32,669 32,987
80,293 80,611
Untaxed reserves 1,074 1,074
Provisions 1,528 1,614
Non-current liabilities 50,297 43,718
Current liabilities 35,952 38,067
Total stockholders' equity, provisions and liabilities 169,144 165,084
Assets pledged as collateral 344 277Contingent liabilities 9,399 7,670

17ACCOUNTING POLICIES AND CHANGES IN FINANCIAL REPORTING STRUCTURE This interim report is prepared in accordance with IAS 34. The term IFRS used in this document refers to the application of IAS and IFRS as well as interpretations of these standards as issued by IASB’s Standards Interpretation Committee (SIC) and International Financial Reporting Interpretations Committee (IFRIC). New or amended standards (IAS/IFRS) IFRS 7, Financial Instruments: Disclosures, is amended effective from January 1, 2007, together with a complementary amendment to IAS 1, Presentation of Financial Statements – Capital Disclosures. IFRS 7 introduces new disclosure requirements to improve the information about financial instruments. The amendment to IAS 1 introduces disclosures about the level of an entity’s capital and how it manages capital. Since the new or amended standards relate to changes in disclosure or presentation, they have not had any impact on the Company’s financial result or position. New interpretations (IFRIC:s) None of the new IFRIC:s that shall be applied as from January 1, 2007, have had a significant impact on the Company’s financial result or position. The IFRIC:s applicable as from January 1, 2007, are: • IFRIC Interpretation 7: Applying the Restatement Approach under IAS 29 Financial Reporting in
Hyperinflationary Economies. This Interpretation provides guidance on how to apply the requirements of IAS 29 in a reporting period in which an entity identifies the existence of hyperinflation in the economy of its functional currency.
• IFRIC Interpretation 8: Scope of IFRS 2. This interpretation applies to transactions when the identifiable consideration received appears to be less than the fair value of the equity instruments granted.
• IFRIC Interpretation 9: Reassessment of Embedded Derivatives. This interpretation determines when an entity shall reassess the need for an embedded derivative to be separated.
• IFRIC Interpretation 10: Interim Financial Reporting and Impairment. As per this interpretation, an entity shall not reverse an impairment loss recognized in a previous interim period in respect of goodwill or an investment in either an equity instrument or a financial asset carried at cost.
Amendment issued by the Swedish Financial Accounting Standards Council (Redovisningsrådet) In March 2007, an amendment to URA 43 Accounting for special payroll tax and tax on investment returns was issued. The amendment had no impact on the Company’s financial result or position. Changes in financial reporting structure • Business segments. As previously announced, Ericsson has from January 1, 2007, reorganized its operating
structure. From the first quarter report 2007, the company’s financial reporting will be adapted to reflect this new structure. The Company will also take this opportunity to make other modifications to further enhance transparency with additional disclosures.
Ericsson will report the following business segments: Networks, Professional Services and Multimedia. Phones, represented by the share in earnings of Sony Ericsson will be reported as before. However, Sony Ericsson have increased its disclosure as of the first quarter report 2007.
The changed segment reporting is in accordance with the objectives set forth in IAS 14 Segment reporting. The business activities previously reported in Other Operations have been merged into the new segments to better leverage the opportunities provided by internal business combinations.
Business segment Networks includes products for mobile and fixed broadband access, core networks, transmission and next-generation IP-networks. Related network rollout services are also included. In addition, the power modules and cables operations, previously reported under Other Operations, are now included within Networks, as well as the acquired operations of Redback and Entrisphere.
18
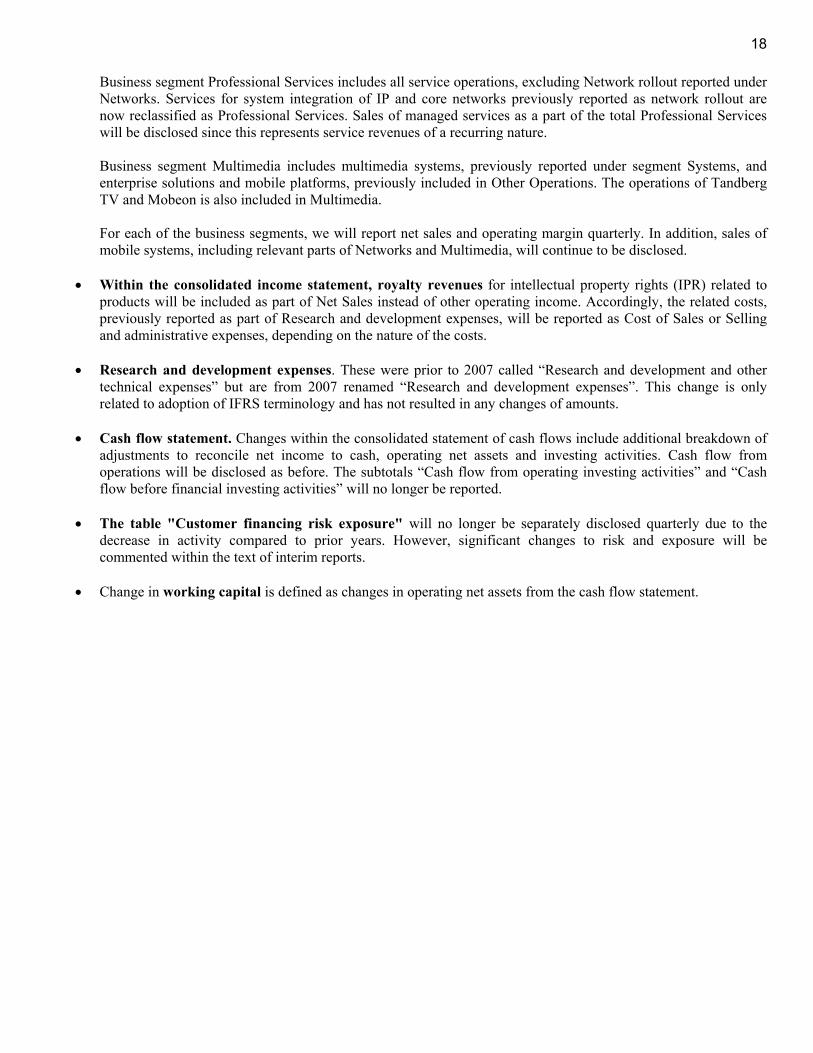
Business segment Professional Services includes all service operations, excluding Network rollout reported under Networks. Services for system integration of IP and core networks previously reported as network rollout are now reclassified as Professional Services. Sales of managed services as a part of the total Professional Services will be disclosed since this represents service revenues of a recurring nature.
Business segment Multimedia includes multimedia systems, previously reported under segment Systems, and enterprise solutions and mobile platforms, previously included in Other Operations. The operations of Tandberg TV and Mobeon is also included in Multimedia.
For each of the business segments, we will report net sales and operating margin quarterly. In addition, sales of mobile systems, including relevant parts of Networks and Multimedia, will continue to be disclosed.
• Within the consolidated income statement, royalty revenues for intellectual property rights (IPR) related to
products will be included as part of Net Sales instead of other operating income. Accordingly, the related costs, previously reported as part of Research and development expenses, will be reported as Cost of Sales or Selling and administrative expenses, depending on the nature of the costs.
• Research and development expenses. These were prior to 2007 called “Research and development and other
technical expenses” but are from 2007 renamed “Research and development expenses”. This change is only related to adoption of IFRS terminology and has not resulted in any changes of amounts.
• Cash flow statement. Changes within the consolidated statement of cash flows include additional breakdown of adjustments to reconcile net income to cash, operating net assets and investing activities. Cash flow from operations will be disclosed as before. The subtotals “Cash flow from operating investing activities” and “Cash flow before financial investing activities” will no longer be reported.
• The table "Customer financing risk exposure" will no longer be separately disclosed quarterly due to the decrease in activity compared to prior years. However, significant changes to risk and exposure will be commented within the text of interim reports.
• Change in working capital is defined as changes in operating net assets from the cash flow statement.

19
NET SALES BY SEGMENT BY QUARTER
SEK million
Isolated quarters Q2 Q1 Q4 Q3 Q2 Q1Networks 33,666 29,350 39,035 29,155 31,448 28,056 - Of which Network rollout 4,309 3,752 5,558 3,498 3,430 3,924Professional Services 10,257 9,516 10,566 8,722 9,252 8,307 - Of which Managed services 2,910 2,592 2,514 2,238 2,414 2,325Multimedia 3,650 3,370 4,548 3,066 3,449 2,831Unallocated 1) - - - 372 764 479Less: Intersegment sales 46 -80 62 -44 -145 -102Total 47,619 42,156 54,211 41,271 44,768 39,5711) Including the Defense business
Sequential change (%) Q2 Q1 Q4 Q3 Q2 Q1 2)
Networks 15% -25% 34% -7% 12% - - Of which Network rollout 15% -32% 59% 2% -13% -Professional Services 8% -10% 21% -6% 11% - - Of which Managed services 12% 3% 12% -7% 4% -Multimedia 8% -26% 48% -11% 22% -Unallocated 1) - - - - - -Less: Intersegment sales - - - - - -Total 13% -22% 31% -8% 13% -1) Including the Defense business2) 2005 is not restated according to new organization
Year over year change (%) Q2 Q1 Q4 Q3 Q2 Q1Networks 7% 5% - - - - - Of which Network rollout 26% -4% - - - -Professional Services 11% 15% - - - - - Of which Managed services 21% 11% - - - -Multimedia 6% 19% - - - -Unallocated 1) - - - - - -Less: Intersegment sales - - - - - -Total 6% 7% - - - -1) Including the Defense business2) 2005 is not restated according to new organization
Year to Date 0706 0703 0612 0609 0606 0603Networks 63,016 29,350 127,694 88,659 59,504 28,056 - Of which Network rollout 8,061 3,752 16,410 10,852 7,354 3,924Professional Services 19,773 9,516 36,847 26,281 17,559 8,307 - Of which Managed services 5,502 2,592 9,491 6,977 4,739 2,325Multimedia 7,020 3,370 13,894 9,346 6,280 2,831Unallocated 1) - - 1,615 1,615 1,243 479Less: Intersegment sales -34 -80 -229 -291 -247 -102Total 89,775 42,156 179,821 125,610 84,339 39,5711) Including the Defense business
YTD year over year change (%) 0706 0703 0612 0609 0606 0603Networks 6% 5% - - - - - Of which Network rollout 10% -4% - - - -Professional Services 13% 15% - - - - - Of which Managed services 16% 11% - - - -Multimedia 12% 19% - - - -Unallocated 1) - - - - - -Less: Intersegment sales - - - - - -Total 6% 7% - - - -1) Including the Defense business2) 2005 is not restated according to new organization
2007
2007
2007
2007
2007
2006 2)
2006
2006
2006 2)
2006
20
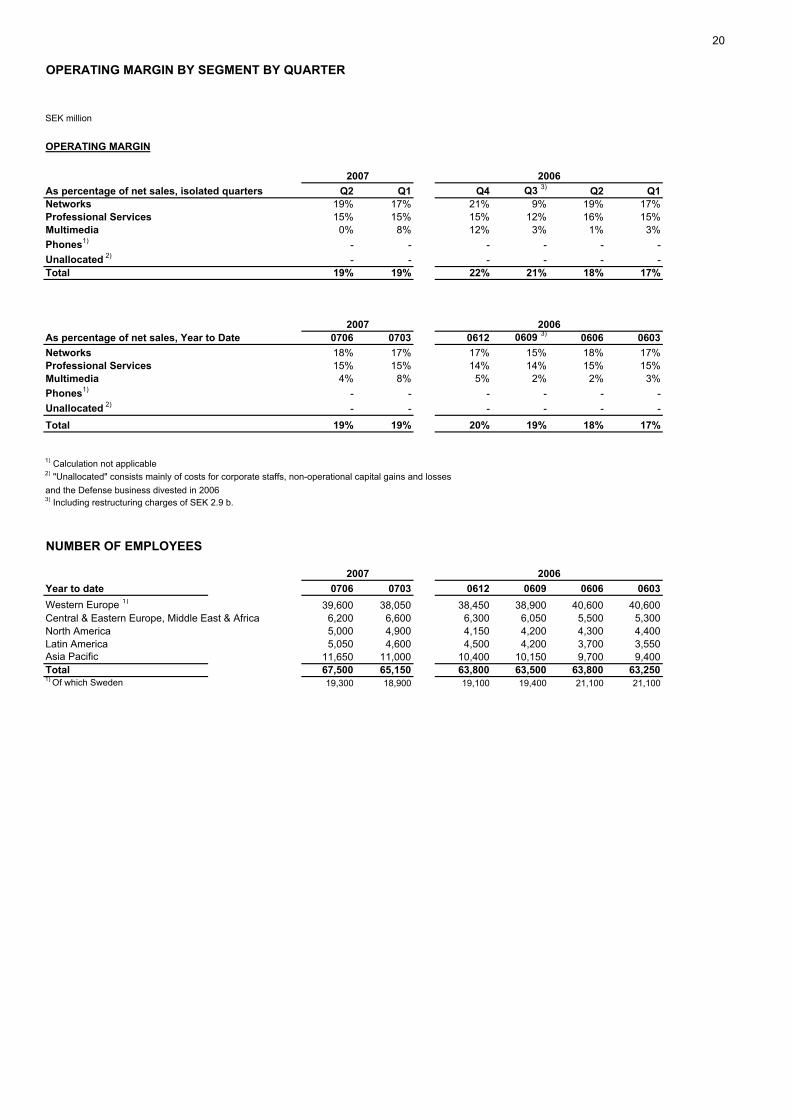
OPERATING MARGIN BY SEGMENT BY QUARTER
SEK million
OPERATING MARGIN
As percentage of net sales, isolated quarters Q2 Q1 Q4 Q3 3) Q2 Q1Networks 19% 17% 21% 9% 19% 17%Professional Services 15% 15% 15% 12% 16% 15%Multimedia 0% 8% 12% 3% 1% 3%Phones1) - - - - - -Unallocated 2) - - - - - -Total 19% 19% 22% 21% 18% 17%
As percentage of net sales, Year to Date 0706 0703 0612 0609 3) 0606 0603Networks 18% 17% 17% 15% 18% 17%Professional Services 15% 15% 14% 14% 15% 15%Multimedia 4% 8% 5% 2% 2% 3%Phones1) - - - - - -Unallocated 2) - - - - - -Total 19% 19% 20% 19% 18% 17%
1) Calculation not applicable2) "Unallocated" consists mainly of costs for corporate staffs, non-operational capital gains and losses and the Defense business divested in 20063) Including restructuring charges of SEK 2.9 b.
NUMBER OF EMPLOYEES
Year to date 0706 0703 0612 0609 0606 0603Western Europe 1) 39,600 38,050 38,450 38,900 40,600 40,600Central & Eastern Europe, Middle East & Africa 6,200 6,600 6,300 6,050 5,500 5,300North America 5,000 4,900 4,150 4,200 4,300 4,400Latin America 5,050 4,600 4,500 4,200 3,700 3,550Asia Pacific 11,650 11,000 10,400 10,150 9,700 9,400Total 67,500 65,150 63,800 63,500 63,800 63,2501) Of which Sweden 19,300 18,900 19,100 19,400 21,100 21,100
2007 2006
2006
2006
2007
2007
21
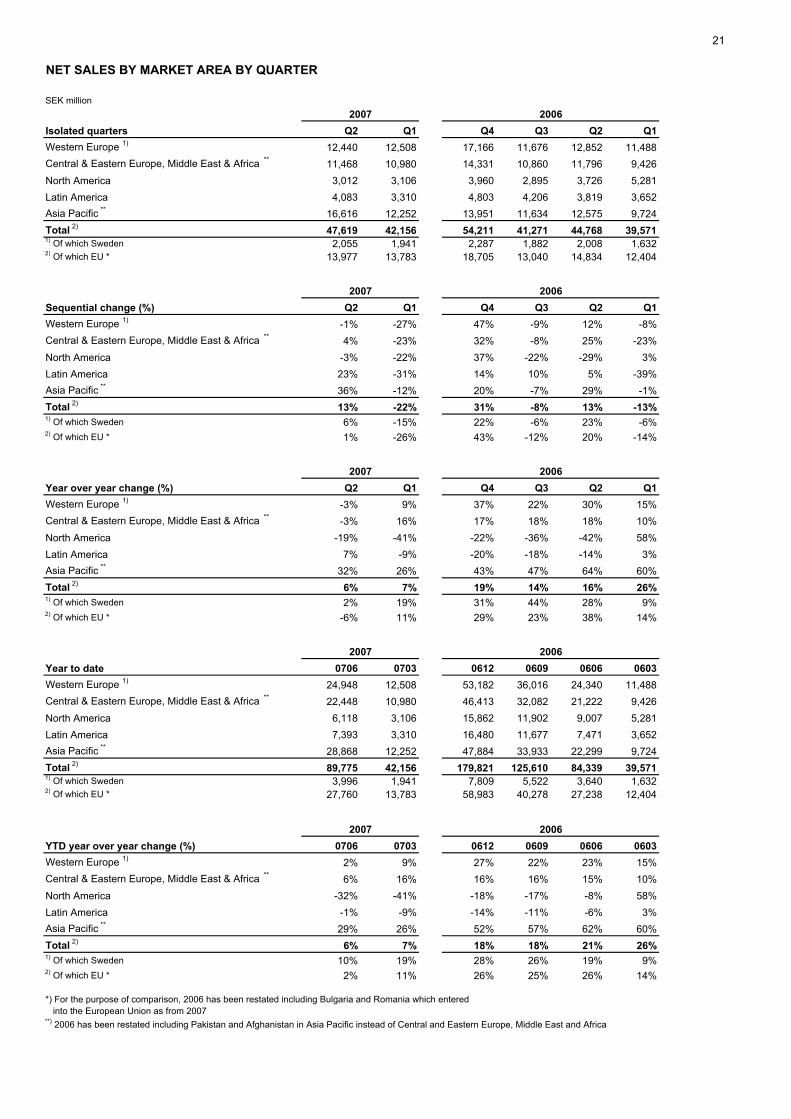
NET SALES BY MARKET AREA BY QUARTER
SEK million
Isolated quarters Q2 Q1 Q4 Q3 Q2 Q1Western Europe 1) 12,440 12,508 17,166 11,676 12,852 11,488Central & Eastern Europe, Middle East & Africa ** 11,468 10,980 14,331 10,860 11,796 9,426North America 3,012 3,106 3,960 2,895 3,726 5,281Latin America 4,083 3,310 4,803 4,206 3,819 3,652Asia Pacific ** 16,616 12,252 13,951 11,634 12,575 9,724Total 2) 47,619 42,156 54,211 41,271 44,768 39,5711) Of which Sweden 2,055 1,941 2,287 1,882 2,008 1,6322) Of which EU * 13,977 13,783 18,705 13,040 14,834 12,404
Sequential change (%) Q2 Q1 Q4 Q3 Q2 Q1Western Europe 1) -1% -27% 47% -9% 12% -8%Central & Eastern Europe, Middle East & Africa ** 4% -23% 32% -8% 25% -23%North America -3% -22% 37% -22% -29% 3%Latin America 23% -31% 14% 10% 5% -39%Asia Pacific ** 36% -12% 20% -7% 29% -1%Total 2) 13% -22% 31% -8% 13% -13%1) Of which Sweden 6% -15% 22% -6% 23% -6%2) Of which EU * 1% -26% 43% -12% 20% -14%
Year over year change (%) Q2 Q1 Q4 Q3 Q2 Q1Western Europe 1) -3% 9% 37% 22% 30% 15%Central & Eastern Europe, Middle East & Africa ** -3% 16% 17% 18% 18% 10%North America -19% -41% -22% -36% -42% 58%Latin America 7% -9% -20% -18% -14% 3%Asia Pacific ** 32% 26% 43% 47% 64% 60%Total 2) 6% 7% 19% 14% 16% 26%1) Of which Sweden 2% 19% 31% 44% 28% 9%2) Of which EU * -6% 11% 29% 23% 38% 14%
Year to date 0706 0703 0612 0609 0606 0603Western Europe 1) 24,948 12,508 53,182 36,016 24,340 11,488Central & Eastern Europe, Middle East & Africa ** 22,448 10,980 46,413 32,082 21,222 9,426North America 6,118 3,106 15,862 11,902 9,007 5,281Latin America 7,393 3,310 16,480 11,677 7,471 3,652Asia Pacific ** 28,868 12,252 47,884 33,933 22,299 9,724Total 2) 89,775 42,156 179,821 125,610 84,339 39,5711) Of which Sweden 3,996 1,941 7,809 5,522 3,640 1,6322) Of which EU * 27,760 13,783 58,983 40,278 27,238 12,404
YTD year over year change (%) 0706 0703 0612 0609 0606 0603Western Europe 1) 2% 9% 27% 22% 23% 15%Central & Eastern Europe, Middle East & Africa ** 6% 16% 16% 16% 15% 10%North America -32% -41% -18% -17% -8% 58%Latin America -1% -9% -14% -11% -6% 3%Asia Pacific ** 29% 26% 52% 57% 62% 60%Total 2) 6% 7% 18% 18% 21% 26%1) Of which Sweden 10% 19% 28% 26% 19% 9%2) Of which EU * 2% 11% 26% 25% 26% 14%
*) For the purpose of comparison, 2006 has been restated including Bulgaria and Romania which entered into the European Union as from 2007**) 2006 has been restated including Pakistan and Afghanistan in Asia Pacific instead of Central and Eastern Europe, Middle East and Africa
2007 2006
2007 2006
2007
2007
2007 2006
2006
2006
22
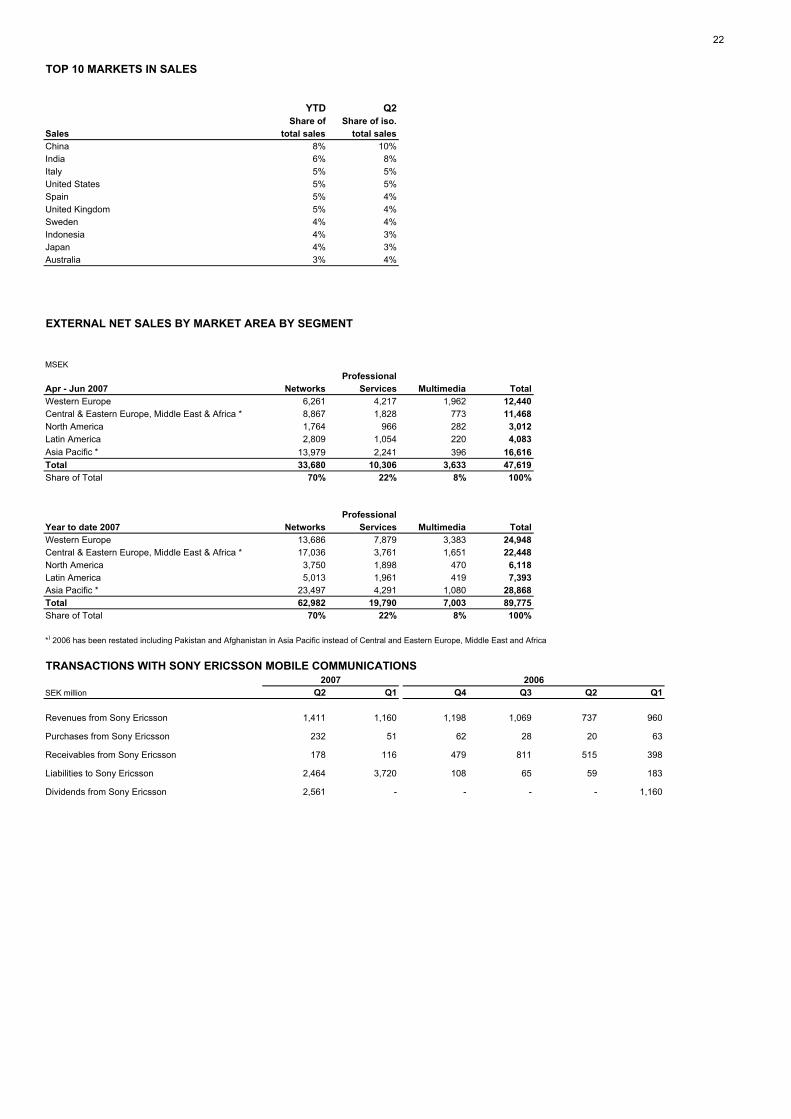
TOP 10 MARKETS IN SALES
YTD Q2Share of Share of iso.
Sales total sales total salesChina 8% 10%India 6% 8%Italy 5% 5%United States 5% 5%Spain 5% 4%United Kingdom 5% 4%Sweden 4% 4%Indonesia 4% 3%Japan 4% 3%Australia 3% 4%
EXTERNAL NET SALES BY MARKET AREA BY SEGMENT
MSEKProfessional
Apr - Jun 2007 Networks Services Multimedia TotalWestern Europe 6,261 4,217 1,962 12,440Central & Eastern Europe, Middle East & Africa * 8,867 1,828 773 11,468North America 1,764 966 282 3,012Latin America 2,809 1,054 220 4,083Asia Pacific * 13,979 2,241 396 16,616Total 33,680 10,306 3,633 47,619Share of Total 70% 22% 8% 100%
ProfessionalYear to date 2007 Networks Services Multimedia TotalWestern Europe 13,686 7,879 3,383 24,948Central & Eastern Europe, Middle East & Africa * 17,036 3,761 1,651 22,448North America 3,750 1,898 470 6,118Latin America 5,013 1,961 419 7,393Asia Pacific * 23,497 4,291 1,080 28,868Total 62,982 19,790 7,003 89,775Share of Total 70% 22% 8% 100%
*) 2006 has been restated including Pakistan and Afghanistan in Asia Pacific instead of Central and Eastern Europe, Middle East and Africa
TRANSACTIONS WITH SONY ERICSSON MOBILE COMMUNICATIONS
SEK million Q2 Q1 Q4 Q3 Q2 Q1
Revenues from Sony Ericsson 1,411 1,160 1,198 1,069 737 960
Purchases from Sony Ericsson 232 51 62 28 20 63
Receivables from Sony Ericsson 178 116 479 811 515 398
Liabilities to Sony Ericsson 2,464 3,720 108 65 59 183
Dividends from Sony Ericsson 2,561 - - - - 1,160
2007 2006

23
ERICSSONOTHER INFORMATION
Jan - Dec2007 2006 2007 2006 2006
Number of shares and earnings per shareNumber of shares, end of period (million) 16,132 16,132 16,132 16,132 16,132Of which A-shares (million) 1,309 1,309 1,309 1,309 1,309Of which B-shares (million) 14,823 14,823 14,823 14,823 14,823Number of treasury shares, end of period (million) 243 262 243 262 251Number of shares outstanding, basic, end of period (million) 15,890 15,870 15,890 15,870 15,881Numbers of shares outstanding, diluted, end of period (million) 15,966 15,941 15,966 15,941 15,953Average number of treasury shares (million) 243 263 246 265 262Average number of shares outstanding, basic (million) 15,890 15,869 15,886 15,867 15,871Average number of shares outstanding, diluted (million)1) 15,966 15,939 15,963 15,938 15,943Earnings per share, basic (SEK) 0.40 0.36 0.77 0.65 1.65Earnings per share, diluted (SEK)1) 0.40 0.36 0.77 0.65 1.65
RatiosEBITDA, percent 23.9% 22.3% 23.8% 22.0% 24.1%Equity ratio, percent - - 54.4% 53.9% 56.2%Capital turnover (times) 1.2 1.3 1.2 1.3 1.3Accounts receivable turnover (times) 3.5 3.9 3.4 3.9 3.9Inventory turnover (times) 4.5 4.4 4.4 4.5 5.2Return on equity, percent 20.3% 21.3% 19.9% 19.8% 23.7%Return on capital employed, percent 24.8% 26.2% 24.2% 24.4% 27.4%Days Sales Outstanding - - 106 95 85Payment readiness, end of period - - 50,076 54,205 67,454Payment readiness, as percentage of sales - - 27.9% 32.5% 37.5%
Exchange rates used in the consolidationSEK / EUR - average rate - - 9.20 9.33 9.27 - closing rate - - 9.25 9.24 9.04SEK / USD - average rate - - 6.91 7.60 7.38 - closing rate - - 6.85 7.27 6.85
SEK millionOther Additions to property, plant and equipment 1,024 1,372 1,792 2,071 3,827- Of which in Sweden 403 229 637 499 999
Additions to capitalized development expenses 251 412 457 770 1,353Capitalization of development expenses, net -334 -238 -670 -556 -1,166
Amortization of development expenses 585 650 1,127 1,326 2,519Depreciation of property, plant and equipment and amortization of other intangible assets 1,555 1,066 2,876 2,387 4,997Total depreciation and amortization 2,140 1,716 4,003 3,713 7,516
Export sales from Sweden 26,647 22,574 49,131 46,872 98,694
1) Potential ordinary shares are not considered when their conversion to ordinary shares would increase earnings per share
ERICSSON PLANNING ASSUMPTIONS FOR YEAR 2007
Research & Development expensesWe estimate the R&D expense to be around SEK 28.5 b. for the full year 2007. The estimate includes depreciations andamortizations for intangible assets related to major acquisitions (Redback, Entrisphere and Tandberg). However, currency effects may cause this to change.
Tax rateWe estimate the tax rate for the full year 2007 to be around 30%.
Capital ExpendituresExcluding acquisitions, the capital expenditures in relation to sales are not expected to be significantly different in 2007,remaining at roughly two percent of sales. Reference to Annual Report 2006, page 32.
Utilization of ProvisionsThe expected utilization of provisions for year 2007 is SEK 8.3 b. Reference to Annual Report 2006, page 74.
Apr -Jun Jan -Jun
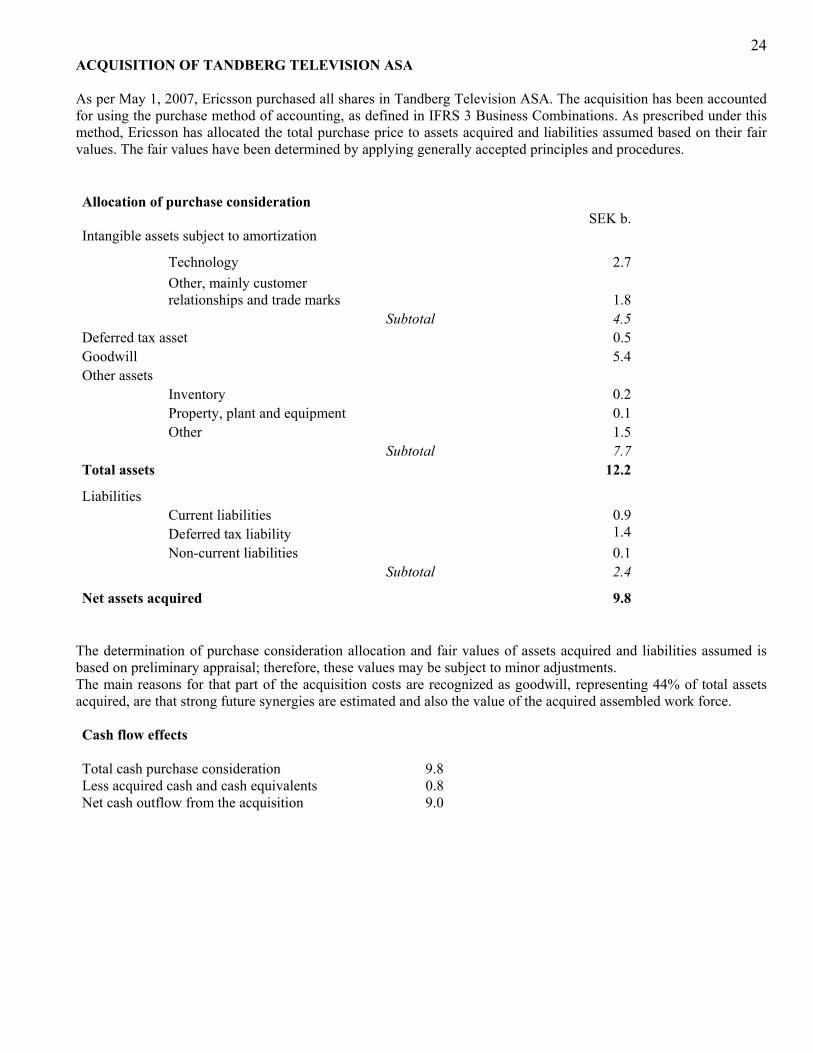
24ACQUISITION OF TANDBERG TELEVISION ASA As per May 1, 2007, Ericsson purchased all shares in Tandberg Television ASA. The acquisition has been accounted for using the purchase method of accounting, as defined in IFRS 3 Business Combinations. As prescribed under this method, Ericsson has allocated the total purchase price to assets acquired and liabilities assumed based on their fair values. The fair values have been determined by applying generally accepted principles and procedures. Allocation of purchase consideration SEK b. Intangible assets subject to amortization
Technology 2.7
Other, mainly customer relationships and trade marks 1.8
Subtotal 4.5 Deferred tax asset 0.5 Goodwill 5.4 Other assets Inventory 0.2 Property, plant and equipment 0.1 Other 1.5 Subtotal 7.7 Total assets 12.2
Liabilities Current liabilities 0.9 Deferred tax liability 1.4 Non-current liabilities 0.1 Subtotal 2.4
Net assets acquired 9.8
The determination of purchase consideration allocation and fair values of assets acquired and liabilities assumed is based on preliminary appraisal; therefore, these values may be subject to minor adjustments. The main reasons for that part of the acquisition costs are recognized as goodwill, representing 44% of total assets acquired, are that strong future synergies are estimated and also the value of the acquired assembled work force. Cash flow effects Total cash purchase consideration 9.8Less acquired cash and cash equivalents 0.8Net cash outflow from the acquisition 9.0