erisa revenue sharing arrangements: avoiding plan asset status, complying with due diligence...
TRANSCRIPT

ERISA Revenue Sharing Arrangements: Avoiding Plan Asset Status, Complying With Due Diligence RequirementsBest Practices for Utilization of Excess Payments, Contract Negotiations, Allocation of Credits to Plan Participants and More
Today’s faculty features:
1pm Eastern | 12pm Central | 11am Mountain | 10am Pacific
The audio portion of the conference may be accessed via the telephone or by using your computer's speakers. Please refer to the instructions emailed to registrants for additional information. If you have any questions, please contact Customer Service at 1-800-926-7926 ext. 10.
WEDNESDAY, MARCH 11, 2015
Presenting a live 90-minute webinar with interactive Q&A
Elizabeth Dyer, Attorney, Mayer Brown, Chicago
Lawrence N. (Larry) Vignola, Managing Principal, Stable Two Financial, Cincinnati
Marcia S. Wagner, Managing Director, Wagner Law Group, Boston

Tips for Optimal Quality
Sound QualityIf you are listening via your computer speakers, please note that the quality of your sound will vary depending on the speed and quality of your internet connection.
If the sound quality is not satisfactory, you may listen via the phone: dial 1-866-258-2056 and enter your PIN when prompted. Otherwise, please send us a chat or e-mail [email protected] immediately so we can address the problem.
If you dialed in and have any difficulties during the call, press *0 for assistance.
Viewing QualityTo maximize your screen, press the F11 key on your keyboard. To exit full screen, press the F11 key again.
FOR LIVE EVENT ONLY

Continuing Education Credits
For CLE purposes, please let us know how many people are listening at your location by completing each of the following steps:
• In the chat box, type (1) your company name and (2) the number of attendees at your location
• Click the SEND button beside the box
If you have purchased Strafford CLE processing services, you must confirm your participation by completing and submitting an Official Record of Attendance (CLE Form).
You may obtain your CLE form by going to the program page and selecting the appropriate form in the PROGRAM MATERIALS box at the top right corner.
If you'd like to purchase CLE credit processing, it is available for a fee. For additional information about CLE credit processing, go to our website or call us at 1-800-926-7926 ext. 35.
FOR LIVE EVENT ONLY

Program Materials
If you have not printed the conference materials for this program, please complete the following steps:
• Click on the ^ symbol next to “Conference Materials” in the middle of the left-hand column on your screen.
• Click on the tab labeled “Handouts” that appears, and there you will see a PDF of the slides for today's program.
• Double click on the PDF and a separate page will open.
• Print the slides by clicking on the printer icon.
FOR LIVE EVENT ONLY

Revenue Sharing Arrangements and Plan Asset Status
• Brief Overview of Revenue Sharing Arrangements
• When are Revenue Sharing Payments “Plan Assets”?
• Considerations for Revenue Sharing Payments that Constitute “Plan Assets”
Liz DyerMayer Brown LLP
5
Revenue Sharing and Plan Asset StatusBrief Overview of Revenue Sharing Arrangements
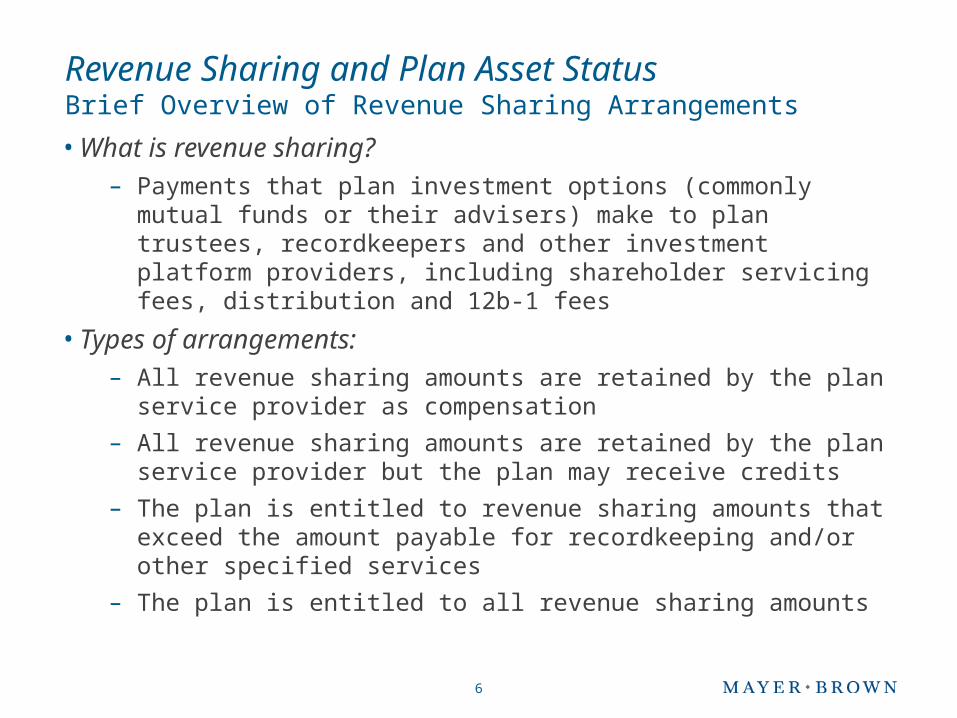
• What is revenue sharing?– Payments that plan investment options (commonly mutual
funds or their advisers) make to plan trustees, recordkeepers and other investment platform providers, including shareholder servicing fees, distribution and 12b-1 fees
• Types of arrangements:– All revenue sharing amounts are retained by the plan service
provider as compensation
– All revenue sharing amounts are retained by the plan service provider but the plan may receive credits
– The plan is entitled to revenue sharing amounts that exceed the amount payable for recordkeeping and/or other specified services
– The plan is entitled to all revenue sharing amounts
6

Revenue Sharing and Plan Asset StatusWhen are Revenue Sharing Payments “Plan Assets”?
• In 2013, the DOL released guidance in the form of Advisory Opinion 2013-03A exploring the question of whether revenue sharing payments constitute “plan assets” under ERISA
– Background • Principal Life Insurance Company provides recordkeeping and
related administrative services to defined contribution plans and also makes available to such plans investment options including its own separate accounts and affiliated and unaffiliated mutual funds.
• Principal receives revenue sharing payments from these investments and will either:
(i) agree to maintain a bookkeeping record /account of the payments received in connection with a plan’s investment, or
(ii) agree to deposit the amounts directly into a plan account periodically or on a specified date.
7

Revenue Sharing and Plan Asset StatusWhen are Revenue Sharing Payments “Plan Assets”?
– Background cont’d.• If Principal maintains a bookkeeping record/account:
– The record will reflect credits calculated by reference to the estimated revenue sharing payments.
– In accordance with the agreement between Principal and the plan client and at the direction of the plan’s fiduciaries, the credits may be used to pay certain plan expenses (including payments for services of accountants, consultants, actuaries and attorneys).
– The credits are held as general assets of Principal and Principal does not establish a separate bank or custodial account to hold the credits.
– The agreements between Principal and its plan clients do not require Principal to segregate the credits for the benefit of any of the plans and Principal makes no representations that the credits will be set aside for the benefit of its plan clients.
8

Revenue Sharing and Plan Asset StatusWhen Are Revenue Sharing Payments “Plan Assets”?
– DOL analysis
• “Plan assets” are determined by applying ordinary notions of property rights to the specific arrangement-- the assets of a plan will include any property (tangible or intangible) in which the plan has a beneficial interest.
• Must consider the contract or other legal instrument involving the plan and the actions/representations of the parties involved.
• The mere segregation of a service provider’s funds to facilitate the administration of a contract with a plan would not in itself create a beneficial interest in those assets on behalf of the plan.
• Applying these principals to the facts at hand, the DOL concluded that revenue sharing payments recorded in bookkeeping accounts are not “plan assets” before the plans actually receive these payments.
• The DOL emphasized that a plan’s assets can include any type of property, tangible or intangible, and that a plan’s contractual right to receive revenue sharing payments (as agreed to with Principal) or to have these payments applied towards plan expenses would constitute an asset of the plan.
9

Revenue Sharing and Plan Asset StatusWhen Are Revenue Sharing Payments “Plan Assets”?
– DOL analysis cont’d.
• Because a plan’s contractual right to receive the revenue sharing payments constitutes a “plan asset,” a plan’s claim against Principal for failure to pay these amounts as required would also constitute an asset of the plan.
• Whether or not the revenue sharing payments constitute “plan assets,” the arrangements between Principal and plan clients are subject to the fiduciary and prohibited transaction provisions of ERISA.
10

Revenue Sharing and Plan Asset StatusConsiderations for Revenue Sharing Payments that Constitute “Plan Assets”• If the revenue sharing payment is a “plan asset,” the
following additional considerations may apply:– How can revenue sharing payments received by the plan be
used?• Credited to an unallocated plan account and used to pay expenses
permissible under ERISA (e.g., recordkeeping, accounting, actuarial, legal, custodial, investment management) with the balance allocated to participant accounts
• Credited directly to participant’s accounts
– Allocation questions• Fiduciary considerations – prudence, acting “solely in the interest of
participants” and acting in accordance with the plan documents
– Field Assistance Bulletin 2003-3 (relating to the allocation of plan expenses) – when the method of allocation is not set forth in the plan documents, at a minimum, prudence would require weighing the competing interests of various classes of participants and the effects of allocation methods on such interests
• Pro rata or per capita
• Consider taking into account whether a participant is invested in the fund that generated the credit 11
Revenue Sharing and Plan Asset StatusConsiderations for Revenue Sharing Payments that Constitute “Plan Assets”
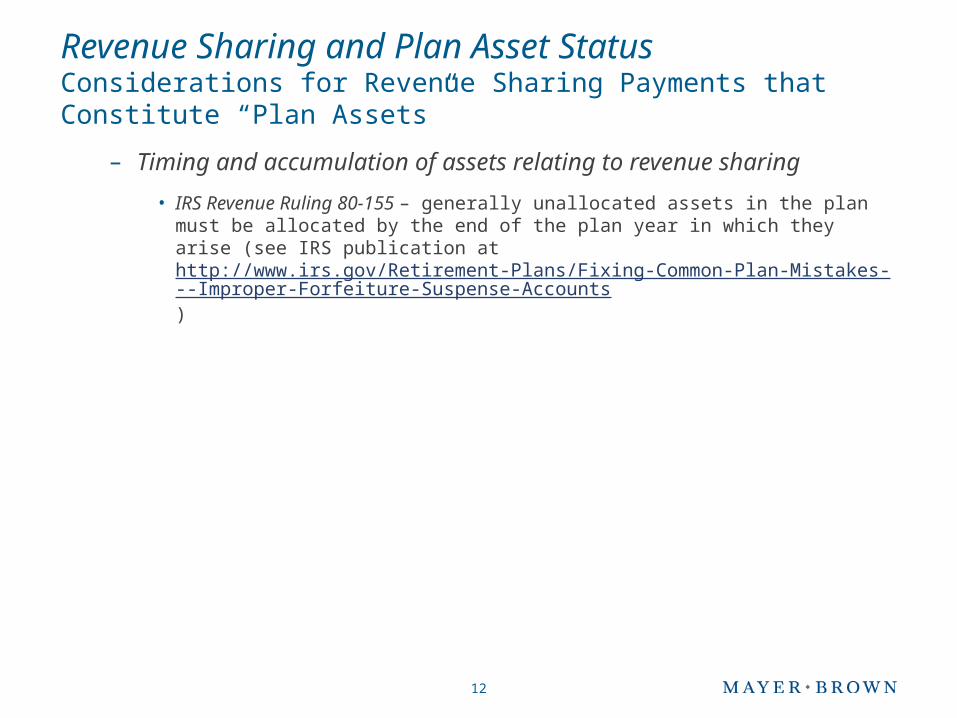
– Timing and accumulation of assets relating to revenue sharing
• IRS Revenue Ruling 80-155 – generally unallocated assets in the plan must be allocated by the end of the plan year in which they arise (see IRS publication at http://www.irs.gov/Retirement-Plans/Fixing-Common-Plan-Mistakes---Improper-Forfeiture-Suspense-Accounts)
12

ERISA Revenue-Sharing Arrangements: Due Diligence Process
and Alternative Pricing Models
Marcia S. [email protected]

14
Fiduciary Due Diligence Requirements
ERISA does not prohibit revenue sharing arrangements• But revenue sharing may pose potential challenge for plan fiduciaries • ERISA imposes fiduciary duty to evaluate reasonableness of provider’s
compensation • Fiduciaries must consider total compensation paid to plan’s recordkeeper,
including revenue sharing
Common Revenue Sharing Arrangements with Plan Recordkeepers• Traditional Pricing• Revenue Sharing Offset• Bookkeeping Spending Accounts (Fee Recapture)• ERISA Budget Accounts (Fee Recapture)• Participant-Level Revenue Equalization (Fee Recapture)

15
Traditional Pricing
Traditional pricing is historical model still used by certain recordkeepers• Recordkeeper keeps both direct fees and revenue sharing• 408(b)(2) fee notice must include upfront disclosures on fees and revenue
Plan sponsor has duty to evaluate recordkeeper’s total compensation• If there is no fee recapture, revenue sharing must be identified and quantified• Fiduciary due diligence must be performed on ongoing basis

16
Revenue Sharing Offset
This alternative pricing solution was developed to increase fee transparency• Also known as “net pricing”• Recordkeeper’s gross fee is offset by revenue sharing received• Plan client only pays net fee
Net fee pricing simplifies plan sponsor’s fiduciary duty• Recordkeeper has no economic benefit from revenue sharing• Plan sponsor can focus on reasonableness of recordkeeper’s gross fee• Plan sponsor should confirm offset is being calculated correctly

17
The Case for Fee Recapture Accounts
Hypothetical Illustration – Recordkeeper offers revenue sharing offset• 401(k) plan with $2.5 million in total assets
Gross Fee $7,500Revenue Sharing (0.30% of $2.5 million) $7,500Net Direct Fee Paid to Recordkeeper $ 0
Total Compensation $7,500
• 401(k) plan’s total assets grow to $3.0 millionGross Fee $7,500Revenue Sharing (0.30% of $3.0 million) $9,000Net Direct Fee Paid to Recordkeeper $ 0
Gross Fee $7,500Revenue Sharing Retained by Recordkeeper $1,500Total Compensation $9,000

18
Bookkeeping Spending Accounts
There are 2 types of fee recapture accounts• Bookkeeping spending accounts• ERISA budget accounts
Bookkeeping spending accounts are on books of recordkeeper• Also known as “Plan Expense Reimbursement Arrangement” or PERA• 401(k) plan’s total assets grow to $3.0 million
Gross Fee $7,500Revenue Sharing (0.30% of $3.0 million) $9,000Net Direct Fee Paid to Recordkeeper $ 0Amount Credited to BK Spending Account $1,500
Total Compensation $7,500
• Credited amounts are merely unsecured promise from recordkeeper• Recordkeeper may allow credits to be allocated to participant accounts
19
ERISA Budget Accounts
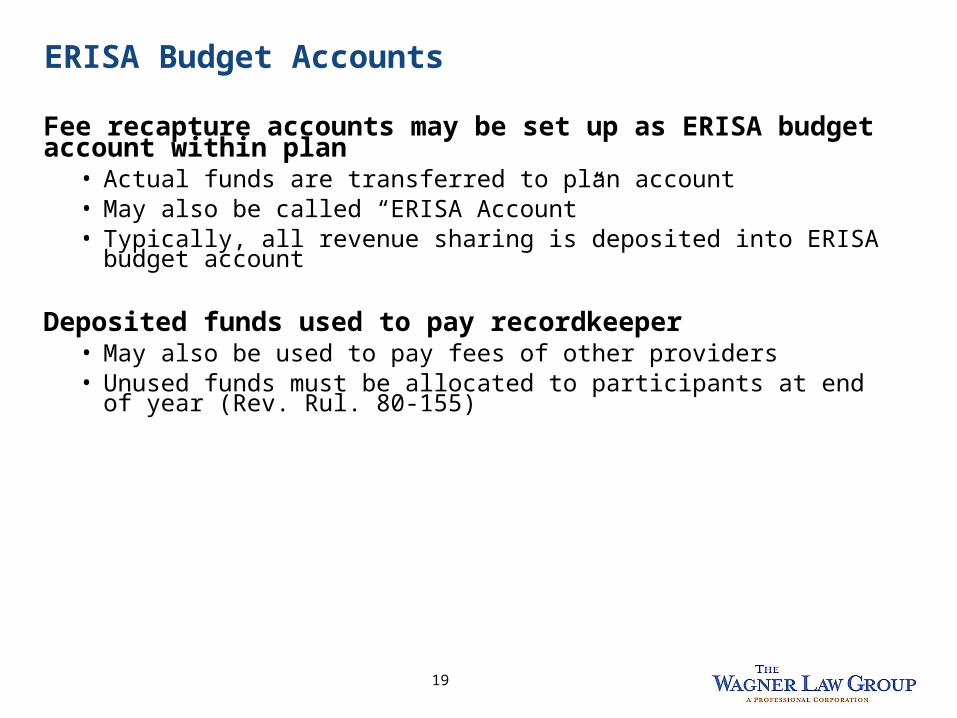
Fee recapture accounts may be set up as ERISA budget account within plan• Actual funds are transferred to plan account• May also be called “ERISA Account”• Typically, all revenue sharing is deposited into ERISA budget account
Deposited funds used to pay recordkeeper• May also be used to pay fees of other providers• Unused funds must be allocated to participants at end of year (Rev. Rul. 80-155)
20
Participant-Level Revenue Equalization
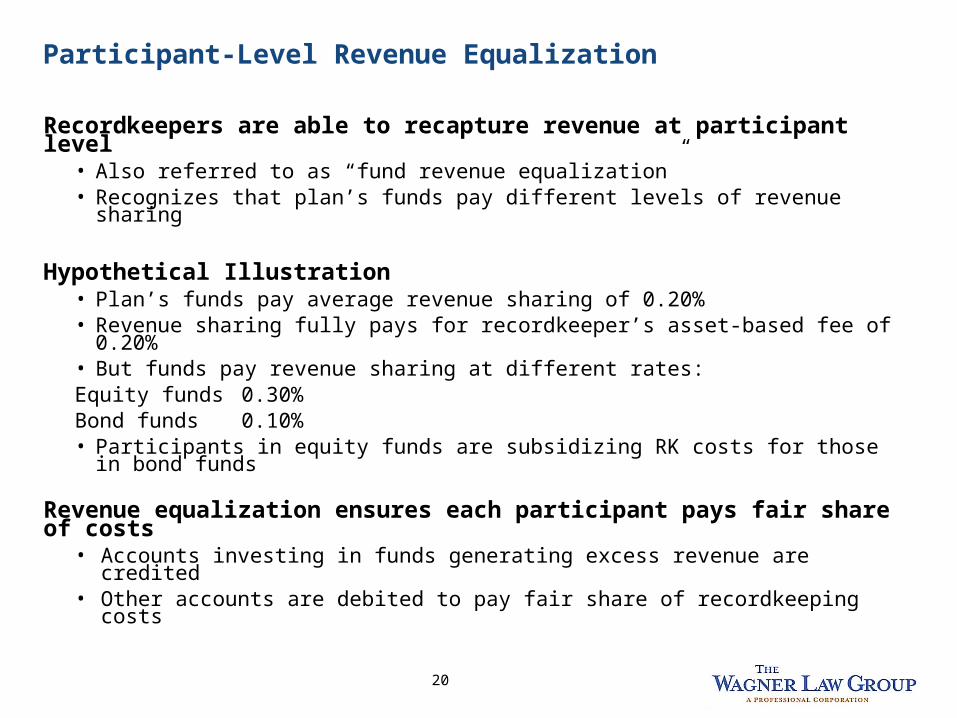
Recordkeepers are able to recapture revenue at participant level• Also referred to as “fund revenue equalization”• Recognizes that plan’s funds pay different levels of revenue sharing
Hypothetical Illustration• Plan’s funds pay average revenue sharing of 0.20%• Revenue sharing fully pays for recordkeeper’s asset-based fee of 0.20%• But funds pay revenue sharing at different rates:
Equity funds 0.30%Bond funds 0.10%
• Participants in equity funds are subsidizing RK costs for those in bond funds
Revenue equalization ensures each participant pays fair share of costs• Accounts investing in funds generating excess revenue are credited• Other accounts are debited to pay fair share of recordkeeping costs

21
408(b)(2) “Reasonable Contract” Considerations
Recordkeeper service agreement should be clear• Contract should specify recordkeeper’s type of revenue sharing arrangement
Contract should comply with requirements of ERISA Section 408(b)(2)• “Reasonable contract or arrangement” requires 408(b)(2) fee disclosures • Plan sponsors have duty to understand how revenue sharing will be handled• Contract must allow for termination on short notice without penalty

22
Best Practices
If possible, work with recordkeepers that provide for fee recapture• Bookkeeping spending account• ERISA budget account• Participant-level revenue equalization
Plan asset status may be avoided through bookkeeping spending account

23
Revenue Sharing Contractual Terms
Bookkeeping spending accounts are not deemed to hold plan assets• Recaptured revenue is not subject to trust and custody rules• No need to allocate unused amounts to participants at end of year
Contractual terms are key consideration for bookkeeping spending accounts• Focus on provisions governing unused credits when recordkeeping services end• Also focus on provisions permitting (or not permitting) allocations to participants

24
Plan Documentation Considerations
Plan documentation is key consideration for ERISA budget accounts• Deposited funds are plan assets• Plan document must state how funds will be allocated to participants at year-end• Documentation should properly address how funds will be invested
ERISA budget accounts are similar to forfeiture accounts• Both account types may be used to pay plan expenses and for allocations• But ERISA budget account should not be used to offset employer contributions
ERISA counsel should be consulted to make necessary plan amendments

25
Revenue Sharing and Recapture Calculations
Plan fiduciaries should estimate revenue sharing amounts on quarterly basis• Estimates can help confirm offset or fee recapture is being applied correctly • If necessary, request reconciliation from recordkeeper
Recordkeeper may perform own reconciliations to adjust its direct fee• Reconciliation by recordkeeper often performed on annual basis• Generally not required for ERISA budget accounts or revenue equalization
26
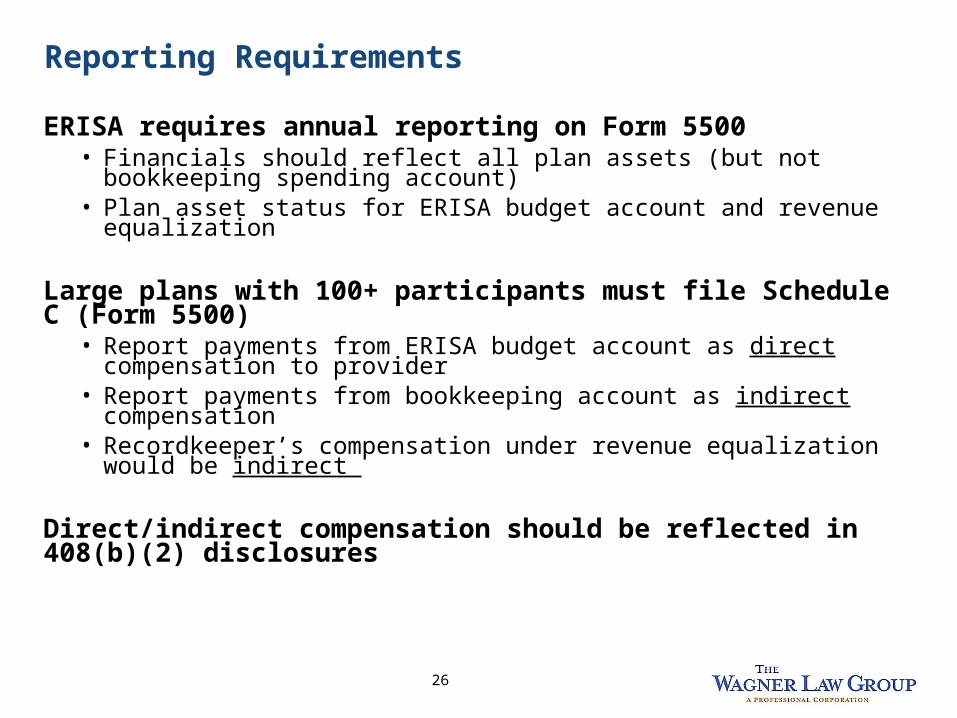
Reporting Requirements
ERISA requires annual reporting on Form 5500• Financials should reflect all plan assets (but not bookkeeping spending account)• Plan asset status for ERISA budget account and revenue equalization
Large plans with 100+ participants must file Schedule C (Form 5500)• Report payments from ERISA budget account as direct compensation to provider• Report payments from bookkeeping account as indirect compensation• Recordkeeper’s compensation under revenue equalization would be indirect
Direct/indirect compensation should be reflected in 408(b)(2) disclosures

27
Utilization of Excess Revenue Sharing
ERISA restrictions impose limit on plan’s ability to pay expenses• Restrictions apply to both ERISA budget and bookkeeping spending accounts• ERISA budget account deemed to hold plan assets subject to ERISA • Plan’s contractual right under bookkeeping spending account are also plan asset
Use of recaptured revenue limited to “reasonable and necessary” expenses• “Necessary” expenses do not include settlor expenses (e.g., plan design changes)• Confirm provider’s total compensation is “reasonable” before using funds
28
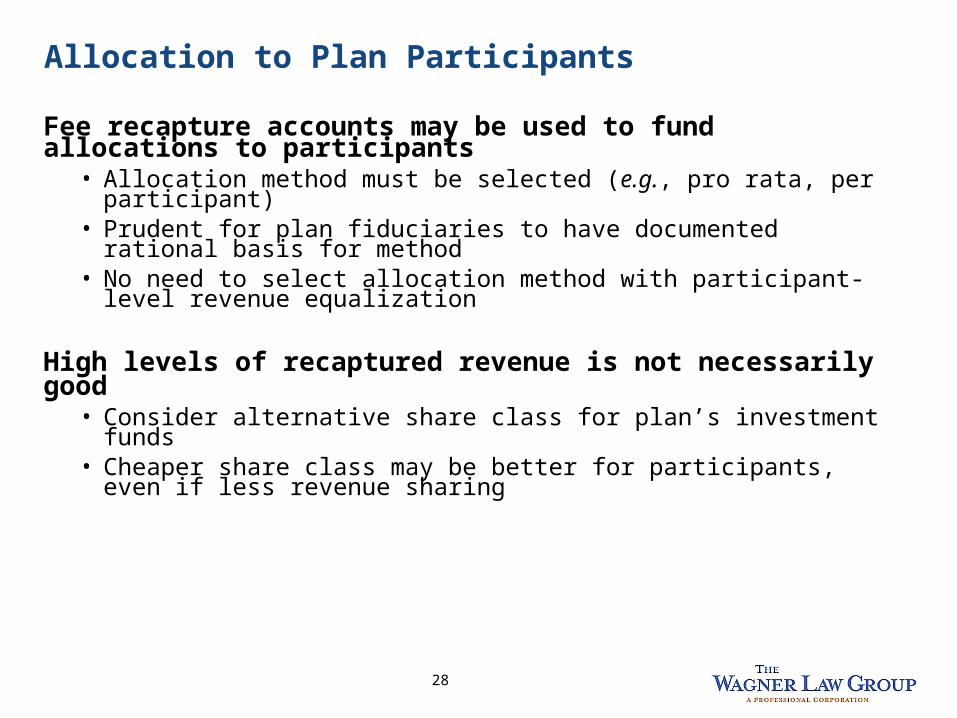
Allocation to Plan Participants
Fee recapture accounts may be used to fund allocations to participants• Allocation method must be selected (e.g., pro rata, per participant)• Prudent for plan fiduciaries to have documented rational basis for method• No need to select allocation method with participant-level revenue equalization
High levels of recaptured revenue is not necessarily good• Consider alternative share class for plan’s investment funds• Cheaper share class may be better for participants, even if less revenue sharing

ERISA Revenue-Sharing Arrangements: Due
Diligence Process and Alternative Pricing Models
March 11, 2015
Strafford Publications
Lawrence N. [email protected]

ContentsApproaches to benchmarking defined contribution plan fees
Factors impacting plan cost
Methods of analyzing plan fees
Example of a possible fee benchmarking process
Understanding the various pricing models available, including revenue “equalization”
2

The Importance of Fee and Service Benchmarking
Monitoring provider and plan fees is a fiduciary function under ERISA
Having a consistent process for reviewing plan expenses can help demonstrate compliance with a sponsor’s fiduciary duties – documentation is critical
Scrutiny over plan costs has increased dramatically due to the growing importance of employer sponsored retirement plans, recent fee litigation and the overall growth in retirement plan assets
Even a nominal increase in fees can have a material impact on long term retirement account balances
Asset-based pricing models can get out of balance without periodic benchmarking and provider negotiations
Available pricing models continue to evolve
408(b)(2) and 404(a)(5) have elevated attention on plan fees
3

Approaches to Conducting Fee BenchmarkingFormal RFP
Completed periodically, typically every 3-7 years Advantage: Provides a detailed and current understanding of
market conditions (price and service) Disadvantage: Can be time consuming and costly
Review data from a third party vendors (e.g. Fiduciary Benchmarks, 401kAverages Book, annual Deloitte survey, etc.)
Advantage: quick and inexpensive Disadvantage: A historic view vs. current market
“Informal” Benchmarking Project Can be conducted as frequently as every 2-3 years Uses data gathered from a variety of sources without the time
and expense involved in formal due diligence Sample should be valid to avoid bias (e.g. in number and type of
provider)
Regardless of method used, results need to be well documented
4

Critical Data in Analyzing Plan Fees
Plan fees need to be evaluated on multiple levels to determine reasonableness: Total Plan Cost Provider revenue as a percent of plan assets Provider revenue per participant expressed as a dollar amount Hard dollar fees including plan administration and transaction
based fees Investment management fees including managed account and
brokerage services Consulting services fees (particularly if paid through plan assets) The revenue required by the service provider(s) The impact of proprietary fund usage or requirements The determination of any surplus revenue If surplus revenue exists, how will the surplus be remedied (e.g.
implement lower cost investments, pass back to participants, use to offset other eligible plan expenses)
Reasonableness of fees needs to be understood relative to the services being received (e.g. lowest price is not the required outcome) Consideration must be given to the different types of pricing models available in the marketplace
5
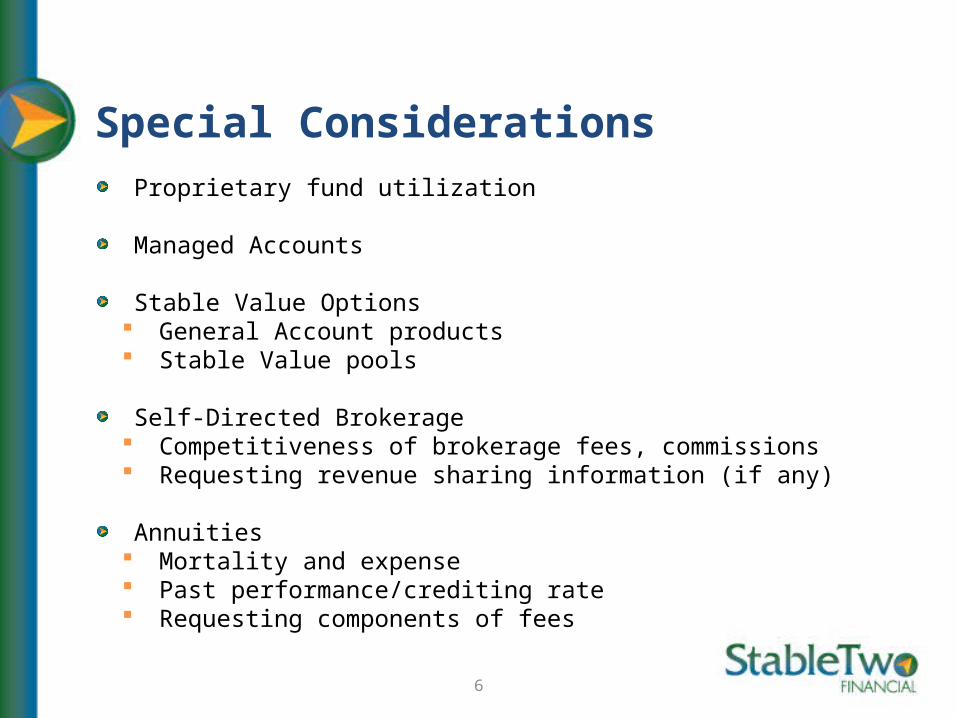
Special Considerations Proprietary fund utilization
Managed Accounts
Stable Value Options General Account products Stable Value pools
Self-Directed Brokerage Competitiveness of brokerage fees, commissions Requesting revenue sharing information (if any)
Annuities Mortality and expense Past performance/crediting rate Requesting components of fees
6
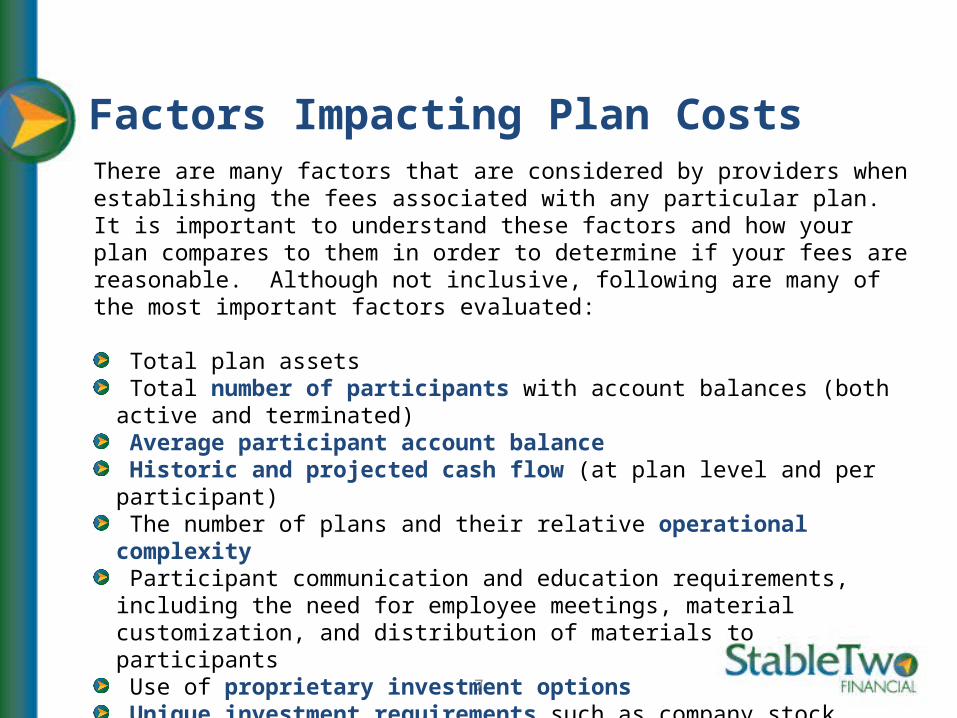
Factors Impacting Plan CostsThere are many factors that are considered by providers when establishing the fees associated with any particular plan. It is important to understand these factors and how your plan compares to them in order to determine if your fees are reasonable. Although not inclusive, following are many of the most important factors evaluated:
Total plan assets Total number of participants with account balances (both active and terminated) Average participant account balance Historic and projected cash flow (at plan level and per participant) The number of plans and their relative operational complexity Participant communication and education requirements, including the need for employee meetings, material customization, and distribution of materials to participants Use of proprietary investment options Unique investment requirements such as company stock, self-directed brokerage accounts, customized target-date funds or model portfolios Other services which may fall outside the normal service platform
7

Plan Expense Benchmarking – Total Plan Cost
8
Total Plan Cost in this context represents the asset weighted expense ratio of the plan, including consulting expense and excludes transaction based fees and plan related costs such as, audit, ERISA counsel and employer matching contributions Total Plan Cost is influenced by multiple factors including investment management expense, provider revenue requirement, and participant asset allocation Benchmark data is from Fiduciary Benchmarks, Inc. and represents a sample of 36 similarly sized plans
* Advisor is ABC Financial LLC, not XYZ; ABC’s fees are billed directly to you and are not paid by, or through, XYZ
XYZ - Existing Fiduciary Benchmarks -
Avg
Fiduciary Benchmarks -
Low
Fiduciary Benchmarks -
High
0.00%
0.20%
0.40%
0.60%
0.80%
1.00%
1.20%
1.40%
Total Plan CostRecordkeepingInvestment MgmtAdvisor*
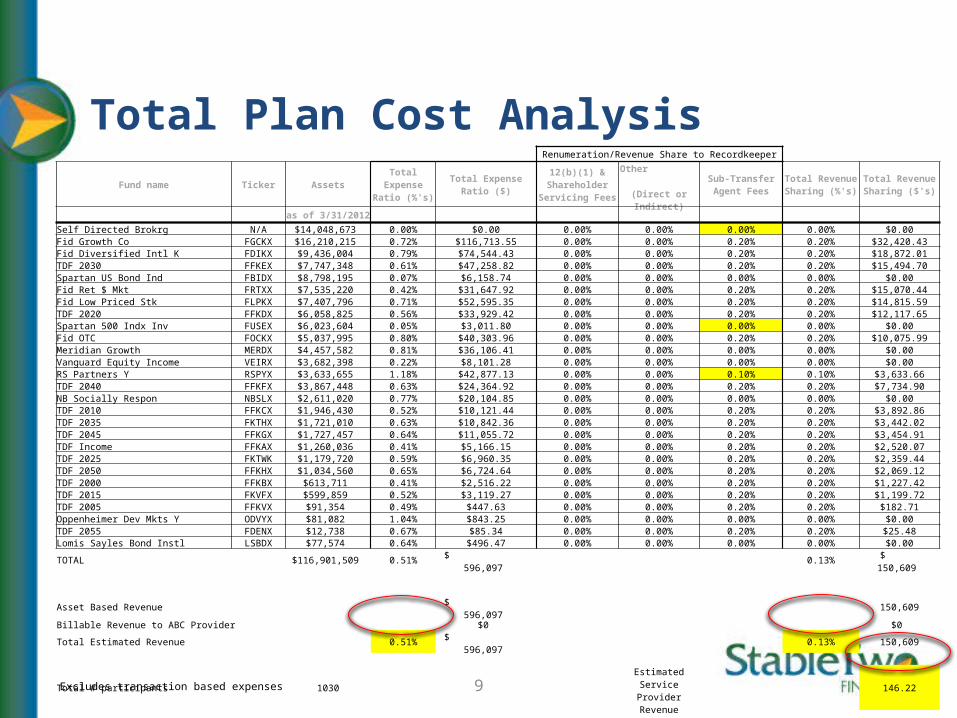
Total Plan Cost Analysis
9Excludes transaction based expenses
Renumeration/Revenue Share to Recordkeeper
Fund name Ticker Assets Total Expense Ratio (%'s) Total Expense Ratio ($)
12(b)(1) & Shareholder
Servicing FeesOther
(Direct or Indirect)Sub-Transfer Agent
FeesTotal Revenue Sharing (%'s)
Total Revenue Sharing ($'s)
as of 3/31/2012 Self Directed Brokrg N/A $14,048,673 0.00% $0.00 0.00% 0.00% 0.00% 0.00% $0.00Fid Growth Co FGCKX $16,210,215 0.72% $116,713.55 0.00% 0.00% 0.20% 0.20% $32,420.43Fid Diversified Intl K FDIKX $9,436,004 0.79% $74,544.43 0.00% 0.00% 0.20% 0.20% $18,872.01TDF 2030 FFKEX $7,747,348 0.61% $47,258.82 0.00% 0.00% 0.20% 0.20% $15,494.70Spartan US Bond Ind FBIDX $8,798,195 0.07% $6,158.74 0.00% 0.00% 0.00% 0.00% $0.00Fid Ret $ Mkt FRTXX $7,535,220 0.42% $31,647.92 0.00% 0.00% 0.20% 0.20% $15,070.44Fid Low Priced Stk FLPKX $7,407,796 0.71% $52,595.35 0.00% 0.00% 0.20% 0.20% $14,815.59TDF 2020 FFKDX $6,058,825 0.56% $33,929.42 0.00% 0.00% 0.20% 0.20% $12,117.65Spartan 500 Indx Inv FUSEX $6,023,604 0.05% $3,011.80 0.00% 0.00% 0.00% 0.00% $0.00Fid OTC FOCKX $5,037,995 0.80% $40,303.96 0.00% 0.00% 0.20% 0.20% $10,075.99Meridian Growth MERDX $4,457,582 0.81% $36,106.41 0.00% 0.00% 0.00% 0.00% $0.00Vanguard Equity Income VEIRX $3,682,398 0.22% $8,101.28 0.00% 0.00% 0.00% 0.00% $0.00RS Partners Y RSPYX $3,633,655 1.18% $42,877.13 0.00% 0.00% 0.10% 0.10% $3,633.66TDF 2040 FFKFX $3,867,448 0.63% $24,364.92 0.00% 0.00% 0.20% 0.20% $7,734.90NB Socially Respon NBSLX $2,611,020 0.77% $20,104.85 0.00% 0.00% 0.00% 0.00% $0.00TDF 2010 FFKCX $1,946,430 0.52% $10,121.44 0.00% 0.00% 0.20% 0.20% $3,892.86TDF 2035 FKTHX $1,721,010 0.63% $10,842.36 0.00% 0.00% 0.20% 0.20% $3,442.02TDF 2045 FFKGX $1,727,457 0.64% $11,055.72 0.00% 0.00% 0.20% 0.20% $3,454.91TDF Income FFKAX $1,260,036 0.41% $5,166.15 0.00% 0.00% 0.20% 0.20% $2,520.07TDF 2025 FKTWK $1,179,720 0.59% $6,960.35 0.00% 0.00% 0.20% 0.20% $2,359.44TDF 2050 FFKHX $1,034,560 0.65% $6,724.64 0.00% 0.00% 0.20% 0.20% $2,069.12TDF 2000 FFKBX $613,711 0.41% $2,516.22 0.00% 0.00% 0.20% 0.20% $1,227.42TDF 2015 FKVFX $599,859 0.52% $3,119.27 0.00% 0.00% 0.20% 0.20% $1,199.72TDF 2005 FFKVX $91,354 0.49% $447.63 0.00% 0.00% 0.20% 0.20% $182.71Oppenheimer Dev Mkts Y ODVYX $81,082 1.04% $843.25 0.00% 0.00% 0.00% 0.00% $0.00TDF 2055 FDENX $12,738 0.67% $85.34 0.00% 0.00% 0.20% 0.20% $25.48Lomis Sayles Bond Instl LSBDX $77,574 0.64% $496.47 0.00% 0.00% 0.00% 0.00% $0.00TOTAL $116,901,509 0.51% $ 596,097 0.13% $ 150,609
Asset Based Revenue $ 596,097 150,609Billable Revenue to ABC Provider $0 $0 Total Estimated Revenue 0.51% $ 596,097 0.13% 150,609
Total # participants 1030 Estimated Service Provider Revenue 146.22
Plan Expense Benchmarking – Total Plan Cost
10
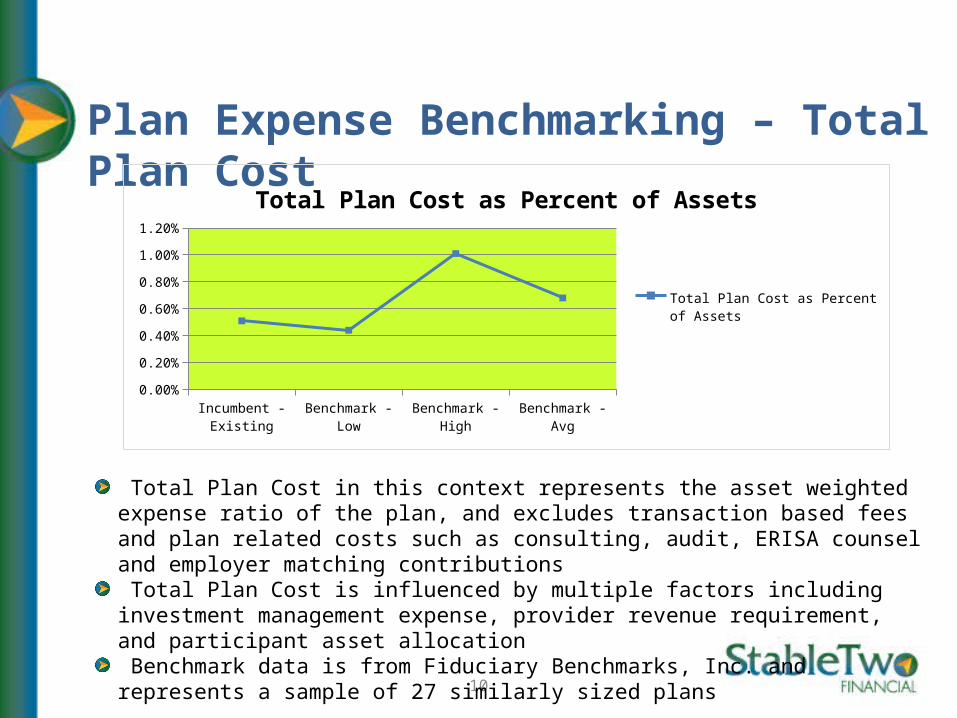
Total Plan Cost in this context represents the asset weighted expense ratio of the plan, and excludes transaction based fees and plan related costs such as consulting, audit, ERISA counsel and employer matching contributions Total Plan Cost is influenced by multiple factors including investment management expense, provider revenue requirement, and participant asset allocation Benchmark data is from Fiduciary Benchmarks, Inc. and represents a sample of 27 similarly sized plans
Incumbent - Existing Benchmark - Low Benchmark - High Benchmark - Avg0.00%
0.20%
0.40%
0.60%
0.80%
1.00%
1.20%
Total Plan Cost as Percent of Assets
Total Plan Cost as Percent of Assets

Plan Expense Comparison – Benchmarking of provider revenue, including informal “market check”
11
Note: All calculations are based on $116.9M in plan assets and 1,030 participants
Incumbent – Existing Provider A Provider B Provider C Provider D
Fiduciary Benchmarks
- Avg
Provider Revenue - % 0.13% 0.120% 0.09% 0.0945% 0.110% 0.19%
Incumbent – Existing Provider A Provider B Provider C Provider D
Fiduciary Benchmarks
- Avg
Prov Rev - $/part. $146 $136 $102 $107 $124 $215
Incumben
t - Ex
isting
Provid
er A
Provid
er B
Provid
er C
Provid
er D
Fiducia
ry Ben
chmark
s - Avg
0.00%
0.04%
0.08%
0.12%
0.16%
0.20%
Provider Revenue - %
Provider Revenue - %
Incumben
t - Ex
isting
Provid
er A
Provid
er B
Provid
er C
Provid
er D
Fiducia
ry Ben
chmark
s - Avg
$0
$50
$100
$150
$200
$250
Prov Rev - $/part.
Prov Rev - $/part.
Analysis of non-investment related expenses
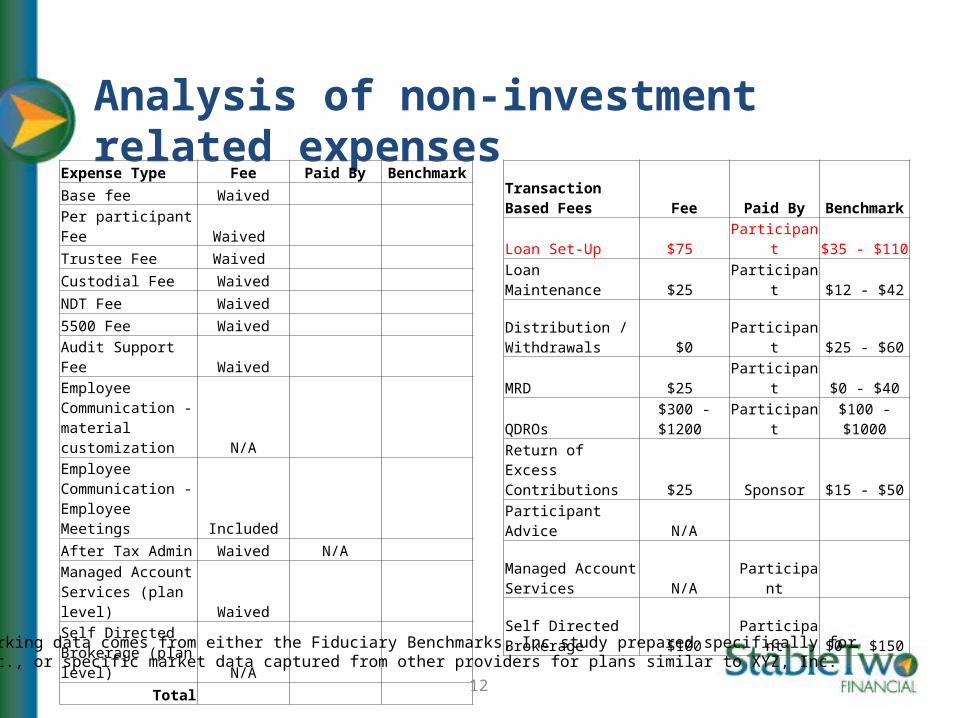
Expense Type Fee Paid ByBenchmar
k
Base fee Waived Per participant Fee Waived
Trustee Fee Waived
Custodial Fee Waived
NDT Fee Waived
5500 Fee Waived
Audit Support Fee Waived
Employee Communication - material customization N/A Employee Communication - Employee Meetings Included
After Tax Admin Waived N/AManaged Account Services (plan level) Waived Self Directed Brokerage (plan level) N/A
Total
Transaction Based Fees Fee Paid By
Benchmark
Loan Set-Up $75 Participant $35 - $110Loan Maintenance $25 Participant $12 - $42
Distribution / Withdrawals $0 Participant $25 - $60
MRD $25 Participant $0 - $40
QDROs$300 - $1200 Participant
$100 - $1000
Return of Excess Contributions $25 Sponsor $15 - $50
Participant Advice N/A
Managed Account Services N/A Participant
Self Directed Brokerage $100 Participant $0 - $150
12
Benchmarking data comes from either the Fiduciary Benchmarks, Inc study prepared specifically for XYZ, Inc., or specific market data captured from other providers for plans similar to XYZ, Inc.

Summary of ABC Provider’s Retirement ServicesProvider Profile: - One of largest provider of DC retirement solutions based on assets under administration and participants served
- Also offers broad range of employee benefit, personal wealth management solutions and mutual funds- Arup currently served on “Mid Market” platform which is targeted for plans below $50-75M
Administration: - Service team has proven to be responsive, proactive and knowledgeable business partners- Service team “metrics” for Mid Market platform are roughly two times industry average- A “bundled” product with streamlined management of the plan driven by volume submitter
document- Plan administration works well and ABC invests heavily in technology (proprietary system)- Ability to offer administrative “out-sourcing” is equal to or above industry standards- Plan Sponsor on-line capabilities are equal to market standards, although system isn’t always an intuitive system to use (major updates expected over the next 6-12 months)
Participant - Competitive on-line capabilities through Web Portal, including retirement and portfolio modeling, but site in need of updating which is due over next 6-12 months)
Communication: - Targeted part. communication approach through product suite - Full breadth of materials, but with limited ability to customize on Mid Market platform- Limited support in material fulfillment and distribution- Offers above industry standard suite of managed account and retirement income solutions- Comprehensive and industry leading participant call center capabilities- Broad retail location presence for added participant financial guidance
Investments: - A relatively open and flexible fund architecture - No proprietary fund requirement
Costs: - Has been proactive in re-assessing plan fees as the plan has grown- Full fee transparency through annual review of revenue sharing with 401(k) committee
13

Explanation of Market Check Process and Results
During April, 2012, Stable Two Financial asked four leading 401(k) providers to provide an informal quote to handle the plan administration of the XYZ, Inc. plan (a formal RFP was not issued)
Each was provided with basic information regarding the XYZ, Inc. plan including assets, number of participants, high level service requirements and degree of plan complexity
The provider pricing reflected in the prior exhibits reflect the average of their quotes as some provided several scenarios and related pricing (examples of variances include type of pricing structure and use of proprietary funds)
The range of alternative provider quotes was .09% - .12%, but one provider said they would go to .05% if they managed 30% of plan assets in their proprietary funds and another was willing to go to .06% if the plan moved to them and all of the assets were initially mapped to their Target Date Fund family.
The providers were not asked to provide a “recordkeeping only/unbundled” proposal at this time
Each of the quoting providers were proposing their “mid/large market” product and service offering which in general all provide greater levels of participant communications support (e.g. greater customization, assignment of a “Communications Consultant” and more support with material fulfillment and distribution) and lower service team “metrics” (the ratio of clients per service representative)
While the Fiduciary Benchmarks, Inc average result was .19% (above the current ABC Provider level), the range of pricing in the 27 plan sample was .06% - .41%
These price estimates do not include additional transaction based fees (e.g. Loans, MRD, etc.). ABC Provider’s fees generally fall within industry standards although at the higher end for loan origination
14

Analysis of Plan Fees and Service Levels
Total Plan Cost is in a low to reasonable range Current administrative revenue generated by ABC Provider is reasonable , but on the higher end of the competitive range
High utilization of ABC Provider mutual funds may generate added revenue beyond that shown in their revenue sharing figures XYZ, Inc. has been satisfied with ABC Provider and the current ABC Provider service and product is very strong in many areas. Based on plan size though, the current service offering may be below industry standards for participant communications support and service team metrics The high level results of this study have been shared with ABC Provider to see if there is an opportunity to reduce administrative revenue or expand services
15
Existing Revenue as % of Plan
Assets
Reasonable Competitive Price
Range as % of Plan Assets
Savings Range as % of Plan Assets
Potential Annual Savings - $
Provider Revenue 0.13% .09% - .12% .01% - .04%$10,300 – $45,000
Excludes transaction based fees

Sample Next StepsBegin conversations with ABC Provider regarding revenue requirements and service offering to see if additional reductions are availableDiscuss the current pricing model and determine if an alternative structure would be beneficialDetermine next steps, if any, based on ABC’s response, including: Options for implementation of negotiated changes
Fund changes that could lower costs (e.g. share class change, Collective Trusts)
Revised pricing model, if applicable Service enhancements, if applicable
Fully document the process and decision reasoning to create fiduciary “paper-trail”Communication of changes to participants, if applicable
16

Understanding the Various Pricing Models Available and Allocating Plan
Revenue
17
Strafford Publications

How do you want to pay for the Plan – Primary Industry Pricing Models
18
Bundled - Asset-Based
Recordkeeping Only – Fixed Basis
Points
Recordkeeping Only –
Fixed Dollar
Level/Equalized Revenue
Zero Revenue Sharing Funds
Note: The Bundled, Asset-Based model is what is currently being used by the majority of plan sponsors
Primary Industry Pricing Models
19
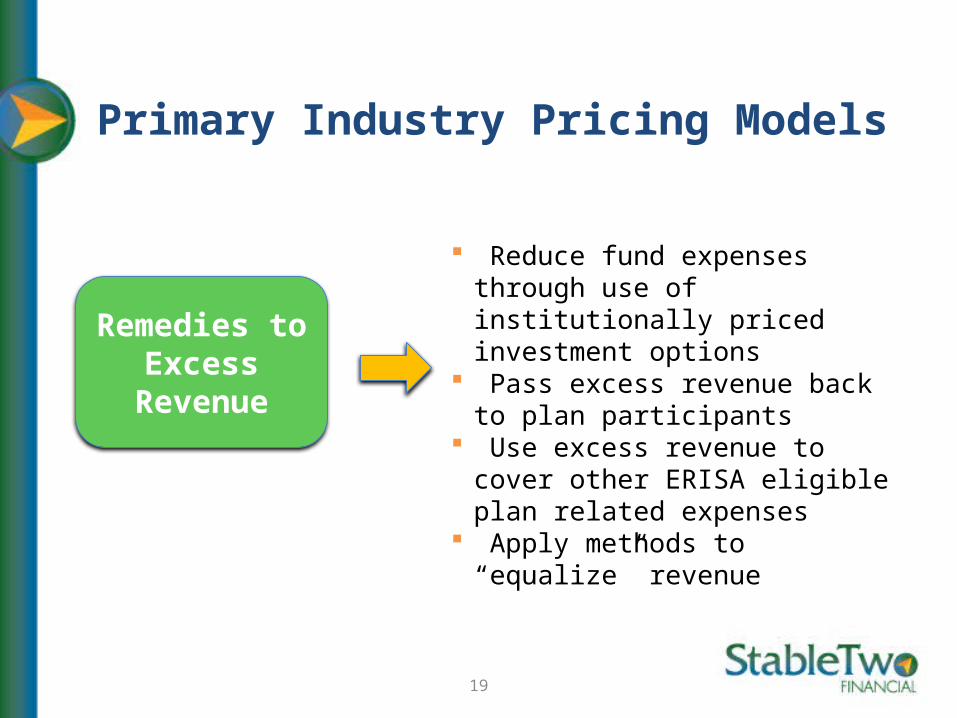
Remedies to Excess Revenue
Reduce fund expenses through use of institutionally priced investment options
Pass excess revenue back to plan participants
Use excess revenue to cover other ERISA eligible plan related expenses
Apply methods to “equalize” revenue
Next Area of Debate
20
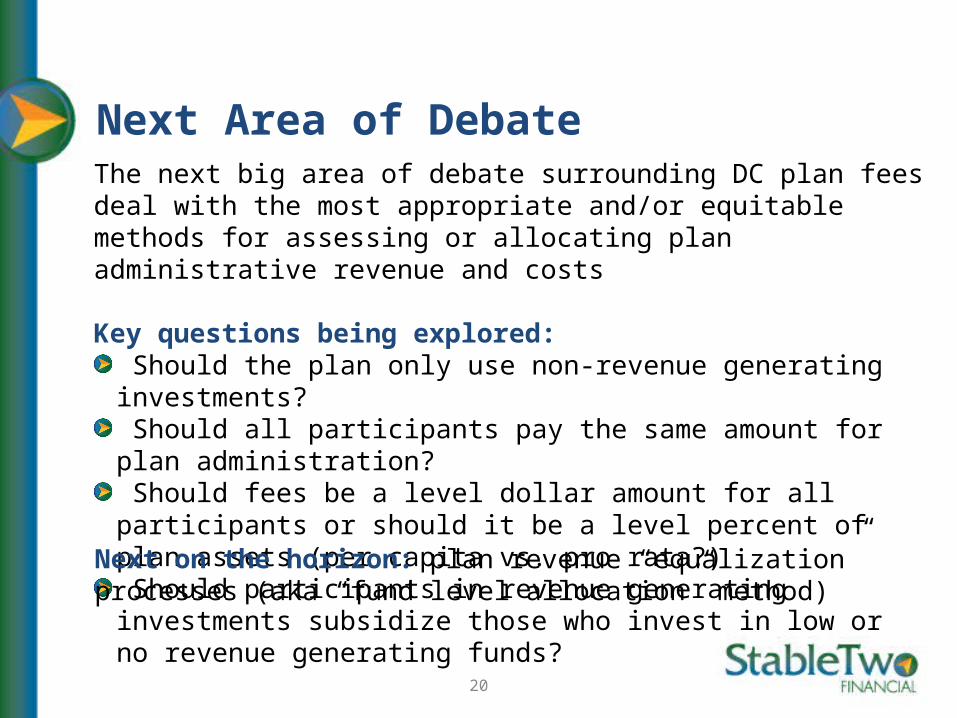
The next big area of debate surrounding DC plan fees deal with the most appropriate and/or equitable methods for assessing or allocating plan administrative revenue and costs
Key questions being explored: Should the plan only use non-revenue generating investments? Should all participants pay the same amount for plan administration? Should fees be a level dollar amount for all participants or should it be a level percent of plan assets (per capita vs. pro rata?) Should participants in revenue generating investments subsidize those who invest in low or no revenue generating funds?
Next on the horizon: plan revenue “equalization” processes (aka “fund level allocation” method)
An Illustration of the Potential Problem
21
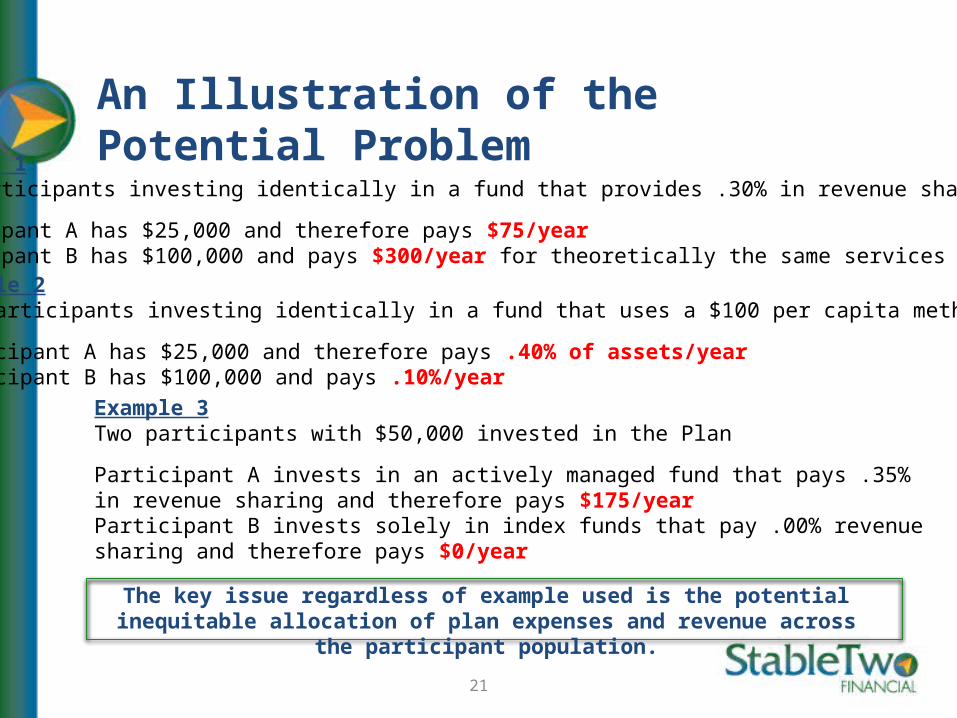
Example 1Two participants investing identically in a fund that provides .30% in revenue sharing
Participant A has $25,000 and therefore pays $75/yearParticipant B has $100,000 and pays $300/year for theoretically the same services
Example 3Two participants with $50,000 invested in the Plan
Participant A invests in an actively managed fund that pays .35% in revenue sharing and therefore pays $175/yearParticipant B invests solely in index funds that pay .00% revenue sharing and therefore pays $0/year
The key issue regardless of example used is the potential inequitable allocation of plan expenses and revenue across the participant population.
Example 2Two participants investing identically in a fund that uses a $100 per capita method
Participant A has $25,000 and therefore pays .40% of assets/yearParticipant B has $100,000 and pays .10%/year

Potential Solutions to the Problem
22
Complete use of zero revenue sharing investmentsAn approach that eliminates revenue sharing and is replaced by either a pro rata or per capita fee that can be paid by the employer or deducted from participant accounts
Revenue Normalization/Equalization (aka Actual Allocation Method)
A process where the provider compares the revenue required to administer the Plan with the actual amount of revenue generated, at the participant level If a surplus over the required amount exists, a credit is passed back to that individual participant If the actual revenue generated isn’t sufficient to cover the required revenue, a deduction is made from that participant’s account The required revenue amount can either be set as a percent of plan assets or a flat dollar amount per participant
The Challenges and Reality: many record-keepers are just now creating the administrative capability to handle plan expense “equalization” processes; it also creates an added level of complexity for the participant and some fear it will encourage inappropriate investment decisions
Selecting an Allocation Methodology
23
DOL guidance on allocation methodology is unclear, only that it is a fiduciary function and the plan must weigh the competing interests of the various classes of employees (and the effects of the method on those classes)
In the absence of a clear method being “endorsed” by the DOL, sponsors should:
Create and follow a deliberate and prudent process for the allocation of expenses and revenue Consider the interests and possible effects of various classes of participants Ensure that the method is reasonable relative to the services provided Avoid conflicts of interest (particularly if the plan’s fiduciaries are also participants in the plan)

The Bottom Line
24
Fee Disclosure has not resolved everything Plan sponsors need to pay attention to plan fees and thoroughly understand what they pay, what they get in return A thoughtful and consistently applied process, along with thorough documentation is a must Sponsors should understand the various pricing options and choose one that is best given their unique situation Be prepared for conversations about allocation methodology

Appendix
25
Stable Two Financial, LLC is an investment adviser registered with the U.S. Securities and Exchange Commission. Advisory services are only offered to clients or prospective clients where Stab le Two Financial, LLC and its representatives are properly licensed or exempted. This website is solely for informational purposes. No advice may be rendered by Stable Two Financial, LLC unless a client service agreement is in place with you.
Description of a typical Bundled Pricing Model
26
What many sponsors currently have in place. The fee is negotiated and is typically defined as a revenue “target” (often described at a percent of plan assets), but isn’t a formal contractual obligation of the provider, or the Plan.There is no on-going reconciliation of actual revenue to the target and a variance in the actual revenue produces either a surplus or deficit that is retained by the provider(although either party can renegotiate if the actual results deviate materially from the assumptions originally made)Provider usually offers an inclusive suite of services, with some ala carte options availableProvider usually offers many product updates/enhancements without an incremental increase in costs, but not all.The contract is typically “evergreen” and can be terminated at any time (subject to the service agreement language) by either party.Pro: The provider assumes all market and participant asset allocation/behavior risk. For instance, if the market falls materially, they cannot come back and ask for more money retroactively (although they could renegotiate for a prospective change). Likewise, if participants re-allocate their assets to funds that generate less revenue (e.g. index funds), the provider cannot ask you to pay for the shortfall.Con: While still the most commonly used pricing model in the industry for smaller plans, it is becoming less popular among larger plan sponsors who are looking for a greater degree of transparency and accountability. While it doesn’t open the sponsor up to unbudgeted costs (see the two models to follow), it is less transparent and precise and requires periodic monitoring/benchmarking to ensure that costs don’t become unreasonable as the plan grows. It increases the likelihood of having on-going surpluses since it is only a point in time calculation.Some providers can create a hybrid model that would allow for the periodic allocation of negotiated “surplus revenue” above the target to be allocated back to participants or used to fund “ERISA Budget”. The amount is predetermined at the beginning of the year and does not change until it is recalculated the following year. If revenue exceeds the amount negotiated at the beginning of the year, the sponsor retains it. If revenue is less than negotiated the provider cannot recoup the loss. The participant credit is typically allocated quarterly on a pro rata basis to participants with an account balance at the time of the allocation.

Description of a typical Fixed Basis Point Model
27
Fee is negotiated and is defined as a pre-determined percent of plan assets (e.g. .10%) which becomes the contractually identified price. Through periodic reconciliation, typically quarterly, credits and deficits are determined as noted below.
There is periodic reconciliation (typically quarterly) of actual revenue received to the negotiated rate to determine if there is a surplus or deficit in the revenue received by Fidelity. If the result is a credit, it could be passed-back to participants, used to pay for ancillary services
from Fidelity such as additional employee meetings or custom communications, or used to pay other ERISA eligible expenses (such as your consulting or auditors fees)
If a deficit exists, the provider will bill either the plan sponsor or debit participant accounts (usually as part of the next participant statement or client invoice - often quarterly).
Provider usually offers a predefined suite of services, with more ala carte options
Provider may offer product updates/enhancements without an incremental increase in costs, but may also charge for additional services they roll-out
The contract is typically for a set term (typically 2-3 years) and may be more difficult to terminate at will.
Pro: The provider assumes the market risk described above
Con: The plan assumes the risk for variances in participant asset allocation/behavior which could open the sponsor (or participants) up to less predictable costs if participant asset allocations change quickly (assuming fund revenue is being used to cover the cost of plan administration.)
This approach is becoming a common pricing method for larger plan sponsors and is gaining use by smaller plans as well as it is viewed as a more precise method of allocating plan costs and revenue and offers greater transparency.

Description of Fixed Dollar Model
28
Fee is negotiated and is defined as a pre-determined cost per participant (e.g. $100/participant) which becomes the contractually identified price. Through periodic reconciliation, typically quarterly, credits and deficits are determined as noted below.
Similar to the Fixed Basis Point model, there is periodic reconciliation (quarterly or annually depending on the provider) of actual revenue to the negotiated rate to determine if there is a surplus or deficit in revenue received. If a surplus develops, it creates a “credit.” Some providers can credit the surplus back to
participants, use to pay for ancillary services from that provider can offer such as additional employee meetings or custom communications, or used to pay other ERISA eligible expenses (such as your consulting or auditors fees)
If a deficit exists, the provider will bill either the plan sponsor or debit from participant accounts.
Provider usually offers a predefined suite of services, with more ala carte options
Provider may offer product updates/enhancements without an incremental increase in costs, but may also charge for additional services they roll-out
The contract is typically for a set term (typically 2-3 years) and may be more difficult to terminate at will.
Pro: This approach also offers greater transparency and since it is not asset-based, the total revenue received by the provider won’t automatically increase/inflate as the plan assets grow.Con: The plan assumes both the market and participant asset allocation risk described above.
This approach is becoming more commonly used, particularly among very large sponsors, but adoption is slower than fixed basis points due to the added risk transfer back to the plan and the potentially less certain budgeting, particularly if the plan intends to pay for plan administration using fund revenue.
Description of Fee Equalization Pricing Model
29
A new model is emerging that some people believe is a more equitable approach to allocating plan expenses and revenues. This is where the cost of the plan is determined either as a percent of assets or cost per participant, and the provider reconciles plan revenue and costs regularly at the participant level based on the specific funds that that participant has selected. For instance, if the contractually negotiated provider fee is .15% and the individual participant has chosen funds that in total produce .20% of revenue, the participant would receive a credit of .05% (usually quarterly). Conversely, if they invest in funds that only generate .10%, they would see an expense deduction to their account equal to .05%.
Although this approach is more complex for the record-keeper to administer and for the participant to understand, it neutralizes the concern that participants investing in funds that provide revenue sharing are subsidizing those who choose low or zero revenue sharing funds. All participants would pay what the plan sponsor has deemed to be an equal share of plan administrative expenses (the provider’s fee can be applied on either a pro rata/asset-based basis or as a level per capita fee).
Pro: It takes transparency to a new level and eliminates the potential and historically inherent unequal subsidization of plan costs among participants.
Con: This approach is administratively difficult and providers are at differing stages of building the capability of supporting it. It also could create confusion for participants. Many have stated that they can administer a form of it but the methodologies vary by provider.

Description of Zero Revenue Sharing Funds Pricing Model
30
Some plan sponsors are choosing to eliminate the complexity of revenue sharing completely by only using funds that do not pay any form of revenue to the provider (e.g. institutionally priced mutual funds, collective investment trusts, separate accounts). In lieu of the plan’s administration being paid for through fund revenue, the provider either bills the Plan Sponsor quarterly, or the recordkeeping fee can be evenly deducted from participant accounts on either a pro rata or per capita basis, again, usually quarterly. This approach is typically used in concert with either the Fixed Basis Point or Fixed Dollar pricing models.
Pro: Provides complete transparency by separating the administrative costs from the plan’s investment expenses.
Con: Can require a complete redesign of the plan’s investment menu since many mutual funds, including institutional share classes still pay some level of revenue sharing.
Con: Similar to the Fee Equalization Model, it changes the historic approach of paying for the plan through fund revenue sharing and requires a higher level of participant communication to explain the change.

Q&ATo ask a question from your touchtone phone, press *1. To exit the queue, press *1 again.
You may also use the Chat function to ask questions, or email questions to [email protected]
CLE/CPE CODE: TLBJRF

Tell us how we did!
After you complete a brief survey of this program, we'll send you a free $5 Starbucks Gift Card.
Look for our 'Thank You' email (which you should receive shortly) for details and the survey link!

Thanks.
Strafford Publications, Inc.1-800-926-7926www.straffordpub.com
Please join us for our next conference, “Equity Compensation and Multinational Companies: Strategies for Overcoming Tax Complexities - Navigating Deductibility, Transfer Pricing, and Foreign Subsidiary Obligations; Best Practices for Reimbursement Agreements,” scheduled on Monday, April 6, 2015, starting at 1pm EST.