ernest orlando lawrence berkeley nati o nal - …/67531/metadc711461/m2/1/high... · previous work...
TRANSCRIPT
LBN L- 4 15 59 Cohlf-990, /a/- -
ERNEST ORLANDO LAWRENCE BERKELEY NATI o NAL LABORATORY
D.T. Yegian, R.K. Cheng, R.L. Hack, M.M. Miyasato, A. Chang, and G.S. Samuelsen Environmental Energy Technologies Division
March 1998 To be presented at the Western States Section1 B e Combustion Institute
DISCLAIMER
While this document is believed to contain correct information, neither the United States Department of Energy (DOE) nor any agency thereof, nor The Regents of the University of California (The Regents), nor the California Institute for Energy Effiaency (CIEE), nor any of CIEEs sponsors or supporters (including California electric and gas utilities), nor any of these organizations' employees, make any warranty, express or implied, or assume any legal liability or responsibility for the accuracy, completeness, or usefulness of any information, apparatus, product, or process disclosed, or represent that its use would not infringe privately owned rights. Reference herein to any specific commercial product, process, or service by its trade name, trademark, manufacturer, or otherwise, does not necessarily constitute or imply its endorsement, recommendation, or favoring by DOE or any agency thereof, or The Regents, or CIEE, or any of CIEEs sponsors or supporters. The views and opinions of authors expressed herein do not necessarily state or reflect those of DOE or of any agency thereof, of The Regents, of CIEE, or any of CIEEs sponsors or supporters, and the names of any such organizations or their employees shall not be used for advertising or product endorsement purposes
,
Ernest Orlando Lawrence Berkeley National Laboratory is an equal opportunity employer.
DISCLAIMER
Portions of this document may be illegible in electronic image products. Images are produced from the best available original document.

LBNL-41559 I
Scaling the Weak-Swirl Burner from 15 kW to 1 M W I
D.T. Yegian", R.K. Cheng*, R.L. Hack', M.M. Miyasato', A. Chang', and G.S. Samuelsen'
*Combustion Research Group Environmental Energy Technologies Division
Ernest Orlando Lawrence Berkeley National Laboratory University of California
Berkeley, California 94720
#vCI Combustion Laboratory University of California, Irvine
Irvine, California 92697
This work was supported by an exploratory grant from the California Institute of Energy Efficiency through the W.S. Department of Energy under Contract No. DE-AC03-76F00098.
Scaling the Weak-Swirl Burner from 15 kW to 1 MW
D.T. Yegian*, R.K. Cheng*, R.L. Hack', M.M. Miyasato', A. Chan$, and G.S. Samuelsen'
*(Lawrence Berkeley National Laboratory? Combustion Research Group) '(University of California at Irvine, UCI Combustion Laboratory)
1998 Spring Meeting of the Western States Section Meeting of the Combustion Institute
March 23,24 University of California at Berkeley
ABSTRACT
With the passage of SCAQMD 1146.2, low NO, regulations will be enforced for new water heaters and boilers from 22 to 585 kW starting January 1, 2000; less than two years away. This has given an added impetus to develop a burner capable of producing NO, < 30 ppm and CO C 400 ppm without substantial manufacturing costs or complexity. Developed at the Berkeley Lab, the Weak-Swirl Burner (WSB) operates in the lean premixed combustion mode over a wide firing and equivalence ratio range. This work investigated scaling issues (e.g. swirl rates and stability limits) of the WSB when fired at higher rates useful to industry. Three test configurations which varied the ratio of furnace area to burner area were utilized to understand the effects of burner chamber coupling on emissions and stability. Preliminary tests from 12 to 18 kW of a WSB in a commercial heat exchanger were undertaken at LBNL, with further testing from 18 to 105 kW completed at UCI Combustion Laboratory in an octagonal enclosure. After scaling the small (5 cm diameter) to a 10 cm WSB, the larger burner was fired from 150 to 600 kW within a 1.2 MW furnace simulator at UCICL. Test results demonstrate that NO, emissions (15 ppm at 3 % 0, at equivalence ratio + = 0.80) were invariant with firing rate and chamber/burner ratio. However, the data indicates that CO and UHC are dependent on system parameters? such that a minimurn firing rate exists below which CO and UHC rise from lower limits of 25 ppm and 0 ppm respectively. Successful testing of the weak-swirl stabilization mechanism at firing rates of up 600 kW is a significant step in providing a low-NO, burner technology to industry.

1 INTRODUCTION
Development of stationary heating and power generation equipment over the past few decades has been driven primarily by the increasingly strict rules adopted by California Air Quality Management Districts (AQMD). With over half of California’s population, the South Coast AQMD (which includes all or portions of Los Angeles, Orange, Riverside and San Bernardino counties) and the Bay Area AQMD (the nine counties in the San Francisco Bay area) have been at the forefront in developing regulations to reduce pollution within their boundaries. In order to compete in this important market, emission regulations imposed on manufacturers and sellers of regulated equipment in these two regions are often used as benchmark standards for products sold nationwide.
Manufacturers of residential and small industrial combustion appliances have been pushed increasingly harder to lower emissions of oxides of nitrogen (NO,, which includes nitrogen oxide, NO, nitrogen dioxide, NO,, and nitrous oxide, N,O) in a variety of applications. Examples of these regulations include: SCAQMD Rule 1111 limiting natural gas, fan-type residential central furnaces ( < 51 kW) to NO, < 40 nanograms/Joule of useful energy, SCAQMD Rule 1121 limiting natural gas residential hot water heaters (< 22 kw) to NO, < 40 nanograms/Joule of useful energy, and SCAQMD Rule 1 146.1 limiting small boilers, steam generators, and process heaters (585 to 1465 kW) to NO, < 30 ppm corrected to 3 % O,, dry. With the passage SQAAMD 1146.2 on January 9, 1998, NO, limits will be implemented for large water heaters and small boilers (22 to 585 kW) which were previously unregulated for NO, emissions. Depending on the particular classification of the product, NO, will be limited below 30 ppm for new products ranging from 117 to 585 kW, and below 55 ppm for products ranging from 22 to 585 kW. As these regulations will begin to take effect on January 1, 2000, manufacturers have less than two years to bring their new products into compliance with SQAAMD 1 146.2 or risk being barred from that market[ 1-31 -
Previous work at Ernest Orlando Lawrence Berkeley National Laboratory (LBNL) led to the development [4] of a novel burner which stabilizes a lean, premixed flame over a wide range of equivalence ratios, $, and firing rates. It was termed the Weak-Swirl Burner (WSB) to distinguish it from current burners using higher swirl numbers ( S > 0.60 ) which stabilize flames through the creation of recirculation zones. Laboratory tests proved that emission levels below 5 ppm NO, could be obtained within a 15 kW commercial heat exchanger. To fire at the higher rates commonly found in commercial use, knowledge of scaling effects (e.g. swirl rates and stability limits) needs to be obtained through experimental results. Thus, a larger WSB was constructed (10 cm in diameter) which has potentially four times the firing rate of the smaller 5 cm WSB at the same reference velocity. Using two different furnaces at UC Irvine’s Combustion Laboratory (UCICL), the WSBs were successfully fired at rates ranging from 18 kW to 106 kW for the 5 cm WSB, and from 146 kW to 585 kW for the 10 cm WSB. Emissions of NO,, COY UHC, COZY and 0, for firing rates ($ =
2
0.80) were recorded during this testing. The data obtained from the two geometries and three test configurations will allow a better understanding of how scaling the burner to larger sizes affects fundamental emission and stability characteristics of the WSB in applied situations. ~
BACKGROUND
The use of strong swirl for flame stabilization is common in gas turbines, dump combustors and industrial furnaces [SI. It is most effective for very high-speed flows as a means to control flame intensity, size and shape. Swirling motion is created either by tangential air injection, as in the designs of many cyclone combustion chambers, or by guide-vanes in an annular region surrounding a fuel rod. In either case, the significant function of swirl is to create a torroidal recirculation zone (TRZ). To promote the formation of a T U , a centered bluff body is often used in conjunction with a swirling annular flow. For non-premixed combustion, the TRZ promotes mixing of the fuel and air for more complete combustion, and stabilizes the flame by recirculating the hot combustion products. For premixed combustion, the TRZ generates a zone of hot combustion products that enables the flame to anchor itself at both the upstream and the downstream stagnation points. The mechanisms of TRZ flame stabilization have been the subject of numerous review papers [5, 61
In Beer and Chigier [7], a swirl number for characterizing the swirl intensity is approximated as:
R
0
When tangential injection is used, a geometric swirl number
has been defined [8, 91 to allow for the calculation of swirl intensity without direct measurements of angular and axial velocities. The term “strong swirl” is applied to those burners with S , 2 0.6 as the onset of recirculation occurs at this level of swirl intensity.
Unlike the current, “strong swirl” burners, the WSB stabilizes the combustion zone by diverging the premixed reactants. Four swirl jets inject air tangentially (inclined 20’ from horizontal) into the premixture upstream (UR = 2.8) of the burner exit. As the swirl air is delivered to the flow periphery and does not dilute the core flow, 4 is reported here without including the swirl air contribution. Adding swirl to an annular region and allowing the central core of the flow to remain undisturbed (Le. no tangential velocity within the core), creates a radial mean pressure gradient that uniformly diverges the reactants. This configuration enables the flame to propagate upstream against the decelerating divergent flow , self-sustaining itself at the position
3

where the local flow velocity equals the flame speed. Since the WSB stabilizes a flame without using recirculation as the means of stabilization, S, is below 0.6 and the term “weak-swirl” is used to describe the burner.
APPARATUS AND DIAGNOSTICS
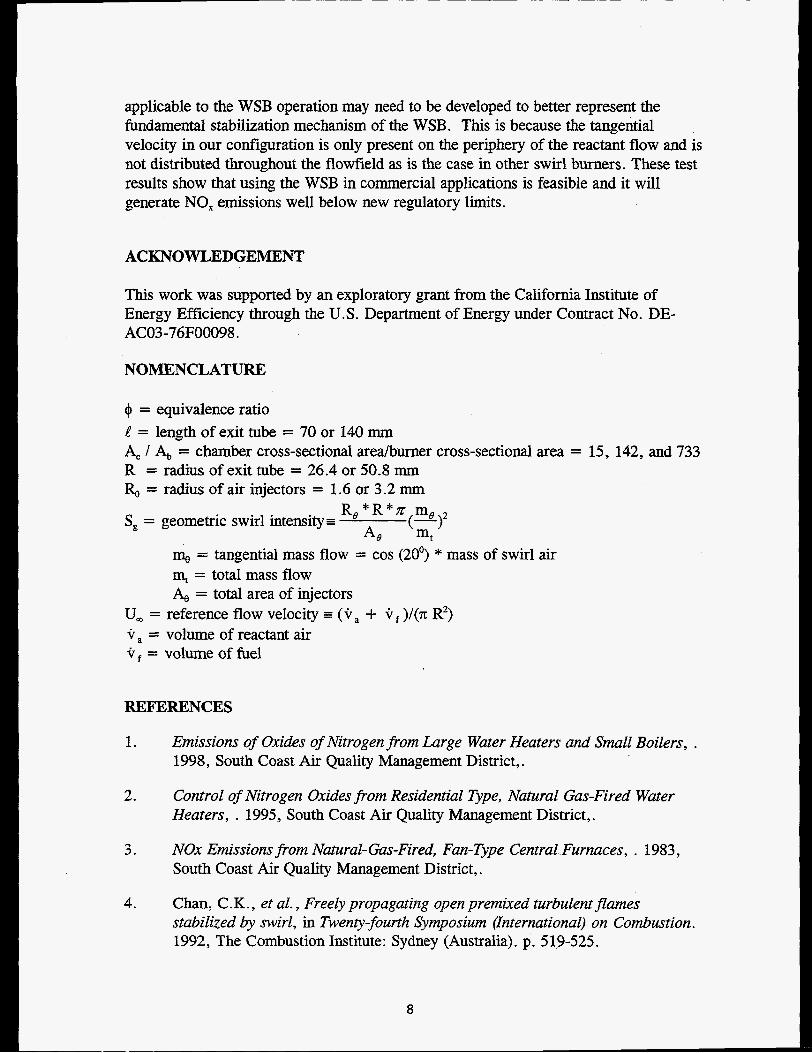
Schematics of the WSBs and the three test chambers are shown in Figures 1-3. When utilizing the LBNL water heater simulator, the 5 cm WSB sits atop a 2” pipe cross (Figure la). The interior of the cross is filled with marbles to help break down large flowfield disturbances as the homogeneous premixture enters from the side. Two perforated screens help to promote flow uniformity, as well as adding moderate turbulence (6-8%) to the flow. The smaller burner has an exit radius R = 26.4 mm, swirl injector radius R, = 1.6 mm, and an exit tube length o f t = 70 mm. The hot water simulator at LBNL has a commercial heat exchanger taken from a Telstar 50,000 Btu/hr spa heater (Figure lb). It is rectangular in shape (15 cm deep, 22 cm wide, 24 cm tall), with a fin-and-tube heat exchanger 4 cm below the top. Emission samples were taken 50 cm downstream of the heat exchanger in a 10 cm (diameter) exhaust flue. In conjunction with the 5 cm WSB, the LBNL water heater simulator has a chamber area / burner area ratio A, / A, = 15. More details of this configuration can be found in [lo].
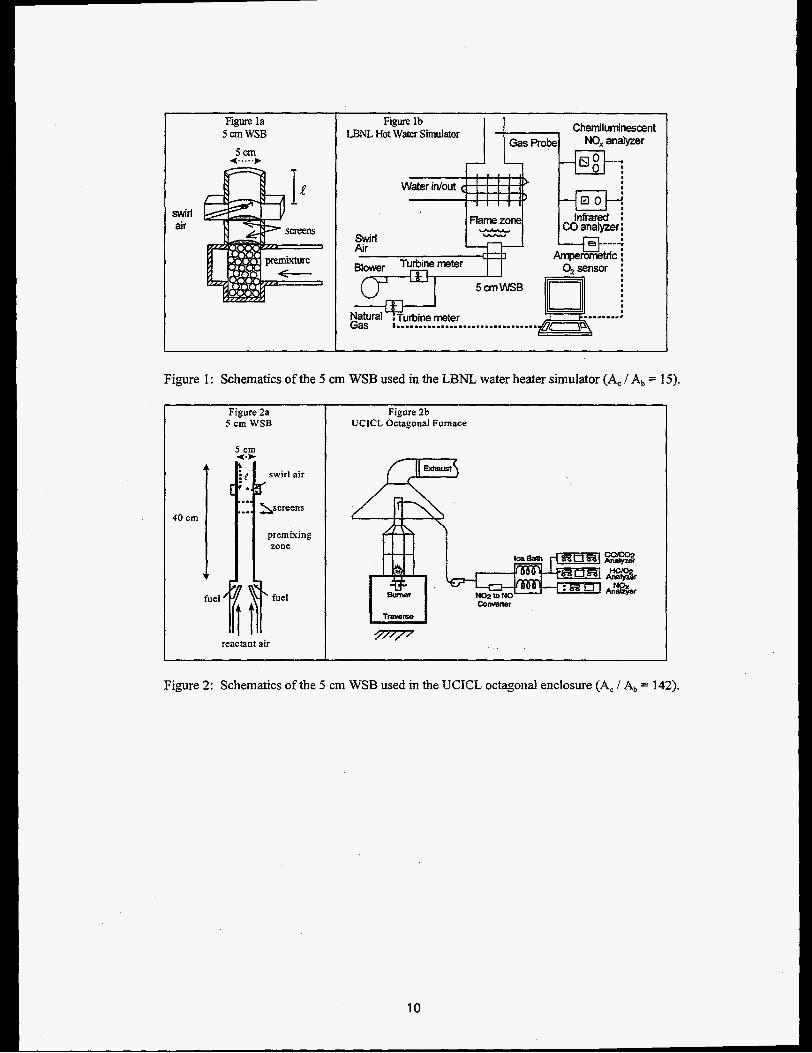
Figure 2a shows the 5 cm WSB when used in the UCICL octagonal enclosure. Natural gas is entrained through a venturi upstream of the swirler section and is mixed with the reactant air within the premixing zone. Once downstream of the two perforated plates, the burner is identical to the 5 cm WSB described above. With the burner firing vertically into the enclosure, emissions are sampled 150 cm above the enclosure floor. The octagonal furnace at UCICL measures 60 cm across and 175 cm in height, consisting of eight high temperature windows (25 cm by 30 cm) on the bottom third of the enclosure, and eight water cooled panels (25 cm by 60 cm) above the windows (Figure 2b). The area ratio A, / A, = 142 is an order of magnitude larger than the LBNL test station.
The larger burner with an exit radius R = 50.8 mm is designed to keep the non- dimensional parameters of &/R and UR similar to the smaller 5 cm WSB, with a swirl injector radius Re = 3.2 rnrn, and an exit tube length of = 140 mm. As is the case with the 5 cm WSB, the exit tube is tapered to 45’ to help prevent the formation of a recirculation zone above the burner rim. 80 cm upstream of the exit rim, natural gas is injected in the upstream direction against the incoming reactant air. The two perforated plates enhance the mixing of the fuel and air. Immediately upstream of the swirler section, a 7 cm thick section of honeycomb material is used to destroy large scale turbulence structures created in the premixing zone (Figure 3a). The interior dimensions of the large furnace simulator at UCICL are 240 cm square by 300 cm long (A, / Ab = 733) with the exhaust exiting from the wall opposite the horizontally fired burner. Viewports give visual access from the front, rear, and side of the furnace. Figure 3a and 3b show schematics of both the 10 cm WSB and the UCICL furnace
4
simulator. More details of the UCICL test chambers can be found in [ 11, 123.
TEST RESULTS
As the 10 cm WSB has four times the area of the 5 ern WSB, firing rates will be four times higher for the same reference velocity (at identical 4). Figure 4 shows the results from the experimental runs at UCICL in both the octagonal enclosure (5 cm WSB) and the furnace simulator (10 cm WSB) with 4 held constant at 0.8. For the 5 cm WSB, operating conditions ranged from 18 kW to 106 kW (2.7 to 16.6 d s ) while the 10 cm WSB fired at rates from 146 kW to 585 kW (6.2 to 24.8 d s ) . The maximum firing‘rates shown here are not the highest rates attainable. In both cases, the maximum firing rate was limited by peripheral components; i.e. cooling capacity of the octagonal enclosure for the 5 cm WSB and the amount/pressure of swirl air available for the 10 cm WSB. There is no indication that the burners could not be fired at higher rates given sufficient ancillary support. Definitive lower limits on the firing range were not explored as earlier experiments at LBNL determined a lower limit for the reference velocity Uref of approximately twice the flame speed to avoid flashback conditions. Testing the 5 cm WSB in the octagonal enclosure established the stable operating range from S, = 0.02 - 0.04 for U, = 3 to 17 d s . When the same S, (k: 0.04) was applied to the 10 cm WSB for our fEst test at w 12 d s , flame blow-off was immediate. Additional tests established the operating regime for the 10 cm WSB at a higher S, k: 0.08 as shown in Figure 4. Two trends appear; first, stable operation of the 10 cm WSB requires S, to be 2 - 2.5 times greater than for the 5 cm WSB at similar velocities, where a doubling of S, requires an increase of 66% more swirl air. The second trend which is evident is that unlike the 5 cm WSB where S, increases with U,, S, appears level for the 10 cm WSB over a wide range of reference velocities.
As noted earlier, regulations are driving the manufacturers to decrease pollutants, particularly NO,, emitted by combustion equipment. Demonstrating the feasibility of the WSB to achieve firing rates up to 600 kW is an important first step. However, it is the WSB’s emission characteristics that are of primary interest to industry. Previous research at LBNL demonstrated low levels of NO, and CO being emitted by the 5 cm WSB in a water heater simulator. Figures 5 and 6 show NO, and CO respectively, over equivalence ratios of 0.70 2 Q 5 0.90 while firing at 12 to 18 kW; -/+ 20% of the heat exchanger’s rated capacity of 15 kW. As expected, NO, primarily depends on Q, with levels increasing from 5 ppm at Q = 0.70, to k: 15 ppm at @ k: 0.80, and x 35 ppm at Q = 0.90. Figure 5 also shows that although the firing rate is increased by 50% from a minimum firing rate of 12 kW, there is only a insignificant change in NO, with the increasing input power. This dependence on @ is caused by the higher flame temperatures associated with Q as stoichiometry is approached. As there are negligible amounts of nitrogen in natural gas, the generation of NO, in premixed flames is overwhelmingly dependent on the oxidation of atmospheric nitrogen at high temperatures. Described by the Zeldovich mechanism, the production of NO, increases
5
exponentially with temperature, and thus NO, is not directly effected by firing rate. This is not the case with CO, where Figure 6 clearly shows a substantial decrease in CO as the firing rate increases to 18 kW. Reductions of > 60% are seen for $ = 0.70 to 0.90. From a high of 1350 ppm at 4 = 0.70 when firing at 12 kW, to a low of 17 ppm at @ = 0.90 and 15 kW, it has been demonstrated that CO emissions can be greatly altered while still achieving the low NO, emissions seen Figure 5 .
By changing the chamber/burner area ratio, the dynamic coupling of the burner chamber interaction can be readily investigated. Using $ = 0.80 as a standard condition, the effects of burner chamber coupling are compared for the 5 cm and for the 10 cm WSBs. The 5 cm WSB was fired within the UCICL octagonal combustion chamber where the 4 / Ab = 142, roughly an order of magnitude greater than the area ratio found in the LBNL water heater simulator. The 10 cm WSB was fired into the UCICL furnace simulator with a ratio of A, / Ab = 733. This is a 50-fold increase from the A, / Ab = 15 found in the LNBL experimental setup. Figures 7, 8, and 9 show the results of these tests for NO,, CO, and UHC. The two x-axis scales using firing rates of the 5 and 10 cm WSB are equivalent to the same U, (from 0 to 25.5 m / s for both).
As seen in Figure 7, no dependence of NO, with firing rate (encompassing a 5 to 1 turndown ratio) is exhibited. Nor is there any difference associated with the three different chamberburner area ratios. Thus the level of NO, emissions is a local effect within the combustion zone, and does not depend on overall system effects such as chamber size and firing rate. NO, levels consistently stay within a few ppm of 15 ppm, with even the highest reading of 21 ppm well below the strict regulations imposed by SCAQMD 1 146.2.
Figure 8 however shows the importance of firing the WSB at specific minimal input rates in order to achieve optimal CO levels. Plotted on a logarithmic scale to display the full range of CO emission levels, it is seen that identical fEing rates can produce drastic changes in CO due to burner chamber coupling. The 5 cm WSB firing at 18 kW in the LBNL simulator (A, / k, = 15) achieved CO = 50 ppm while the same firing rate in the octagonal enclosure (A, / Ab = 142) produced significantly higher emissions with CO = 2500 ppm. As firing rates increase within each of the three enclosures, CO levels drop substantially. When the WSB is fired above a minimal input rate of = 65 and 400 kW in the octagonal enclosure and in the furnace simulator, CO emissions attain a constant level of 25 ppm. Extrapolating from the three data points available for the LBNL water heater, it appears that a minimum firing rate of 25 kW is sufficient to reduce CO to 25 ppm. It should be noted that the dashed lines in Figure 8 are there to guide the eye, and are not intended to be trend lines fitting the data points.
In Figure 9, the data obtained for unburned hydrocarbons also illustrates the effect of burner chamber coupling. The small WSB firing into UCICL octagonal enclosure shows how a small change in firing rate can have a major impact on emission
6
levels. By doubling the input power from 18 kW to 36 kW, UHC production is decreased from 2800 ppm to 60 ppm (average). Despite the large data scatter (e.g. UHC = 35 and 85 ppm at 36 kW) and fluctuations (e.g. 0 ppm at 210 kW, rising to 15 ppm at 300 kW before dropping down to 0 ppm again), the general trend of the data set indicates that for firing rates above 75 and 300 kW (similar U, of = 12 d s ) , UHC emissions are essentially 0 pprn.
DISCUSSION
Testing of the 10 cm WSB at UCICL was designed to study if the WSB could be scaled to firing rates of commercial interest while still achieving the same low emission levels as those measured in a smaller burner. By doubling the burner radius from 5 cm to 10 cm, four times the firing rate is achieved for the same reference velocity. Our design had kept the non-dimensional parameters of &/R, l/R, and Sg similar. The intent was to show that the stability regime (as defined by S,) would be similar for the two burners. As Figure 4 displayed, that was not the case as the stability regime is twice as high for the 10 cm WSB as for the 5 cm WSB. This indicates that the amount of divergence needed for flame stabilization in the large burner was not accomplished even though the conditions (Le. U, and S,) were similar to those found for a smaller burner in a stable operating mode. This non-linearity may be caused by burner chamber coupling, buoyancy effects, or flame speed differences due to varying levels of turbulence.
Unlike NO, emissions which are constant at 15 ppm for an equivalence ratio of 0.80, CO and UHC levels are more dependent on system variables such as firing rate and chamber size. Figures 6 , 8 and 9 all demonstrate how slight changes in firing rates can produce significant variations in both CO and UHC. Burner chamber coupling, as displayed by the chambedburner area ratio in Figure 8, has a significant role in the production of CO. Once specific minimal input powers are achieved (dependent on chamber size), CO emission levels were essentially uniform at 25 ppm and UHC remained constant at 0 ppm for the tests completed at UCICL.
SUMMARY AND CONCLUSIONS
Our tests of a large weak-swirl burner were successful in proving that the weak- swirl stabilization mechanism can be scaled to higher firing rates while the flame’s emissions remain well below the limits set by the strictest air pollution regulations in the country; those adopted by SCAQMD. Also it was found that NO, did not vary with system parameters and remained constant at 15 ppm for Q = 0.80 over a wide range of firing rates. CO and UHC were dependent on burner chamber coupling with minimal levels of 25 and 0 ppm achievable for optimal firing conditions. The stability regime as defined by the geometric swirl number S, did not scale linearly between the 5 cm and 10 cm WSB, even though non-dimensional parameters and reference velocities were similar. As the WSB stabilizes the flame through flow divergence, the scaling of S, with divergence rates needs to be investigated. An alternative swirl number more
7
applicable to the WSB operation may need to be developed to better represent the fundamental stabilization mechanism of the WSB. This is because the tangential velocity in our configuration is only present on the periphery of the reactant flow and is not distributed throughout the flowfield as is the case in other swirl burners. These test results show that using the WSB in commercial applications is feasible and it will generate NO, emissions well below new regulatory limits.
ACKNOWLEDGEMENT
This work was supported by an exploratory grant from the California Institute of Energy Efficiency through the U.S. Department of Energy under Contract No. DE- AC03-76F00098.
NOMENCLATURE
Qt = equivalence ratio l? = length of exit tube = 70 or 140 mm A, / A, = chamber cross-sectional aredburner cross-sectional area = 15, 142, and 733 R = radius of exit tube = 26.4 or 50.8 mm F& = radius of air injectors = 1.6 or 3.2 mm
R e * R * x m, Ae mt
S, = geometric swirl intensity= (-1 m, = tangential mass flow = cos (20') * mass of swirl air m, = total mass flow & = total area of injectors
U, = reference flow velocity = ( i r a + .ir )/(n R') v, = volume of reactant air i r , = volume of fuel
REFlERENCES
I. Emissions of Oxides of Nitrogen from Large Wizter Heaters and Small Boilers, . 1998, South Coast Air Quality Management District,.
Control of Nitrogen Oxides from Residential Type, Natural Gas-Fired Water Heaters, . 1995, South Coast Air Quality Management District,.
NOx Emissions from Natural-Gas-Fired, Fan-Type Central Furnaces, . 1983, South Coast Air Quality Management District,.
Chan, C.K., et al., Freely propagating open premixed turbulent flames stabilized by swirl, in Twenty-fourth Symposium (International) on Combustion. 1992, The Combustion Institute: Sydney (Australia). p. 519-525.
2.
3.
4.
8

5 . Syred, N. and J.M. Beer, Combustion in swirlingcflows: a review. Combustion and Flame, 1974. 23: p. 143-201.
6. Lilley, D.G., Swirlflows in combustion : a review. AIAA Journal, 1971. 15(8): p. 1063-1078.
7. Beer, J.M. and N.A. Chigier, Combustion Aerodynamics. 1972, London: Applied Science Publishers Ltd. 100-146.
8. Claypole, T.C. and N. Syred, Eflect of swirl burner aerodynamics on NO, formution, in Eighteenth Symposium (International) on Combustion. 1980, The Combustion Institute: Waterloo, Canada. p. 81-89.
9. Feikema, D., R.H. Chen, and J.F. Driscoll, Enhancement offlame blowout limits by the use of swirl. Combustion and Flame, 1990. SO(2): p. 183-195.
10. Yegian, D.T. and R.K. Cheng. Laboratory study of a low NO, water heater with a weak-swirl burner. in Symposium of Fire and Combustion Systems. 1995. San Francisco, CA: ASME IMECE.
11. Miyasato, M.M. and G.S. Samuelsen. Near-Burner Flow-Field Characterization and Its Relation to Per$omnce in a Model Industrial, Natural Gas Fired Burner. in 1995 AFRC Fall International Symposium. 1995. Monterey, Califoria.
12. Weakley, C.K. and G.S. Samuelsen. Emissions Behavior of a High-Temperature Ihdustr-ial Burner in a Controlled Simulation of a Practical Furnace Environment. in 1996 AFRC Fall International Symposium. 1996. Baltimore, MD.
9
swirl air
Figure la 5 an WSB
5cm 4.. ...>
Figure lb LBNL Hot Water Simulator
0 ; --: E; a 0
-.I.. I.. . . . . .. . I.. .
Figure 1 : Schematics of the 5 cm WSB used in the LBNL water heater simulator (A, / A, = 15).
40 cm
Figure 2a 5 cm WSB
5 cm
swirl air
premixing zone
fuel fuel
reactant air
Figure 2b UCICL Octagonal Furnace
Figure 2: Schematics of the 5 cm WSB used in the UCICL octagonal enclosure (A, / A, = 142).

Figure 3a 10 cm WSB 80 cm
4
r 0
re ; lOcm
Figure 3b UCICL Furnace SimuIator
reactant to emission analyzers
Figure 3: Schematics of the 10 cm WSB in the UCICL funace simulator (A, / A,, = 733).
0.12 :: 0.06
$ * 146 kW --I
0 X
m
f 8
+
0 g + X
/? 585 kW
0 x 2
106 kW
1 I I I I I 1 4 8 12 16 20 24 L
UinP reference velocity (m/s) , I
Figure 4: The operating regime of the 5 and 10 cm in the UCICL combustion chambers over similar velocity regimes shows a significant increase in the non-dimensional swirl number S, (and thus swirl air) needed for stability.
11

35 n
O" 30- s 0 25- c9 > *
0 W
E 15- Q Q
z 0" 10-
5- I I I I
I I
12 14 16 18 20 Firing Rate (kW)
Figure 5: NO, emissions from the LBNL water heater simulator with the 5 cm WSB (A, / A,, = 15) displays primary dependence on the equivalence ratio and little dependence on firing rate. For $ < 0.90, the WSB exceeds the strictest regulations of SCAQMD 1146.2
1500
n (v 1250 0 s * 1000 0 + i 0 0
L
W
E Q Q 0 0
750 -
500 -
250 -
12 14 16 18 L
4 0.70 0.75 0.80 0.85 0.90
-
Firing Rate (kW)
Figure 6: CO emissions from the LBNL water heater simulator with the 5 cm WSB (A, / A, = 15) demonstrate dependence on both firing rate and equivalence ratio.
12

n ru 0 2s 0 0
i .bd
W s E P n S tn S 0 tn tn
a,
Z
.-
.-
.- E
OX
Firing rate (kw for the 5 cm WSB 2 5 1 50 75 IO0 125 150
20 -
15-
10-
5-
0
0
5cm,AJ%=15 0 5cm,A,J%=142 8 10cm,AJ%=733
0
m 0 rn
0 8
I
100 200 300 400 500 600 Firing rate (kw) for the ? O cm WSB
Figure 7: NO, levels are constant at = 15 ppm for the three chamberibumer ratios and for a firing rates from 12 to 585 kW.
Firing rate (kw) for the 5 cm WSB 25 50 75 100 125 150 3 10000, I I I I I I
'? - +\ +,
\ \ \
I I I I I 100 200 300 400 500 6
Firing rate (kw) for the 10 cm WSB D
Figure 8: As plotted on a logarithmic scale, CO emissions display a strong dependence on both firing rate and A, / A,. Minimum fring rates of = 25,65, and 400 kW are necessary to achieve CO levels of 25 ppm for A, / A, = 15, 142, and 733 respectively. Dashed lines are not fit to the data.
13

n hl
0 2g
W 8 0 i - E Q C cn C 0 cn Y,
E Q)
0 I 3
.-
.-
.-
Firing rate (kw) for the 5 crn WSB - 25 . 50 . 75 100 125 150
125 I b 1 I I I I
t 1
DDm ' 1
.- ..- - '
I ' -, 0 .......................................... 0 ....... Q ...................... 100 200 300 400 500 6
Firing rate (kW) for the 10 cm WSB
Figure 9: UHC emissions decrease dramatically with increasing firing rate however no conclusion can be drawn on the effect of A, /A,, on emission levels. Above s 75 and 300 kW (similar U, of 12 d s ) , emissions are essentially 0 ppm.
14