ernst & young item club - ey · this realisation has spurred the government into action on ......
TRANSCRIPT

Ernst & Young ITEM Club Spring 2013 forecast

Ernst & Young ITEM Club i
Contents
Highlights – Action on the home front ......................................................................................................... 1
Introduction ..................................................................................................................................................... 2
Forecast in detail ........................................................................................................................................... 11
Fiscal Policy ............................................................................................................................................ 11
Monetary Policy ...................................................................................................................................... 12
Prices and Wages ................................................................................................................................... 13
Activity ..................................................................................................................................................... 14
Consumer Demand ................................................................................................................................. 14
The Housing Market ................................................................................................................................ 15
The Company Sector .............................................................................................................................. 15
The Labour Market .................................................................................................................................. 16
Trade and the Balance of Payments ...................................................................................................... 17
Ernst & Young is the sole sponsor of the ITEM Club, which is the only non-governmental economic forecasting group to use the HM Treasury model of the UK economy. Its forecasts are independent of any political, economic or business bias.

Ernst & Young ITEM Club 1
Highlights – Action on the home front
► The UK’s major European markets are still in recession and business confidence is taking time to recover from the trials and tribulations of the last few years. This leaves the economy heavily dependent upon the home market this year, with GDP expected to grow by just 0.6%. Nevertheless we are more optimistic about longer term prospects as world trade picks up and business spending recovers, helping output to grow by 1.9% in 2014 and 2.5% in 2015.
► The rebalancing of the economy is on hold until global markets improve, but fortunately households are now in a position to provide some much needed momentum. Real incomes are growing again, helped by the strength of employment, while the high saving ratio has allowed balance sheet repair. Household spending added 0.7 percentage points (ppts) to GDP last year, helping it to grow by 0.3% despite the reduction of 0.9ppts due to net trade. Employment growth is set to fall from 600,000 to 250,000 this year, but the increases in personal allowances this April and next will help maintain the growth in real disposable incomes and consumption.
► Nevertheless, the all-important mortgage and housing markets have remained in the doldrums, held back by lender risk aversion and households that want to move but are unable to find enough capital to put up as equity. Transactions picked up in the second half of last year, but remain well below the levels seen in a properly functioning housing market. Housing investment has dropped to a level that is clearly unsustainable.
► However, the government has got the message and the Budget leverages its balance sheet to address the problems of the mortgage market. We expect a million households to move this year, helping growing families and labour mobility. Sales of household appliances and other expenditures involved in moving home will also be buoyant. The effects on house building and prices are harder to predict but are likely to be significant in 2014 and 2015.
► The Budget built up hopes of a move to a more active monetary policy when the new Governor of the Bank of England arrives this summer, but we think that these are likely to be disappointed. Forward guidance on interest rates will be hard to specify with inflation remaining stubbornly above target. And with interest rates at rock bottom, QE is nearing its sell-by date, distorting financial markets and balance sheets without significantly affecting interest expectations and spending.

Ernst & Young ITEM Club 2
Introduction Last year, the improved outlook for the consumer was largely offset by a deterioration in European and other export markets. UK exporters are unlikely to fare much better this year and we expect GDP growth to remain dependent upon the home market, growing by just 0.6%. Nevertheless we are more optimistic about longer term prospects as world trade picks up and business confidence recovers, helping output to grow by 1.9% in 2014 and 2.5% in 2015.
Rebalancing is on hold until global markets improve…
With the coalition government half way through its five year term it is clear that the initial strategy of relying upon macroeconomic and budget rebalancing has been blown off course by the Euro crisis and the weakness of other overseas markets. The UK is one of many countries banking on an export-rich recovery, making this strategy very difficult. After narrowing to 1.3% of GDP in 2011 the current account deficit expanded to 3.7% last year and the government deficit marked time. However, the headwinds facing the household sector eased, allowing domestic demand to grow by 1.4% and GDP by 0.3% on the latest estimates. The UK’s overseas markets are likely to remain weak over this year and next, making the home market vital to the momentum of the economy.
…but the government has got the message
This realisation has spurred the government into action on the home front. While sticking to Plan A and refusing to borrow to fund higher discretionary spending, the Budget used the flexibility of off-budget financial transactions to support the housing market. At the same time it called upon the Governor designate of the Bank of England to support growth with a more innovative monetary policy. Outside the housing industry, the fiscal measures were generally received with scepticism, while the call for monetary activism was seen as a hopeful sign. We are impressed by the move towards a more active and intelligent fiscal policy but are doubtful about the scope for a more innovative monetary policy.
The Chancellor has reduced the risk of recession…
The Budget’s Help to Buy (HTB) scheme allows the government to leverage its credibility in the bond market to provide cheap loans and guarantees and help get these moribund markets moving again. Last year’s Funding for Lending Scheme (FLS) leveraged the government’s balance sheet to boost the supply of mortgages and reduce their cost and these fiscal policies should inject demand into the market and the wider economy. These schemes allow the government to by-pass the dysfunctional banking system. They also circumvent the reservations of the Bank of England, which is reluctant to take credit risk on to its balance sheet. If the combined effect of the HTB and FLS does not work then it is hard to see what will.

Introduction
Ernst & Young ITEM Club 3
…by sharing exposure to house prices…
The sceptics have argued that although these financial transactions do not formally increase the borrowing requirement they nevertheless strain the government’s credibility in financial markets. They expose the Exchequer (as well young families) to the risk of a fall in prices in an overvalued housing market. However, the recent actions of the ratings agencies have shown it is weak economic growth that threatens the governments’ credibility. The Budget initiatives will have the effect of reducing that risk by stimulating growth and cutting government borrowing.
…with home owners and mortgage lenders
With house price to earnings ratios falling back and the outlook for interest rates much lower, housing is generally affordable and arguably the risk to Generation Rent is that they will miss out if they don’t seize the opportunities provided by the Budget. References to the US sub-prime lenders are misleading because high LTV (loan to value) ratios are unlikely to mean large losses for the taxpayer if house prices fall. In the UK, unlike the US, borrowers’ incomes are at hazard if they default. Families remain in negative net equity for long periods to avoid the stigma of default, as well as the huge expense and inconvenience of parting with their own house and renting someone else’s. There is more to repossession than just putting the keys through the letterbox.
The taxpayer would admittedly make a loss if house prices fell as much as they have in the US, but if a credit crunch and a record recession did not collapse the UK market it is hard to know what would. Constraints on the supply of housing in the UK mean that comparisons with the US are again misleading. Moreover, it is clear from the strong recovery in the US housing market that the adjustment there was overdone.
On the other hand, it has been argued that these initiatives will not get off the ground and that even if they do, they will simply raise prices given the supply constraints. This is the more plausible risk. Lenders and borrowers remain cautious. The Budget was welcomed by the house builders, but they did not increase supply significantly even in the good times of the last decade, determined not to repeat the mistakes of the 1980s boom when they expanded capacity only to be hit by the slump at the end of the decade. We may think of house building as being a flexible, competitive industry of small firms as it was until the 1950s, but it is now heavily concentrated. Although planning restrictions are being relaxed, output is still falling. But it is not clear whether restrictive suppliers, the availability of land, a lack of demand or all three are the problem.
We need to look at the detail at the three components of the housing package to assess its likely impact on mortgage & housing transactions, house building & prices and the wider economy. First, the £3.5 billion allocated to shared equity loans under the HTB scheme may not sound like very much, but the impact on housing transactions should be more than five times bigger because the government share of the purchase price is limited to 20%. The potential is for an extra £20 billion of home equity loans. That is a lot of zeros, sufficient for example to finance 100,000 mortgages worth £200,000. The Treasury estimate of 74,000 extra mortgages thus seems reasonable, even allowing for substitution and replacement effects. Being an equity loan, the taxpayer and the mortgage borrower will share in both the upside and downside risks of fluctuations
10
12
14
16
18
20
22
24
1997 1999 2001 2003 2005 2007 2009 2011
UK: Residential investment£bn
Source : Haver Analytics
80
90
100
110
120
130
140
150
160
170
180
1982 1985 1988 1991 1994 1997 2000 2003 2006 2009 2012Source: Haver Analytics
2000=100
UK: House prices to income ratioMeasured relative to disposable income
DCLG
Halifax
Nationwide

Introduction
Ernst & Young ITEM Club 4
in house prices. Moreover, these loans will only be available upon new build houses, boosting demand in the construction industry which has a lot of spare capacity and is very important for employment and output given its low import propensity.
The Help to Buy package will boost housing turnover…
We think that this scheme will prove popular and that take up will be far higher than for previous new buy schemes. There is a lot of pent up demand in this sector, where households have been held back by a lack of mortgage finance. This scheme will help first time buyers with the deposit and ease the problem for growing families that have been prevented from moving up by a lack of equity. However, it is not clear whether this demand will lead to an increase in construction or just be met from houses that would have been built anyway, but at a higher price.
…and the associated expenditure…
The second component of the package is the Mortgage Guarantee Scheme which, from next January, will provide £12 billion of government loan guarantees over three years, sufficient to back up to £130 billion of high LTV mortgages. The government will guarantee 14.25% of the value of the property in exchange for a fee paid by the lender, no doubt reflected in the mortgage rate. Although the detail has yet to be worked out, these loans will be available on existing houses as well as new build. Indeed they will be available to households that re-mortgage their home with a new lender. The Treasury believes that this scheme could generate over a half a million new mortgages over the three year period, again reflecting the high leverage ratio.
…but the effects on house building and prices are uncertain
The advantage of this guarantee scheme lies in its flexibility. It is designed to support the market in existing homes, which are left untouched by new build schemes. That is where the vast majority of housing and mortgage transactions are generated. This makes it much harder to analyse its effect on new build, which is likely to be small, depending upon whether buyers who like the idea of a new house want to share the exposure to price fluctuations via an equity loan or a want a larger exposure with a commensurately larger mortgage rate. However, it certainly has the potential to get people moving again, easing the problem of long mortgage chains. We expect it to boost the number of housing transactions, particularly at the lower end of the market where the deposit and low equity have been a major constraint. And as any homeowner knows to their cost, this will mean a lot of business in legal and financial services as well as sales of household goods. The relatively high mortgage costs implied by the government fee should dissuade so-called zombie households from using the scheme to re-mortgage without moving home, but even in this case it would provide relief and perhaps a little leeway for extra spending.
Household borrowing is now close to equilibrium…
The impact of the two HTB initiatives on house prices is uncertain given the low ebb of confidence on the demand side and the constraints on the supply side. However, starting from the view that prices are not obviously overvalued, the risk of higher prices does not appear to us to be a major concern and as the Chancellor has indicated, the scheme could be curtailed if this risk did materialise. Moreover, modest house price inflation would have the effect of rekindling confidence and building equity, reinforcing the effect of the package on housing transactions and the associated household expenditures. It is a natural feature of a well-functioning market.
…but the weakness of the housing market…
If the HTB and FLS schemes are successful then this will inevitably mean more household borrowing. Several commentators have questioned the wisdom of this, saying that debt to income ratios remains unsustainably high. However, as we have remarked in previous reports the household sector has made remarkable progress in getting these ratios down and, with the saving ratio at over 7%, continues to do so. Moreover, this progress comes at the expense of a weak home market and there is a strong argument for slowing down the attempt to rebalance the economy until the outlook for exports and business investment improves. Unbalanced growth is surely better than no growth. As we have also remarked previously, housing investment subtracted more from GDP last year than cuts in the government’s capital expenditure. Indeed, housing investment has fallen by a third in real terms from £88.6 billion in 2007 to just £57.1 billion last year. Is that sustainable?

Introduction
Ernst & Young ITEM Club 5
...is unsustainable
Last but not least, but very different in nature, the Budget also allocated an extra £1.9 billion to help the rental sector. An extra £955 million will go to boost the Build to Rent fund announced in the Autumn Statement. This helps developers that are branching out into building homes for the private rental market. Most of this extra money will however go to Local Authorities to beef up existing schemes like the New Homes Bonus, which is designed to encourage them to switch spending to social housing from other areas. The government is expecting 140,000 new homes to be built under this scheme, although the National Audit Office has suggested that a figure of 108,000 would be more realistic.
Either way, the New Homes Bonus is significant, even though like any seed corn it looks like chicken feed. As with HTB and FLS, it could be used to buttress other initiatives. The government is encouraging local authorities to rationalise their allocation of housing to ease overcrowding. This interacts with the shakeup of the housing benefit system this April. The spare room subsidy (or bedroom tax) means that many tenants have the incentive to move to a smaller property, but the problem is that there is a shortage of smaller homes for them to move to. This is where the local authorities should focus their new-build, making this another area where a bit of seed corn funding could have a major economic, social and ultimately political impact, if used intelligently.
In view of potential of the FLS we tentatively increased our housing market projections in January. The Chancellor’s Budget initiatives make us more confident about the outlook and we have made further modest upward revisions. The new forecast is discussed below and envisages a million housing transactions this year, up from 976,000 in our January forecast and up 7½% on the year. Housing investment is likely to mark time this year, but picks up by 6% next year and another 7% in 2015.
High inflation will make it hard…
We are likely to see more policy initiatives once the new Governor of the Bank of England arrives in July. The new monetary policy remit should also give the MPC more scope to support the real economy without endangering the credibility of the monetary policy framework in the way that it currently does by allowing inflation to consistently overshoot the target. The Chancellor’s Budget Speech indicated that the new remit would adopt a new format for the letter he required from the Governor when inflation overshot the target. He also suggested that the MPC could offer the market forward guidance by saying that base rate would not be increased until intermediate thresholds were met, while maintaining the over-riding importance of the inflation target.
40
60
80
100
120
140
160
180
200
1996 1998 2000 2002 2004 2006 2008 2010 2012
-24
-16
-8
0
8
16
24
32
Source: Haver Analytics
UK: House prices and turnover000s % year
Halifax house prices(RHS)
Housing turnover(LHS)
20
25
30
35
40
45
50
55
60
65
70
1990 1993 1996 1999 2002 2005 2008 2011
UK: Housing starts & completions000s
Source : Haver Analytics
Starts
Completions

Introduction
Ernst & Young ITEM Club 6
However, the outlook for UK inflation and the proven difficulty of getting it down to the 2% target will make it hard to implement these proposals. CPI inflation has now been above this target for more than three years and for most of that period it has exceeded the target by more than 1%. The MPC has consistently said that it would bring the CPI back to target within two years, but the problem is that the UK has faced a series of inflationary supply-side shocks and this has not been achieved. Even with domestic wage inflation and now the GDP deflator running consistently below 2%, CPI inflation continues stubbornly above target. The CPI is likely to continue to misbehave until these shocks abate.
… to specify the new monetary policy remit
Oil and industrial commodity prices have eased back this year and there is much less talk about peak oil and the super-cycle in the mining industry. Sterling seems to have stabilised since the Governor of the Bank of England indicated that enough depreciation was enough. However UK inflation looks likely to remain above target for the foreseeable future. This environment will make it difficult to specify a more flexible system without setting up hostages to fortune. To take the Chancellor’s first proposal, if the new Governor has to write to him explaining not just why inflation has overshot but when it is likely to come back to target, then what happens when this forecast is upset by additional shocks?
As the Governor of the Bank of England has indicated, forward guidance will also be hard to specify without setting up a hostage to fortune. With inflation still above 2½% it would be hard for the MPC to emulate the US Fed and say that it would not increase base rate before unemployment had fallen below 6½%, with an inflation override of 2½%. In any case, to be consistent with such guidance the MPC would need to keep rates on hold until the thresholds were reached, but wouldn’t it be expected to raise them once that happened?
We think that with inflation continuing well above target it will be impossible to set out Fed-style guidance with say a 2½% inflation override. It would be less risky to announce ranges for intermediate or proximate statistics like core inflation and nominal GDP which can be designed to reflect the ultimate inflation target. We made the case for the core inflation model in 2008 on the grounds that it is not directly affected by world energy and food prices and that the headline inflation rate moves back into line with the core rate once these pressures ease. The money GDP approach was discussed in the January report. It will be interesting to see what the MPC recommends in the August Inflation Report.
The other problem facing advocates of a more flexible and active approach by the MPC is that although
0
1
2
3
4
5
6
2000 2002 2004 2006 2008 2010 2012
Source: Haver Analytics
% year
UK: Inflation
CPI
2% inflation target
0.0
0.5
1.0
1.5
2.0
2.5
3.0
3.5
4.0
2002 2003 2004 2005 2006 2007 2008 2009 2010 2011 2012 2013
UK: Core inflation% year
Source : Haver Analytics
-8
-6
-4
-2
0
2
4
6
8
10
1990 1993 1996 1999 2002 2005 2008 2011
UK: GDP growth% year
Source : Haver Analytics
Nominal
Real

Introduction
Ernst & Young ITEM Club 7
monetary policy is good at cushioning a recession and seeing off tail risks, it is bad at stimulating a recovery. As the old saying goes, you can’t push on a string, but now we have run out of string and have to reach for the duct tape. Once interest rates have hit the lower bound the central bank has to rely upon quantitative easing to stimulate the economy and these linkages are much harder to understand.
With interest rates at rock bottom …
Analysis at the Bank of England and elsewhere suggests that the initial application of QE in 2009 was helpful in reducing long term interest rates and cushioning the recession. However, it is doubtful whether subsequent doses have been as effective. As we have argued in previous reports, it is hard to think that such policies are as effective when 10-year gilt rates are nudging 1½% and non-financial companies have large cash piles that (like the banks) they are too risk averse to release.
Recent analysis of the efficacy of these policies suggests that it is important to distinguish the way they affect the quantity of government bonds in the market and its maturity structure. The quantity of government debt is an important determinant of the money stock and in this respect QE has been vital in maintaining the amount of money in circulation while banks have been deleveraging their private loan portfolios. If the central banks had not been buying bonds (and thereby borrowing from the banking system) then the money supply would have fallen by much more than it has. QE will remain vital in this role until the banks decide to resume lending to the private sector, when it will need to be reversed to prevent excessive monetary growth and inflation. However, the point is that the type of bond used in these transactions is largely irrelevant. Buying a billion pounds worth of 5-year bonds from the banks has more or less the same effect on bank reserves and the money supply as investing this sum in shorter maturities.
…and QE is approaching its sell-by date…
The maturity of the debt and its interest coupon do nevertheless affect long term interest rates. These reflect the average interest rate which investors expect to get on short term instruments plus the term premium, which is the extra return necessary to get them to hold bonds instead. At the moment bonds are in short supply and this is likely to be negative. Bond investors tend to think in terms of duration, which is an indicator of how long they have to wait to get their money back on a bond, taking account of the coupon interest that it returns as well as its maturity or redemption date. It is also a measure of their exposure to changes in interest rates while they hold the bond.
…distorting financial markets…
This means that a central bank can attempt to lower long term rates either by using forward guidance to reduce interest rate expectations or by using QE to reduce the term premium. For example, if the central bank performs an ‘Operation Twist’ and buys long term bonds and sells short term instruments to finance these purchases, this keeps the money supply broadly unchanged but shortens the duration of the debt held by investors and thus their exposure, reducing the term premium. That is what the Fed has been doing recently, following the lines of the original Operation Twist of the early 1950s to bear down on long term yields. The Bank of England has always focussed its QE operations on buying long term bonds to get some purchase over long term rates.
…without affecting interest expectations and spending
However Jeremy Stein, a very influential Fed Governor, has pointed out that it is important to distinguish between policies like forward guidance that reduce long term interest rates through interest rate expectations and those like QE that do it through the term premium. In the first case we would expect consumers to spend more now and less in the future and companies to invest more now to get a payoff in the future. However, there is no reason to expect this in the case of QE-type operations. All this does is make long term funding cheap compared to bank loans and other short term financing. In this case consumers with long term mortgages (like in the US) just refinance them more cheaply and companies pay back bank loans by issuing long term bonds. Stein puts the term premium in the US Treasury market at minus 80 basis points (nearly -1%) and as he says it is hard to think there is much to be gained by shortening the duration of the outstanding debt if this is so negative. Indeed, we would add that company boards have been spending so much time on liability management recently that this may have distracted them from the opportunities for acquisitions and investment.

Introduction
Ernst & Young ITEM Club 8
The forecast is dependent upon the home market…
Hopes that the UK would rebalance its economy towards exports and business investment have been disappointed and without the contribution from the consumer last year, GDP would have contracted. Our major European export markets remain in recession this year and UK business sentiment will take time to recover. However, after last year’s uncertainty, the outlook is for a slow revival of activity as confidence recovers and balance sheets continue to adjust. The service sector has reflected the strength of domestic demand and the latest surveys indicate that it has maintained its momentum this year. Growth is likely to be subdued this year, but the forecast shows the growth rate picking up to 1.9% in 2014 and 2.5% in 2015.
The ITEM Club forecast for the UK Economy, Spring 2013
% changes on previous year except borrowing, current account and interest & exchange rates
GDP Domestic
DemandConsumer spending
Fixed investment Exports Imports
2010 1.8 1.5 1.3 3.5 6.4 8.0
2011 1.0 -0.9 -0.8 -2.9 4.5 0.0
2012 0.3 1.5 1.2 1.5 -0.2 2.7
2013 0.6 1.0 1.2 1.2 0.6 1.4
2014 1.9 2.1 1.9 7.0 4.4 4.6
2015 2.5 2.4 2.2 7.9 5.9 5.4
2016 2.5 2.2 2.4 6.0 5.7 4.9
Net Govt Borrowing(*)
Current account (%
of GDP)Average earnings CPI
3-month interest
rate
Effective exchange
rate
2010 9.4 -2.5 2.4 3.3 0.7 80.5
2011 7.7 -1.3 2.6 4.5 0.9 79.9
2012 5.7 -3.7 1.6 2.8 0.8 83.0
2013 6.7 -3.7 1.9 2.8 0.5 79.9
2014 5.8 -3.1 3.1 2.6 0.5 79.3
2015 4.9 -2.2 4.0 2.6 1.0 78.5
2016 3.3 -1.5 4.7 2.5 2.0 77.7
(*) Fiscal years, as % of GDP
Source: ITEM Club
Consumer spending recovered last year as inflation fell back and employment growth picked up. Although inflation remained well ahead of earnings growth, employment increased by 2% (comparing the November-January average with its level a year earlier). Income from employment increased by 3% year on year, while real household disposable incomes increased by 2.1%. Consumption increased by 1.2% in 2012 after falling by 0.8% in 2011. The demand for durable goods was up 10.3%, reflecting price reductions, pent-up demand as well as the introduction of new electronic products.

Introduction
Ernst & Young ITEM Club 9
Net personal tax, NICs and benefit changes
£ billion 2013-14 2014-15 2015-16 2016-17
Personal allowance 4.4 5.9 5.8 5.5
Benefits capped at 1% -0.5 -2.1 -4.0 -4.5
Single tier pension 0.0 0.0 0.0 -5.5
Overall impact
£ billion 3.9 3.8 1.8 -4.5
% of household disposable income 0.4 0.4 0.2 -0.5
Source: HM Treasury
The forecast sees a more modest growth of 0.9% in employment this year, with another 1.2% growth in 2014. However, the increase in the income tax personal allowance from £8,105 to £9,440 in April and then to £10,000 next April will provide a very significant boost to disposable incomes, with the gains being concentrated at the lower end of the earnings scale where households spend most of their income. The Budget Red Book put the cost at £4.4 billion in 2013-14, worth 0.4% of real household disposable income. This April’s benefit reforms and the 1% cap on the rise in working age benefit reduce disposable income, but these effects will build up slowly. The introduction of the single state pension in April 2016 will also reduce disposable incomes significantly. So the net effect of tax and benefit changes is to increase disposable incomes in 2013-14 and 2014-15 and reduce them in 2016-17 and later years. The forecast sees real household disposable incomes increasing by 1.2% this year and another 1.0% next year. Consumption increases by 1.2% this year and another 1.9% in 2014 as the saving rate eases back from its recent highs.
Household sector forecast
Increase (%) Ratios
Employment income
CPI inflation Real disposable
income Consumption Savings Debt to income
2011 2.5 4.5 -0.9 -0.8 6.5 1.52
2012 3.1 2.8 2.1 1.2 7.1 1.46
2013 2.6 2.8 1.2 1.2 7.3 1.41
2014 4.0 2.6 1.0 1.9 6.5 1.40
2015 5.0 2.6 1.8 2.2 6.2 1.38
2016 5.6 2.5 1.7 2.4 5.6 1.36
Source: ITEM Club
Rising real incomes are also positive for the housing market and our analysis of the Budget measures leads us toward a much stronger housing market forecast. The forecast sees a million housing transactions this year, up 7½% on the year, implying a major boost to the associated consumer expenditures. House prices are set to follow, increasing by 2.1% in 2014 and 5.0% in 2015 and another 6% in 2016, after marking time this year. Housing investment remains a weak component of the forecast this year, but picks up by 6% next year and another 7% in 2015.

Introduction
Ernst & Young ITEM Club 10
Housing market forecast
Increase (%) Ratios
Turnover Prices Investment
House price to earnings Debt to income
2011 0.5 -2.6 2.3 1.57 1.52
2012 5.3 -0.9 -5.4 1.53 1.46
2013 7.4 0.2 -2.5 1.51 1.41
2014 7.8 2.1 6.0 1.50 1.40
2015 7.2 5.0 7.4 1.51 1.38
2016 6.7 6.0 6.3 1.53 1.36
Source: ITEM Club
…until global demand picks up
As was the case last year, the improved outlook for the housing market and the high street is offset by a slow recovery abroad, with the Eurozone, our most important export market, still in recession. The UK is one of many countries banking on an export-rich recovery, making this strategy very difficult. UK exporters have been helped by the fall in the pound in the first quarter, but it has to be said that the effects of the much bigger fall seen in 2007 and 2008 have been very disappointing. Net trade subtracts 0.2ppts from GDP in 2013 and again in 2014, after subtracting 0.9ppts last year. Nevertheless we are more optimistic about longer term prospects. Net trade makes a positive contribution to growth as world trade picks up, adding 0.1ppt to GDP in 2015 and 0.2ppts in 2016.
Companies in some leading export industries like automotive and aerospace have announced aggressive investment and expansion plans over the last two years. However, a general recovery in business investment seems unlikely until domestic and overseas demand recovers more convincingly. Business spending is currently being held back by spare capacity and risk aversion on the part of managers and investors despite the strong balance sheet position enjoyed by UK plc. Business investment increases by just 2.2% this year increasing to 8.1% in 2014. Total investment is held back by the weakness in public and housing investment this year, increasing by 1.5% followed by 7.0% as housing investment begins to recover in 2014.
..and risks and uncertainties diminish
The economic scene remains extremely risky. The Italian election results provide a stark reminder of the popular resistance to the austerity measures while the Cypriot fiasco shows that the troika is still making policy up as it goes along, running huge risks in the process. Geopolitical tensions in the Far East are another worry. Nevertheless, as previous reports have argues, the risks are becoming more symmetric. In the UK there is a real chance that the mortgage and housing markets could be turning the corner, allowing a much stronger bounce in consumer markets than we envisage. Similarly, our forecasts for exports and investment would surely be overtaken if the uncertainty about the Eurozone were convincingly resolved.

Ernst & Young ITEM Club 11
Forecast in detail Fiscal Policy The March Budget saw the Chancellor attempt to stimulate economic growth without loosening the pace of fiscal retrenchment. The Office for Budget Responsibility’s (OBR) forecasts had followed their well-established pattern, with the near-term growth forecasts downgraded and the borrowing projections revised up. However, the changes were relatively small and, with the Chancellor also switching some current spending to capital projects over the latter part of the forecast horizon, the forecasts still showed the cyclically-adjusted current budget returning to surplus in 2016/17, providing a similar room for manoeuvre as there had been at the time of the Autumn Statement.
The Chancellor announced 41 new policy changes to add to the 24 already announced since the 2012 Budget. It would be difficult to argue that any of the individual measures will have a tangible impact on economic growth, but the package did offer some assistance to struggling sectors, such as housing and construction, and was consistent with the Chancellor’s aim of improving the attractiveness of the UK as a place to do business.
The key policy initiative was the Help to Buy scheme. This extended the First Buy scheme beyond first-time buyers to offer shared equity deals on new build houses to any potential buyer, as well as creating a mortgage guarantee for lenders offering mortgages with loan-to-value ratios of between 80-95%. These policies appear to be a good compliment to Funding for Lending and should increase the chances of a sustainable recovery in both housing transactions and prices. Savings made from the introduction of a single-tier state pension were used to fund giveaways for businesses – a further 1ppt reduction in the rate of corporation tax and a £2,000 cut in firms’ employer’s NICs bill – and households – a further increase in the income tax personal allowance to £10,000 next year and the cancellation of September’s rise in fuel duty.
But the big disappointment was the lack of a short-term boost to capital spending. In the event the Chancellor only raised capital spending by £3bn a year from 2015-16, which will be financed by deeper cuts to current spending. With the recovery remaining fragile, such a change really is too little, too late.

Forecast in detail
Ernst & Young ITEM Club 12
The data for the public finances has been subject to a range of statistical changes, including the reclassification of Bradford & Bingley and Northern Rock into the public sector, the nationalisation of the Royal Mail pension fund and the decision to repatriate the interest earned from assets bought during QE from the Asset Purchase Facility (APF) to the Treasury. These factors, plus the inclusion of revenue from the auction of the 4G spectrum, meant that we expect PSNB to have fallen from £121bn in 2011-12 to £88bn in 2012-13. Borrowing will be higher in 2013-14, but should gradually drop back from next year and the Chancellor looks well placed to balance the cyclically-adjusted current budget within the five-year horizon (currently 2017/18).
Monetary Policy Monetary policy has effectively been on hold since the most recent set of asset purchases was completed in early November, although the Bank has continued to promote its Funding for Lending Scheme (FLS) in the interim. However, there are increasing signs that the ground is being prepared for further stimulus.
The consensus in favour of maintaining the current policy stance has been progressively eroded in recent months, with three members – including the Governor – now voting for further quantitative easing (QE). Furthermore, the MPC has been more explicit about being prepared to tolerate high inflation for longer in order to avoid damaging the recovery.
In changes announced in the Budget, the Chancellor effectively gave the MPC the green light to interpret its remit in this way and also asked it to assess the implications of adopting more ‘unconventional monetary instruments’ including the type of forward guidance used by the Fed. These announcements by the MPC and the Chancellor appear to be laying the ground for further QE and our forecast assumes a further £25bn of asset purchases in both May and August. However, we feel that this is unlikely to provide much support to the recovery and the continued use of the FLS, which appears to be gradually increasing credit availability to both households and firms, is far more important.
Having risen at the start of the year, gilt yields have softened again in recent weeks. We attribute this to the expectation of more QE and the UK’s position as a safe haven outside the Eurozone, with the Italian election and the bailout of Cypriot banks having weighed on investor sentiment about the Eurozone. With growth prospects subdued, long-term interest rates should remain low in the short-term. Our forecast shows 10-year yields moving just above 2% through 2013, before gradually rising as investors become more confident about the recovery.
The expectation of further QE has also weighed on the pound, which has fallen from $1.62 at the beginning of the year to $1.52 in recent weeks. We expect additional QE and a weak recovery to cause it to slip further, to around $1.50 by the end of the year and $1.48 by 2014Q4. Concerns over the Eurozone have led to greater resilience against the euro and this is likely to remain the case in the near future.
-40
-20
0
20
40
60
80
100
120
140
Apr May Jun Jul Aug Sep Oct Nov Dec Jan Feb Mar
-40
-20
0
20
40
60
80
100
120
140
Source: Haver Analytics
£bn
UK: Public sector net borrowing
Fiscal year 11/12
Fiscal year 12/13
Cumulative position
£bn
OBR forecast 12/13
Forecast in detail
Ernst & Young ITEM Club 13
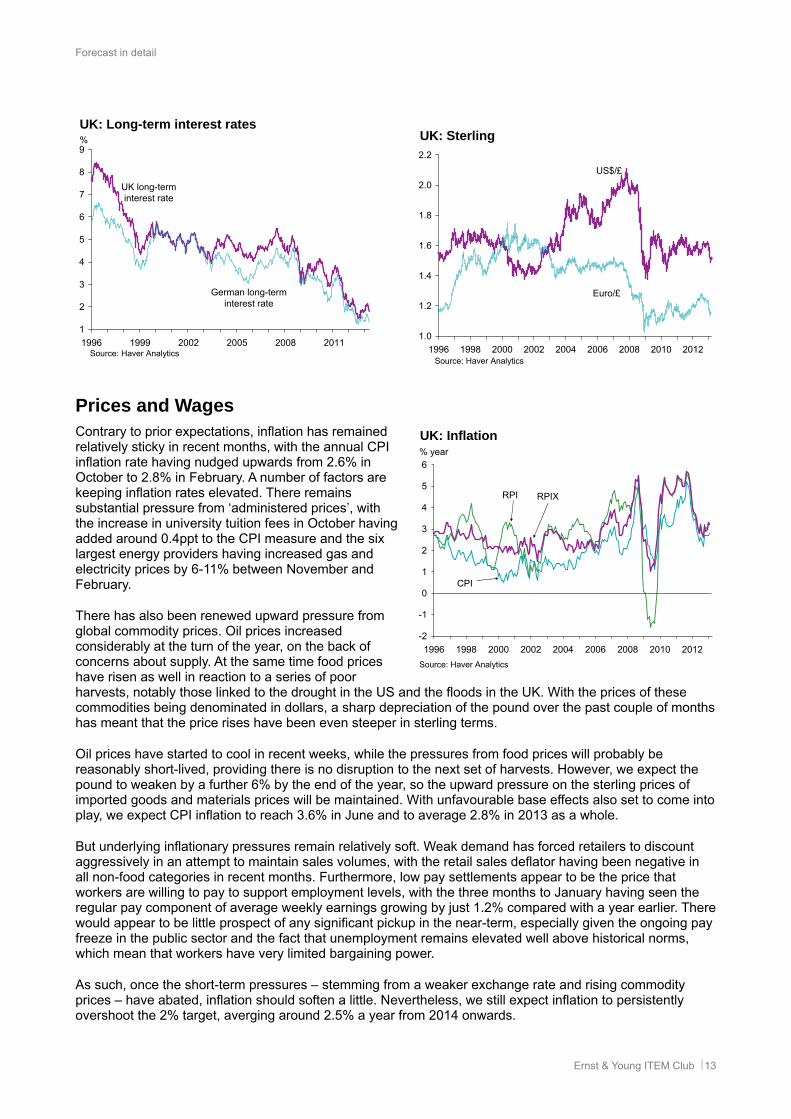
Prices and Wages Contrary to prior expectations, inflation has remained relatively sticky in recent months, with the annual CPI inflation rate having nudged upwards from 2.6% in October to 2.8% in February. A number of factors are keeping inflation rates elevated. There remains substantial pressure from ‘administered prices’, with the increase in university tuition fees in October having added around 0.4ppt to the CPI measure and the six largest energy providers having increased gas and electricity prices by 6-11% between November and February.
There has also been renewed upward pressure from global commodity prices. Oil prices increased considerably at the turn of the year, on the back of concerns about supply. At the same time food prices have risen as well in reaction to a series of poor harvests, notably those linked to the drought in the US and the floods in the UK. With the prices of these commodities being denominated in dollars, a sharp depreciation of the pound over the past couple of months has meant that the price rises have been even steeper in sterling terms.
Oil prices have started to cool in recent weeks, while the pressures from food prices will probably be reasonably short-lived, providing there is no disruption to the next set of harvests. However, we expect the pound to weaken by a further 6% by the end of the year, so the upward pressure on the sterling prices of imported goods and materials prices will be maintained. With unfavourable base effects also set to come into play, we expect CPI inflation to reach 3.6% in June and to average 2.8% in 2013 as a whole.
But underlying inflationary pressures remain relatively soft. Weak demand has forced retailers to discount aggressively in an attempt to maintain sales volumes, with the retail sales deflator having been negative in all non-food categories in recent months. Furthermore, low pay settlements appear to be the price that workers are willing to pay to support employment levels, with the three months to January having seen the regular pay component of average weekly earnings growing by just 1.2% compared with a year earlier. There would appear to be little prospect of any significant pickup in the near-term, especially given the ongoing pay freeze in the public sector and the fact that unemployment remains elevated well above historical norms, which mean that workers have very limited bargaining power.
As such, once the short-term pressures – stemming from a weaker exchange rate and rising commodity prices – have abated, inflation should soften a little. Nevertheless, we still expect inflation to persistently overshoot the 2% target, averging around 2.5% a year from 2014 onwards.
1
2
3
4
5
6
7
8
9
1996 1999 2002 2005 2008 2011Source: Haver Analytics
%
UK long-terminterest rate
German long-terminterest rate
UK: Long-term interest rates
1.0
1.2
1.4
1.6
1.8
2.0
2.2
1996 1998 2000 2002 2004 2006 2008 2010 2012Source: Haver Analytics
Euro/£
UK: Sterling
US$/£
-2
-1
0
1
2
3
4
5
6
1996 1998 2000 2002 2004 2006 2008 2010 2012
Source: Haver Analytics
% year
UK: Inflation
RPI
CPI
RPIX

Forecast in detail
Ernst & Young ITEM Club 14
Activity GDP fell by 0.3% quarter-on-quarter in 2012Q4. However, with the level of GDP in Q3 having been inflated by the inclusion of revenues from ticket sales and TV rights from the Olympic and Paralympic Games, underlying growth was broadly flat in Q4, mirroring the trend in most of 2012. These base effects meant that there was no growth in services output, but construction output rose by 0.8%, the first increase for six quarters. But production output fell by 2.1%, undermined by a collapse in oil production, brought about by rigs being closed for maintenance, and a 1.4% decline in manufacturing output, as poor demand from the Eurozone damaged exports.
High frequency data have been mixed and prospects for Q1 remain weak. Monthly output data for the early part of the quarter points to manufacturing output falling by around 0.6% and construction by 1.0%, but the services sector is on course to grow by about 0.1%. Weighting these forecasts together, and with oil production likely to have rebounded as the rigs reopened, GDP is likely to have been broadly flat in 2013Q1.
But there are grounds for optimism further out. Although inflation is expected to move upwards in the near-term, it is likely to ease considerably from 2013H2. This will provide greater support to household purchasing power, which will be further augmented by April’s large increase in the income tax personal allowance. At the same time companies continue to report healthy finances, with large amounts of cash sitting on the balance sheets of larger firms, and we would expect these funds to increasingly be diverted to investment projects as the economic environment improves. Although export prospects remain hampered by the likelihood of a protracted period of weak Eurozone growth, the outlook elsewhere, led by the US and emerging markets, is beginning to improve. This coupled with the benefits of a weaker pound should underpin a pick-up in export growth.
Therefore we expect momentum to gradually build behind the recovery. After growth of 0.3% in 2012, GDP is expected to increase by 0.6% in 2013, before accelerating to 1.9% in 2014 and 2.5% per annum in 2015-2016.
Consumer Demand Though inflation has continued to run ahead of earnings growth, the gap closed significantly in 2012 and the combination of strong employment growth and the generous uprating of social benefits – by more than 5% – meant that real household disposable income rose by 2.1% in 2012.
This pickup in real incomes was sufficient to kick-start a gradual recovery in household consumption and, with the Olympics providing a further boost, spending rose by 1.2% in 2012. Nevertheless, the pickup in spending lagged behind the strengthening of incomes, leading the savings ratio to average 7.2%, its highest level for fifteen years.
Retail sales data for early 2013 has been very volatile, but after February’s sharp increase it looks likely that the consumer will again contribute positively to growth in Q1.
The remainder of the year is likely to see further steady consumer growth. Household spending power will receive a substantial boost from April with the income tax personal allowance increasing by £1,335 to £9,440, a loosening of fiscal policy which the OBR estimates
-2.5
-2.0
-1.5
-1.0
-0.5
0.0
0.5
1.0
1.5
2.0
2.5
1996 1998 2000 2002 2004 2006 2008 2010 2012Source: Haver Analytics
Household consumption
Retail sales
UK: Consumer spending
-6
-4
-2
0
2
4
6
1990 1993 1996 1999 2002 2005 2008 2011 2014
% year
Forecast
Source: ITEM Club
GDP
Net exports
Domesticdemand
UK: Contributions to GDP growth

Forecast in detail
Ernst & Young ITEM Club 15
will cost the Exchequer almost £4.5bn this year. A gradual strengthening of the wider economic outlook should also support confidence and encourage consumers to reduce their precautionary saving. However, on the flip side, rising food and energy costs, plus a weaker pound, mean that inflation is likely to remain relatively sticky at close to 3% until the second half of the year, while the strong job creation of 2012 is unlikely to be sustained while growth is so weak. These factors will limit the improvement in purchasing power, so consumer spending growth is forecast to again grow by 1.2% this year.
Next year and beyond, inflation is likely to ease and employment growth will accelerate once more, underpinning a further pickup in consumer spending. However, the recovery will be constrained by households looking to continue lowering their debt burden, which currently stands at 144% of disposable income. We expect this to limit consumer spending growth to 2.2% a year from 2014-16, well down on the 3.7% a year it averaged for the decade prior to the financial crisis.
The Housing Market After a weak performance in 2012 as a whole, the housing market is showing initial signs of recovering. In January and February combined, the Halifax and Nationwide indices reported that house prices were up by 1.1% and 0.7% respectively compared to the Q4 average, while the CLG index in January was 0.2% above the Q4 average.
The Bank of England’s (BoE) Funding for Lending (FLS) scheme, which was introduced in August 2012, appears to be a significant factor in the improvement, with it triggering an increase in activity. Though it is still early days, mortgage approvals for home purchase have risen by more than 10% since the scheme was introduced, while gross lending has risen by a similar amount.
The BoE’s Credit Conditions Survey offers further hope that the FLS will be a success. Banks reported that the availability of secured credit to households increased significantly for a third successive quarter in 2013Q1, and a further improvement is expected over the coming three months. With the FLS intended to improve credit supply, the scheme should be nicely complemented by the Government’s latest initiatives to increase housing demand. Under the Help to Buy scheme announced in March’s Budget, the government will provide an equity loan of 20% to anyone wanting to buy a new build house under the value of £600,000. The government will also create a mortgage guarantee for lenders offering mortgages to borrowers with a loan-to-value ratio of 80-95%. These initiatives should help to support demand for mortgages.
But other market fundamentals are likely to provide only weak support. Unemployment is still well above historical norms and is unlikely to fall back over the coming year. And high inflation will continue to limit growth in real household incomes.
We expect the various policy initiatives to generate a modest expansion in lending and a pickup in activity, with transactions set to hit a million this year – this would be the highest level since 2007. This should also be sufficient to generate a steady increase in house prices over the next couple of years, with the CLG measure forecast to rise by 0.2% in 2013 and 2.1% in 2014. Beyond that the recovery should gain greater momentum, as credit availability improves and strengthening incomes and rising employment provide further support.
The Company Sector Data revisions paint the recovery in business investment in a slightly better light than before, with business investment now estimated to have increased by 4.9% in 2012. Nevertheless, it remains more than 13% below its pre-recession peak and the recovery over the past three years has been disappointing given the relative strength of corporate finances. Non-financial corporations ran a surplus of just under 3% of GDP in 2012, a little lower than the preceding three years but still well above historical norms. And with deposits
-40
-30
-20
-10
0
10
20
30
40
50
60
10Q310Q411Q111Q211Q311Q412Q112Q212Q312Q413Q113Q2
UK: Credit spreads surveyBalance increasing (-)/decreasing (+) spreads
Source : Bank of England
*The single datapoints represent 3 month forecasts, while the columns represent actual data
Secured household

Forecast in detail
Ernst & Young ITEM Club 16
equal 46% of GDP – close to record highs and 20ppts higher than ten years ago – companies have a plentiful source of internal funding with which to finance capital spending.
Some smaller firms continue to report problems accessing funding, which is likely to be having some effect. However, larger firms tend to dominate investment spending and they have both high levels of cash holdings and good access to bank finance, so a lack of funding would appear not to be the decisive factor behind low levels of investment. Rather, it appears to be primarily a function of weak confidence, caused by poor growth at home and heighted global uncertainty. The key factor appears to be the Eurozone crisis, with growth in business investment having slowed significantly at times when the sense of crisis has been greatest, such as 2012H2. This uncertainty has led firms to use their cash in other ways, rather than to commit it to lengthy investment projects where the future level of returns is particularly uncertain.
However, many of the big event risks – such as a Eurozone breakup, the US going over the fiscal cliff or China experiencing a hard landing – have receded and the global risks are now more balanced. This has been reflected in a strong rebound in investor sentiment in early 2013 and should be followed by a steady improvement in corporate sentiment. This should encourage firms to release their accumulated cash surpluses for investment projects. The slowdown at the end of 2012 means that business investment growth is likely to be weaker, at around 2.2%, in 2013. But it should accelerate in subsequent years, as confidence continues to strengthen and firms take advantage of low borrowing costs and strong liquidity. Nevertheless, it will be early-2015 before business investment returns to its pre-crisis peak.
The Labour Market The improvement in the labour market has been less marked in recent months than it was the middle of last year. The most recent Labour Force Survey data, for the three months to January, showed the level of employment rising by 131,000 on the quarter, which was just over half the pace of job creation reported in the summer.
Nevertheless, employment is now back above its pre-recession peak, despite the sluggish recovery in GDP. And with the recent rise in employment being driven entirely by an increase in full-time workers, there appears to be underlying strength in the labour market. This has left us with a ‘productivity puzzle’, with both output per worker and output per hour now around 14% lower than they would have been had the pre-recession trend continued.
Understanding the reasons for this slump in productivity is key to assessing future prospects for the labour market. Some of the decline in productivity is likely to be permanent, resulting from the fallout from the financial crisis. Low levels of investment have reduced the pace of innovation and led firms to lengthen replacement cycles. Furthermore, it is likely that bank forbearance has resulted in a misallocation of capital and prevented it from being used for more productive uses.
However, a large part of the decline in productivity is likely to be a result of temporary or cyclical factors as well. We think it likely that the GDP data for the past couple of years will eventually be revised upwards to be more in keeping with other indicators. And firms which have hoarded labour in recent years will not initially need to hire when output recovers. Therefore, as the wider outlook improves there is likely to be some
-40
-30
-20
-10
0
10
20
30
40
1996 1998 2000 2002 2004 2006 2008 2010 2012
Source: BCC
% balanceUK: Investment intentions
Service sector
Manufacturing sector
28.7
28.8
28.9
29.0
29.1
29.2
29.3
29.4
29.5
29.6
29.7
29.8
29.9
2008 2009 2010 2011 2012
1.5
1.7
1.9
2.1
2.3
2.5
2.7
2.9
UK: Labour marketEmployment (000s)
Source : Haver Analytics
Employment(LHS)
Unemployment (000s)
Unemployment(RHS)

Forecast in detail
Ernst & Young ITEM Club 17
payback in the form of weaker private sector job creation. With the size of the workforce continuing to increase, the ILO unemployment rate is forecast to stop falling and stay close to its current level of 7.8% for much of this year.
At just above 1%, annual earnings growth is still very weak. Given the public sector pay freeze and that unemployment is still elevated above historical norms, private sector pay settlements are unlikely to pick up to any great extent. So earnings growth is forecast to remain subdued for a prolonged period.
Trade and the Balance of Payments Net trade wiped 0.9ppts off GDP growth last year, as exports fell back. This was mostly due to the poor performance of services exports, which fell by 2.8% on the back of the continued weakness of the financial services sector. Goods exports performed better, growing by 1.7%, but this masked a wide divergence between exports to the EU, which fell by 3.1%, and exports to non-EU countries, which rose by 6.8%.
Looking ahead, there are more grounds for optimism. Recent indicators suggest that the US and emerging markets are recovering relatively strongly, suggesting that exports to non-EU destinations will continue to grow robustly. And there are signs that the Eurozone is beginning to bottom out, with core countries, such as Germany and France, expected to gain momentum as the year goes on. World trade, weighted by UK export shares, is forecast to grow by 3.2% this year, up from 1.7% in 2012, before accelerating to 5.9% in 2014. The benefits of a weaker pound should also begin to feed through by 2013H2, underpinning a steady acceleration in export growth.
The weak consumer recovery will mean that the pickup in import growth will be relatively slow. As such, we expect net trade to be a much smaller drag on growth this year, reducing GDP growth by just 0.2ppts. With export growth set to accelerate, we expect net trade to be contributing positively to growth by 2015, which should also ensure that the large current account deficit begins to narrow.
-30
-25
-20
-15
-10
-5
0
5
10
15
20
1995 1997 1999 2001 2003 2005 2007 2009 2011 2013Source: Haver Analytics
£ bn
Currentaccount
UK: Current account
Invisibles
Visibles

Ernst & Young LLP
Assurance | Tax | Transaction | Advisory
www.ey.com/uk
About Ernst & Young
Ernst & Young is a global leader in assurance, tax, transaction and advisory services. Worldwide, our 167,000 people are united by our shared values and an unwavering commitment to quality. We make a difference by helping our people, our clients and our wider communities achieve their potential.
Ernst & Young refers to the global organization of member firms of Ernst & Young Global Limited, each of which is a separate legal entity. Ernst & Young Global Limited, a UK company limited by guarantee, does not provide services to clients. For more information about our organization, please visit www.ey.com
About ITEM Club
The ITEM Club is the only non-governmental economic forecasting group to use the HM Treasury’s model of the UK economy. ITEM stands for Independent Treasury Economic Model. HM Treasury uses the UK Treasury model for its UK policy analysis and Industry Act forecasts for the Budget. ITEM’s use of the model enables it to explore the implications and unpublished assumptions behind Government forecasts and policy measures.
Uniquely, ITEM can test whether Government claims are consistent and can assess which forecasts are credible and which are not. Its forecasts are independent of any political, economic or business bias.
The UK firm Ernst & Young is a limited liability partnership registered in England and Wales with Registered number OC300001 and is a member firm of Ernst & Young Global Limited
Ernst & Young LLP, 1 More London Place, London, SE1 2AF.
© ITEM Club Limited. 2013. Published in the UK. All Rights Reserved.
All views expressed in ITEM Club Spring 2013 Forecast are those of ITEM Club Limited and may or may not be those of Ernst & Young LLP. Information in this publication is intended to provide only a general outline of the subjects covered. It should neither be regarded as comprehensive or sufficient for making decisions, nor should it be used in place of professional advice. Neither the ITEM Club Limited, Ernst & Young LLP nor the Ernst & Young ITEM Club accepts any responsibility for any loss arising from any action taken or not taken by anyone using this material. If you wish to discuss any aspect of the content of this newsletter, please talk to your usual Ernst & Young contact.
This document may not be disclosed to any third party without Ernst & Young’s prior written consent.
Reproduced with permission from ITEM Club Limited