erode 638052, tamilnadu, india received: 27 january 2020
TRANSCRIPT
energies
Article
Solar PV Sustained Quasi Z-Source Network-BasedUnified Power Quality Conditioner for Enhancementof Power Quality
K. Muthuvel 1,* and M. Vijayakumar 2
1 Department of Electrical and Electronics Engineering, Nandha College of Technology, Perundurai,Erode 638052, Tamilnadu, India
2 Department of Electrical and Electronics Engineering, K.S.R. College of Engineering, Tiruchengode,Namakkal 637215, Tamilnadu, India; [email protected]
* Correspondence: [email protected]
Received: 27 January 2020; Accepted: 23 March 2020; Published: 24 May 2020
Abstract: In this article, a Quasi Z-source inverter (QZSI)-based unified power quality conditioner(UPQC) backed by the solar photovoltaic (SPV) is presented in order to enhance power quality.The UPQC consists of converters connected in parallel and series. The active power filters (APFs)connected in parallel and series is one of the versatile custom power circuitries to reduce current andvoltage instabilities. The main functions of QZSI can increase the variable direct current (DC) voltageto any given alternating current (AC) output voltage, reduce the necessary elements, and alleviateharmonic content. The UPQC’s compensation function primarily relies on the control system used forthe generation of reference current and voltage. The enhanced second order generalized integrator(ESOGI) is used in this proposed system to extract the reference current of QZSI-UPQC. The proposedUPQC uses the SPV system, which has an energy storage unit to offset long-term current and voltagedisruptions and fulfill the active power demands of the grid. The experimental results confirm thatthe proposed SPV-supported QZSI-UPQC generates sinusoidal grid currents of about 1.2% of totalharmonic distortion (THD), thus increasing the power efficiency of the interconnected SPV powerdistribution network.
Keywords: solar photovoltaic system; quasi Z-source; second order generalized integrator; unifiedpower quality conditioner; voltage source inverter; total harmonic distortion
1. Introduction
As non-linear electrical loads are used more frequently, the power quality impacts are increasing.The power quality issues are increasing, which have great implications for industrial and domesticconsumers. These problems of power quality encountered by customers include harmonic distortions,the inaccuracy of the measuring scheme, improper operation of protective relays, and circuit breakersand heating of the transformer winding. Active filters are power-conditioning circuits integratedwith controlled direct current/alternating current (DC/AC) converters [1,2]. The efficiency of thepower-conditioning circuits depends primarily on the control system that has been implemented.The most important cost-effective parts for custom power devices are sensors and electronic controllers.The source, load, and compensation current information are essential in order to achieve the shuntactive power filter (APF) reference signal. In addition, the measurement of the source voltage iscrucial to estimate the harmonic power taken by the load. The source voltage data are needed toperform reactive power and harmonic compensation, which extends control system complexity [3–8].The proportional integral (PI) controller is also used in the shunt APF as a DC-link voltage controller
Energies 2020, 13, 2657; doi:10.3390/en13102657 www.mdpi.com/journal/energies
Energies 2020, 13, 2657 2 of 26
to maintain specified levels of voltage. This DC voltage control system for the DC-link requiresvoltage sensors to obtain information about the voltage. Energy storage units, such as condensersand batteries, are used to manage the load when a tension and disturbance emerges [9–11]. The useof these energy storage units restricts the unified power quality conditioner’s (UPQC’s) ability tocompensate because energy storage capacities are limited. The performance of the active filtersdepends primarily on the reference signal production pattern, while errors in the reference signal leadto inappropriate compensation. Various control algorithms have been used for the UPQC referencecurrent and voltage determination [12–15]. The shunt active power filter is used mainly to connect therenewable energy generation system to the power grid [16]. Demand for renewable energy has becomeextremely important because of the shortage of non-renewable energies, such as fossil fuels and nuclearfuels. The conventional energy sources have disappeared globally to an enormous extent, since theseresources have long been used. The impact of the climate and the scarcity of the non-renewable energysupply motivate scientists to envision the generation of energy via renewable energies, such as solar,wind, biogas, hydro, and more. In isolated areas, probable energy generation may be accessible toease the access to alternative energy sources in the locality. The single-stage solar photovoltaic (SPV)systems linked to the grid are currently trustworthy for their topology and high effectiveness [17].
The complication of the control system of the shunt APF has recently been increased because ofthe need for the sensors and the addition of calculations to obtain a current signal reference [18]. Inaddition, due to the lack of energy storage ability of the DC-link, the conventional shunt APF limits incompensation capacity. The aim of this article is to offer cost-efficient long-term current and voltagedisturbance compensation in the industrial and domestic consumer loads by a voltage sensor-lessPV-shunt APF. The Quasi Z-source inverter (QZSI) can convert the DC voltage from a solar cell tothe desired AC voltage [19,20]. QZSI’s features make high quality power output, terrific capabilityto boost bucks, remove the dead tie, and allow the shoot through state. By introducing a shootthrough operating mode, the QZSI can improve the output voltage. In order to fulfil UPQC DC-linkvoltage requirements, the suggested topology uses the renewable energy source with electricity storage.The control system for the shunt inverter relies on the use of enhanced second order generalizedintegrator (ESOGI) to estimate the current signal reference. There is no need for a proportional integral(PI) regulator for the shunt inverter control algorithm, and there is no need for more calculationsfor determining the energy consumption of the loads. The SPV-UPQC system is used for measuringload and inverter currents by simply two current sensors. The ESOGI control scheme makes simplecontrol loops involving two analogue inputs for the field-programmable gate array (FPGA) XC6SLX25and the three-phase pulse width modulation (PWM) output for QZSI switches. Most compensationdevices are designed to reduce power quality disruptions in the supply system, and the PV power isnot transmitted into the load. The literature review shows that less effort has been made in connectionwith the UPQC integration of the SPV system and no attempts have begun to combine a UPQC witha battery-operated QZ source network. In this article, a UPQC-integrated photovoltaic system withbattery provides energy saving and compensation for current and voltage distortions.
The UPQC supported by the proposed SPV and battery provides a long-term compensation for thecurrent and voltage disturbances by using the simplified control system for three-phase electric powerdistribution systems. The solar PV interfaced QZSI-UPQC with the enhanced second order generalizedintegrator (SOGI) control scheme is equipped with the following salient features. The enhancedSOGI control algorithm has good filtering capabilities, improved stable states, and adaptive responsecapabilities and has less difficulty in implementation. This control scheme has fast transient responsesand it maintains the voltage and current profile under a dynamic condition of source and loads.The SPV-interfaced QZSI operated as UPQC avoids the need of cascaded DC-DC converters, whichare used in the conventional UPQC. In the proposed system, QZSI is utilized to boost the outputvoltage of the SPV array to compensate the long-term voltage and current disturbances in the powerdistribution system. Multi-mode working ability; when SPV irradiation is 0, the system performs thefunctions of UPQC, i.e., harmonics mitigation, power factor correction, load balancing, etc., and when

Energies 2020, 13, 2657 3 of 26
SPV insolation shows up, the system acts as an SPV-shunt APF; thus, it accomplishes both functions ofactive power transfer and power quality improvement. Even in a severe fault condition, QZSI-UPQCstabilizes the voltage of the utility grid and maintains the power required for the load.
The experimental outcomes are provided to confirm the effectiveness of the suggested controlsystem and QZSI-UPQC topology backed by the SPV. The rest of the paper will be structured asfollows. The next section discusses the topology of the Z-source network-based UPQC. Section 3explains SPV-UPQC’s control scheme. Section 4 presents and discusses the experimental validation,in which the ESOGI control scheme is used. The last section includes the concluding remarks of thisQZSI-UPQC, supported by the SPV with the ESOGI control scheme for grid interconnection andenhancement of power quality.
2. QZ-source Network-Based UPQC Topology
The QZ-source-based UPQC circuit backed by the SPV is illustrated in Figure 1. The three-phasegrid connected to the SPV-UPQC system supplied both linear and nonlinear loads for consumers.A 3-leg QZSI was connected parallel to the consumer load via the interfacing inductor. The SPVpower generator supplied DC to the QZ-source network, which was used to sustain the DC linkvoltage. The SPV power generation system included the SPV panel, a DC-DC boost converter, anda battery bank. In order to maintain the UPF DC-link voltage, the QZ source network was used.The excess power generation of the SPV power generation scheme could be transported via a DC-DCconversion to an energy storage unit and started supplying battery-stored energy once an SPV systemwas not powerful enough. An uncontrolled rectifier with a resistor and inductor were connected as anon-linear load in the load point. A current transformer was used for measuring the current from thenonlinear load.
Energies 2020, 13, x FOR PEER REVIEW 3 of 26
severe fault condition, QZSI-UPQC stabilizes the voltage of the utility grid and maintains the power required for the load.
The experimental outcomes are provided to confirm the effectiveness of the suggested control system and QZSI-UPQC topology backed by the SPV. The rest of the paper will be structured as follows. The next section discusses the topology of the Z-source network-based UPQC. Section 3 explains SPV-UPQC's control scheme. Section 4 presents and discusses the experimental validation, in which the ESOGI control scheme is used. The last section includes the concluding remarks of this QZSI-UPQC, supported by the SPV with the ESOGI control scheme for grid interconnection and enhancement of power quality.
2. QZ-source Network-Based UPQC Topology
The QZ-source-based UPQC circuit backed by the SPV is illustrated in Figure 1. The three-phase grid connected to the SPV-UPQC system supplied both linear and nonlinear loads for consumers. A 3-leg QZSI was connected parallel to the consumer load via the interfacing inductor. The SPV power generator supplied DC to the QZ-source network, which was used to sustain the DC link voltage. The SPV power generation system included the SPV panel, a DC-DC boost converter, and a battery bank. In order to maintain the UPF DC-link voltage, the QZ source network was used. The excess power generation of the SPV power generation scheme could be transported via a DC-DC conversion to an energy storage unit and started supplying battery-stored energy once an SPV system was not powerful enough. An uncontrolled rectifier with a resistor and inductor were connected as a non-linear load in the load point. A current transformer was used for measuring the current from the nonlinear load.
Figure 1. Proposed solar photovoltaic-supported unified power quality conditioner topology.
A solar photovoltaic (SPV) array, boost DC-DC converter, and battery storage unit were included in the presented SPV power generating unit. A maximum power point tracking (MPPT) function was developed for the DC-DC boost converter to reach the maximum power during the solar reduction period [21–23]. Three modes of operation were used in the suggested PV interfaced
Figure 1. Proposed solar photovoltaic-supported unified power quality conditioner topology.
A solar photovoltaic (SPV) array, boost DC-DC converter, and battery storage unit were includedin the presented SPV power generating unit. A maximum power point tracking (MPPT) function wasdeveloped for the DC-DC boost converter to reach the maximum power during the solar reduction
Energies 2020, 13, 2657 4 of 26
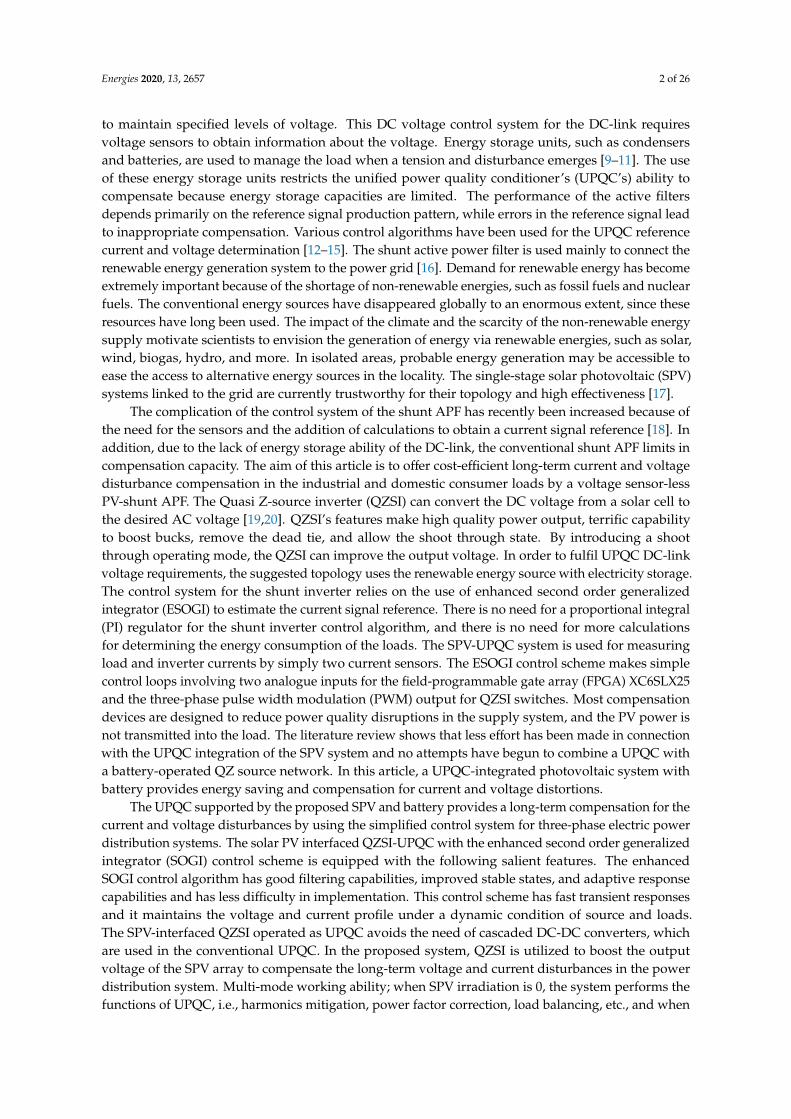
period [21–23]. Three modes of operation were used in the suggested PV interfaced UPQC. The modeswere (1) the mode of generation of PV power; (2) the mode of battery backup; and (3) the mode ofcontinuous supply.
(1) Mode of generation of PV power
The mode of photovoltaic generation of power was activated during the day or when solarirradiation was much more accessible to produce enough energy. The SPV-sustained UPQC was usedas harmonics and a reactive power compensator and surplus power was stored via a battery. Figure 2shows the current flow diagram for the mode of generation of PV power.
Energies 2020, 13, x FOR PEER REVIEW 4 of 26
UPQC. The modes were (1) the mode of generation of PV power; (2) the mode of battery backup; and (3) the mode of continuous supply. (1) Mode of generation of PV power
The mode of photovoltaic generation of power was activated during the day or when solar irradiation was much more accessible to produce enough energy. The SPV-sustained UPQC was used as harmonics and a reactive power compensator and surplus power was stored via a battery. Figure 2 shows the current flow diagram for the mode of generation of PV power.
Figure 2. Current flow diagram for the mode of generation of solar photovoltaic power.
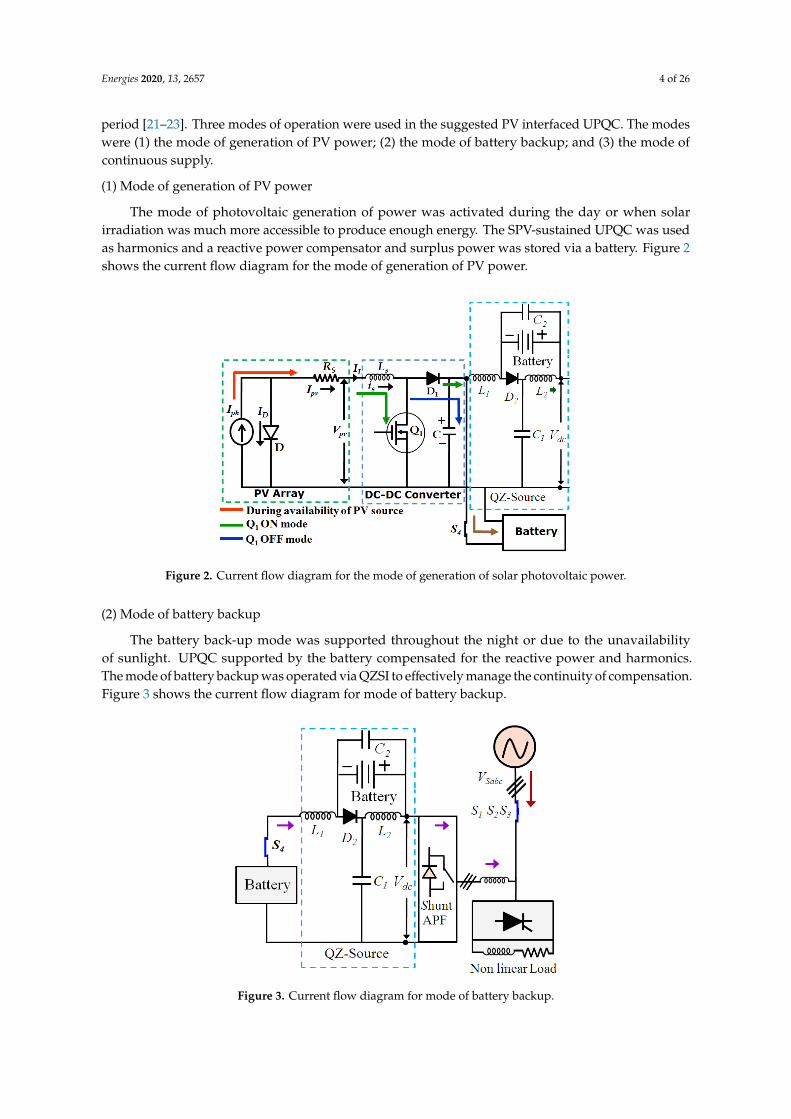
(2) Mode of battery backup The battery back-up mode was supported throughout the night or due to the unavailability of
sunlight. UPQC supported by the battery compensated for the reactive power and harmonics. The mode of battery backup was operated via QZSI to effectively manage the continuity of compensation. Figure 3 shows the current flow diagram for mode of battery backup.
Figure 3. Current flow diagram for mode of battery backup.
(3) Mode of continuous supply The scheme of SPV-UPQC offers uninterrupted supply to critical/delicate loads during the
voltage interruption period. In such circumstances, the power supply to the connected load was provided either by the SPV power generating system or by a battery. The power supply source of the
Figure 2. Current flow diagram for the mode of generation of solar photovoltaic power.
(2) Mode of battery backup
The battery back-up mode was supported throughout the night or due to the unavailabilityof sunlight. UPQC supported by the battery compensated for the reactive power and harmonics.The mode of battery backup was operated via QZSI to effectively manage the continuity of compensation.Figure 3 shows the current flow diagram for mode of battery backup.
Energies 2020, 13, x FOR PEER REVIEW 4 of 26
UPQC. The modes were (1) the mode of generation of PV power; (2) the mode of battery backup; and (3) the mode of continuous supply. (1) Mode of generation of PV power
The mode of photovoltaic generation of power was activated during the day or when solar irradiation was much more accessible to produce enough energy. The SPV-sustained UPQC was used as harmonics and a reactive power compensator and surplus power was stored via a battery. Figure 2 shows the current flow diagram for the mode of generation of PV power.
Figure 2. Current flow diagram for the mode of generation of solar photovoltaic power.
(2) Mode of battery backup The battery back-up mode was supported throughout the night or due to the unavailability of
sunlight. UPQC supported by the battery compensated for the reactive power and harmonics. The mode of battery backup was operated via QZSI to effectively manage the continuity of compensation. Figure 3 shows the current flow diagram for mode of battery backup.
Figure 3. Current flow diagram for mode of battery backup.
(3) Mode of continuous supply The scheme of SPV-UPQC offers uninterrupted supply to critical/delicate loads during the
voltage interruption period. In such circumstances, the power supply to the connected load was provided either by the SPV power generating system or by a battery. The power supply source of the
Figure 3. Current flow diagram for mode of battery backup.
Energies 2020, 13, 2657 5 of 26
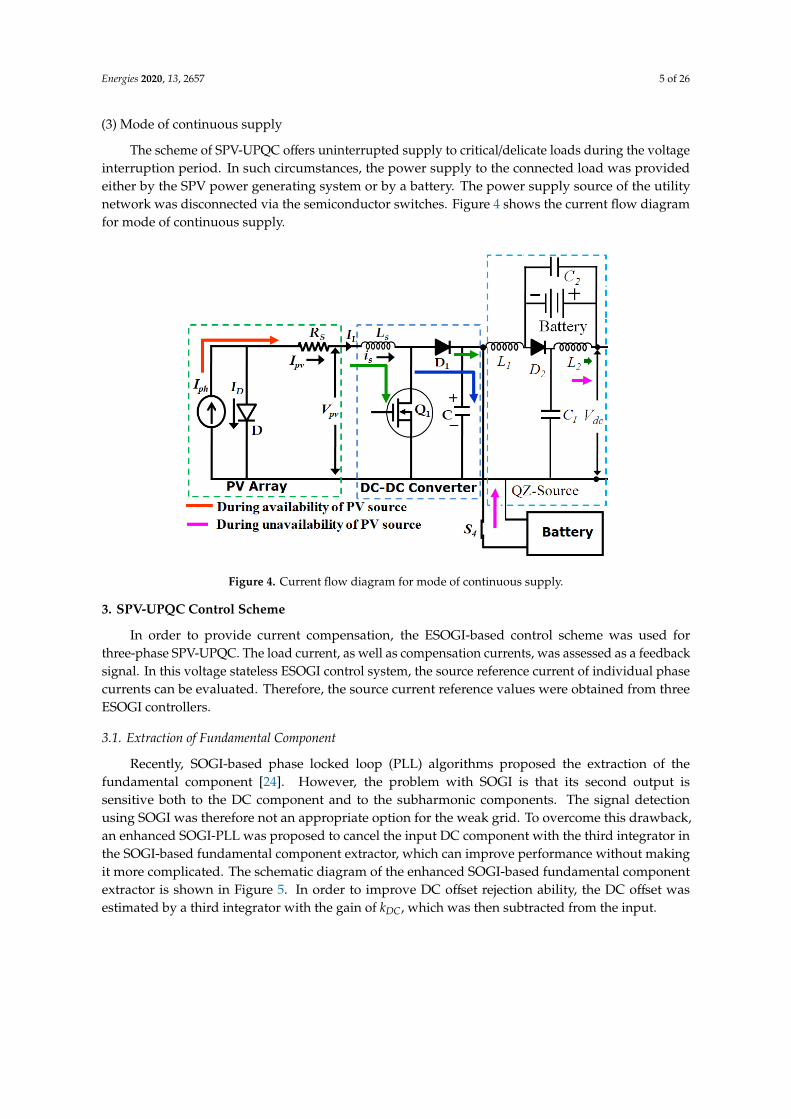
(3) Mode of continuous supply
The scheme of SPV-UPQC offers uninterrupted supply to critical/delicate loads during the voltageinterruption period. In such circumstances, the power supply to the connected load was providedeither by the SPV power generating system or by a battery. The power supply source of the utilitynetwork was disconnected via the semiconductor switches. Figure 4 shows the current flow diagramfor mode of continuous supply.
Energies 2020, 13, x FOR PEER REVIEW 5 of 26
utility network was disconnected via the semiconductor switches. Figure 4 shows the current flow diagram for mode of continuous supply.
Figure 4. Current flow diagram for mode of continuous supply.
3. SPV-UPQC Control Scheme
In order to provide current compensation, the ESOGI-based control scheme was used for three-phase SPV-UPQC. The load current, as well as compensation currents, was assessed as a feedback signal. In this voltage stateless ESOGI control system, the source reference current of individual phase currents can be evaluated. Therefore, the source current reference values were obtained from three ESOGI controllers.
3.1. Extraction of Fundamental Component
Recently, SOGI-based phase locked loop (PLL) algorithms proposed the extraction of the fundamental component [24]. However, the problem with SOGI is that its second output is sensitive both to the DC component and to the subharmonic components. The signal detection using SOGI was therefore not an appropriate option for the weak grid. To overcome this drawback, an enhanced SOGI-PLL was proposed to cancel the input DC component with the third integrator in the SOGI-based fundamental component extractor, which can improve performance without making it more complicated. The schematic diagram of the enhanced SOGI-based fundamental component extractor is shown in Figure 5. In order to improve DC offset rejection ability, the DC offset was estimated by a third integrator with the gain of 𝑘 , which was then subtracted from the input.
The enhanced SOGI transfer function was obtained by Equations (1), (2), and (3) [24].
ω
ω ω ω=
+ + + +
2
3 2 2 3
)
(
( ) ( )
DC
DC
dabc
sabc
s
s k s s
v kV k
ss k (1)
ωω ω ω
=+ + + +
2
3 2 2 3)
(
( )
( )
DC
DC
qabc
Sabc
k
k
s
s k s s k
v s
V s (2)
ω ωω ω ω
=+
+ + + +
2 2
3 2 2 3
)
( )
(
))
( (
DCDC
DCSabc
k
k
V sV
s
s k s s ks (3)
Figure 4. Current flow diagram for mode of continuous supply.
3. SPV-UPQC Control Scheme
In order to provide current compensation, the ESOGI-based control scheme was used forthree-phase SPV-UPQC. The load current, as well as compensation currents, was assessed as a feedbacksignal. In this voltage stateless ESOGI control system, the source reference current of individual phasecurrents can be evaluated. Therefore, the source current reference values were obtained from threeESOGI controllers.
3.1. Extraction of Fundamental Component
Recently, SOGI-based phase locked loop (PLL) algorithms proposed the extraction of thefundamental component [24]. However, the problem with SOGI is that its second output issensitive both to the DC component and to the subharmonic components. The signal detectionusing SOGI was therefore not an appropriate option for the weak grid. To overcome this drawback,an enhanced SOGI-PLL was proposed to cancel the input DC component with the third integrator inthe SOGI-based fundamental component extractor, which can improve performance without makingit more complicated. The schematic diagram of the enhanced SOGI-based fundamental componentextractor is shown in Figure 5. In order to improve DC offset rejection ability, the DC offset wasestimated by a third integrator with the gain of kDC, which was then subtracted from the input.

Energies 2020, 13, 2657 6 of 26
Energies 2020, 13, x FOR PEER REVIEW 6 of 26
where 𝑉 is estimated as the DC term, 𝑉 represents the source voltage (V), 𝑘 is a gain in the DC offset approximation channel, ω is the resonant frequency (rad/s), k represents the damping coefficient, 𝑣 represents the d-axis component, 𝑣 represents the q-axis component, and k represents the damping coefficient. The optimal parameters are k = 1.414 and 𝑘 = 0.4.
Figure 5. Schematic diagram of enhanced second order generalized integrator (SOGI)-based fundamental component extractor.
3.2. Estimation Source Reference Current for Shunt APFs
Figure 5. Schematic diagram of enhanced second order generalized integrator (SOGI)-basedfundamental component extractor.

Energies 2020, 13, 2657 7 of 26
The enhanced SOGI transfer function was obtained by Equations (1)–(3) [24]
vdabc (s)Vsabc (s)
=kDC ω s2
s3 + (k + kDC) ω s2 +ω2s + k ω3 (1)
vqabc(s)
VSabc(s)=
kDC ω2 s
s3 + (k + kDC) ω s2 +ω2 s + k ω3 (2)
VDC(s)VSabc(s)
=kDC ω (s2 +ω2)
s3 + (k + kDC) ω s2 +ω2s + k ω3 (3)
where VDC is estimated as the DC term, VSabc represents the source voltage (V), kDC is a gain in the DCoffset approximation channel, ω is the resonant frequency (rad/s), k represents the damping coefficient,vd represents the d-axis component, vq represents the q-axis component, and k represents the dampingcoefficient. The optimal parameters are k = 1.414 and kDC = 0.4.
3.2. Estimation Source Reference Current for Shunt APFs
Figure 6 depicts the block diagram of the ESOGI-based control algorithm for SPV-UPQC.The current reference signal was used to prevent harmonic distortions and to balance the system’sreactive power. Because the nonlinear load was connected to the network, a non-sinusoidal loadcurrent passed through the impedance of the device and generated distorted voltages at the point ofcommon coupling.
Energies 2020, 13, x FOR PEER REVIEW 7 of 26
Figure 6 depicts the block diagram of the ESOGI-based control algorithm for SPV-UPQC. The current reference signal was used to prevent harmonic distortions and to balance the system's reactive power. Because the nonlinear load was connected to the network, a non-sinusoidal load current passed through the impedance of the device and generated distorted voltages at the point of common coupling.
Figure 6. Block diagram of the enhanced SOGI based control algorithm for the solar photovoltaic-unified power quality conditioner.
The instantaneous load current is stated in Equations (10), (11), and (12) [25].
φ φ∞
== − − 1 1
2sin ( )+ sin (n )Lan anLa La a
ni I wt I wt (4)
φ φ∞
=
= − − 1 12
sin ( )+ sin (n )LbnLb Lb b bnn
i I wt I wt (5)
φ φ∞
=
= − − 1 12
sin ( )+ sin (n )Lcn cnLc Lc cn
i I wt I wt (6)
In Equations (7), (8), and (9), after compensation, the fundamental real components of the source current are calculated.
φ= 11 cos sam aLaI I (7)
Figure 6. Block diagram of the enhanced SOGI based control algorithm for the solar photovoltaic-unifiedpower quality conditioner.
Energies 2020, 13, 2657 8 of 26
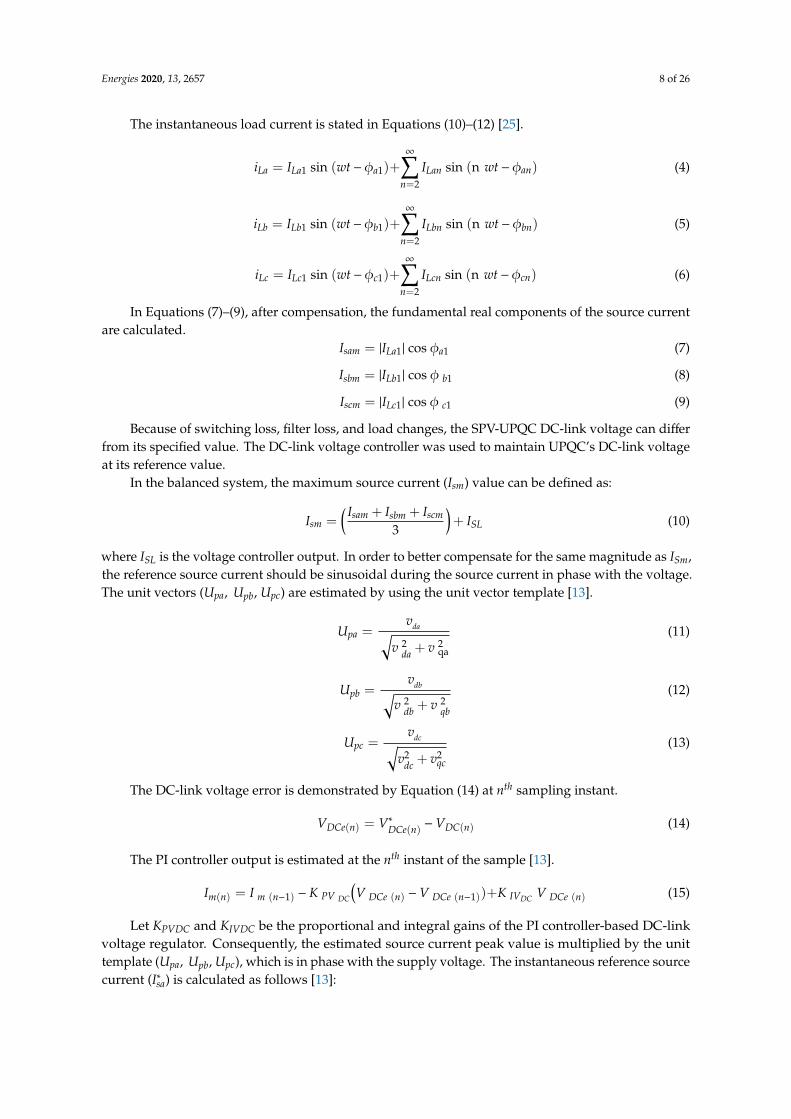
The instantaneous load current is stated in Equations (10)–(12) [25].
iLa = ILa1 sin (wt−φa1)+∞∑
n=2
ILan sin (n wt−φan) (4)
iLb = ILb1 sin (wt−φb1)+∞∑
n=2
ILbn sin (n wt−φbn) (5)
iLc = ILc1 sin (wt−φc1)+∞∑
n=2
ILcn sin (n wt−φcn) (6)
In Equations (7)–(9), after compensation, the fundamental real components of the source currentare calculated.
Isam = |ILa1| cos φa1 (7)
Isbm = |ILb1| cos φ b1 (8)
Iscm = |ILc1| cos φ c1 (9)
Because of switching loss, filter loss, and load changes, the SPV-UPQC DC-link voltage can differfrom its specified value. The DC-link voltage controller was used to maintain UPQC’s DC-link voltageat its reference value.
In the balanced system, the maximum source current (Ism) value can be defined as:
Ism =( Isam + Isbm + Iscm
3
)+ ISL (10)
where ISL is the voltage controller output. In order to better compensate for the same magnitude as ISm,the reference source current should be sinusoidal during the source current in phase with the voltage.The unit vectors (Upa, Upb, Upc) are estimated by using the unit vector template [13].
Upa =vda√
v 2da + v 2
qa
(11)
Upb =vdb√
v 2db + v 2
qb
(12)
Upc =vdc√
v2dc + v2
qc
(13)
The DC-link voltage error is demonstrated by Equation (14) at nth sampling instant.
VDCe(n) = V∗DCe(n) −VDC(n) (14)
The PI controller output is estimated at the nth instant of the sample [13].
Im(n) = I m (n−1) −K PV DC
(V DCe (n) −V DCe (n−1))+K IVDC V DCe (n) (15)
Let KPVDC and KIVDC be the proportional and integral gains of the PI controller-based DC-linkvoltage regulator. Consequently, the estimated source current peak value is multiplied by the unittemplate (Upa, Upb, Upc), which is in phase with the supply voltage. The instantaneous reference sourcecurrent (I∗sa) is calculated as follows [13]:
Energies 2020, 13, 2657 9 of 26
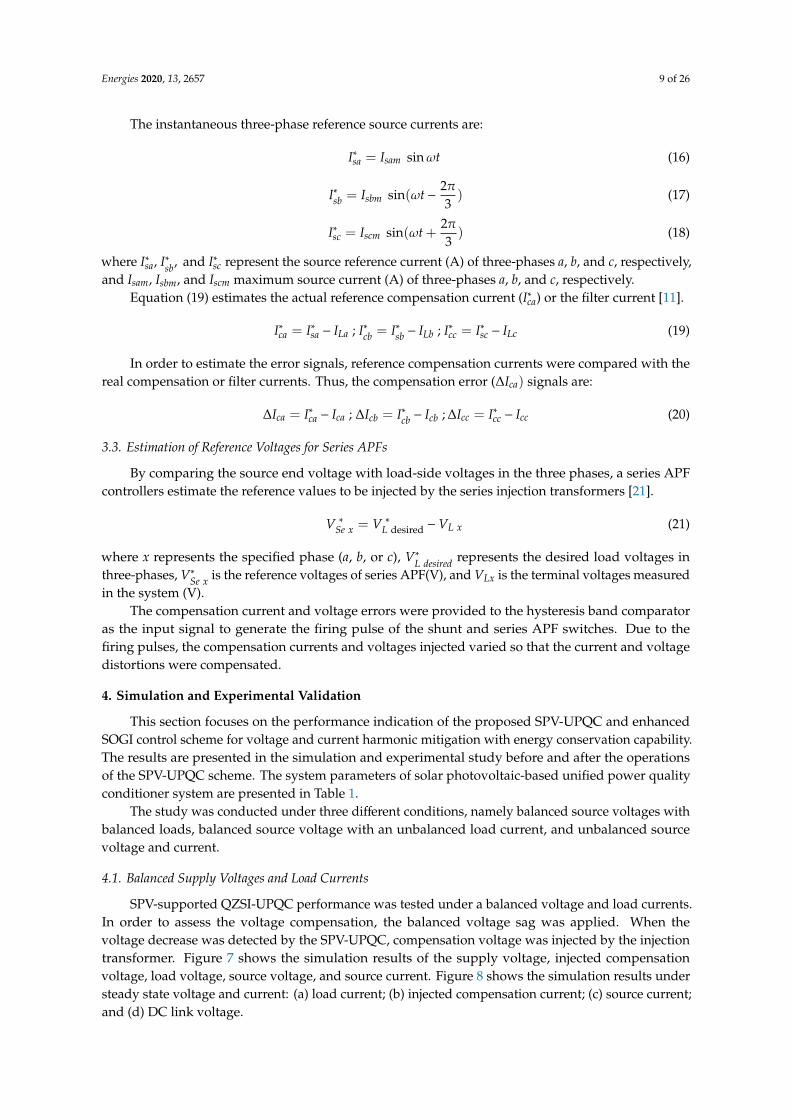
The instantaneous three-phase reference source currents are:
I∗sa = Isam sinωt (16)
I∗sb = Isbm sin(ωt−2π3) (17)
I∗sc = Iscm sin(ωt +2π3) (18)
where I∗sa, I∗sb, and I∗sc represent the source reference current (A) of three-phases a, b, and c, respectively,and Isam, Isbm, and Iscm maximum source current (A) of three-phases a, b, and c, respectively.
Equation (19) estimates the actual reference compensation current (I∗ca) or the filter current [11].
I∗ca = I∗sa − ILa ; I∗cb = I∗sb − ILb ; I∗cc = I∗sc − ILc (19)
In order to estimate the error signals, reference compensation currents were compared with thereal compensation or filter currents. Thus, the compensation error (∆Ica) signals are:
∆Ica = I∗ca − Ica ; ∆Icb = I∗cb − Icb ; ∆Icc = I∗cc − Icc (20)
3.3. Estimation of Reference Voltages for Series APFs
By comparing the source end voltage with load-side voltages in the three phases, a series APFcontrollers estimate the reference values to be injected by the series injection transformers [21].
V ∗Se x = V ∗L desired −VL x (21)
where x represents the specified phase (a, b, or c), V∗L desired represents the desired load voltages inthree-phases, V∗Se x is the reference voltages of series APF(V), and VLx is the terminal voltages measuredin the system (V).
The compensation current and voltage errors were provided to the hysteresis band comparatoras the input signal to generate the firing pulse of the shunt and series APF switches. Due to thefiring pulses, the compensation currents and voltages injected varied so that the current and voltagedistortions were compensated.
4. Simulation and Experimental Validation
This section focuses on the performance indication of the proposed SPV-UPQC and enhancedSOGI control scheme for voltage and current harmonic mitigation with energy conservation capability.The results are presented in the simulation and experimental study before and after the operationsof the SPV-UPQC scheme. The system parameters of solar photovoltaic-based unified power qualityconditioner system are presented in Table 1.
The study was conducted under three different conditions, namely balanced source voltages withbalanced loads, balanced source voltage with an unbalanced load current, and unbalanced sourcevoltage and current.
4.1. Balanced Supply Voltages and Load Currents
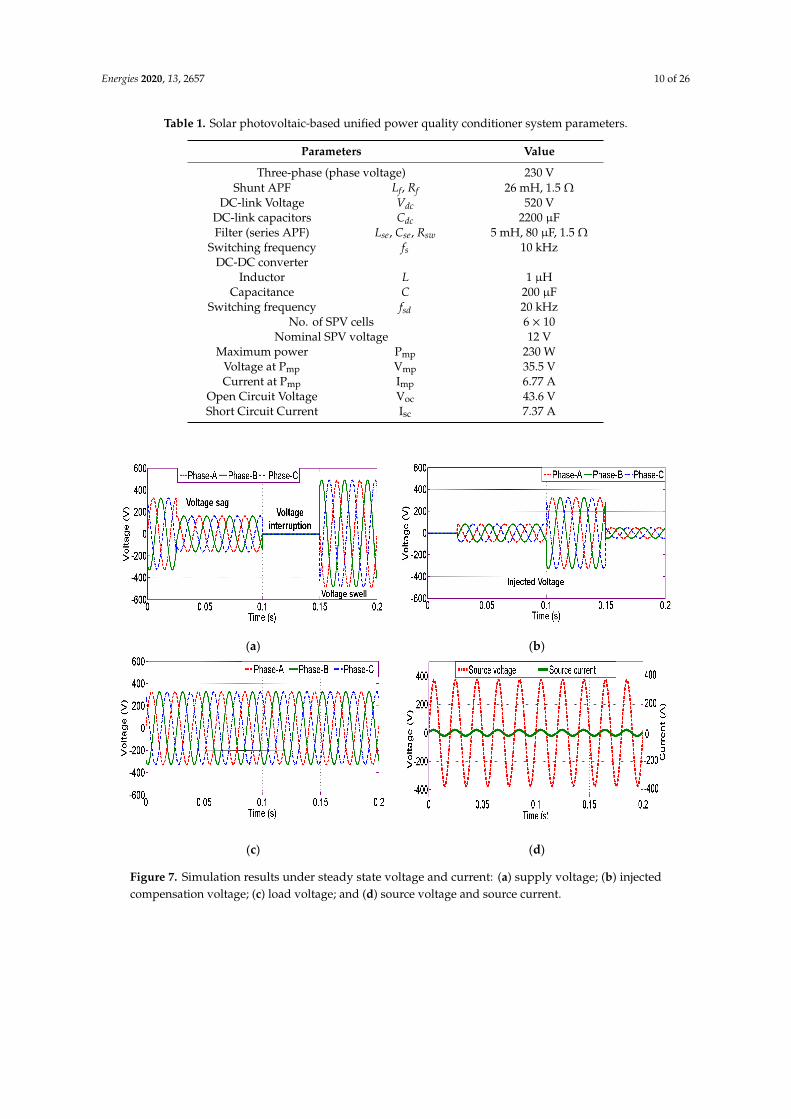
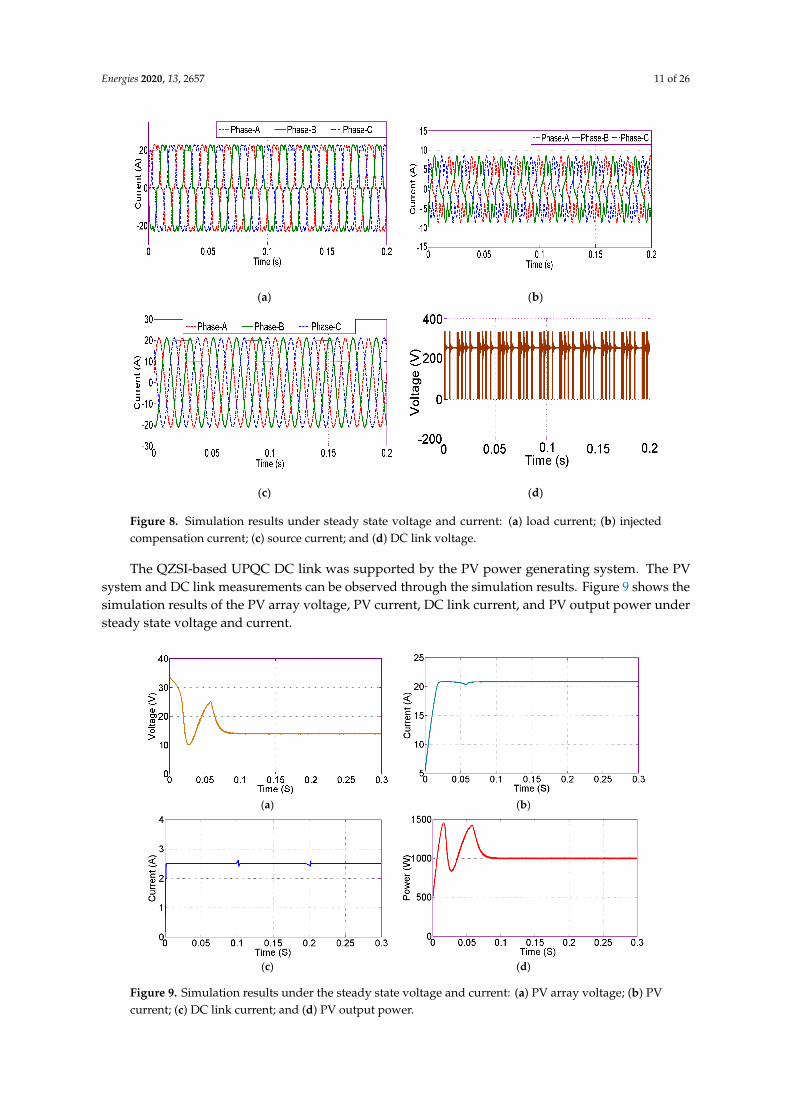
SPV-supported QZSI-UPQC performance was tested under a balanced voltage and load currents.In order to assess the voltage compensation, the balanced voltage sag was applied. When thevoltage decrease was detected by the SPV-UPQC, compensation voltage was injected by the injectiontransformer. Figure 7 shows the simulation results of the supply voltage, injected compensationvoltage, load voltage, source voltage, and source current. Figure 8 shows the simulation results understeady state voltage and current: (a) load current; (b) injected compensation current; (c) source current;and (d) DC link voltage.
Energies 2020, 13, 2657 10 of 26
Table 1. Solar photovoltaic-based unified power quality conditioner system parameters.
Parameters Value
Three-phase (phase voltage) 230 VShunt APF Lf, Rf 26 mH, 1.5 Ω
DC-link Voltage Vdc 520 VDC-link capacitors Cdc 2200 µFFilter (series APF) Lse, Cse, Rsw 5 mH, 80 µF, 1.5 Ω
Switching frequency fs 10 kHzDC-DC converter
Inductor L 1 µHCapacitance C 200 µF
Switching frequency fsd 20 kHzNo. of SPV cells 6 × 10
Nominal SPV voltage 12 VMaximum power Pmp 230 W
Voltage at Pmp Vmp 35.5 VCurrent at Pmp Imp 6.77 A
Open Circuit Voltage Voc 43.6 VShort Circuit Current Isc 7.37 A
Energies 2020, 13, x FOR PEER REVIEW 10 of 26
No. of SPV cells 6 × 10 Nominal SPV voltage 12 V
Maximum power Pmp 230 W Voltage at Pmp Vmp 35.5 V Current at Pmp Imp 6.77 A
Open Circuit Voltage Voc 43.6 V Short Circuit Current Isc 7.37 A
The study was conducted under three different conditions, namely balanced source voltages with balanced loads, balanced source voltage with an unbalanced load current, and unbalanced source voltage and current.
4.1. Balanced Supply Voltages and Load Currents
SPV-supported QZSI-UPQC performance was tested under a balanced voltage and load currents. In order to assess the voltage compensation, the balanced voltage sag was applied. When the voltage decrease was detected by the SPV-UPQC, compensation voltage was injected by the injection transformer. Figure 7 shows the simulation results of the supply voltage, injected compensation voltage, load voltage, source voltage, and source current. Figure 8 shows the simulation results under steady state voltage and current: (a) load current; (b) injected compensation current; (c) source current; and (d) DC link voltage.
(a) (b)
(c) (d)
Figure 7. Simulation results under steady state voltage and current: (a) supply voltage; (b) injected compensation voltage; (c) load voltage; and (d) source voltage and source current.
Figure 7. Simulation results under steady state voltage and current: (a) supply voltage; (b) injectedcompensation voltage; (c) load voltage; and (d) source voltage and source current.
Energies 2020, 13, 2657 11 of 26Energies 2020, 13, x FOR PEER REVIEW 11 of 26
(a) (b)
(c) (d)
Figure 8. Simulation results under steady state voltage and current: (a) load current; (b) injected compensation current; (c) source current; and (d) DC link voltage.
The QZSI-based UPQC DC link was supported by the PV power generating system. The PV system and DC link measurements can be observed through the simulation results. Figure 9 shows the
(a) (b)
(c) (d)
Figure 8. Simulation results under steady state voltage and current: (a) load current; (b) injectedcompensation current; (c) source current; and (d) DC link voltage.
The QZSI-based UPQC DC link was supported by the PV power generating system. The PVsystem and DC link measurements can be observed through the simulation results. Figure 9 shows thesimulation results of the PV array voltage, PV current, DC link current, and PV output power understeady state voltage and current.
Energies 2020, 13, x FOR PEER REVIEW 11 of 26
(a) (b)
(c) (d)
Figure 8. Simulation results under steady state voltage and current: (a) load current; (b) injected compensation current; (c) source current; and (d) DC link voltage.
The QZSI-based UPQC DC link was supported by the PV power generating system. The PV system and DC link measurements can be observed through the simulation results. Figure 9 shows the
(a) (b)
(c) (d)
Figure 9. Simulation results under the steady state voltage and current: (a) PV array voltage; (b) PVcurrent; (c) DC link current; and (d) PV output power.

Energies 2020, 13, 2657 12 of 26
Fast Fourier transform (FFT) analyses were carried out for the load current before and aftercompensation to validate the harmonic compensation of PV-supported QZSI-based UPQC. Figure 10shows the results of simulation tests of the total harmonic distortion (THD) of load current prior tocompensation and the THD of source current after compensation at a balanced voltage and current.
Energies 2020, 13, x FOR PEER REVIEW 12 of 26
Figure 9. Simulation results under the steady state voltage and current: (a) PV array voltage; (b) PV current; (c) DC link current; and (d) PV output power.
Fast Fourier transform (FFT )analyses were carried out for the load current before and after compensation to validate the harmonic compensation of PV-supported QZSI-based UPQC. Figure 10 shows the results of simulation tests of the total harmonic distortion (THD) of load current prior to compensation and the THD of source current after compensation at a balanced voltage and current.
(a) (b)
Figure 10. Simulation results under steady state voltage and current: (a) total harmonic distortion (THD) of load current prior to compensation; (b) after compensation THD of source current.
Experimental studies check the feasibility of the proposed system. QZSI, a low step-up DC-DC converter, batteries, and a load are part of the experimental PV-supported QZSI-based UPQC. The control algorithm and coordination logic are implemented in the FPGA XC6SLX25 processor to produce a PWM pulse and control the switches of the UPQC. The hardware prototype of the QZSI-based UPQC is shown in Figure 11.
Figure 11. Hardware prototype of the Quasi Z-source inverter (QZSI)-based unified power quality conditioner (UPQC).
Figure 12 shows the experimental results of the supply voltage, load current, and harmonic distortions in the load current before connecting the QZSI-based UPQC.
Figure 10. Simulation results under steady state voltage and current: (a) total harmonic distortion(THD) of load current prior to compensation; (b) after compensation THD of source current.
Experimental studies check the feasibility of the proposed system. QZSI, a low step-up DC-DCconverter, batteries, and a load are part of the experimental PV-supported QZSI-based UPQC.The control algorithm and coordination logic are implemented in the FPGA XC6SLX25 processorto produce a PWM pulse and control the switches of the UPQC. The hardware prototype of theQZSI-based UPQC is shown in Figure 11.
Energies 2020, 13, x FOR PEER REVIEW 12 of 26
Figure 9. Simulation results under the steady state voltage and current: (a) PV array voltage; (b) PV current; (c) DC link current; and (d) PV output power.
Fast Fourier transform (FFT )analyses were carried out for the load current before and after compensation to validate the harmonic compensation of PV-supported QZSI-based UPQC. Figure 10 shows the results of simulation tests of the total harmonic distortion (THD) of load current prior to compensation and the THD of source current after compensation at a balanced voltage and current.
(a) (b)
Figure 10. Simulation results under steady state voltage and current: (a) total harmonic distortion (THD) of load current prior to compensation; (b) after compensation THD of source current.
Experimental studies check the feasibility of the proposed system. QZSI, a low step-up DC-DC converter, batteries, and a load are part of the experimental PV-supported QZSI-based UPQC. The control algorithm and coordination logic are implemented in the FPGA XC6SLX25 processor to produce a PWM pulse and control the switches of the UPQC. The hardware prototype of the QZSI-based UPQC is shown in Figure 11.
Figure 11. Hardware prototype of the Quasi Z-source inverter (QZSI)-based unified power quality conditioner (UPQC).
Figure 12 shows the experimental results of the supply voltage, load current, and harmonic distortions in the load current before connecting the QZSI-based UPQC.
Figure 11. Hardware prototype of the Quasi Z-source inverter (QZSI)-based unified power qualityconditioner (UPQC).
Figure 12 shows the experimental results of the supply voltage, load current, and harmonicdistortions in the load current before connecting the QZSI-based UPQC.

Energies 2020, 13, 2657 13 of 26Energies 2020, 13, x FOR PEER REVIEW 13 of 26
(a) (b)
(c)
Figure 12. Experimental results under steady state voltage and current: (a) supply voltage; (b) load current; (c) load current, source current, and injected current.
Total harmonic distortion (THD) level of source current before connecting the solar photovoltaic-supported QZSI-unified power quality conditioner is shown in Figure 13.
Figure 12. Experimental results under steady state voltage and current: (a) supply voltage; (b) loadcurrent; (c) load current, source current, and injected current.
Total harmonic distortion (THD) level of source current before connecting the solarphotovoltaic-supported QZSI-unified power quality conditioner is shown in Figure 13.
Energies 2020, 13, x FOR PEER REVIEW 13 of 26
(a) (b)
(c)
Figure 12. Experimental results under steady state voltage and current: (a) supply voltage; (b) load current; (c) load current, source current, and injected current.
Total harmonic distortion (THD) level of source current before connecting the solar photovoltaic-supported QZSI-unified power quality conditioner is shown in Figure 13.
Figure 13. Cont.
Energies 2020, 13, 2657 14 of 26Energies 2020, 13, x FOR PEER REVIEW 14 of 26
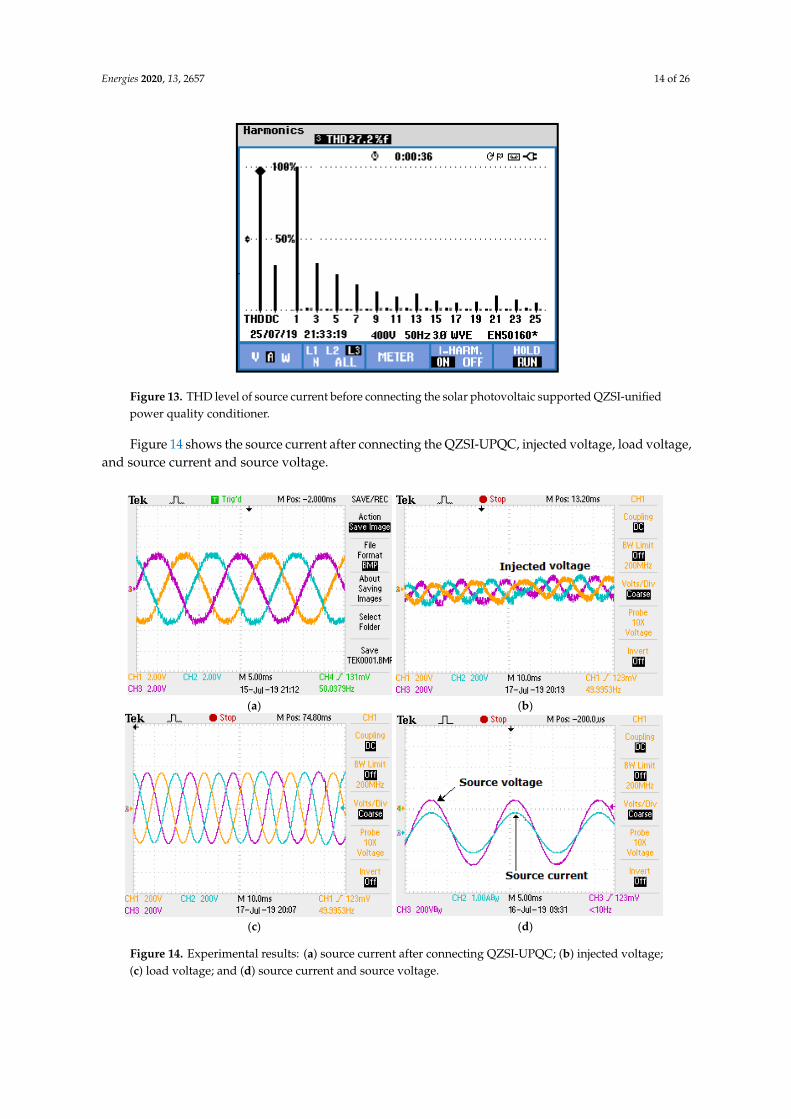
Figure 13. THD level of source current before connecting the solar photovoltaic supported QZSI-unified power quality conditioner.
Figure 14 shows the source current after connecting the QZSI-UPQC, injected voltage, load voltage, and source current and source voltage.
(a) (b)
(c) (d)
Figure 14. Experimental results: (a) source current after connecting QZSI-UPQC; (b) injected voltage; (c) load voltage; and (d) source current and source voltage.
Figure 13. THD level of source current before connecting the solar photovoltaic supported QZSI-unifiedpower quality conditioner.
Figure 14 shows the source current after connecting the QZSI-UPQC, injected voltage, load voltage,and source current and source voltage.
Energies 2020, 13, x FOR PEER REVIEW 14 of 26
Figure 13. THD level of source current before connecting the solar photovoltaic supported QZSI-unified power quality conditioner.
Figure 14 shows the source current after connecting the QZSI-UPQC, injected voltage, load voltage, and source current and source voltage.
(a) (b)
(c) (d)
Figure 14. Experimental results: (a) source current after connecting QZSI-UPQC; (b) injected voltage; (c) load voltage; and (d) source current and source voltage.
Figure 14. Experimental results: (a) source current after connecting QZSI-UPQC; (b) injected voltage;(c) load voltage; and (d) source current and source voltage.

Energies 2020, 13, 2657 15 of 26
THD level of source current after connecting SPV-supported QZSI-UPQC is displayed in Figure 15.The performance of the proposed SPV-UPQC with the ESOGI control system was tested with balancedload conditions under a balanced voltage. For this condition, the UPQC was tested in the experimentalstudy with the suggested control scheme, and the source current harmonic content with the proposedtechnique was 1.1 (%) after compensation.
Energies 2020, 13, x FOR PEER REVIEW 15 of 26
THD level of source current after connecting SPV-supported QZSI-UPQC is displayed in Figure 15. The performance of the proposed SPV-UPQC with the ESOGI control system was tested with balanced load conditions under a balanced voltage. For this condition, the UPQC was tested in the experimental study with the suggested control scheme, and the source current harmonic content with the proposed technique was 1.1 (%) after compensation.
Figure 15. THD level of source current after connecting solar photovoltaic-supported QZSI-unified power quality conditioner.
DC-link of QZSI-UPQC was supported by the SPV system for the voltage and current-basedcompensation. The experimental system was used to compute the DC-link voltage and QZSI condenser voltages. Figure 16 shows the voltage across capacitor C1, the voltage across capacitor C2, and the DC-link voltage of the UPQC.
Figure 15. THD level of source current after connecting solar photovoltaic-supported QZSI-unifiedpower quality conditioner.
DC-link of QZSI-UPQC was supported by the SPV system for the voltage and current-basedcompensation. The experimental system was used to compute the DC-link voltage and QZSI condenservoltages. Figure 16 shows the voltage across capacitor C1, the voltage across capacitor C2, and theDC-link voltage of the UPQC.
4.2. Balanced Voltages with Unbalanced Loads
Linking the single-phase rectifier circuit between three-phase lines offered unbalanced loadcurrents. Figure 17 shows the simulation results of the load current, injected compensation current,and source current and source voltage. Figure 18 shows the harmonic load current distortions beforeQZSI-based UPQC was connected and the THD level after connecting QZSI-UPQC support to the SPV.

Energies 2020, 13, 2657 16 of 26Energies 2020, 13, x FOR PEER REVIEW 16 of 26
(a) (b)
(c)
Figure 16. Experimental results: (a) voltage across capacitor C1; (b) voltage across capacitor C2; and (c) DC-link voltage of unified power quality conditioner.
4.2. Balanced Voltages with Unbalanced Loads
Linking the single-phase rectifier circuit between three-phase lines offered unbalanced load currents. Figure 17 shows the simulation results of the load current, injected compensation current, and source current and source voltage. Figure 18 shows the harmonic load current distortions before QZSI-based UPQC was connected and the THD level after connecting QZSI-UPQC support to the SPV.
Figure 16. Experimental results: (a) voltage across capacitor C1; (b) voltage across capacitor C2; and (c)DC-link voltage of unified power quality conditioner.Energies 2020, 13, x FOR PEER REVIEW 17 of 26
(a) (b)
(c) (d)
Figure 17. Simulation results under balanced voltages with unbalanced loads: (a) load current; (b) injected compensation current; (c) source current; and (d) source voltage.
(a) (b)
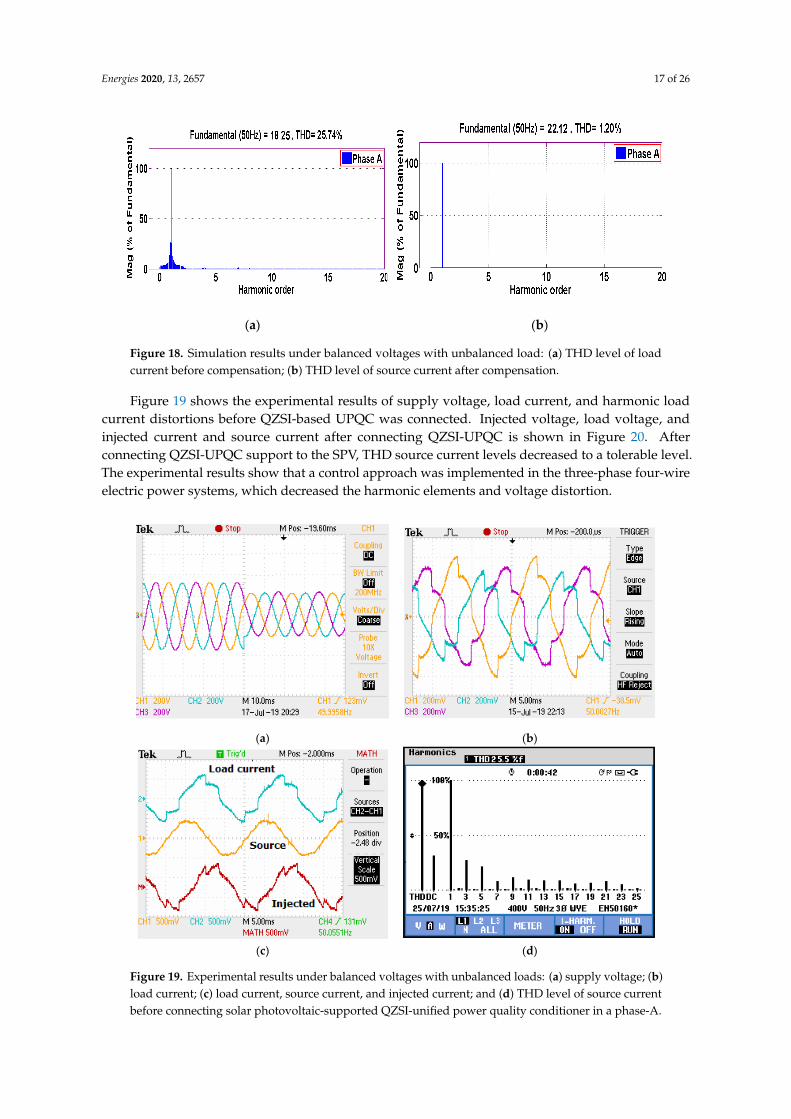
Figure 18. Simulation results under balanced voltages with unbalanced load: (a) THD level of load current before compensation; (b) THD level of source current after compensation.
Figure 19 shows the experimental results of supply voltage, load current, and harmonic load current distortions before QZSI-based UPQC was connected. Injected voltage, load voltage, and injected current and source current after connecting QZSI-UPQC is shown in Figure 20. After connecting QZSI-UPQC support to the SPV, THD source current levels decreased to a tolerable level. The experimental results show that a control approach was implemented in the three-phase four-wire electric power systems, which decreased the harmonic elements and voltage distortion.
Figure 17. Simulation results under balanced voltages with unbalanced loads: (a) load current;(b) injected compensation current; (c) source current; and (d) source voltage.
Energies 2020, 13, 2657 17 of 26
Energies 2020, 13, x FOR PEER REVIEW 17 of 26
(a) (b)
(c) (d)
Figure 17. Simulation results under balanced voltages with unbalanced loads: (a) load current; (b) injected compensation current; (c) source current; and (d) source voltage.
(a) (b)
Figure 18. Simulation results under balanced voltages with unbalanced load: (a) THD level of load current before compensation; (b) THD level of source current after compensation.
Figure 19 shows the experimental results of supply voltage, load current, and harmonic load current distortions before QZSI-based UPQC was connected. Injected voltage, load voltage, and injected current and source current after connecting QZSI-UPQC is shown in Figure 20. After connecting QZSI-UPQC support to the SPV, THD source current levels decreased to a tolerable level. The experimental results show that a control approach was implemented in the three-phase four-wire electric power systems, which decreased the harmonic elements and voltage distortion.
Figure 18. Simulation results under balanced voltages with unbalanced load: (a) THD level of loadcurrent before compensation; (b) THD level of source current after compensation.
Figure 19 shows the experimental results of supply voltage, load current, and harmonic loadcurrent distortions before QZSI-based UPQC was connected. Injected voltage, load voltage, andinjected current and source current after connecting QZSI-UPQC is shown in Figure 20. Afterconnecting QZSI-UPQC support to the SPV, THD source current levels decreased to a tolerable level.The experimental results show that a control approach was implemented in the three-phase four-wireelectric power systems, which decreased the harmonic elements and voltage distortion.Energies 2020, 13, x FOR PEER REVIEW 18 of 26
(a) (b)
(c) (d)
Figure 19. Experimental results under balanced voltages with unbalanced loads: (a) supply voltage; (b) load current; (c) load current, source current, and injected current; and (d) THD level of source current before connecting solar photovoltaic-supported QZSI-unified power quality conditioner in a phase-A.
The performance of the proposed SPV-UPQC with the ESOGI control system was tested with unbalanced load conditions under balanced voltage. For this condition, the UPQC was tested in the experimental study with the suggested control scheme, and the source current harmonic content with the proposed technique was 1.2 (%) after compensation. Figure 21 shows the voltage of the SPV array and voltage over the condensers in the Z-source network.
(a) (b)
Figure 19. Experimental results under balanced voltages with unbalanced loads: (a) supply voltage; (b)load current; (c) load current, source current, and injected current; and (d) THD level of source currentbefore connecting solar photovoltaic-supported QZSI-unified power quality conditioner in a phase-A.
Energies 2020, 13, 2657 18 of 26
Energies 2020, 13, x FOR PEER REVIEW 18 of 26
(a) (b)
(c) (d)
Figure 19. Experimental results under balanced voltages with unbalanced loads: (a) supply voltage; (b) load current; (c) load current, source current, and injected current; and (d) THD level of source current before connecting solar photovoltaic-supported QZSI-unified power quality conditioner in a phase-A.
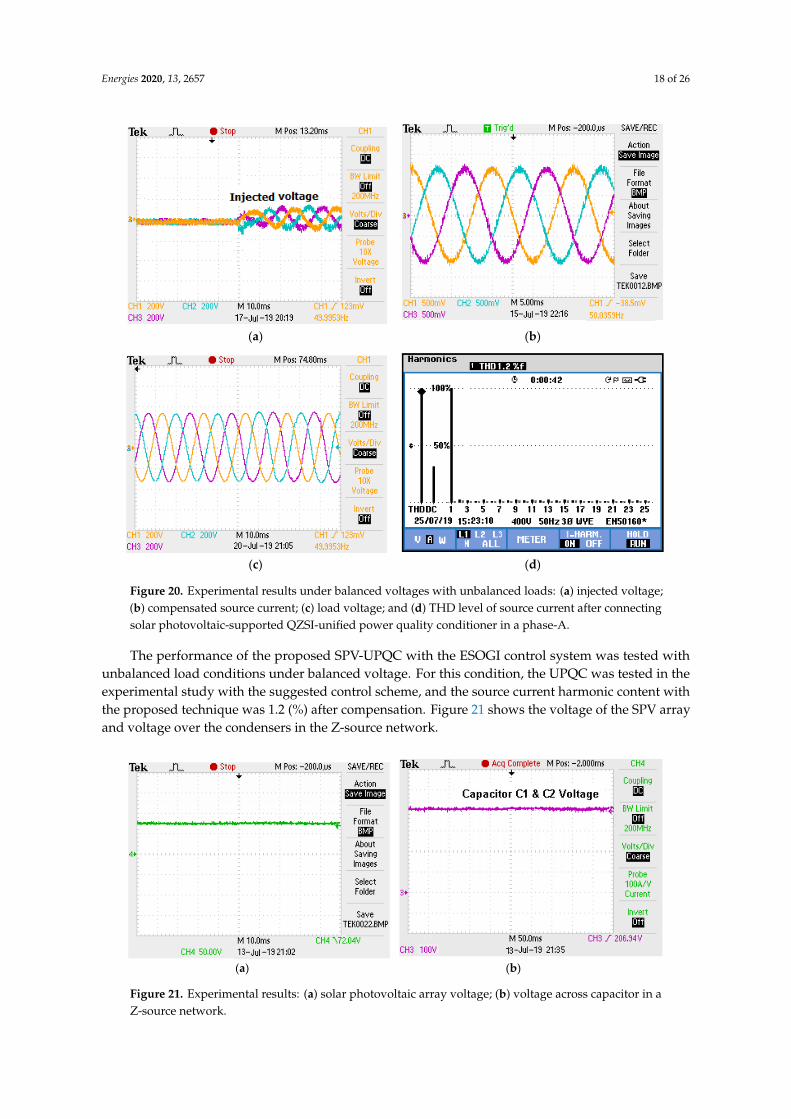
The performance of the proposed SPV-UPQC with the ESOGI control system was tested with unbalanced load conditions under balanced voltage. For this condition, the UPQC was tested in the experimental study with the suggested control scheme, and the source current harmonic content with the proposed technique was 1.2 (%) after compensation. Figure 21 shows the voltage of the SPV array and voltage over the condensers in the Z-source network.
(a) (b) Energies 2020, 13, x FOR PEER REVIEW 19 of 26
(c) (d)
Figure 20. Experimental results under balanced voltages with unbalanced loads: (a) injected voltage; (b) compensated source current; (c) load voltage; and (d) THD level of source current after connecting solar photovoltaic-supported QZSI-unified power quality conditioner in a phase-A.
(a) (b)
Figure 21. Experimental results: (a) solar photovoltaic array voltage; (b) voltage across capacitor in a Z-source network.
At the same load, the effectiveness of ESOGI control schemes for UPQC was checked by experiments, and the level before the compensation of source current harmonics was 25.5%, 24.7%, and 26.2%, decreasing to 1.2%, 1.3%, and 1.1% after compensation. In experimental validation, the voltage interruption compensation was tested by disconnecting the source voltage. The supply voltage, injected compensation voltage, and compensated load voltage during the voltage interruption is displayed in Figure 22.
Figure 20. Experimental results under balanced voltages with unbalanced loads: (a) injected voltage;(b) compensated source current; (c) load voltage; and (d) THD level of source current after connectingsolar photovoltaic-supported QZSI-unified power quality conditioner in a phase-A.
The performance of the proposed SPV-UPQC with the ESOGI control system was tested withunbalanced load conditions under balanced voltage. For this condition, the UPQC was tested in theexperimental study with the suggested control scheme, and the source current harmonic content withthe proposed technique was 1.2 (%) after compensation. Figure 21 shows the voltage of the SPV arrayand voltage over the condensers in the Z-source network.
Energies 2020, 13, x FOR PEER REVIEW 19 of 26
(c) (d)
Figure 20. Experimental results under balanced voltages with unbalanced loads: (a) injected voltage; (b) compensated source current; (c) load voltage; and (d) THD level of source current after connecting solar photovoltaic-supported QZSI-unified power quality conditioner in a phase-A.
(a) (b)
Figure 21. Experimental results: (a) solar photovoltaic array voltage; (b) voltage across capacitor in a Z-source network.
At the same load, the effectiveness of ESOGI control schemes for UPQC was checked by experiments, and the level before the compensation of source current harmonics was 25.5%, 24.7%, and 26.2%, decreasing to 1.2%, 1.3%, and 1.1% after compensation. In experimental validation, the voltage interruption compensation was tested by disconnecting the source voltage. The supply voltage, injected compensation voltage, and compensated load voltage during the voltage interruption is displayed in Figure 22.
Figure 21. Experimental results: (a) solar photovoltaic array voltage; (b) voltage across capacitor in aZ-source network.
Energies 2020, 13, 2657 19 of 26
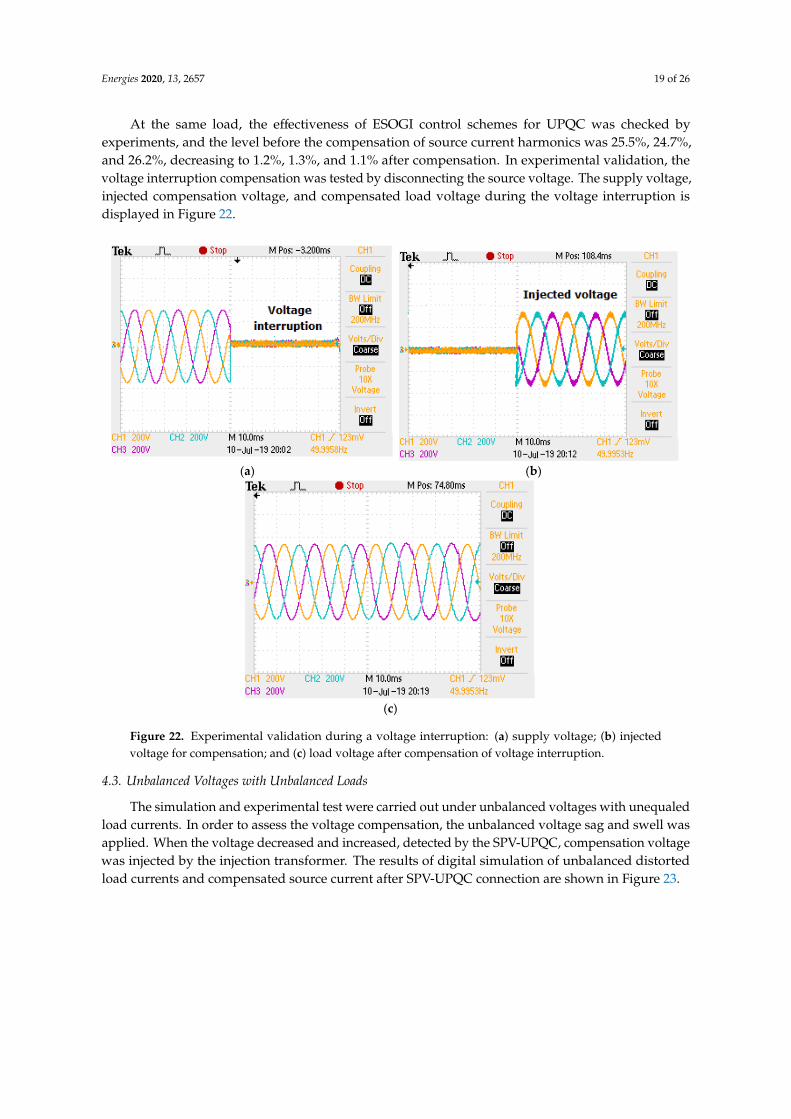
At the same load, the effectiveness of ESOGI control schemes for UPQC was checked byexperiments, and the level before the compensation of source current harmonics was 25.5%, 24.7%,and 26.2%, decreasing to 1.2%, 1.3%, and 1.1% after compensation. In experimental validation, thevoltage interruption compensation was tested by disconnecting the source voltage. The supply voltage,injected compensation voltage, and compensated load voltage during the voltage interruption isdisplayed in Figure 22.
Energies 2020, 13, x FOR PEER REVIEW 20 of 26
(a) (b)
(c)
Figure 22. Experimental validation during a voltage interruption: (a) supply voltage; (b) injected voltage for compensation; and (c) load voltage after compensation of voltage interruption.
4.3. Unbalanced Voltages with Unbalanced Loads
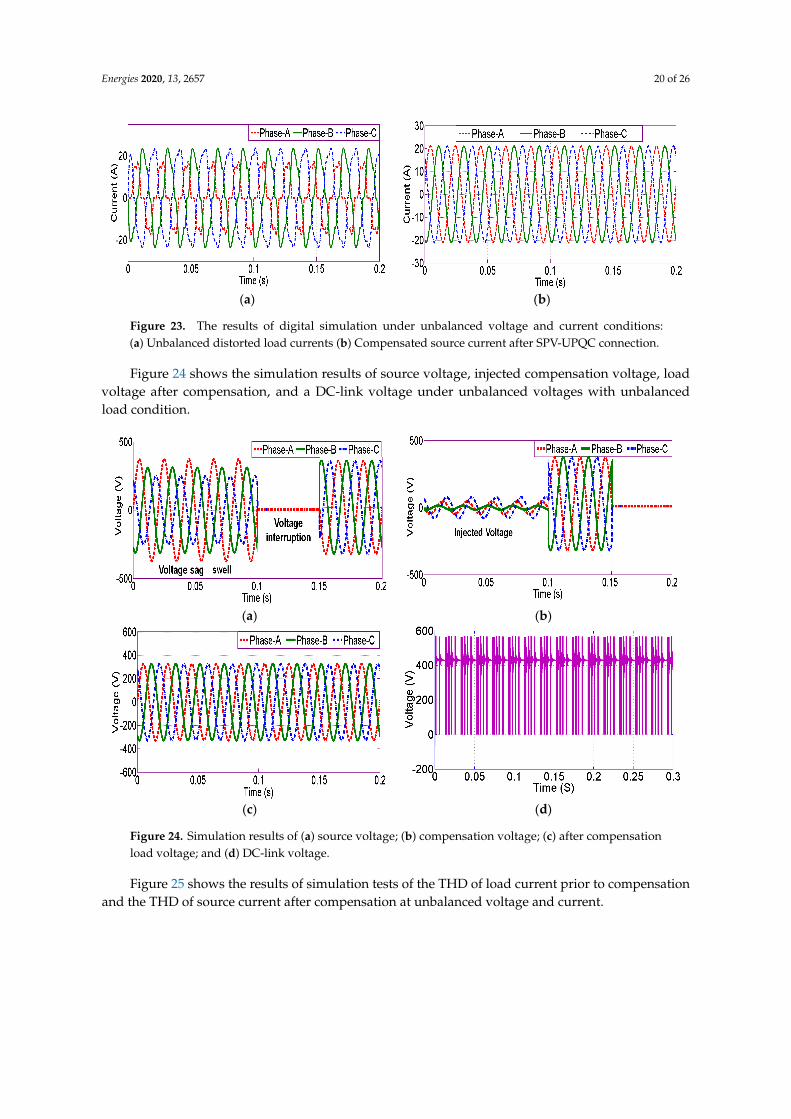
The simulation and experimental test were carried out under unbalanced voltages with unequaled load currents. In order to assess the voltage compensation, the unbalanced voltage sag and swell was applied. When the voltage decreased and increased, detected by the SPV-UPQC, compensation voltage was injected by the injection transformer. The results of digital simulation of unbalanced distorted load currents and compensated source current after SPV-UPQC connection are shown in Figure 23.
(a) (b)
Figure 22. Experimental validation during a voltage interruption: (a) supply voltage; (b) injectedvoltage for compensation; and (c) load voltage after compensation of voltage interruption.
4.3. Unbalanced Voltages with Unbalanced Loads
The simulation and experimental test were carried out under unbalanced voltages with unequaledload currents. In order to assess the voltage compensation, the unbalanced voltage sag and swell wasapplied. When the voltage decreased and increased, detected by the SPV-UPQC, compensation voltagewas injected by the injection transformer. The results of digital simulation of unbalanced distortedload currents and compensated source current after SPV-UPQC connection are shown in Figure 23.
Energies 2020, 13, 2657 20 of 26
Energies 2020, 13, x FOR PEER REVIEW 20 of 26
. (a) (b)
(c)
Figure 22. Experimental validation during a voltage interruption: (a) supply voltage; (b) injected voltage for compensation; and (c) load voltage after compensation of voltage interruption.
4.3. Unbalanced Voltages with Unbalanced Loads
The simulation and experimental test were carried out under unbalanced voltages with unequaled load currents. In order to assess the voltage compensation, the unbalanced voltage sag and swell was applied. When the voltage decreased and increased, detected by the SPV-UPQC, compensation voltage was injected by the injection transformer. The results of digital simulation of unbalanced distorted load currents and compensated source current after SPV-UPQC connection are shown in Figure 23.
(a) (b)
Figure 23. The results of digital simulation under unbalanced voltage and current conditions:(a) Unbalanced distorted load currents (b) Compensated source current after SPV-UPQC connection.
Figure 24 shows the simulation results of source voltage, injected compensation voltage, loadvoltage after compensation, and a DC-link voltage under unbalanced voltages with unbalancedload condition.
Energies 2020, 13, x FOR PEER REVIEW 21 of 26
Figure 23. The results of digital simulation under unbalanced voltage and current conditions: (a) Unbalanced distorted load currents (b) Compensated source current after SPV-UPQC connection.
Figure 24 shows the simulation results of source voltage, injected compensation voltage, load voltage after compensation, and a DC-link voltage under unbalanced voltages with unbalanced load condition.
(a) (b)
(c) (d)
Figure 24. Simulation results of (a) source voltage; (b) compensation voltage; (c) after compensation load voltage; and (d) DC-link voltage.
Figure 25 shows the results of simulation tests of the THD of load current prior to compensation and the THD of source current after compensation at unbalanced voltage and current.
(a) (b)
Figure 25. Simulation results under unbalanced voltages with unbalanced load: (a) THD of load current prior to compensation; (b) THD of source current after compensation.
The unbalanced load currents, unbalanced source voltages, and harmonic distortions before the SPV-UPQC connection are illustrated in Figure 26.
Figure 24. Simulation results of (a) source voltage; (b) compensation voltage; (c) after compensationload voltage; and (d) DC-link voltage.
Figure 25 shows the results of simulation tests of the THD of load current prior to compensationand the THD of source current after compensation at unbalanced voltage and current.

Energies 2020, 13, 2657 21 of 26
Energies 2020, 13, x FOR PEER REVIEW 21 of 26
Figure 23. The results of digital simulation under unbalanced voltage and current conditions: (a) Unbalanced distorted load currents (b) Compensated source current after SPV-UPQC connection.
Figure 24 shows the simulation results of source voltage, injected compensation voltage, load voltage after compensation, and a DC-link voltage under unbalanced voltages with unbalanced load condition.
(a) (b)
(c) (d)
Figure 24. Simulation results of (a) source voltage; (b) compensation voltage; (c) after compensation load voltage; and (d) DC-link voltage.
Figure 25 shows the results of simulation tests of the THD of load current prior to compensation and the THD of source current after compensation at unbalanced voltage and current.
(a) (b)
Figure 25. Simulation results under unbalanced voltages with unbalanced load: (a) THD of load current prior to compensation; (b) THD of source current after compensation.
The unbalanced load currents, unbalanced source voltages, and harmonic distortions before the SPV-UPQC connection are illustrated in Figure 26.
Figure 25. Simulation results under unbalanced voltages with unbalanced load: (a) THD of loadcurrent prior to compensation; (b) THD of source current after compensation.
The unbalanced load currents, unbalanced source voltages, and harmonic distortions before theSPV-UPQC connection are illustrated in Figure 26.Energies 2020, 13, x FOR PEER REVIEW 22 of 26
(a) (b)
(c)
Figure 26. Experimental test results under unbalanced voltages with unequaled load currents: (a) unbalanced load currents; (b) unbalanced source voltages; and (c) harmonic distortions before the solar photovoltaic-unified power quality conditioner connection.
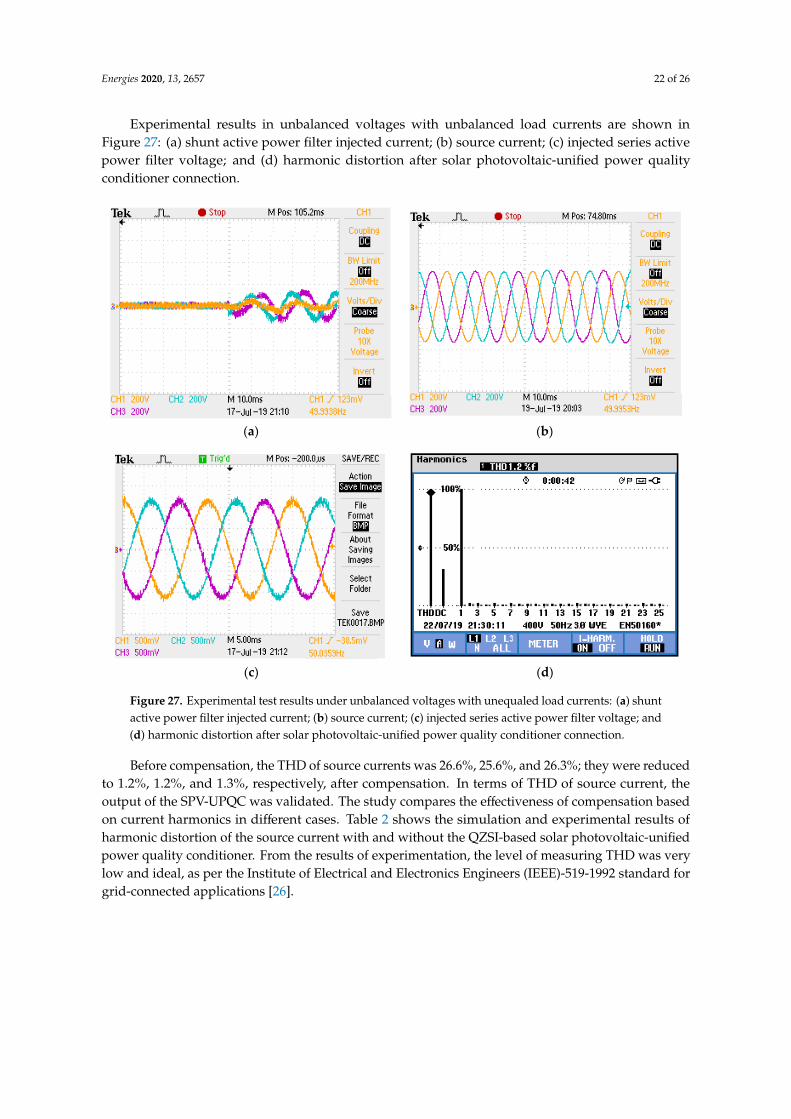
Experimental results in unbalanced voltages with unbalanced load currents are shown in Figure 27: (a) shunt active power filter injected current; (b) source current; (c) injected series active power filter voltage; and (d) harmonic distortion after solar photovoltaic-unified power quality conditioner connection.
(a) (b)
Figure 26. Experimental test results under unbalanced voltages with unequaled load currents: (a)unbalanced load currents; (b) unbalanced source voltages; and (c) harmonic distortions before the solarphotovoltaic-unified power quality conditioner connection.
Energies 2020, 13, 2657 22 of 26
Experimental results in unbalanced voltages with unbalanced load currents are shown inFigure 27: (a) shunt active power filter injected current; (b) source current; (c) injected series activepower filter voltage; and (d) harmonic distortion after solar photovoltaic-unified power qualityconditioner connection.
Energies 2020, 13, x FOR PEER REVIEW 22 of 26
(a) (b)
(c)
Figure 26. Experimental test results under unbalanced voltages with unequaled load currents: (a) unbalanced load currents; (b) unbalanced source voltages; and (c) harmonic distortions before the solar photovoltaic-unified power quality conditioner connection.
Experimental results in unbalanced voltages with unbalanced load currents are shown in Figure 27: (a) shunt active power filter injected current; (b) source current; (c) injected series active power filter voltage; and (d) harmonic distortion after solar photovoltaic-unified power quality conditioner connection.
(a) (b) Energies 2020, 13, x FOR PEER REVIEW 23 of 26
(c) (d)
Figure 27. Experimental test results under unbalanced voltages with unequaled load currents: (a) shunt active power filter injected current; (b) source current; (c) injected series active power filter voltage; and (d) harmonic distortion after solar photovoltaic-unified power quality conditioner connection.
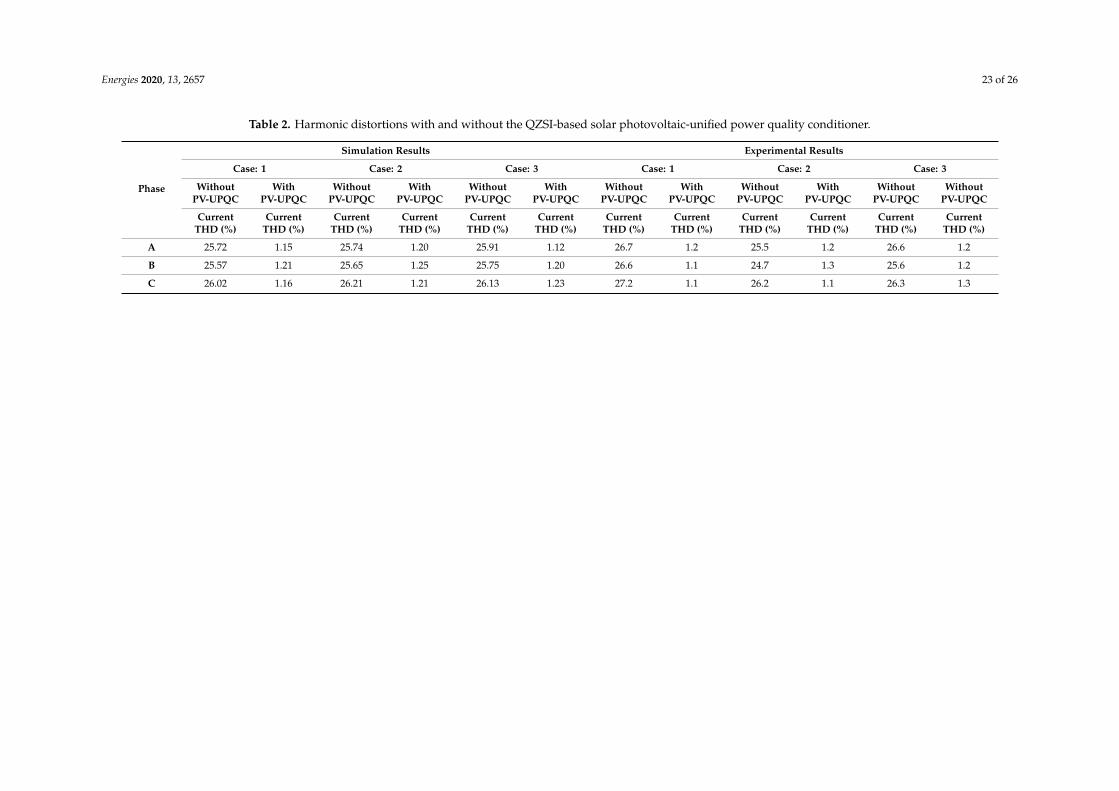
Before compensation, the THD of source currents was 26.6%, 25.6%, and 26.3%; they were reduced to 1.2%, 1.2%, and 1.3%, respectively, after compensation. In terms of THD of source current, the output of the SPV-UPQC was validated. The study compares the effectiveness of compensation based on current harmonics in different cases. Table 2 shows the simulation and experimental results of harmonic distortion of the source current with and without the QZSI-based solar photovoltaic-unified power quality conditioner. From the results of experimentation, the level of measuring THD was very low and ideal, as per the Institute of Electrical and Electronics Engineers (IEEE)-519-1992 standard for grid-connected applications [26].
The actual THD measure of source current under the non-linear load currents for the proposed method was about 1.2%, which was much less compared with existing methods, with a level of about 3.8%, as suggested by Yang et al. (2018) [18]. Figure 28 shows the THD level of source current before and after compensation during the simulation and experimental study and harmonic distortion after solar photovoltaic-unified power quality conditioner connection in the conventional system [18] under unbalanced nonlinear load conditions.
Table 2. Harmonic distortions with and without the QZSI-based solar photovoltaic-unified power quality conditioner.
Phase
Simulation Results Experimental Results
Case: 1 Case: 2 Case: 3 Case: 1 Case: 2 Case: 3
Without
PV-UPQC
With
PV-UPQC
Without
PV-UPQC
With
PV-UPQC
Without
PV-UPQC
With
PV-UPQC
Without
PV-UPQC
With
PV-UPQC
Without
PV-UPQC
With
PV-UPQC
Without
PV-UPQC
Without
PV-UPQC
Current
THD (%)
Current
THD (%)
Current
THD (%)
Current
THD (%)
Current
THD (%)
Current
THD (%)
Current
THD (%)
Current
THD (%)
Current
THD (%)
Current
THD (%)
Current
THD (%)
Current
THD (%)
A 25.72 1.15 25.74 1.20 25.91 1.12 26.7 1.2 25.5 1.2 26.6 1.2
B 25.57 1.21 25.65 1.25 25.75 1.20 26.6 1.1 24.7 1.3 25.6 1.2
C 26.02 1.16 26.21 1.21 26.13 1.23 27.2 1.1 26.2 1.1 26.3 1.3
Figure 27. Experimental test results under unbalanced voltages with unequaled load currents: (a) shuntactive power filter injected current; (b) source current; (c) injected series active power filter voltage; and(d) harmonic distortion after solar photovoltaic-unified power quality conditioner connection.
Before compensation, the THD of source currents was 26.6%, 25.6%, and 26.3%; they were reducedto 1.2%, 1.2%, and 1.3%, respectively, after compensation. In terms of THD of source current, theoutput of the SPV-UPQC was validated. The study compares the effectiveness of compensation basedon current harmonics in different cases. Table 2 shows the simulation and experimental results ofharmonic distortion of the source current with and without the QZSI-based solar photovoltaic-unifiedpower quality conditioner. From the results of experimentation, the level of measuring THD was verylow and ideal, as per the Institute of Electrical and Electronics Engineers (IEEE)-519-1992 standard forgrid-connected applications [26].
Energies 2020, 13, 2657 23 of 26
Table 2. Harmonic distortions with and without the QZSI-based solar photovoltaic-unified power quality conditioner.
Phase
Simulation Results Experimental Results
Case: 1 Case: 2 Case: 3 Case: 1 Case: 2 Case: 3
WithoutPV-UPQC
WithPV-UPQC
WithoutPV-UPQC
WithPV-UPQC
WithoutPV-UPQC
WithPV-UPQC
WithoutPV-UPQC
WithPV-UPQC
WithoutPV-UPQC
WithPV-UPQC
WithoutPV-UPQC
WithoutPV-UPQC
CurrentTHD (%)
CurrentTHD (%)
CurrentTHD (%)
CurrentTHD (%)
CurrentTHD (%)
CurrentTHD (%)
CurrentTHD (%)
CurrentTHD (%)
CurrentTHD (%)
CurrentTHD (%)
CurrentTHD (%)
CurrentTHD (%)
A 25.72 1.15 25.74 1.20 25.91 1.12 26.7 1.2 25.5 1.2 26.6 1.2
B 25.57 1.21 25.65 1.25 25.75 1.20 26.6 1.1 24.7 1.3 25.6 1.2
C 26.02 1.16 26.21 1.21 26.13 1.23 27.2 1.1 26.2 1.1 26.3 1.3

Energies 2020, 13, 2657 24 of 26
The actual THD measure of source current under the non-linear load currents for the proposedmethod was about 1.2%, which was much less compared with existing methods, with a level of about3.8%, as suggested by Yang et al. (2018) [18]. Figure 28 shows the THD level of source current beforeand after compensation during the simulation and experimental study and harmonic distortion aftersolar photovoltaic-unified power quality conditioner connection in the conventional system [18] underunbalanced nonlinear load conditions.Energies 2020, 13, x FOR PEER REVIEW 24 of 26
Figure 28. THD level of source current before and after compensation during the simulation and experimental study and THD level after compensation in the conventional system.
5. Conclusion
In this paper, the enhanced SOGI control-based QZSI-UPQC was implemented in order to incorporate solar PV into the grid with the presence of extremely non-linear load. This approach was employed in the SPV interfaced three-phase four-wire QZSI-UPQC for the compensation of reactive power, current harmonics, voltage sags/swell, and voltage interruption in the electric power distribution networks. The SPV power generation system supports the DC link of the QZSI in order to mitigate deep and long-term voltage and current instabilities in the power distribution networks. In addition, the excess generated power can be shared and stored in the batteries by the SPV power generation systems. The SPV power system facilitates the continuous delivery of clean power to the load in different situations. It lowers electricity utility bills and removes the use of UPS and stabilizer in a household, small industry, and education institution for individual facilities. This ESOGI control algorithm effectively accomplishes the harmonic distortions, voltage, and current compensation under dynamic condition of source and loads. The whole system was tested on an experimental prototype laboratory platform and THD analyses were performed under both stable and dynamic conditions. Experimental results show that the proposed scheme offsets the non-linearity of the load effectively. The proposed system also integrates the PV system smoothly into the grid with minimal grid distortions. The load current THD was reduced from 26.6% to 1.2%, which is less than the tolerable limit of 5%, as specified by the IEEE standard.519-1992.
Author Contributions: All authors contributed to the research investigation equally and presented in the current version of the full article.
Funding: There is no funding resource for the presented research work.
Conflicts of Interest: The authors declare no conflict of interest.
References
1. Yao, Y.; Kang, L. The Virtual Harmonic Power Droop Strategy to Mitigate the Output Harmonic Voltageof the Inverter. Energies 2018, 11, 2196, doi:10.3390/en11092196.
2. Ge, X.; Gao, F.; He, G.; Li, G. A unified power quality conditioner for the fault ride-through operation ofphotovoltaic power station. In Proceedings of the 2014 International Electronics and ApplicationConference and Exposition (PEAC), Shanghai, China, 5–8 November 2014; pp. 566–571.
Figure 28. THD level of source current before and after compensation during the simulation andexperimental study and THD level after compensation in the conventional system.
5. Conclusions
In this paper, the enhanced SOGI control-based QZSI-UPQC was implemented in order toincorporate solar PV into the grid with the presence of extremely non-linear load. This approachwas employed in the SPV interfaced three-phase four-wire QZSI-UPQC for the compensation ofreactive power, current harmonics, voltage sags/swell, and voltage interruption in the electric powerdistribution networks. The SPV power generation system supports the DC link of the QZSI in orderto mitigate deep and long-term voltage and current instabilities in the power distribution networks.In addition, the excess generated power can be shared and stored in the batteries by the SPV powergeneration systems. The SPV power system facilitates the continuous delivery of clean power tothe load in different situations. It lowers electricity utility bills and removes the use of UPS andstabilizer in a household, small industry, and education institution for individual facilities. This ESOGIcontrol algorithm effectively accomplishes the harmonic distortions, voltage, and current compensationunder dynamic condition of source and loads. The whole system was tested on an experimentalprototype laboratory platform and THD analyses were performed under both stable and dynamicconditions. Experimental results show that the proposed scheme offsets the non-linearity of the loadeffectively. The proposed system also integrates the PV system smoothly into the grid with minimalgrid distortions. The load current THD was reduced from 26.6% to 1.2%, which is less than the tolerablelimit of 5%, as specified by the IEEE standard.519-1992.
Author Contributions: All authors contributed to the research investigation equally and presented in the currentversion of the full article. All authors have read and agreed to the published version of the manuscript.
Funding: There is no funding resource for the presented research work.
Conflicts of Interest: The authors declare no conflict of interest.
Energies 2020, 13, 2657 25 of 26
References
1. Yao, Y.; Kang, L. The Virtual Harmonic Power Droop Strategy to Mitigate the Output Harmonic Voltage ofthe Inverter. Energies 2018, 11, 2196. [CrossRef]
2. Ge, X.; Gao, F.; He, G.; Li, G. A unified power quality conditioner for the fault ride-through operation ofphotovoltaic power station. In Proceedings of the 2014 International Electronics and Application Conferenceand Exposition (PEAC), Shanghai, China, 5–8 November 2014; pp. 566–571.
3. Jayanti, N.; Basu, M.; Conlon, M.F.; Gaughan, K. Optimising the rating of the UPQC for applying to the faultride through enhancement of wind generation. In Proceedings of the 41st International Universities PowerEngineering Conference, Newcastle-Upon-Tyne, UK, 6–8 September 2006; Volume 1, pp. 123–127.
4. Hoon, Y.; Mohd Radzi, M.A.; Hassan, M.K.; Mailah, N.F. A Dual-Function Instantaneous Power Theory forOperation of Three-Level Neutral-Point-Clamped Inverter-Based Shunt Active Power Filter. Energies 2018,11, 1592. [CrossRef]
5. Sang, Y.; Yang, B.; Shu, H.; Na, A.; Zeng, F.; Yu, T. Fault Ride-Through Capability Enhancement of Type-4WECS in offshore Wind Farm via Nonlinear Adaptive Control of VSC-HVDC. Processes 2019, 7, 540. [CrossRef]
6. Khadkikar, V. Enhancing electric power quality using UPQC: A comprehensive overview. IEEE Trans.Electron. 2012, 27, 2284–2297. [CrossRef]
7. Monteiro, L.F.; Aredes, M.; Couto, C.; Afonso, J.L. Control algorithms for a unified power quality conditionerbased on three-level converters. Int. Trans. Electr. Energy Syst. 2014, 25, 2394–2411. [CrossRef]
8. Devassy, S.; Singh, B. Dynamic performance of solar PV integrated UPQC-P for critical loads. In Proceedingsof the 2015 Annual IEEE India Conference (INDICON), New Delhi, India, 17–20 December 2015; pp. 1–6.
9. Chen, J.; Duan, W.; Yang, X.; Zhang, L.; Shan, Y.; Yang, B.; Shu, H.; Na, A.; Yu, T. Overall Adaptive ControllerDesign of PMSG Under Whole Wind Speed Range: A Perturbation Compensation Based Approach. Processes2019, 7, 732. [CrossRef]
10. Reisi, A.R.; Moradi, M.H.; Showkati, H. Combined photovoltaic and unified power quality controller toimprove power quality. Solar Energy 2013, 88, 154–162. [CrossRef]
11. Vijayakumar, M.; Vijayan, S. Extended reference signal generation scheme for integration of unified powerquality conditioner in grid-connected photovoltaic system. Electr. Power Compon. Syst. 2015, 43, 914–927.
12. Shrivastava, A.; Nene, P. Power quality enhancement using UPQC connected with PV arrays. In Proceedingsof the 2015 Fifth International Conference on Communication Systems and Network Technologies ( CSNT),Gwalior, India, 4–6 April 2015; pp. 1232–1237. [CrossRef]
13. Patel, A.; Chaturvedi, P. Performance of SRF-UVTG based UPQCDG for integration of solar PV withnon-linear loads. In Proceedings of the 2016 IEEE International Conference on Power Electronics, Drives andEnergy Systems (PEDES), Melaka, Malaysia, 28–29 November 2016; pp. 1–5.
14. Khadkikar, V.; Chandra, A. A new control philosophy for a unified power quality conditioner (upqc) tocoordinate load-reactive power demand between shunt and series inverters. IEEE Trans. Power Deliv. 2008,23, 2522–2534. [CrossRef]
15. Hoon, Y.; Mohd Radzi, M.A.; Hassan, M.K.; Mailah, N.F. Control Algorithms of Shunt Active Power Filterfor Harmonics Mitigation: A Review. Energies 2017, 10, 2038. [CrossRef]
16. Hekss, Z.; Lachkar, I.; Abouloifa, A.; Echalih, S.; Aourir, M.; Giri, F. Nonlinear Control Strategy of SinglePhase Half Bridge Shunt Active Power Filter Interfacing Renewable Energy Source and Grid. In Proceedingsof the 2019 American Control Conference (ACC), Philadelphia, PA, USA, 10–12 July 2019; pp. 1972–1977.
17. Devassy, S.; Singh, B. Implementation of Solar Photovoltaic System with Universal Active Filtering Capability.IEEE Trans. Ind. Appl. 2019, 55, 3926–3934. [CrossRef]
18. Yang, B.; Liu, K.; Zhang, S.; Zhao, J. Design and Implementation of Novel Multi-Converter-Based UnifiedPower Quality Conditioner for Low-Voltage High-Current Distribution System. Energies 2018, 11, 3150.[CrossRef]
19. Chen, X.; Fu, Q.; Infield, D.G. PV grid-connected power conditioning system with Z-source network. InProceedings of the 2009 International Conference on Sustainable Power Generation and Supply, Nanjing,China, 6–7 April 2009; pp. 1–6. [CrossRef]
20. Zhang, J. Unified control of Z-source grid-connected photovoltaic system with reactive power compensationand harmonics restraint: Design and application. IET Renew. Power Gener. 2018, 12, 422–429. [CrossRef]
Energies 2020, 13, 2657 26 of 26
21. Senguttuvan, S.; Vijayakumar, M. Solar photovoltaic system interfaced shunt active power filter forenhancement of power quality in three-phase distribution system. J. Circuit Syst. Comp. 2018, 27, 1850166.[CrossRef]
22. Järvelä, M.; Seppo Valkealahti, S. Ideal Operation of a Photovoltaic Power Plant Equipped with an EnergyStorage System on Electricity Market. Appl. Sci. 2017, 7, 749. [CrossRef]
23. Villalva, M.G.; Gazoli, J.R.; Ruppert Filho, E. Comprehensive approach to modeling and simulation ofphotovoltaic arrays. IEEE Trans. Power Electron. 2009, 24, 1198–1208. [CrossRef]
24. Xiao, F.; Dong, L.; Li, L.; Liao, X. A Frequency-Fixed SOGI-Based PLL for Single-Phase Grid-ConnectedConverters. IEEE Trans. Power Electron. 2017, 32, 1713–1719. [CrossRef]
25. Patil, P.K.; Patel, H.H. Modified SOGI based shunt active power filter to tackle various grid voltageabnormalities. Eng. Sci. Technol. Int. J. 2017, 20, 1466–1474. [CrossRef]
26. Langella, R.; Testa, A.; Alii, E. IEEE Recommended Practice and Requirements for Harmonic Control inElectric Power Systems. IEEE Stand. 2014, 519, 1–29.
© 2020 by the authors. Licensee MDPI, Basel, Switzerland. This article is an open accessarticle distributed under the terms and conditions of the Creative Commons Attribution(CC BY) license (http://creativecommons.org/licenses/by/4.0/).