error estimation for indoor 802.11 location...
TRANSCRIPT

Error Estimation for Indoor 802.11 LocationFingerprinting
Hendrik Lemelson1, Mikkel Baun Kjærgaard2, Rene Hansen3, and Thomas King1
1 Department of Computer Science, University of Mannheim, Germany{lemelson,king}@informatik.uni-mannheim.de
2 Department of Computer Science, University of Aarhus, [email protected]
3 Department of Computer Science, University of Aalborg, [email protected]
Abstract. 802.11-based indoor positioning systems have been under research forquite some time now. However, despite the large attention this topic has gained,most of the research focused on the calculation of position estimates. In this pa-per, we go a step further and investigate how the position error that is inherent to802.11-based positioning systems can be estimated. Knowing the position error iscrucial for many applications that rely on position information: End users couldbe informed about the estimated position error to avoid frustration in case thesystem gives faulty position information. Service providers could adapt their de-livered services based on the estimated position error to achieve a higher servicequality. Finally, system operators could use the information to inspect whethera location system provides satisfactory positioning accuracy throughout the cov-ered area. For position error estimation, we present four novel algorithms thattake different features into account. Advantages of the combination of these fouralgorithms are explored by using a machine-learning approach. We evaluate ourproposed algorithms in two different real-world deployments by using real-worlddata and emulation. The results show that our algorithms work independently ofthe environment and the positioning algorithm, and with an average precisionfor estimating the position error of up to 1.45 meters. The algorithms can – byadjusting parameters – realize different tradeoffs between underestimating andoverestimating errors. Furthermore we comment on the algorithms’ space andtime complexity.
1 Introduction
Nowadays, powerful and light mobile devices, such as smart-phones and laptops, pro-vide nomadic users with computing and networking services wherever they go. How-ever, the device’s usefulness can be highly leveraged by so-called location-based ser-vices (LBS): These services adapt their behavior proactively depending on the user’scurrent location. A service that informs a user about the location of nearby friends andpoints of interest is a good example of an LBS.
Today, the most prominent source of location information is the Global Position-ing System (GPS) [1]. GPS works well in outdoor open-sky environments but fails todeliver reliable location information where users spend most of their time: indoors and

in so-called street canyons where tall buildings prevent users from getting a line-of-sight to GPS satellites [2]. Due to these drawbacks of GPS, in recent years a lot ofeffort has been spent on the development of alternative systems to estimate a user’sposition in GPS-free areas. However, current systems either use specialized equip-ment to work accurately in confined indoor environments (e.g., Ubisense1) or pro-vide metropolitan-scale coverage at the expense of coarse positioning accuracy (e.g.,Place Lab [3], RightSPOT [4]).
User
Inference Algorithm
Operator
Fig. 1: The use of information about expected errors by users, inference algorithms andoperators.
For three reasons, positioning based on 802.11 [5] offers a viable solution whereother systems fail: Firstly, no specialized hardware is required, because, nowadays, al-most all modern mobile devices are equipped with 802.11 network interfaces. Secondly,due to the proliferation of 802.11 wireless networks, radio signals from at least a few802.11 access points can almost always be collected where people work and live in thedeveloped world (e.g., [2] and [6]). Thirdly, 802.11 signals can be used to estimate auser’s position indoors with an accuracy that is generally sufficient for most LBSs [7].
However, as with GPS, 802.11-based positioning systems comprise an inherent po-sition error that is caused by radio propagation effects (e.g., reflection, diffraction, andscattering) and limits of the hardware (e.g., the measurement accuracy of sensors). Evenworse, under sub-optimal conditions such as sparse coverage of access points or manymoving obstacles that cause radio signals to fluctuate the accuracy of 802.11-based po-sitioning systems tends to decrease.
GPS handles variations in the position accuracy by offering a measure called Di-lution Of Precision (DOP). Computed from several different system parameters, theDOP value indicates the level of position error that has to be expected for a given es-timated position. Position error estimation is mainly valuable in three ways (see Fig-ure 1): Firstly, the user can be notified that the estimated position might contain someposition error. This helps him to make better use of the LBS [8] and also avoids him be-coming frustrated because of many unexpected wrong positioning results. For instance,
1 http://www.ubisense.net

if a friend-finder service does not only show the estimated position of a friend but alsothe estimated position error (e.g., as a circle around the friend’s position), a user mightlook around in the area indicated by the position error estimate in case he is not able tofind his friend at the place where the service estimated him to be. Secondly, so-calledinference algorithms utilize position estimates to derive additional information (e.g.,activities or routes). Position error estimates allow the inference algorithms to assessthe level of trust that these position estimates contain. As a result, the algorithms cangive a higher priority to estimates with a low estimated error. This helps to deliver ahigher service quality. Thirdly, operators of 802.11-based positioning systems can uti-lize position error estimates to optimize their system to the precision required by theapplication. For instance, an operator might add additional access points to the parts ofthe operation area that show position error estimates above a certain threshold.
In this paper, we propose several algorithms to estimate the expected position errorof 802.11-based positioning systems. We focus on the static case of position estimationwithout any knowledge of spatial or temporal history and selected two well-studied sys-tems proposed by Bahl et al. [9] and Haeberlen et al. [10] as positioning systems. Thesesystems use a so-called location fingerprinting approach. Location fingerprinting con-sists of a two-stage mechanism: A training phase and a position determination phase.During the training phase, signal strength samples of nearby access points are gatheredat reference spots in the operation area and stored together with their physical coordi-nates in a database: They are called fingerprints. In the position determination phase,the user’s mobile device performs signal strength measurements at its (yet unknown)position and searches for similar patterns in the database. The closest match is selected,and its coordinates are returned as the position estimate.
We selected these two systems, as they represent the two main types of location fin-gerprinting algorithms, i.e., a probabilistic and a deterministic approach. They are easyto understand and therefore do not blur the view for the mechanisms used by our ownerror prediction algorithms. The two positioning systems differ in the way they pro-cess fingerprints and how they select the closest match. The system proposed by Hae-berlen et al. builds signal strength distributions for each fingerprint based on the signalstrength samples it contains. In the position determination phase, for each fingerprint aprobability is calculated based on the currently collected signal strength samples. Theprobability calculation is done by utilizing Bayes’ rule. The fingerprint with the highestprobability is selected, and its position is returned as a position estimate. In contrast, thesystem proposed by Bahl et al. does not use distributions and probabilities. Instead, foreach fingerprint the different signal strength samples are averaged. Based on these av-erages, the fingerprint that is closest to the average of signal strength samples collectedduring the position determination phase is selected. The calculation of the distances isdone by applying the Euclidean distance.
We propose position error estimation algorithms that are able to predict the expectedposition error in advance, using only the collected training data, as well as algorithmsthat infer the expected position error from live measurements in the position determi-nation phase.
We make the following contributions in this work: First of all, we propose novelalgorithms for estimating the expected error of an indoor 802.11-based positioning sys-

tem. Secondly, we provide a deep investigation by means of emulation to show thatthe proposed algorithms can estimate expected position errors with high accuracy. Theemulation is based on collected real-world data and shows that our error estimation al-gorithms work independent of the environment and the positioning algorithm. Thirdly,we evaluate the idea of using a machine-learning algorithm to combine the proposedalgorithms and to find an optimal combination of the proposed algorithms. Finally, weanalyze the time and space consumption of the proposed algorithms.
The remainder of this paper is structured as follows: The work of other researchersrelated to our own findings is presented in Section 2. In Section 3, we introduce theproposed error estimation algorithms. This is followed by a description of the experi-mental setup and research methodology used to evaluate our error estimation algorithmsin Section 4. Subsequently, the experimental results for the different algorithms aloneas well as for a combination of algorithms are presented in Section 5. In Section 6, wediscuss the results of the evaluation. Finally, Section 7 concludes the paper.
2 Related Work
Some work that tries to understand the position errors for 802.11-based positioning sys-tems already exists. However, the main difference compared to our work is that they tryto form a priori analytical models in order to understand the position error in general –e.g., to understand the relationship between the number of access points or the finger-printing grid size and the positioning error. Our algorithms instead use information fromactual fingerprints and position determination measurements to estimate the expectederrors in an actual deployment area and at the time of use.
Analytical models have been proposed by Wallbaum [11], Kaemarungsi et al. [12],Krishnakumar et al. [13] and Youssef et al. [14]. They propose analytical models builtfrom information such as access point placement, system parameters and floor layout.Using these models they analyze the general impact of access point placement, num-ber of access points, grid size, signal variance, propagation constants, and floor layouton the position error. However, as commented earlier, these models are analytical toolsfor doing general analysis. Our algorithms go into the opposite direction, estimatingexpected errors at a specific site and at a specific point in time. However, it is an inter-esting future path of research to further analyze the relationship between algorithms forerror estimation and analytical error models.
More related to our work are the methods for estimating outdoor GSM position-ing errors proposed by Dearman et al. [8]. Motivated by a study on how to visualizeexpected GSM position errors they propose initial methods for how to estimate such in-formation. They propose two methods for outdoor error estimation: A machine-learningmethod that uses a linear regression technique on basic signal strength features and aground truth method that requires the collection of additional test data. The outdooraccuracy of these methods is up to 50 meters when considering the median accuracy.Their machine-learning method is similar to our effort of combining features, however,the used set of features is different. Their method is based on basic features such assignal strength variance. Our results show that for 802.11 such basic features can beoutperformed by more advanced features such as the proposed fingerprint clustering

algorithm. Furthermore, a machine-learning method might not be optimal because itwill try to optimize the average precision. In several of our machine-learning experi-ments this led to a high percentage of either overestimations or underestimations for theexpected position error.
3 Error Estimation
In this section, we propose our four novel algorithms for position error estimation. Thefollowing two algorithms can predict the expected positioning error in advance, usingonly the data collected in the training phase:
A. Fingerprint Clustering B. Leave Out Fingerprint
The two other algorithms infer the expected position error from live measurementsin the position determination phase:
C. Best Candidate Set D. Signal Strength Variance
3.1 Fingerprint Clustering
The fingerprint clustering algorithm uses the idea, that inside structurally limited ar-eas the signals received from an access point – despite inevitable small scale fadingeffects – tend to be within a certain range. For instance, the signal strength measure-ments collected in one single office room often cover only a quite limited range of thegenerally possible values. As in such a case all the fingerprints collected in this officeroom are very similar, a positioning algorithm will hardly be able to make an exact po-sition estimation. Instead, it will probably select one of the other fingerprints collectedsomewhere else in the room.
If such an area of similar signal properties has large physical dimensions, we expectthe position error to be larger because generally the number of similar fingerprints ishigher and also their physical distribution space is larger. We exploit this behavior in thefollowing way. Our novel algorithm lays out a grid of cells over the complete coveredarea of operation of the 802.11-based positioning system. Then the following steps areperformed in order to find regions of similar signal properties:
1. Initially each grid cell represents a single cluster containing all the training samplescollected inside the physical area of the cell.
2. After that, the algorithm randomly selects a cluster. By using a similarity measure,the algorithm then checks for the selected cluster whether the similarity to adjacentclusters lies above a given threshold. If this is the case for any adjacent cluster, thetwo clusters are merged into one new cluster.
3. The previous step is repeated until, for all remaining clusters, no further clusterscan be merged.
4. As a next step, the set of clusters is checked for clusters that only comprise one sin-gle cell. If such a cluster is found, it is merged with its most similar adjacent clusterwithout considering the threshold. The reason for this procedure is that these single
cell clusters most often are a result of very time and space constrained phenom-ena during the collection phase of the training data, and eliminating them helps thealgorithm to deliver better and more stable results.
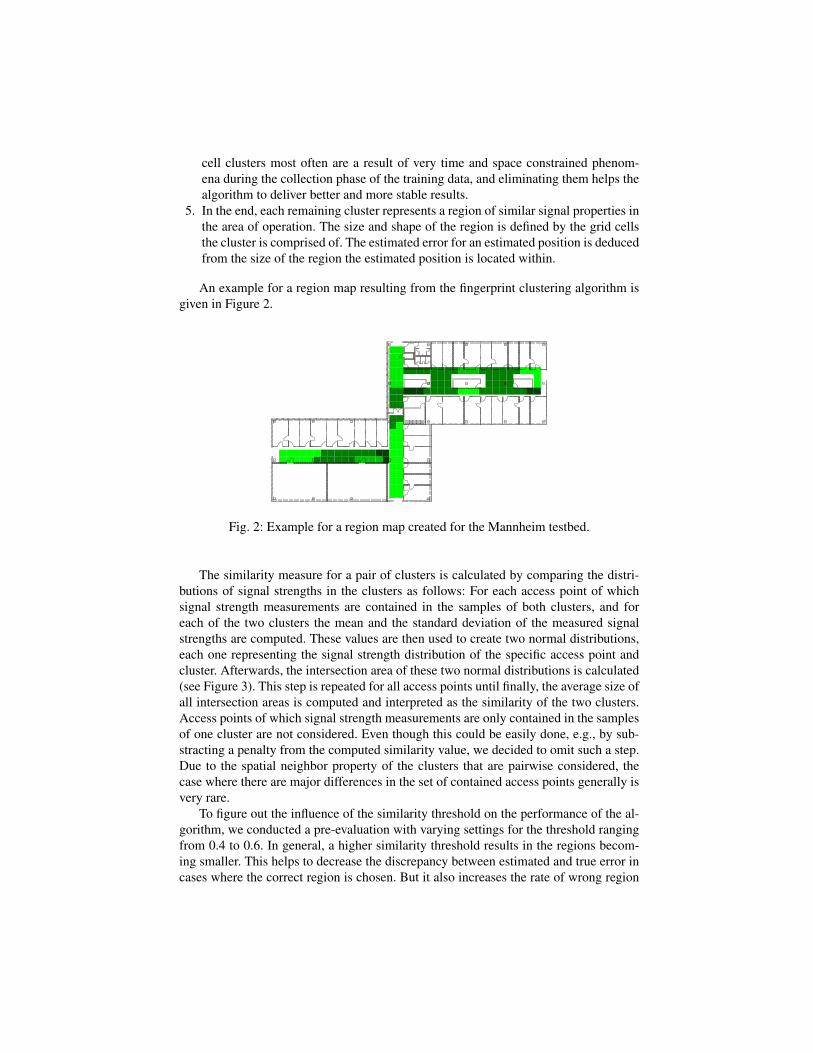
5. In the end, each remaining cluster represents a region of similar signal properties inthe area of operation. The size and shape of the region is defined by the grid cellsthe cluster is comprised of. The estimated error for an estimated position is deducedfrom the size of the region the estimated position is located within.
An example for a region map resulting from the fingerprint clustering algorithm isgiven in Figure 2.
Fig. 2: Example for a region map created for the Mannheim testbed.
The similarity measure for a pair of clusters is calculated by comparing the distri-butions of signal strengths in the clusters as follows: For each access point of whichsignal strength measurements are contained in the samples of both clusters, and foreach of the two clusters the mean and the standard deviation of the measured signalstrengths are computed. These values are then used to create two normal distributions,each one representing the signal strength distribution of the specific access point andcluster. Afterwards, the intersection area of these two normal distributions is calculated(see Figure 3). This step is repeated for all access points until finally, the average size ofall intersection areas is computed and interpreted as the similarity of the two clusters.Access points of which signal strength measurements are only contained in the samplesof one cluster are not considered. Even though this could be easily done, e.g., by sub-stracting a penalty from the computed similarity value, we decided to omit such a step.Due to the spatial neighbor property of the clusters that are pairwise considered, thecase where there are major differences in the set of contained access points generally isvery rare.
To figure out the influence of the similarity threshold on the performance of the al-gorithm, we conducted a pre-evaluation with varying settings for the threshold rangingfrom 0.4 to 0.6. In general, a higher similarity threshold results in the regions becom-ing smaller. This helps to decrease the discrepancy between estimated and true error incases where the correct region is chosen. But it also increases the rate of wrong region

0
5
10
15
20
−80 −75 −70 −65 −60 −55 −50 −45
prob
abili
ty [%
]
signal strength [dB]
0
5
10
15
20
−80 −75 −70 −65 −60 −55 −50 −45
prob
abili
ty [%
]
signal strength [dB]
Fig. 3: Examples for the matching of signal strength distributions of one access pointand adjacent clusters (good match on the left, bad match on the right hand side).
selections (also refer to Section 5.3). From the evaluated values, for our scenarios 0.51performs best in terms of quantitative error estimation. Using this similarity threshold,the real and the estimated position are in the same region in 90% of all cases. Addi-tionally, in half of the remaining cases, the real position is located in a cell directlyadjacent to the selected region. Only in 5% of all cases, the real position is somewhereelse. Therefore we have selected the value 0.51 as the similarity threshold for all furtherexperiments.
3.2 Leave Out Fingerprint
The leave out fingerprint algorithm estimates errors by evaluating positioning perfor-mance using only the data collected during the training phase.
The performance evaluation uses an (n-1) cross evaluation with the constraint ofconsidering only folds which contain data from a single fingerprint. This means that apositioning algorithm itself, for one current fingerprint, determines the closest matchamongst all other fingerprints (the other (n-1) folds). The result is a good indicator ofthe error that can occur if the data collected during the position determination phase isnoisy.
The position error result from this evaluation is used to compute an error map whereeach fingerprinted position is assigned an error estimate. In the position determinationphase the position estimated by the positioning algorithm is looked up in the error map,and the error estimate stored for the corresponding position is returned.
For each fingerprinted position p, the error map contains an error estimate that iscreated by the following four steps.
1. Create a radio map using all fingerprints except the one for position p.2. Run emulation using m samples as test data taken randomly from the fingerprint
for position p.3. Calculate the observed errors for the position estimates from the emulation.4. Calculate the error estimate for position p as the average plus two times the standard
deviation of all the observed m errors. This method for computing the error estimate

was selected because initial experiments showed that a conservative estimate givesthe best results.
As a final step when all error estimates have been calculated, the error map is aver-aged to filter out local variations. This is performed by assigning a new estimate to eachposition. The new estimate is calculated as 66% of the original estimate and 33% asthe average of the estimates for all neighboring fingerprints. We chose these parametersfor the weights because they provide a good balance between the error estimates forthe different fingerprint positions. In our evaluation this interpolation step increases theaccuracy of the algorithm by several percent.
3.3 Best Candidate Set
When an 802.11-based positioning algorithm estimates a position, it generally returnsonly the position of the fingerprint that offers the best match to the data collected inthe position determination phase. However, the best candidate set algorithm exploitsthe fact that positioning algorithms can return information about the second, third etc.best matches. The best candidate set algorithm uses the n best estimates returned froma positioning algorithm to estimate the expected position error. The rationale for usingthe n best estimates is based on the observation that positioning algorithms will oftenestimate a user to be at any of the nearby positions to his actual position. This is a resultof the fact that adjacent fingerprinted positions will often exhibit highly overlappingsignal strength properties while online samples similarly have sufficient signal strengthvariance to choose at random between close locations.
The best candidate set algorithm deduces an error estimate by computing the aver-age distance between the best estimate and the next (n−1) best estimates. The algorithmcontains the following steps:
1. Form the set of the n best estimates as outputted from an 802.11-based positioningalgorithm.
2. Compute the distance between the position of the best estimate and all the other(n− 1) best estimates.
3. Return the average distance as the estimated error.
In addition to using the average distance between the best and the (n − 1) nextbest estimates, we also tried two other options to compute an error estimate from thebest candidate set. The first option was to use the maximum distance between the bestestimate and any of the (n− 1) next best estimates. The second option was to computethe maximum distance between any two of the n best estimates. Both options led tomore conservative error estimates but they were also more sensitive to large positionestimation errors and increasing n. In effect, both options produced a higher proportionof large over-estimations when the performance of the positioning algorithm degradedor when the size of the best candidate set was increased. The average-distance approachin contrast handled these situations better. Using the average distance, it was foundthat n set to three gave the best overall performance. Higher values of n made theerror estimates more conservative while gradually decreasing performance due to theinclusion of more faraway positions.

3.4 Signal Strength Variance
Like most 802.11-based positioning systems, the systems selected for this paper areerror-prone to signal strength variations, because the position estimation process de-pends on probabilities or average values calculated on the signal strength samples.
The reasons for the variation of signal strength samples are two-fold: Firstly, small-scale effects and multi-path radio propagation cause signal strength values to vary sig-nificantly if the mobile device moves within the wavelength (for 802.11 the wavelengthis 12.5 centimeters). So, both during the training as well as during the position deter-mination phase, even if the mobile device is supposed to be static, small movementscan have a big impact on the measured signal strength. Secondly, movements in the sur-rounding of the mobile device in question (e.g., persons roaming around or doors beingautomatically opened or closed) cause radio signals to travel different ways which inconsequence causes the signal strength to fluctuate.
If the variance between different signal strength samples is high the probability thatthe actual closest fingerprint is selected is rather small, and a fingerprint far away mightreach a higher probability. The same is true for the average calculation, because theaverage value might differ if the variance between different signal strength samples ishigh. Therefore an increase in variance also increases the chance of position errors.
The idea of the signal strength variance algorithm is to estimate the position errorbased on the signal strength variance of the samples that are used in the position de-termination phase to compute a position estimate. The algorithm can be described asfollows:
1. For each access point that is part of the signal strength samples, find the largestsignal strength value (in dB).
2. Based on the largest signal strength value that is specific for a certain access point,subtract this value from all signal strength samples that are available for this givenaccess point.
3. For each access point calculate the signal strength variance for the calculated val-ues.
4. Average the signal strength variance values calculated for each access point to getan overall variance value. This variance value can be perceived as an indicator ofthe expected position error.
We also tried several other ways to calculate an overall signal strength variancevalue. However, this did not lead to an algorithm with better results than achieved withthe algorithm presented above.
3.5 Random Value
As a baseline and to make the results of our own algorithms better comparable, wealso implemented a simple random error estimation algorithm. This algorithm returns,independent of the supplied data, uniformly distributed random error estimates between0 and ten meters.

4 Experimental Setup and Methodology
In this section, we describe the experimental setup and the measurement methodologyused to evaluate the proposed algorithms.
4.1 Local Test Environments
We deployed our 802.11-based positioning systems in two different environments: Onthe second floor of the Hopper building on the campus of the University of Aarhusand on the second floor of the office building A5,B on the campus of the University ofMannheim.
The former one is a newly built office building consisting of many offices and a longhall (see Figure 4a). The area is covered by 23 access points from different vendors; onlyfive of these access points can be detected in at least half of the measurements. Nine far-off access points are even only detectable in less than ten percent of all measurements.The average number of access points contained in the fingerprints for this environmentis 6.9 while the average number contained in the samples used for positioning is 4.8.The 802.11-based positioning system covers an area of about 56 meters times 13 meters.
The latter environment is also situated in an office building and consists of manyoffices and three longer hallways (see Figure 4b). The area is covered by 25 accesspoints in total although our data shows that most of the access points only cover parts ofthe operation area. In fact, only two access points cover the operation area completely.On average, 14.7 access points are contained in each fingerprint for this environmentand 10.5 access points are contained in each set of measurements used for positioningduring the position determination phase. The operation area is nearly 57 meters wideand 32 meters long.
4.2 Hardware and Software Setup
As a client, we used a Lucent Orinoco Silver PCMCIA network card supporting 802.11b.This card was plugged into an IBM Thinkpad R51 laptop computer. To collect signalstrength samples, we used our own set of tools [15].
4.3 Data Collection
For both environments we applied a grid of reference spots with a grid spacing of1.5 meters to the operation areas. For the Hopper building this resulted in 225 referencespots while the Mannheim environment comprises 130 reference spots (see the blackmarkers in Figures 4a and 4b). For the former environment 120 signal strength mea-surements and for the latter one 110 signal strength measurements were subsequentlycollected at each reference spot.
For the position determination phase, we then selected 14 spots in the Hopper build-ing and 46 spots in the A5-B building. At each of these spots, we collected 110 signalstrength samples as well. In Figure 4a and Figure 4b, these spots are marked by lightgrey dots.

(a) The second floor of the Hopper building.
(b) The second floor of the A5-B building.
Fig. 4: The two test environments. The reference spots are marked in black and the testspots are depicted in light grey.
4.4 Metrics
Regarding the metric used to compare our error estimation algorithms, we use the errordistance difference. For each position estimate, we compute the physical distance be-tween the real and the estimated position (the real error) and then substract the resultfrom the value that our error estimation algorithms return as the expected error. By us-ing the error distance difference, it is e.g., easy for us to analyze whether our algorithmstend to estimate the position error too high or rather tend to estimate it too low.
4.5 Experimental Methodology
We performed an intense evaluation to analyze the properties of our four error estima-tion algorithms. To keep the results comparable, we examined the four algorithms inparallel. To achieve this, we used our suite of positioning-related tools [15] and modi-fied it to suit our special needs.
The basic experiment consists of the following steps: At first, one of the two usedpositioning algorithms is initialized with 25 randomly selected samples per referencespot to build up its fingerprint database. Subsequently, our four different error estima-tion algorithms are initialized as well. Those that make use of the training data areadditionally provided with exactly the same data as the positioning algorithm itself.The same is then done with the data for the position determination phase. At first, the

positioning algorithm – for each test position – is given five online samples to estimatea position. Afterwards, the same samples used for the position determination as well asalso the estimated position are provided to our error estimation algorithms. Each of thealgorithms then solely computes an error estimate which is recorded and stored for laterreference.
The values used for the number of training and position determination samples werechosen according to [7]. To achieve statistically stable results, we repeated our basicexperiment 100 times. We ran our basic experiment by using the positioning algorithmproposed by Bahl et al. [9] and the one proposed by Haeberlen at el. [10] on datacollected from both of our test environments.
As listed in Table 1, the position accuracy of the positioning algorithms by Bahlet al. [9] and Haeberlen at el. [10] is quite different when considering the data foreach of our two test environments. The main reason being the number of access points,the properties of the environments and the performance of the positioning algorithmsthemselves.
Table 1: Position accuracy for positioning algorithms and test environments.
Positioning Algorithm Aarhus [m] Mannheim [m]Bahl et al. [9] 8.10 2.90Haeberlen et al. [10] 3.79 2.56
5 Experimental Results
In this section, we present our evaluation results focusing on the results for the moreaccurate Haeberlen et al. positioning algorithm.
5.1 Estimation Accuracy
The proposed error estimation algorithms show noticeable differences in their singleperformances as well as in their reactions to different environmental conditions and tothe used positioning algorithms.
Overall, for the Aarhus dataset and with the Haeberlen et al. positioning algorithmthe fingerprint clustering approach delivers the best results (e.g. 1.13 meters at the me-dian) even though the second best algorithm, the best candidates set, is quite closeregarding the 95th percentile (see Figure 5a).
Looking at the Mannheim dataset, the situation has changed. Considering the 25th,50th, and 75th percentiles, the best candidates set algorithm now takes the lead with1.10 meters at the median (see Figure 5b). This impression is also confirmed when tak-ing a look at the average values for the error distance difference of the four algorithmsand the two environments (see Table 2). Here as well, the best candidates set algorithmperforms best for the Mannheim dataset at 1.45 meters while the fingerprint clusteringalgorithm is ahead for the Aarhus dataset at 2.24 meters.

0
2
4
6
8
10
12
Fingerprint ClusteringLeave Out Fingerprint
Best Candidates SetSignal Strength Variance
Random
erro
r di
stan
ce d
iffe
renc
e [m
]
25th 50th 75th 95th
(a) Aarhus dataset
0
2
4
6
8
10
12
Fingerprint ClusteringLeave Out Fingerprint
Best Candidates SetSignal Strength Variance
Random
erro
r di
stan
ce d
iffe
renc
e [m
]
25th 50th 75th 95th
(b) Mannheim dataset
Fig. 5: Overview of the performance of the different algorithms for the Aarhus as wellas for the Mannheim dataset using the positioning algorithm by Haeberlen et al.
The reason for these differences are the different properties of the datasets. For ex-ample, as listed in Section 4.5 the average positioning error for the Mannheim dataset isnoticeably lower mainly due to the on average higher number of access points available.As the fingerprint clustering algorithm tends to make very conservative error estima-tions, this leads – compared to the rather optimistic estimations of the best candidatesset algorithm – to the just introduced results.
The opposite is true for the Aarhus dataset. Here, due to the generally larger er-rors of the positioning algorithms, the fingerprint clustering algorithm can deliver thebest results while the other error estimation algorithms have difficulties especially withestimating outlying errors.
For the results with the positioning algorithm by Bahl et al. the error estimationalgorithms again perform best on the Mannheim data set. However, for this positioningalgorithm the fingerprint clustering algorithm has the best performance on both datasets with an average accuracy of 2.03 meters for the Mannheim data and 6.56 metersfor the Aarhus data. The reason that the result with the Aarhus data set is several timesworse is that the accuracy of the error estimation is impacted by the low average positionaccuracy of 8.10 meters in this case. However, when comparing the decrease in positionaccuracy and error estimation accuracy it can be noted that they are on the same scale.
5.2 Combining Algorithms
In addition to evaluating the accuracy of each algorithm we have investigated if accu-racy can be improved by combining the algorithms using a machine-learning algorithm.We used the Weka machine-learning toolkit [16] for our experiments. In order to feedthe output of our evaluations to Weka, we implemented a small Java program that readsthe evaluation results for the proposed error estimation algorithms and outputs an ARFFfile for the Weka tool. Before finally selecting a machine-learning method to use forcombining the results, we experimented with different methods, and concluded that the

Table 2: Average error distance difference for the Aarhus and the Mannheim datasetusing the positioning algorithm by Haeberlen et al.
Aarhus Dataset Mannheim DatasetAlgorithm Avg. Error [m] Std. Dev. [m] Avg. Error [m] Std. Dev. [m]Fingerprint Clustering 2.24 2.91 1.90 1.09Leave Out Fingerprint 4.68 3.53 1.95 1.47Best Candidates Set 3.06 2.61 1.45 1.26Signal Strength Variance 3.92 5.08 2.69 2.45Random 3.58 2.84 3.43 2.39
Least Median Squared Linear Regression method was most appropriate. This methoduses regression to learn weights for a linear model. The weights are learned from atraining set (e.g. either the Aarhus or Mannheim data set) and then the learned model istested using a test set (e.g. the set that was not used for training).
The results of different combinations of the proposed algorithms as well as test andtraining data are listed in Table 3. When combining error estimates of all the algorithmsand testing with the Mannheim data an average result of 1.37 meters is achieved whichis a marginal improvement over the 1.45 meters for the Best Candidate Set algorithmalone. When testing with Aarhus data the result is 2.40 meters which is a bit worse than2.24 meters for the fingerprint clustering algorithm alone. The table also lists resultswhen only the output of the best candidate set and fingerprint clustering algorithmsare combined. These results are only a few centimeters better on average than whencombining all algorithms. Given the small improvement, using a single algorithm seemslike a better option than combining several algorithms, especially when considering theadditional system complexity and increased computational requirements for runningseveral algorithms in parallel and then later combining their output.
Table 3: Results for different combinations of the proposed algorithms and test andtraining data for the positioning algorithm by Haeberlen et al.
Algorithms Training Dataset Test Dataset Avg. Error [m]All Aarhus Mannheim 1.37Two Best Aarhus Mannheim 1.35All Mannheim Aarhus 2.40Two Best Mannheim Aarhus 2.36
5.3 Over Estimation versus Under Estimation
Some applications might have preferences with respect to overestimation or underes-timation of position errors. For instance, an application that has to alert a user in casethe estimated error is above a threshold might prefer overestimation in order to avoidto not alert the user (false negatives). On the other hand, an application that sends the

user information about shops in his proximity might prefer an underestimation of theerror to avoid annoying the user with too many messages. In Figure 6 the error dis-tance difference distributions are depicted for the two most promising algorithms. Thepositioning system proposed by Haerberlen et al. is used and data for both test envi-ronments is displayed. In these distributions underestimations result in negative valueswhile overestimations lead to positive values. Our results show that the best candidatesset algorithm has a tendency to produce a higher amount of large overestimations. Also,when comparing the results for the Aarhus and Mannheim datasets, the distributions re-veal that both algorithms produce a higher amount of large under- and over-estimatesfor the less accurate Aarhus dataset.
Our proposed algorithms offer the possibility to adjust the error estimation perfor-mance to favour either under- or overestimation with algorithm-specific parameters.This comes at the expense of reliability, though. For example, for the best candidatesset algorithm, the size of the set can be varied. When considering more candidates inour evaluations, the number of errors that are underestimated decreases. But at the sametime, the amount of overestimation increases because more, possibly physically far dis-tinct positions are taken into account. The same is true for the fingerprint clusteringalgorithm. When adjusting the similarity threshold for the merging of clusters, the sizeof the resulting regions increases. This also increases the probability of the estimatedand real position being located in the same region. But at the same time it also increasesthe average error distance difference in our evaluations. Therefore, here again, we havea tradeoff between accuracy and reliability.
0
10
20
30
40
50
60
70
80
90
100
-10 -5 0 5 10
prob
abili
ty [
%]
error distance difference [m]
Best Cand. Set (Aarhus)Fing. Clust. (Aarhus)
Best Cand. Set (Mannheim)Fing. Clust. (Mannheim)
Fig. 6: Distributions of the difference between estimated and real error
6 Discussion
This section discusses the space and time complexity of the proposed algorithms, theinfluence of the number of position determination samples and the number of accesspoints on the error estimation, and the GPS approach for the dilution of precision.

6.1 Space and Time Complexity
Considering the space and time complexity of our algorithms, we have to distinguishbetween those operating only on the training data and those also taking the measure-ments during the position determination phase into account.
For the former ones, computational complexity is rather not critical as the algo-rithms need to be run on the training data only once. This can be done on powerfulsystems in advance of the deployment. The opposite is true for the space complexity.As the result of the algorithms, depending on the setup of the positioning system, mightbe stored and processed on the mobile device, here the amount of data is important.
For the latter ones, both space and time complexity are important. For each singleposition determination, a computation based on the current set of measurements as wellas the training data takes place. Considering that this might as well take place on amobile device, the algorithms have to be economical regarding CPU time and memoryconsumption. However, it turns out that both the fingerprint clustering and the bestcandidate set algorithms are light-weight in terms of computations and space use, pleaserefer to Table 4 for the details.
Table 4: Comparison of the space and time complexity for the proposed algorithms,where c is the number of initial cells, n is the number of fingerprints, p is the timecomplexity of the positioning algorithm, a is the number of access points in the onlinesamples, b is the size of the best candidate set and h is the number of stored samples.
Fingerprint Clustering Leave-Out Fingerprint Best Candidate Set Signal Strength VarianceTime complexity O(c) O(n ∗ p) O(b) O(a ∗ h)Space complexity O(c) O(n) O(b) O(a ∗ h)
6.2 Number of Position Determination Samples and Number of Access Points
From experimental results King et al. [7] conclude that the 802.11 position error ismainly determined by the number of access points and the number of signal strengthsamples used in the position determination phase. In this work, we do not present anyalgorithm that takes this fact explicitly into account. However, the previously presentedalgorithms indirectly adhere to this fact. For instance, the fingerprint clustering algo-rithm (see Section 3.1) when comparing similarity between clusters iterates over theset of access points and by such explicitly handles the number of access points. Thenumber of position determination samples is explicitly covered by the signal strengthvariance algorithm (see Section 3.4) as the variance value stabilizes if the number ofsignal strength samples increases. However, it would be an interesting path of futurework to analyze if the proposed algorithms could be extended to more explicitly usesuch results.

6.3 Dilution of Precision
In addition to the proposed algorithms, we have also implemented an algorithm thatcomputes a GPS-like DOP value based on the geometry of access points. The algo-rithm uses the equations for DOP values described in Borre et al. [17]. However, a DOPvalue is not an error estimate in meters but a factor that has to be combined with an errorestimate. Therefore we have evaluated if the accuracy of the proposed algorithms can beimproved by combining their output with a DOP value by multiplication. However, forall of the algorithms the combination with a DOP value strongly reduces their accuracy.This suggests that GPS-like DOP values do not seem to be a promising error estima-tion approach for indoor 802.11-based positioning. The main reason for that is that thecomplex indoor propagation environment makes the geometry of the access points lessimportant for the positioning accuracy than it is in the case of outdoor satellite-basedpositioning. This result is consistent with the analytical results for the impact of thegeometry of access points on the position accuracy presented by Wallbaum et al. [11].
7 Conclusion and Further Work
In this paper, we have introduced four novel algorithms to estimate the position errorof 802.11-based positioning systems. Our algorithms exploit several different featuresto fulfill their task. We have proposed error estimation algorithms that only use trainingdata as well as algorithms that take only the data available during the position determi-nation phase into account.
All our algorithms deliver good results for estimating the position error both for dif-ferent environments and for the different positioning algorithms. The fingerprint clus-tering algorithm and the best candidates set algorithm though perform especially well.With either of these two algorithms it is possible to estimate the position error of an802.11-based positioning system to a high degree of accuracy and with sufficient relia-bility. This is in contrast to the geometry-based algorithms used for GPS which fail towork for 802.11-based positioning systems.
We have evaluated if using a machine learning technique to combine several ofthe proposed algorithms can improve the precision of the error estimates. In our casethough, the gain is very small or the results even worsen. We therefore suggest not to useany combination of the different algorithms but rather use one algorithm alone. Lookingat the targeted use of the algorithms on mobile devices, this suggestion makes even moresense as the use of multiple algorithms – even though each single one economical interms of processing and storage demands – would waste precious resources.
This work opens up several paths of future work. Firstly, to analyze if the proposedalgorithms could be extended to more explicitly take information such as the number ofposition determination samples into account. Secondly, to further explore the relation-ship between algorithms for error estimation and analytical error models. Thirdly, theevaluated positioning algorithms were for reasons of analyzability not extended withadvanced methods such as tracking. Therefore, a further path of future research willbe to analyze how to optimize our algorithms when applying them to a positioningalgorithm that uses e.g., tracking.
References1. Kaplan, E., Hegarty, C., eds.: Understanding GPS: Principles and Applications. Second edn.
Artech House Incorporated (December 2005)2. LaMarca, A., Chawathe, Y., Consolvo, S., Hightower, J., Smith, I., Scott, J., Sohn, T.,
Howard, J., Hughes, J., Potter, F., Tabert, J., Powledge, P., Borriello, G., Schilit, B.: PlaceLab: Device Positioning Using Radio Beacons in the Wild. In: Proceedings of the ThirdInternational Conference on Pervasive Computing. (2005)
3. Cheng, Y.C., Chawathe, Y., LaMarca, A., Krumm, J.: Accuracy Characterization forMetropolitan-scale Wi-Fi Localization. In: Proceedings of the Third ACM InternationalConference on Mobile Systems, Applications, and Services. (2005)
4. Krumm, J., Cermak, G., Horvitz, E.: RightSPOT: A Novel Sense of Location for a Smart Per-sonal Object. In: Proceedings of the 5th International Conference on Ubiquitous Computing.(2003)
5. Institute for Electrical and Electronics Engineers, Inc.: ANSI/IEEE Standard 802.11: Wire-less LAN Medium Access Control (MAC) and Physical Layer (PHY) Specifications. Web-site: http://standards.ieee.org/getieee802/ (1999)
6. Bychkovsky, V., Hull, B., Miu, A., Balakrishnan, H., Madden, S.: A Measurement Studyof Vehicular Internet Access Using In Situ Wi-Fi Networks. In: Proceedings of the 12thInternational Conference on Mobile Computing and Networking. (2006)
7. King, T., Haenselmann, T., Effelsberg, W.: Deployment, Calibration, and Measurement Fac-tors for Position Errors in 802.11-based Indoor Positioning Systems. In: Proceedings of theThird International Symposium on Location- and Context-Awareness (LoCA). (2007)
8. Dearman, D., Varshavsky, A., de Lara, E., Truong, K.N.: An exploration of location errorestimation. In: Procedings of the Nineth Interational Conference on Ubiquitous Computing.(2007)
9. Bahl, P., Padmanabhan, V.N.: RADAR: An In-Building RF-based User Location and Track-ing System. In: Proceedings of the 19th Annual Joint Conference of the IEEE Computer andCommunications Societies. (2000)
10. Haeberlen, A., Flannery, E., Ladd, A.M., Rudys, A., Wallach, D.S., Kavraki, L.E.: PracticalRobust Localization over Large-Scale 802.11 Wireless Networks. In: Proceedings of theTenth ACM International Conference on Mobile Computing and Networking. (2004)
11. Wallbaum, M.: A priori error estimates for wireless local area network positioning systems.Pervasive Mobile Computing 3 (2007) 560–580
12. Kaemarungsi, K., Krishnamurthy, P.: Modeling of indoor positioning systems based on lo-cation fingerprinting. In: Proceedings of the 23th Annual Joint Conference of the IEEEComputer and Communications Societies. (2004)
13. Krishnakumar, A.S., Krishnan, P.: On the accuracy of signal strength-based estimation tech-niques. In: Proceedings of the 24th Annual Joint Conference of the IEEE Computer andCommunications Societies. (2005)
14. Youssef, M., Agrawala, A.: On the optimality of wlan location determination systems. In: InProceedings of the Communication Networks and Distributed Systems Modeling and Simu-lation Conference. (2004)
15. King, T., Butter, T., Lemelson, H., Haenselmann, T., Effelsberg, W.: Loc{lib,trace,eva,ana}:Research Tools for 802.11-based Positioning Systems. In: Proceddints of the ACM WiN-TECH. (2007)
16. Witten, I.H., Frank, E.: Data Mining: Practical Machine Learning Tools and Techniques,Second Edition (Morgan Kaufmann Series in Data Management Systems). Morgan Kauf-mann (2005)
17. Borre, K., Akos, D., Bertelsen, N., Rinder, P., Jensen, S.: A Software-Defined GPS andGalileo Receiver. Birkhuser (2007)