ert 426 bioprocess plant design ii - unimap portalportal.unimap.edu.my/portal/page/portal30/lecturer...
TRANSCRIPT

BY: MOHAMAD FAHRURRAZI TOMPANG SEM 2 11/12
ERT 426 BIOPROCESS
PLANT DESIGN II CHAPTER 7: PROFITABILITY ANALYSIS AND PROCESS OPTIMIZATION
Outline
Intro to CFD
Depreciation
Typical CFD for a new project
Profitability Criteria
Non-discounted
Discounted
Comparison of large projects
Evaluation of equipment alternatives
Retrofiting operations and incremental analysis
Using Capcost for profitability analysis
Intro: Cash Flow Diagrams
Represent timings and approximate magnitude of
investment on a cfd
x-axis is time and y-axis is magnitude
both positive and negative investments are possible.
In order to determine direction (sign) of cash flows,
we must define what system is being considered.
Consider a discrete Cash Flow Diagram
Discrete refers to individual cfds that are plotted
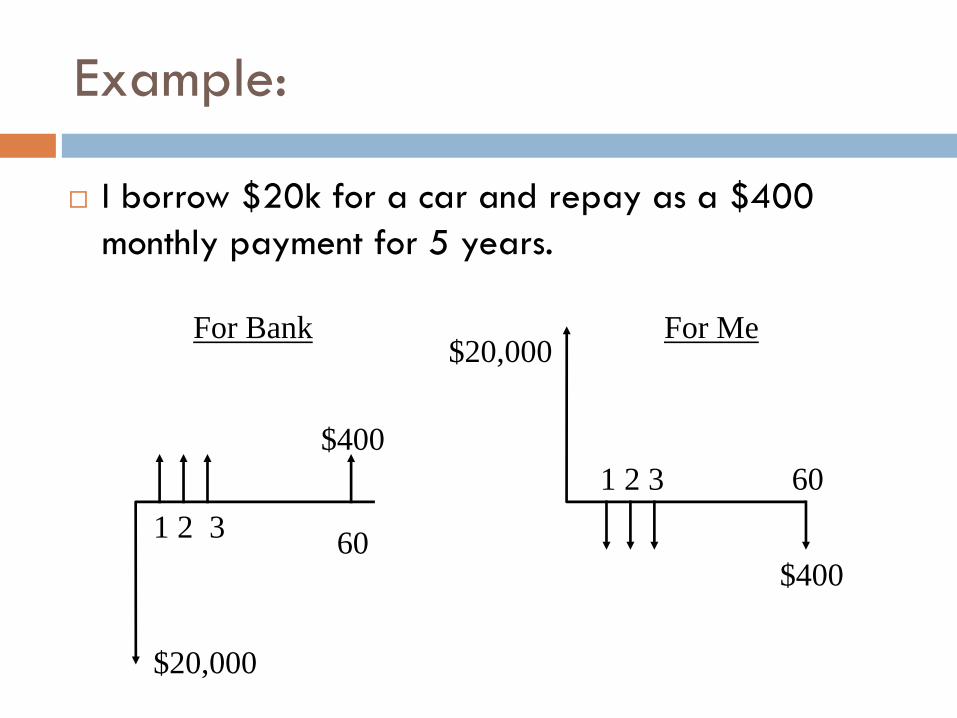
Example:
I borrow $20k for a car and repay as a $400
monthly payment for 5 years.
For Bank For Me
1 2 3
$400
60 3 2 1
$20,000
60
$400
$20,000
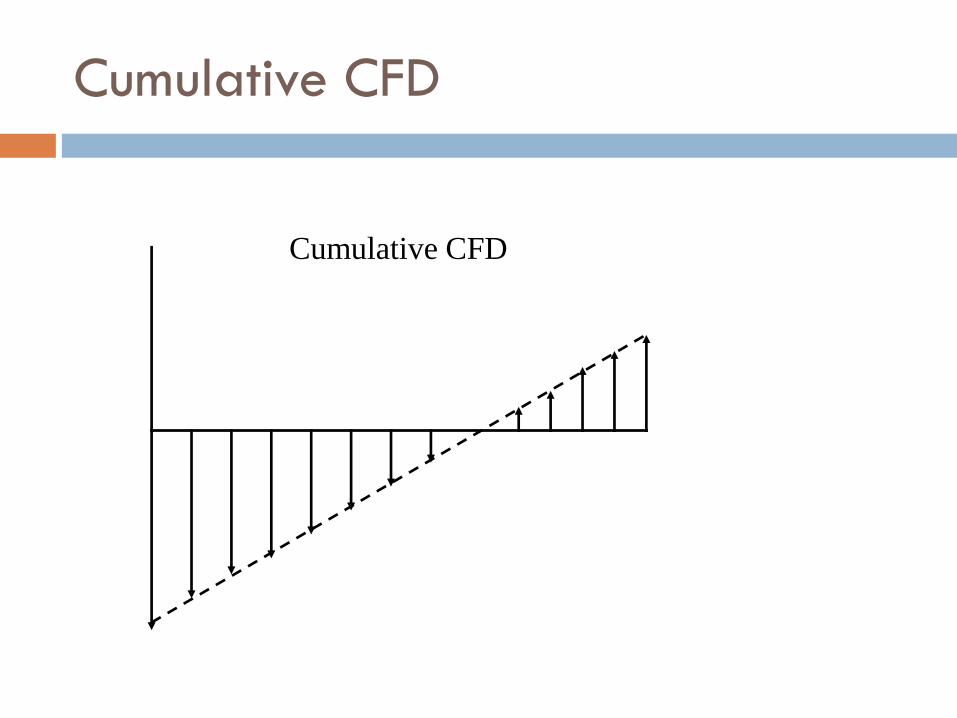
Cumulative CFD
Cumulative CFD

Depreciation of Capital Investment
The cash flows associated with the purchase and installation of equipment are expenses – negative cash flow in CFD
When plant is closed, equipment is salvaged – positive cash flow in CFD
The different between these costs represent capital depreciation
Government usually does not allow companies to charge full costs of the plant as one-time expense, but only fraction of capital depreciation to be charged as an operating expense each year

Fixed Capital, Working Capital and Land
Total Capital Investment (TCI) = Fixed Capital
+Working Capital
Fixed Capital
The costs associated with building the plant – CTM and CGR
Only land cannot be depreciated
Working Capital
The amount of capital required to start up the plant and
finance the 1st few months of operation before revenues
from the process start
It will be recovered at the end of project and typical value
are between 15%-20% of FCI

Different Types of Depreciation
Straight Line (SL) Depreciation Method
Double Declining Balance (DDB) Depreciation
Method
Modified Accelerated Cost Recovery System
(MACRS)
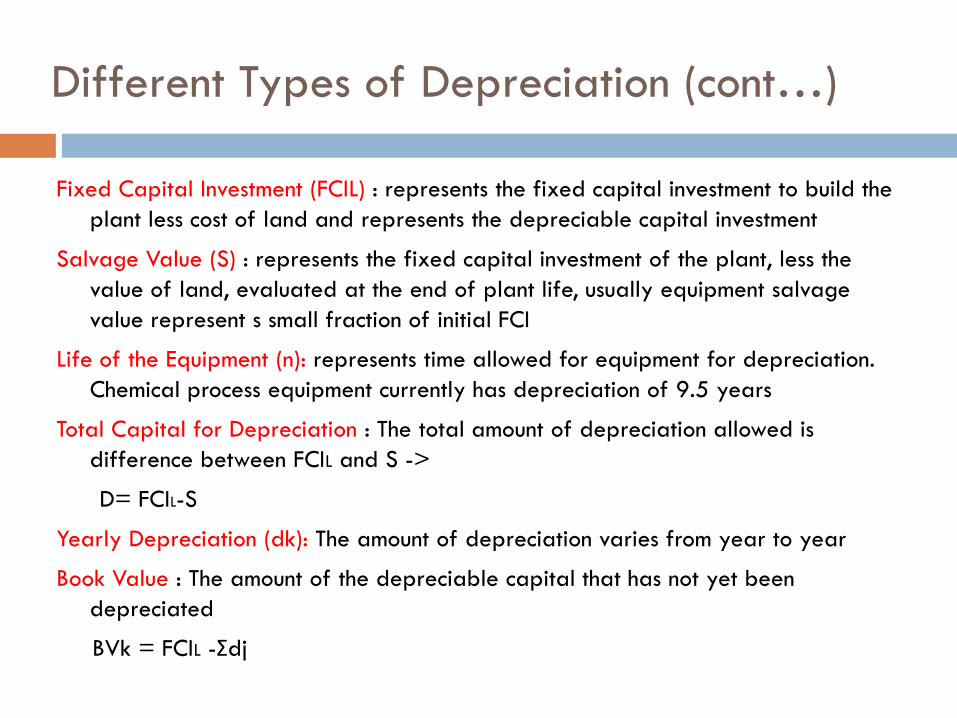
Fixed Capital Investment (FCIL) : represents the fixed capital investment to build the
plant less cost of land and represents the depreciable capital investment
Salvage Value (S) : represents the fixed capital investment of the plant, less the
value of land, evaluated at the end of plant life, usually equipment salvage
value represent s small fraction of initial FCI
Life of the Equipment (n): represents time allowed for equipment for depreciation.
Chemical process equipment currently has depreciation of 9.5 years
Total Capital for Depreciation : The total amount of depreciation allowed is
difference between FCIL and S ->
D= FCIL-S
Yearly Depreciation (dk): The amount of depreciation varies from year to year
Book Value : The amount of the depreciable capital that has not yet been
depreciated
BVk = FCIL -Σdj
Different Types of Depreciation (cont…)
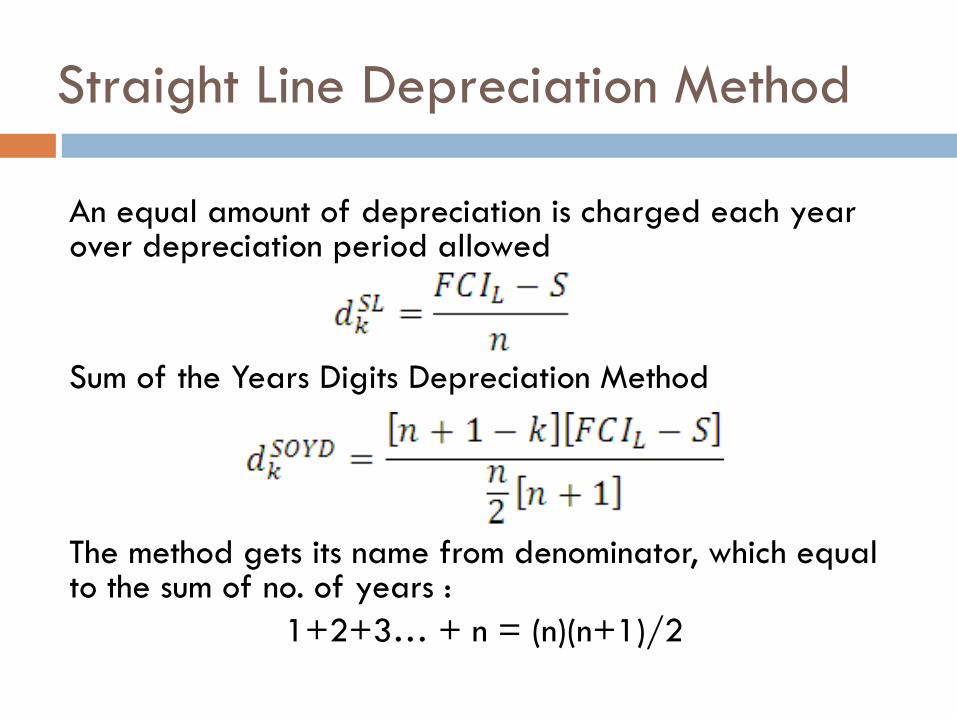
Straight Line Depreciation Method
An equal amount of depreciation is charged each year over depreciation period allowed
Sum of the Years Digits Depreciation Method
The method gets its name from denominator, which equal to the sum of no. of years :
1+2+3… + n = (n)(n+1)/2
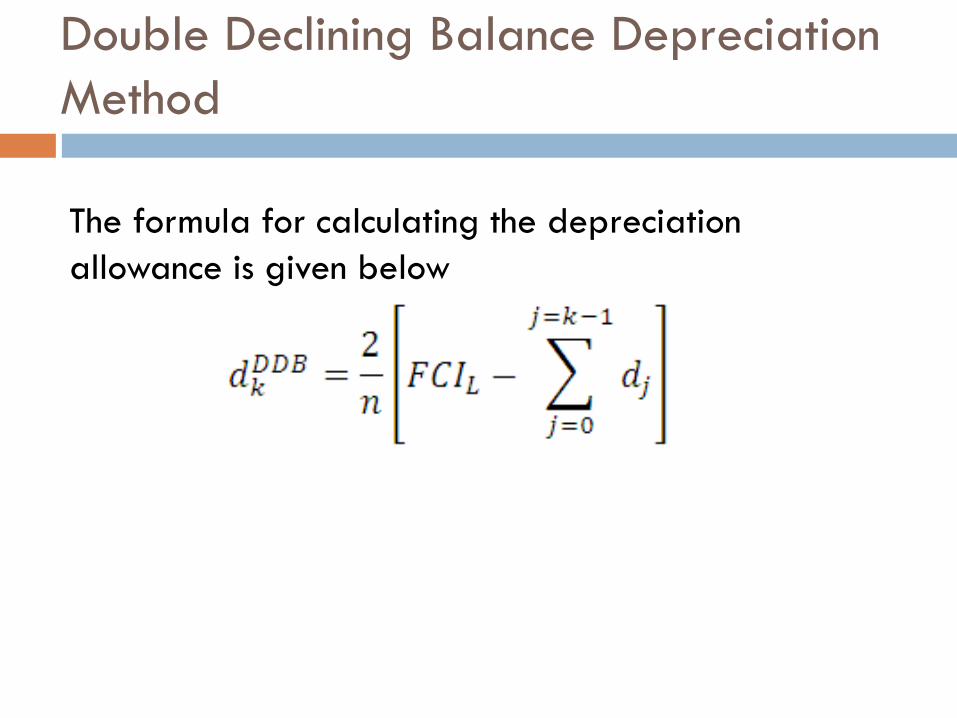
Double Declining Balance Depreciation
Method
The formula for calculating the depreciation
allowance is given below
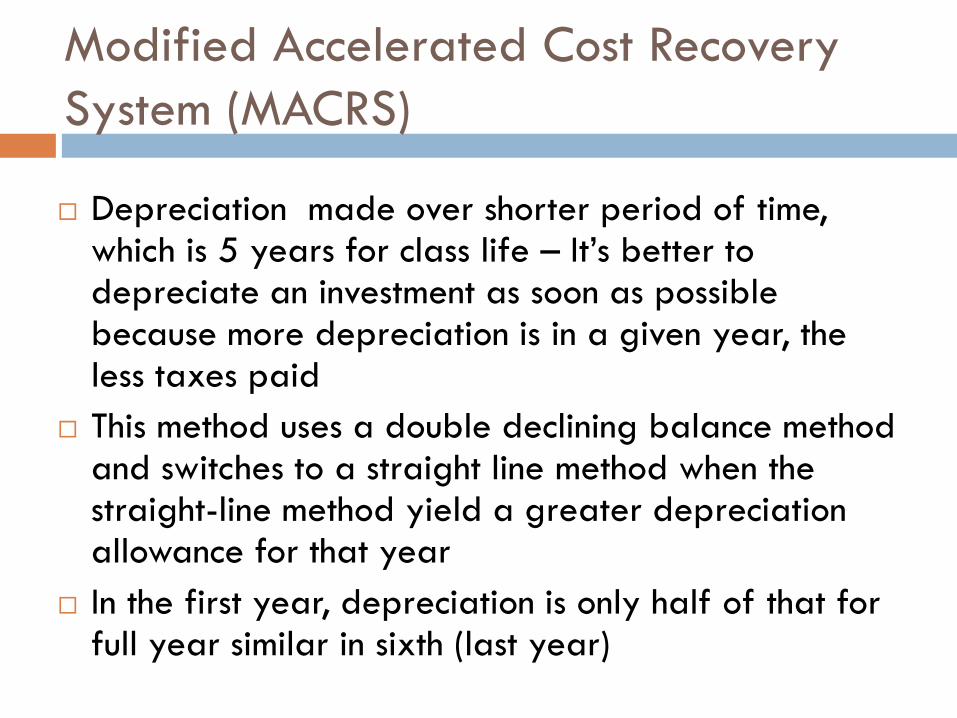
Modified Accelerated Cost Recovery
System (MACRS)
Depreciation made over shorter period of time, which is 5 years for class life – It’s better to depreciate an investment as soon as possible because more depreciation is in a given year, the less taxes paid
This method uses a double declining balance method and switches to a straight line method when the straight-line method yield a greater depreciation allowance for that year
In the first year, depreciation is only half of that for full year similar in sixth (last year)

For DDB,
For SL,
Modified Accelerated Cost Recovery
System (MACRS) (cont…)

Cash Flows for a New Project
1. Purchase Land
2. Build Plant (1 – 3 years typically)
3. Plant start-up - working capital
4. Plant produces product and revenue
a. Depreciate capital over first 5 years
b. Plant operates for some period of time – time over which profitability analysis is performed
5. At the end of the project working capital, land, and salvage value are recovered
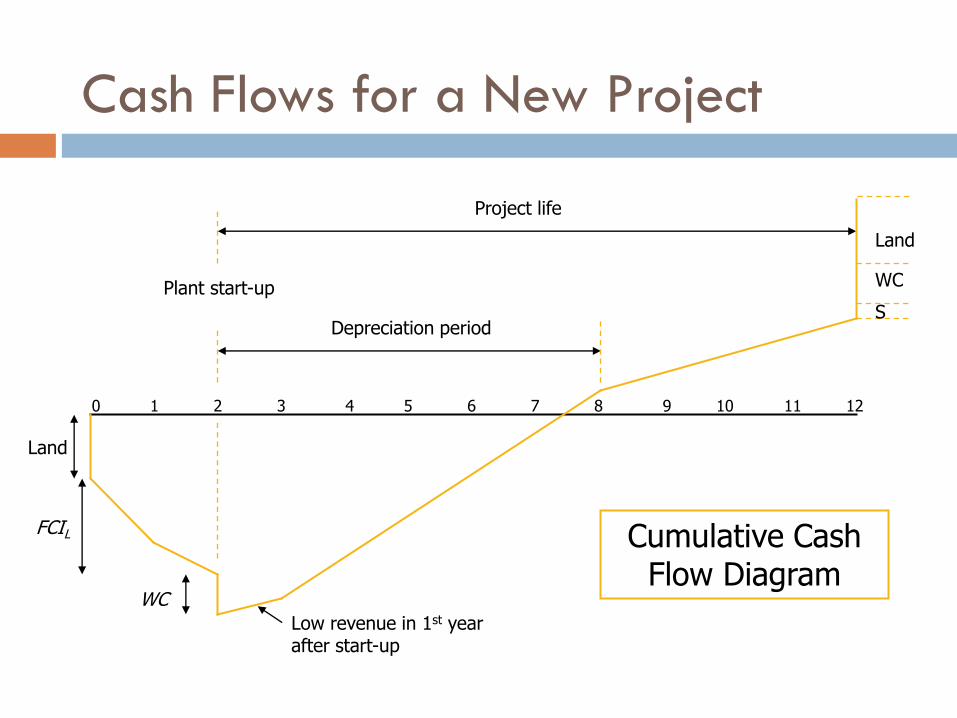
Cash Flows for a New Project
0 1 2 3 4 5 6 7 8 9 10 11 12
Land
FCIL
WC
Plant start-up
Depreciation period
Project life
Land
WC
S
Cumulative Cash Flow Diagram
Low revenue in 1st year after start-up
Non-discounted Profitability Criteria
3 Bases for Profitability
• Time
• Cash
• Interest Rate

Non-discounted Profitability Criteria
Time Criterion : The term used for this criterion is the payback
period (PBP)
PBP = time required, after start-up, to recover the FCIL, for the
project
Cash Criterion : The criterion used here is cumulative cash position
(CCP). Because CCP depends on the size of project, it is better to
use the cumulative cash ratio, CCR.
Sum of all Positive Cash Flows1
Sum of all Negative Cash Flows Land L
CCPCCR
WC FCI

Interest Rate Criterion : The criterion used here is
called the rate of return on investment (ROROI) and
represents the non-discounted rate from FCI:
Non-discounted Profitability Criteria
(cont…)
Average Annual Net Profit
Fixed Capital Investment ( )L
ROROIFCI
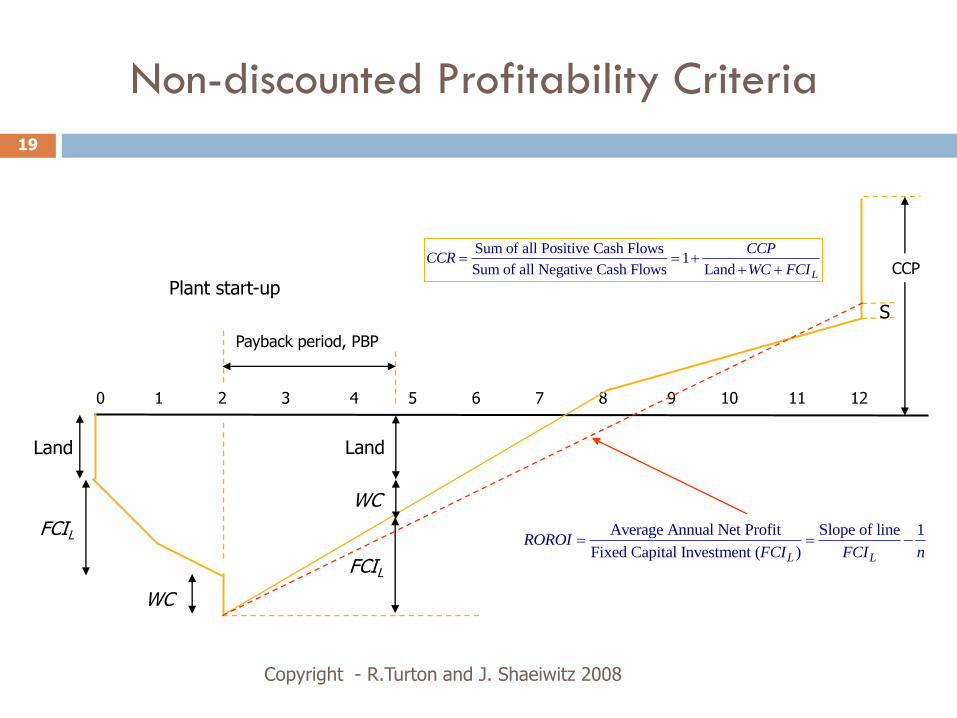
Non-discounted Profitability Criteria
Average Annual Net Profit Slope of line 1
Fixed Capital Investment ( )L L
ROROIFCI FCI n
Sum of all Positive Cash Flows1
Sum of all Negative Cash Flows Land L
CCPCCR
WC FCI
19
Copyright - R.Turton and J. Shaeiwitz 2008
0 1 2 3 4 5 6 7 8 9 10 11 12
Land
FCIL
WC
Plant start-up
S
FCIL
WC
Land
Payback period, PBP
CCP

Example 10.1
A new chemical plant is going to be built and will require the following capital investment (all figures are RM million)
Cost of land, L = RM10.0
Total FCIL = RM 150.0
FCI during year 1 = RM 90.0
FCI during year 2 = RM 60.0
Plant start-up at end year 2, working capital = 20% of FCIL = (0.2)(150) = RM 30.0 end year 2
Sales revenues and costs of manufacturing are given below:
Yearly sales revenue = RM 75.0 per year
COMd = RM 30 per year
Taxation rate, t = 45%
Salvage value, S = RM 10.0
Depreciation use 5 years of MARCS
Assume a project life of 10 years
Calculate each nondiscounted profitability criteria for this plant

Nondiscounted After-Tax Cash Flows

Cumulative Cash Flow Diagram for Non-
discounted After-Tax Cash Flows

Discounted Profitability Criteria
For this type of analysis, we discount all the cash
flows back to time zero. This puts all the
investments and other cash flows on an equal
footing.
For large capital projects, e.g., new plants or
significant additions, discounted criteria are
always used

Discounted Profitability Criteria
(cont…)
Time Criterion : The discounted payback period (DPBP)is defined
in a manner similar to the non-discounted version given above:
DPBP = time required, after start-up, to recover the FCIL,
required for the project, with all cash flows discounted
back to time zero
Cash Criterion : The discounted cumulative cash position, more
commonly known as the net present value (NPV) or net present
worth (NPW) ;
NPV replacing CCP and PVR replacing CCR
Cumulative discounted cash position at the end of the project
Present Value of all Positive Cash Flows
Present Value of all Negative Cash Flows
NPV
PVR

Interest Rate Criterion : The discounted cash flow rate
of return (DCFROR) is defined to be the interest rate
at which all the cash flows must be discounted in
order for the net present value of the project to be
equal to zero
DCFROR = Interest or Discount Rate for which the Net
Present Value of the project is equal to
zero
Discounted Profitability Criteria
(cont…)

Discounted Profitability Criteria
Example 10.1 (all figures in millions of RM)
Land = 10
FCIL = 150 (year 1 = 90 and year 2 = 60)
WC = 30
R = 75
COMd = 30
t = 45%
S = 10
Depreciation = MACRS over 5 years
Project life, n = 10 years after start-up
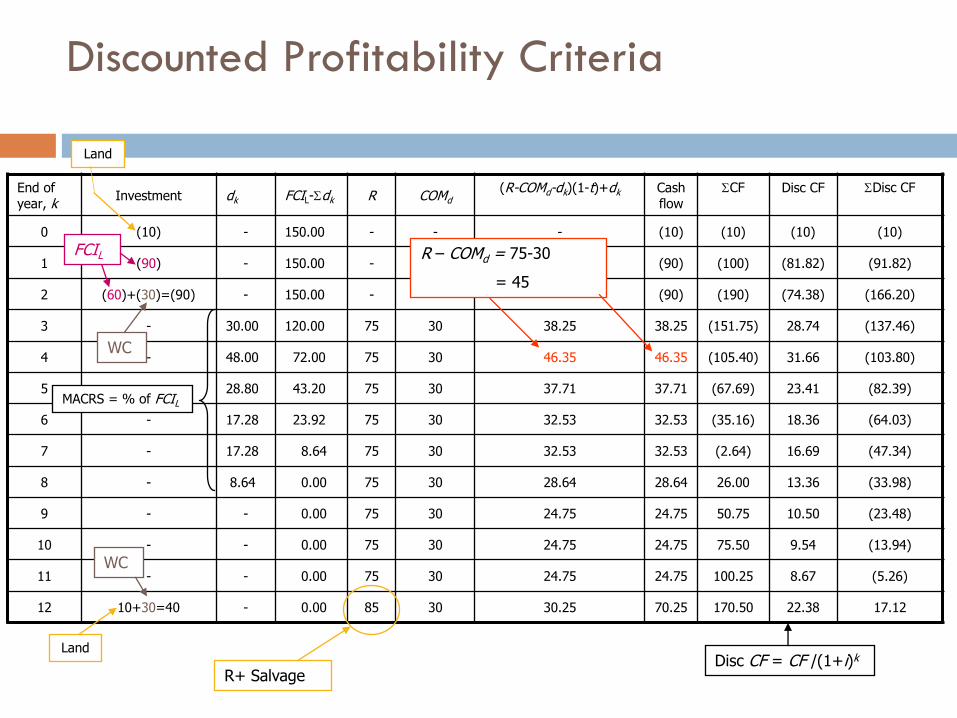
Discounted Profitability Criteria
End of year, k
Investment dk FCIL-Sdk R COMd (R-COMd-dk)(1-t)+dk Cash
flow
SCF Disc CF SDisc CF
0 (10) - 150.00 - - - (10) (10) (10) (10)
1 (90) - 150.00 - - - (90) (100) (81.82) (91.82)
2 (60)+(30)=(90) - 150.00 - - - (90) (190) (74.38) (166.20)
3 - 30.00 120.00 75 30 38.25 38.25 (151.75) 28.74 (137.46)
4 - 48.00 72.00 75 30 46.35 46.35 (105.40) 31.66 (103.80)
5 - 28.80 43.20 75 30 37.71 37.71 (67.69) 23.41 (82.39)
6 - 17.28 23.92 75 30 32.53 32.53 (35.16) 18.36 (64.03)
7 - 17.28 8.64 75 30 32.53 32.53 (2.64) 16.69 (47.34)
8 - 8.64 0.00 75 30 28.64 28.64 26.00 13.36 (33.98)
9 - - 0.00 75 30 24.75 24.75 50.75 10.50 (23.48)
10 - - 0.00 75 30 24.75 24.75 75.50 9.54 (13.94)
11 - - 0.00 75 30 24.75 24.75 100.25 8.67 (5.26)
12 10+30=40 - 0.00 85 30 30.25 70.25 170.50 22.38 17.12
27 Disc CF = CF /(1+i)k
Land
Land
FCIL
WC
WC
MACRS = % of FCIL
R+ Salvage
R – COMd = 75-30
= 45
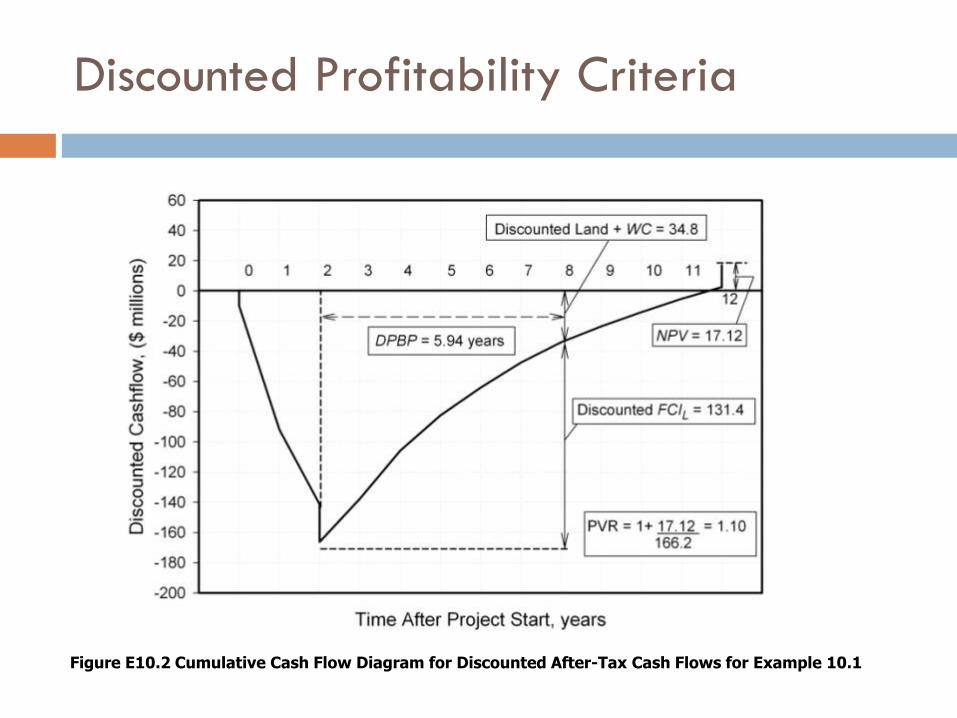
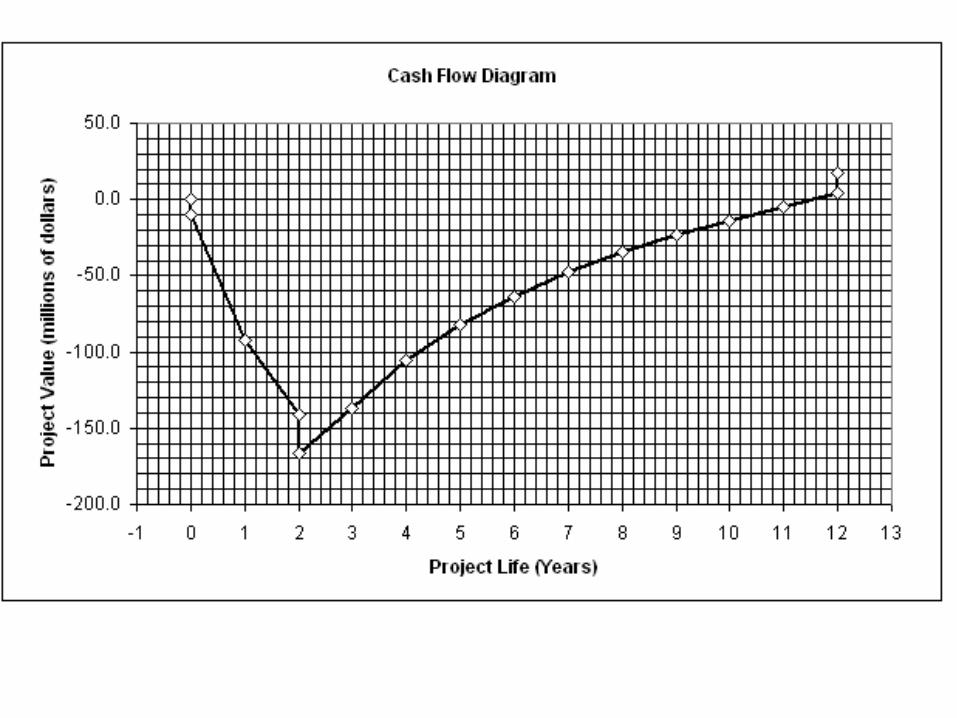
Discounted Profitability Criteria
28 Figure E10.2 Cumulative Cash Flow Diagram for Discounted After-Tax Cash Flows for Example 10.1

Discounted Profitability Criteria
End of year, k
Investment dk FCIL-Sdk R COMd (R-COMd-dk)(1-t)+dk Cash
flow
SCF Disc CF SDisc CF
0 (10) - 150.00 - - - (10) (10) (10) (10)
1 (90) - 150.00 - - - (90) (100) (81.82) (91.82)
2 (60)+(30)=(90) - 150.00 - - - (90) (190) (74.38) (166.20)
3 - 30.00 120.00 75 30 38.25 38.25 (151.75) 28.74 (137.46)
4 - 48.00 72.00 75 30 46.35 46.35 (105.40) 31.66 (103.80)
5 - 28.80 43.20 75 30 37.71 37.71 (67.69) 23.41 (82.39)
6 - 17.28 23.92 75 30 32.53 32.53 (35.16) 18.36 (64.03)
7 - 17.28 8.64 75 30 32.53 32.53 (2.64) 16.69 (47.34)
8 - 8.64 0.00 75 30 28.64 28.64 26.00 13.36 (33.98)
9 - - 0.00 75 30 24.75 24.75 50.75 10.50 (23.48)
10 - - 0.00 75 30 24.75 24.75 75.50 9.54 (13.94)
11 - - 0.00 75 30 24.75 24.75 100.25 8.67 (5.26)
12 10+30=40 - 0.00 85 30 30.25 70.25 170.50 22.38 17.12
29

Discounted Profitability Criteria
30
Figure 10.3 Discounted Cumulative Cash Flow Diagrams using Different Discount Rates for Example 10.3

Comparing Several Large Projects
Initial Investment NPV DCFROR
Project A RM 60 11.9 14.3%
Project B RM120 15.2 12.9%
Project C RM100 15.9 13.3%
31
When comparing projects with large capital investments, the question becomes what criterion should we use to discriminate between alternatives?
Consider the following example (Figures are in RM millions)
The capital limit for this year is RM120 million so we may only choose A or B or C. Which is best?

Comparing Several Large Projects
After tax cash
i = 1
flow in year i
i = 2 - 10
Initial Investment
NPV DCFROR
Project A 10 12 RM 60 11.9 14.3%
Project B 22 22 RM120 15.2 12.9%
Project C 12 20 RM100 15.9 13.3%
32
When comparing projects with large capital investments, the question becomes what criterion should we use to discriminate between alternatives?
Consider the following example using a hurdle rate i = 10%(Figures are in RM millions)
The capital limit for this year is RM120 million so we may only choose A or B or C. Which is best?

Comparing Several Large Projects
33
Start with lowest capital investment – Project A – NPV is positive so this is a viable investment.
Compare incremental investment in going from Project A to Project C (the next largest investment case)
D investment = RM100 – RM60 = RM40
Dcash flow = RM12 - RM10 = RM2 for year 1
= RM20 – RM12 = RM8 for years 2 – 10
DNPV = -40 + 2(P/F, 0.1, 1) + 8(P/A, 0.1, 9)(P/F, 0.1, 1) = RM3.7 DDCFROR = 11.9%
Because the incremental investment has a +ve DNPV – Project C is better than Project A.

Comparing Several Large Projects
34
Basically what we have just compared is the following:
Case 1 – Invest RM60 in Project A and RM40 at a rate of 10%
Case 2 – Invest RM100 in Project C
Since C is better than A, we now compare C with the next largest investment – Project B D investment = RM120 – RM100 = RM20
D cash flow = RM22 - RM12 = RM10 for year 1
= RM22 – RM20 = RM2 for years 2 – 10 NPV = -20 + 10(P/F, 0.1, 1) + 2(P/A, 0.1, 9)(P/F, 0.1, 1) = -RM0.4 DDCFROR = 9.4% Because the incremental investment has a -ve DNPV – Project C is better than Project B
Therefore, Project C is the best.
Comparing Several Large Projects
35
When comparing large, mutually exclusive projects the appropriate
criterion is choosing the project with the highest NPV.
Evaluation of Equipment Alternatives
36
Here we consider equipment alternatives for a vital service – this means that one of the alternatives must be purchased and operated. However, alternatives are always available. The usual trade-offs are a higher capital investment for a piece of equipment that will either last longer (longer equipment life – better corrosion resistance) or that is cheaper to operate.
When comparing equipment with equal lives, a simple NPV comparison is appropriate.

Evaluation of Equipment Alternatives – Equal
Equipment Lives
Alternative Initial Investment Yearly Operating Cost
A -Air-cooled Condenser RM23,000 RM1,500
B - Water-cooled Condenser RM12,000 RM3,000
37
Example
The following equipment alternatives are suggested for an overhead condenser. The service lives for the two alternatives are expected to be the same (12 years) and the internal rate of return for such comparisons is set at 10% pa.

Evaluation of Equipment Alternatives
Alternative Initial Investment Yearly Operating Cost
A - Air-cooled Condenser RM23,000 RM1,500
B - Water-cooled Condenser RM12,000 RM3,000
38
Alternative A
NPV = -23,000 – 1,500(P/A, 0.10, 12) = -RM33,200 Alternative B
NPV = -12,000 – 3,000(P/A, 0.10, 12) = -RM32,400

Evaluation of Equipment Alternatives – Unequal
Equipment Lives
39
When the service lives for alternative equipment choices are different then NPV cannot be used. There are three methods to evaluate alternative equipment with unequal lives:
• Capitalized Cost Method
• Common Denominator Method
• Equivalent Annual Operating Cost Method (EAOC)
The ranking of alternatives does not depend on which method is chosen. So just choose one of them - EAOC
Evaluation of Equipment Alternatives – Unequal
Equipment Lives
(1 )( / , , )
(1 ) 1
n
n
i iA P i n
i
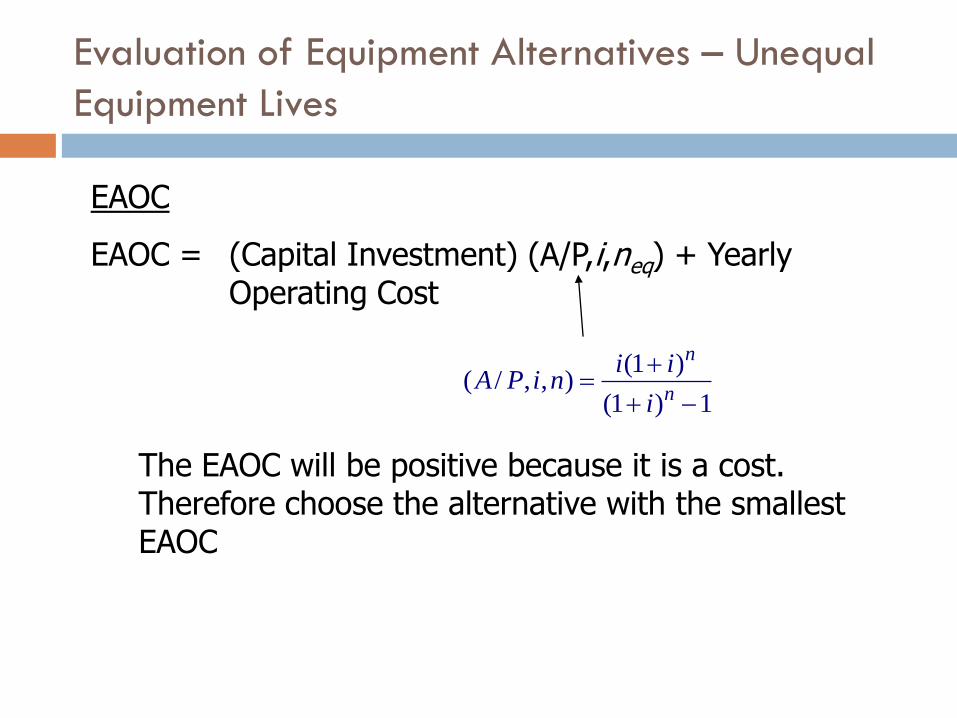
EAOC
EAOC = (Capital Investment) (A/P,i,neq) + Yearly Operating Cost
The EAOC will be positive because it is a cost. Therefore choose the alternative with the smallest EAOC

Evaluation of Equipment Alternatives – Unequal
Equipment Lives
Alternative Capital Investment
Yearly operating cost
Equipment life, years
A – carbon steel RM 8,000 RM 1,800 4
B – stainless steel RM16,000 RM 1,600 7
41
Example
Two pumps are considered for a corrosive service. The yearly operating costs include utility and maintenance costs. Which alternative is best if the internal hurdle rate for these types of projects is 8% pa?

Evaluation of Equipment Alternatives –
Unequal Equipment Lives
Alternative Capital Investment
Yearly operating cost
Equipment life, years
A – carbon steel RM 8,000 RM 1,800 4
B – stainless steel RM16,000 RM 1,600 7
4
4
0.08(1.08)8,000 1,800 $4,220per year
1.08 1AEAOC
7
7
0.08(1.08)16,000 1,600 $4,670per year
1.08 1BEAOC
42
Example

Retrofitting Operations – Incremental Analysis
(non-discounted)
Incremental Yearly Savings
Incremental InvestmentROROII
Incremental Investment
Increemntal Yearly SavingsIPBP
Non-discounted methods
Rate of Return on Incremental Investment (ROROII)
Incremental Payback period (IPBP)
Retrofitting Operations – Incremental Analysis
(non-discounted)
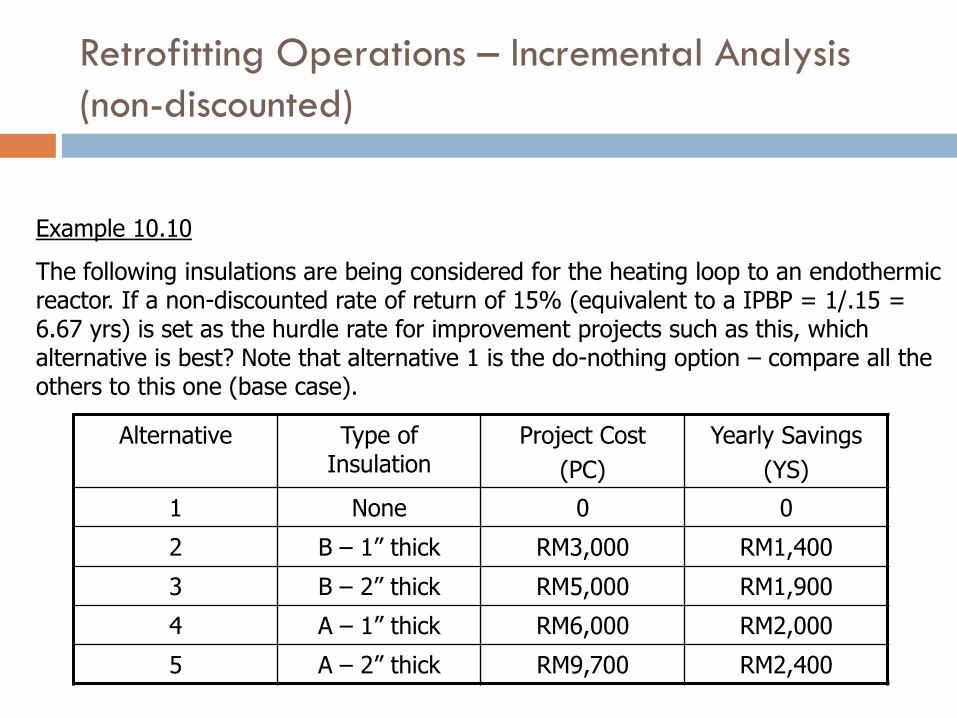
Alternative Type of Insulation
Project Cost
(PC)
Yearly Savings
(YS)
1 None 0 0
2 B – 1” thick RM3,000 RM1,400
3 B – 2” thick RM5,000 RM1,900
4 A – 1” thick RM6,000 RM2,000
5 A – 2” thick RM9,700 RM2,400
Example 10.10
The following insulations are being considered for the heating loop to an endothermic reactor. If a non-discounted rate of return of 15% (equivalent to a IPBP = 1/.15 = 6.67 yrs) is set as the hurdle rate for improvement projects such as this, which alternative is best? Note that alternative 1 is the do-nothing option – compare all the others to this one (base case).
Retrofitting Operations – Incremental Analysis
(non-discounted)
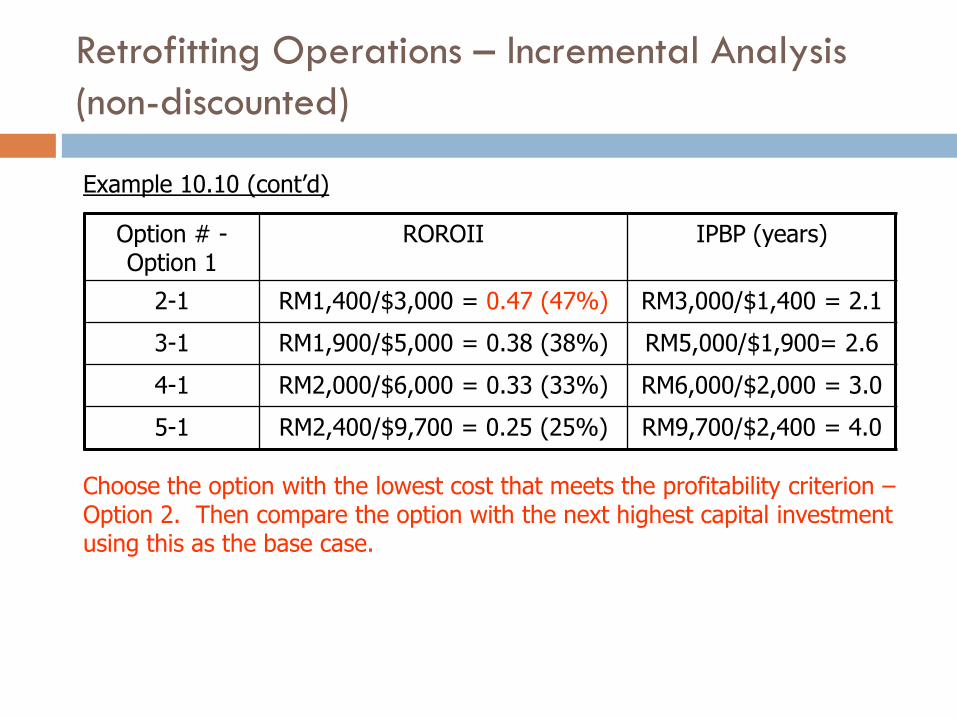
Option # - Option 1
ROROII IPBP (years)
2-1 RM1,400/$3,000 = 0.47 (47%) RM3,000/$1,400 = 2.1
3-1 RM1,900/$5,000 = 0.38 (38%) RM5,000/$1,900= 2.6
4-1 RM2,000/$6,000 = 0.33 (33%) RM6,000/$2,000 = 3.0
5-1 RM2,400/$9,700 = 0.25 (25%) RM9,700/$2,400 = 4.0
45
Example 10.10 (cont’d)
Choose the option with the lowest cost that meets the profitability criterion – Option 2. Then compare the option with the next highest capital investment using this as the base case.

Retrofitting Operations – Incremental Analysis
(non-discounted)
Option 3 - Option 2
ROROII IPBP (years)
3-2 (1,900-1400)/(5,000-3,000) = 0.25 (25%)
RM2,000/$500 = 4
Copyright - R.Turton and J. Shaeiwitz 2008
Example 10.10 (cont’d)
Since by moving from Option 2 to Project 3, the profitability criterion is
met, make Option 3 the new base case. Then compare other options with the new base case.

Retrofitting Operations – Incremental Analysis
(non-discounted)
Option # - Option 3
ROROII IPBP (years)
4-3
(2,000-1,900)/(6,000-5,000) = 0.1 (10%)
RM1,000/$100 = 10
5-3 (2,400-1,900)/(9,700-5,000) = 0.106 (10.6%)
RM4,700/$500 = 9.4
Example 10.10 (cont’d)
Since neither of the incremental investments in going from Option 3 to Options 4 or 5 meet the profitability criterion – Option 3 is the best.
Note that decisions may be made using either 15% or 6.67 yrs as the profitability criterion.

Retrofitting Operations – Incremental Analysis
(discounted)
Discounted Method
Determine the incremental NPV or EAOC for each option (compared to the do-nothing alternative) and choose the alternative with the highest NPV or Lowest EAOC (highest negative value).

Retrofitting Operations – Incremental Analysis
(discounted)
Option # - Option 1 INPV = -PC +(P/A, i, n)YS
2-1 = - 3,000 + [(1.1)5-1]/[(.1)(1.1)5](1,400) = RM2,307
3-1 = -5,000+(3.79)(1900) = RM2,201
4-1 = -6,000+(3.79)(2,000) = RM1,580
5-1 = -9,700+(3.79)(2,400) = -RM 604
Example 10.10 revisited using a project life of 5 years and a discounted hurdle rate of 10% pa (this is different than shown in the textbook in Example 10.13)
Because Option 2 has the highest NPV with respect to the do-nothing Option 1, Option 2 is best.

Retrofitting Operations – Incremental Analysis
(discounted)
Option # - Option 1 EAOC = PC(A/P, i, n) - YS
2-1 = (3,000) [(.1)(1.1)5]/[(1.1)5-1] - 1,400 = -RM 609
3-1 = (5,000)(0.2638) - 1,900 = - RM 581
4-1 = (6,000)(0.2638) - 2,000 = - RM 417
5-1 = (9,700)(0.2638) - 2,400 = RM 158
Copyright - R.Turton and J. Shaeiwitz 2008
Example 10.10 revisited using a project life of 5 years and a discounted hurdle rate of 10% pa (this is different than shown in the textbook in Example 10.13)
Because Option 2 has the most negative EAOC with respect to the do nothing Option 1, Option 2 is best. This result is exactly the same as obtained with the INPV analysis.

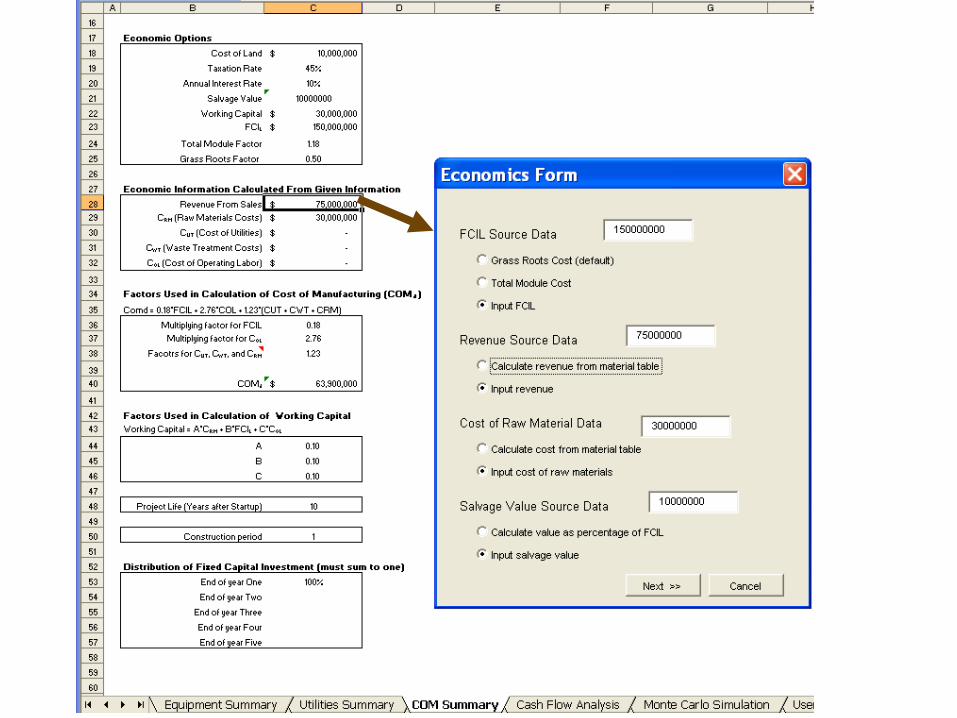
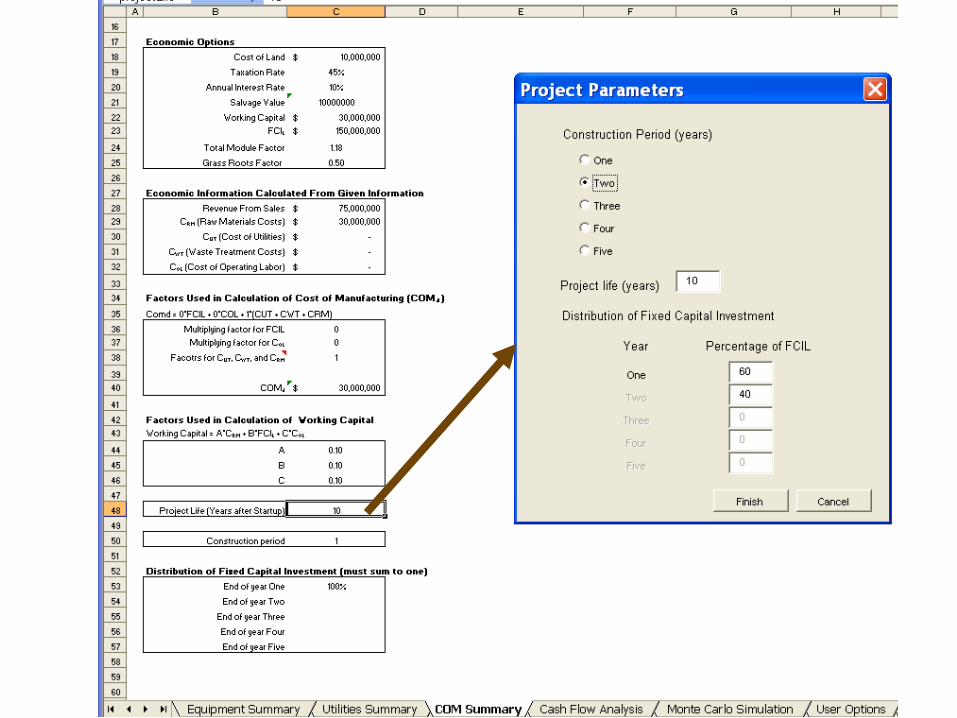
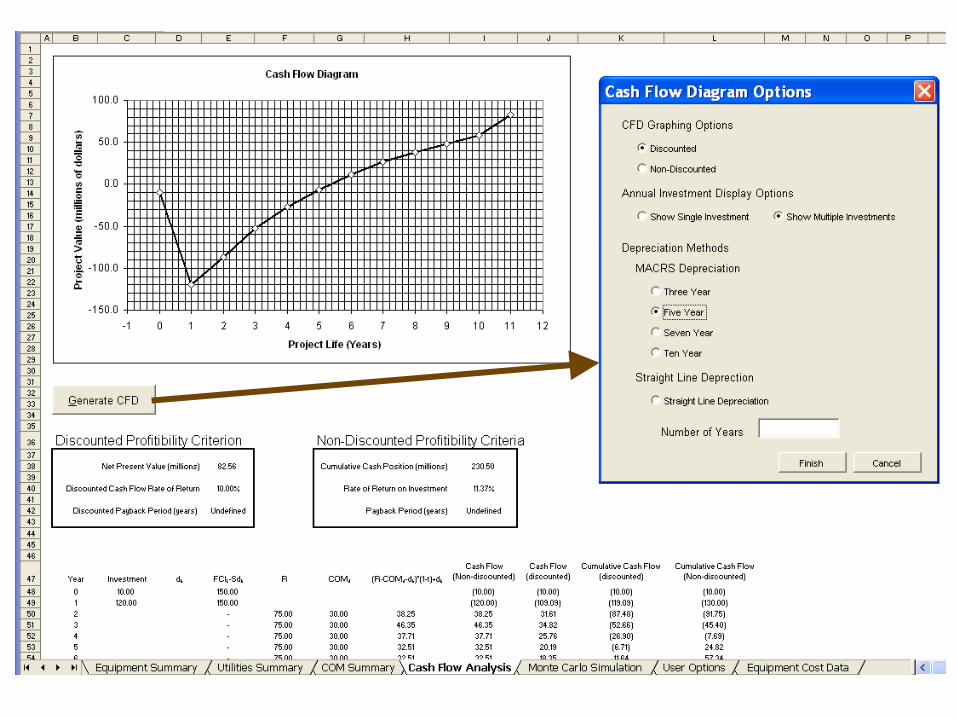
Using CAPCOST for Profitability Calculations
Go to COM summary worksheet
Rework Example 10.1 using CAPCOST Land = 10 FCIL = 150 (year 1 = 90 and year 2 = 60) WC = 30 R = 75 COMd = 30 t = 45% S = 10 Depreciation = MACRS over 5 years Project life, n = 10 years after start-up Discount (interest) rate = 10%
52
Copyright - R.Turton and J. Shaeiwitz 2008
53
Copyright - R.Turton and J. Shaeiwitz 2008
54
Copyright - R.Turton and J. Shaeiwitz 2008
55
Copyright - R.Turton and J. Shaeiwitz 2008

56
Copyright - R.Turton and J. Shaeiwitz 2008

Summary
Both non-discounted and discounted profitability measures were introduced each given as either a time, a cash, or an interest rate basis. For large projects, discounted techniques should always be used
For retrofit projects an incremental analysis should be used
For equipment evaluations either EAOC or NPV may be used
Capcost can be used to evaluate the profitability of large capital projects