eruption time series statistically examined: probabilities...
TRANSCRIPT
Journal of Volcanology and Geothermal Research 193 (2010) 82–92
Contents lists available at ScienceDirect
Journal of Volcanology and Geothermal Research
j ourna l homepage: www.e lsev ie r.com/ locate / jvo lgeores
Eruption time series statistically examined: Probabilities of future eruptions atVillarrica and Llaima Volcanoes, Southern Volcanic Zone, Chile
Yvonne Dzierma a,⁎, Heidi Wehrmann b
a SFB 574, University of Kiel, Otto-Hahn-Platz 1, 24118 Kiel, Germanyb SFB 574, Wischhofstr. 1-3, 24148 Kiel, Germany
⁎ Corresponding author. Tel.: +49 431 880 3591; faxE-mail address: [email protected] (Y.
0377-0273/$ – see front matter © 2010 Elsevier B.V. Adoi:10.1016/j.jvolgeores.2010.03.009
a b s t r a c t
a r t i c l e i n f oArticle history:Received 12 October 2009Accepted 20 March 2010Available online 1 April 2010
Keywords:eruption time seriesdistribution functionsprobabilistic eruption forecastingvolcanic hazardsVillarrica VolcanoLlaima Volcano
Probabilistic forecasting of volcanic eruptions is a central issue of applied volcanology with regard to mitigatingconsequences of volcanic hazards. Recent years have seen great advances in the techniques of statistical analysis ofvolcanic eruption time series, which constitutes an essential component of a multi-discipline volcanic hazardassessment.Here, twoof the currentlymost active volcanoes of SouthAmerica, Villarrica and Llaima, are subjected toanestablished statistical procedure,with theaimtoprovidepredictions for the likelihoodof future eruptionswithin agiven time interval.In the eruptivehistory of bothVillarrica andLlaimaVolcanoes, time independence of eruptions provides consistencywith Poissonian behaviour. A moving-average test, helping to assess whether the distribution of repose timesbetweeneruptions changes in response to the time interval considered, validates stationarity for at least theyoungereruption record. For the earlier time period, stationarity is not entirely confirmed, whichmay artificially result fromincompleteness of the eruption record, but can also reveal fluctuations in the eruptive regime. To take bothpossibilities into account, several different distribution functions are fit to the eruption time series, and the fits areevaluated for their quality andcompared. Theexponential,Weibull and log–logisticdistributionsare shown tofit therepose times sufficientlywell. The probability of future eruptionswithin defined timeperiods is therefore estimatedfrom all three distribution functions, as well as from amixture of exponential distribution (MOED) for the differenteruption regimes and from a Bayesian approach. Both theMOED and Bayesian estimates intrinsically predict lowereruption probabilities than the exponential distribution function, while the Weibull distributions have increasinghazard rates, hence giving the highest eruption probability forecasts.This study provides one of the first approaches to subject historical time series of small eruptions (including those ofVolcanic Explosivity Index=2) of very active volcanoes to this type of statistical analysis. Since both Villarrica andLlaima are situated in a regionof highpopulationdensity, the eruptionprobabilities determined in this studypresenta valuable contribution to regional hazard assessment.
: +49 431 880 4456.Dzierma).
ll rights reserved.
© 2010 Elsevier B.V. All rights reserved.
1. Introduction
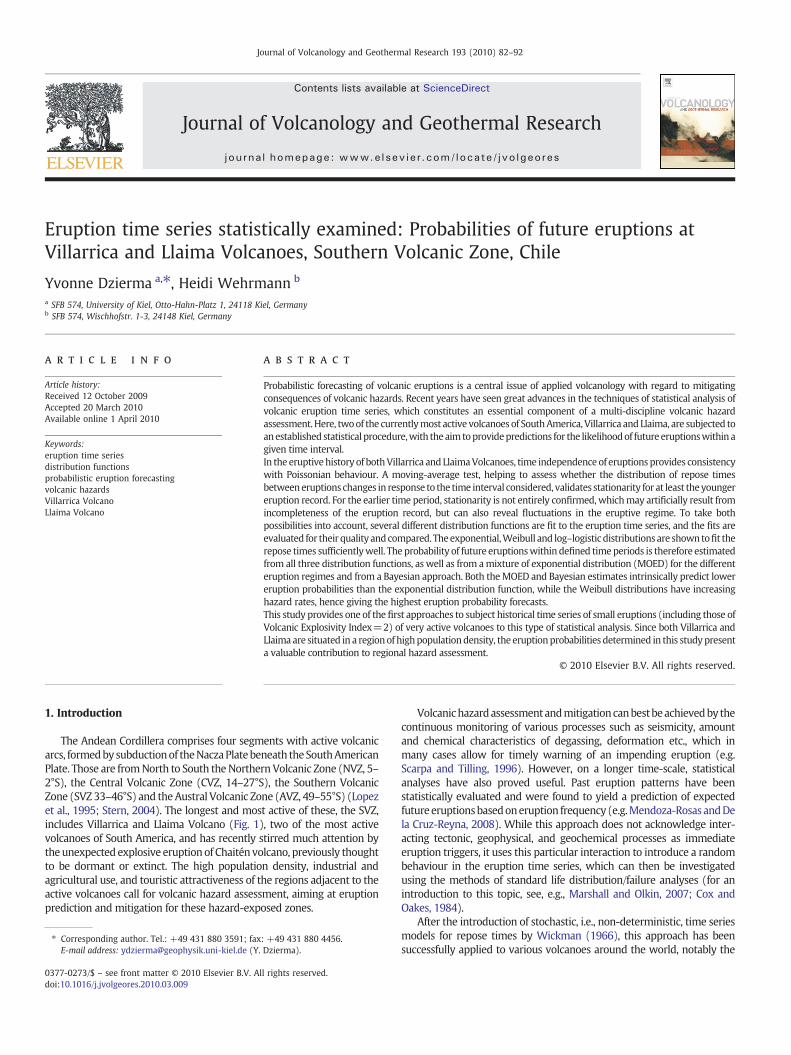
The Andean Cordillera comprises four segments with active volcanicarcs, formedby subductionof theNaczaPlatebeneath theSouthAmericanPlate. Those are fromNorth to South theNorthern Volcanic Zone (NVZ, 5–2°S), the Central Volcanic Zone (CVZ, 14–27°S), the Southern VolcanicZone (SVZ33–46°S) and theAustral Volcanic Zone (AVZ, 49–55°S) (Lopezet al., 1995; Stern, 2004). The longest and most active of these, the SVZ,includes Villarrica and Llaima Volcano (Fig. 1), two of the most activevolcanoes of South America, and has recently stirred much attention bytheunexpected explosive eruptionof Chaitén volcano, previously thoughtto be dormant or extinct. The high population density, industrial andagricultural use, and touristic attractiveness of the regions adjacent to theactive volcanoes call for volcanic hazard assessment, aiming at eruptionprediction and mitigation for these hazard-exposed zones.
Volcanichazardassessmentandmitigationcanbestbeachievedby thecontinuous monitoring of various processes such as seismicity, amountand chemical characteristics of degassing, deformation etc., which inmany cases allow for timely warning of an impending eruption (e.g.Scarpa and Tilling, 1996). However, on a longer time-scale, statisticalanalyses have also proved useful. Past eruption patterns have beenstatistically evaluated and were found to yield a prediction of expectedfutureeruptionsbasedoneruption frequency (e.g.Mendoza-RosasandDela Cruz-Reyna, 2008). While this approach does not acknowledge inter-acting tectonic, geophysical, and geochemical processes as immediateeruption triggers, it uses this particular interaction to introduce a randombehaviour in the eruption time series, which can then be investigatedusing the methods of standard life distribution/failure analyses (for anintroduction to this topic, see, e.g., Marshall and Olkin, 2007; Cox andOakes, 1984).
After the introduction of stochastic, i.e., non-deterministic, time seriesmodels for repose times by Wickman (1966), this approach has beensuccessfully applied to various volcanoes around the world, notably the
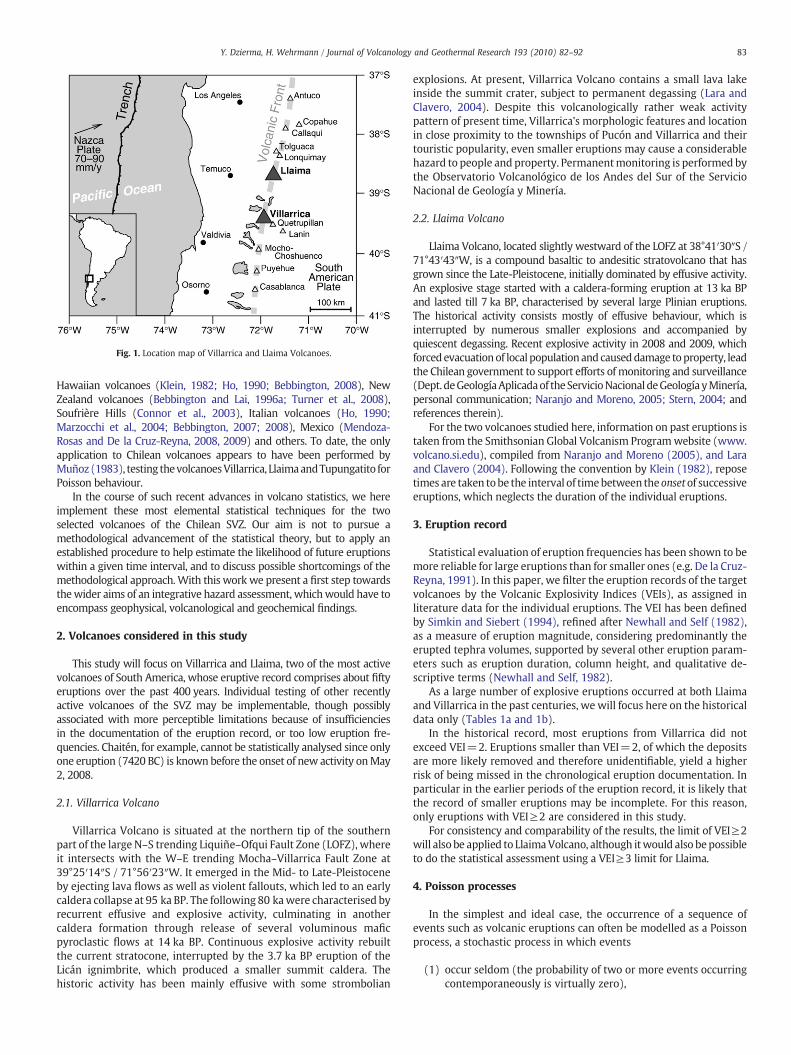
Fig. 1. Location map of Villarrica and Llaima Volcanoes.
83Y. Dzierma, H. Wehrmann / Journal of Volcanology and Geothermal Research 193 (2010) 82–92
Hawaiian volcanoes (Klein, 1982; Ho, 1990; Bebbington, 2008), NewZealand volcanoes (Bebbington and Lai, 1996a; Turner et al., 2008),Soufrière Hills (Connor et al., 2003), Italian volcanoes (Ho, 1990;Marzocchi et al., 2004; Bebbington, 2007; 2008), Mexico (Mendoza-Rosas and De la Cruz-Reyna, 2008, 2009) and others. To date, the onlyapplication to Chilean volcanoes appears to have been performed byMuñoz(1983), testing thevolcanoesVillarrica, LlaimaandTupungatito forPoisson behaviour.
In the course of such recent advances in volcano statistics, we hereimplement these most elemental statistical techniques for the twoselected volcanoes of the Chilean SVZ. Our aim is not to pursue amethodological advancement of the statistical theory, but to apply anestablished procedure to help estimate the likelihood of future eruptionswithin a given time interval, and to discuss possible shortcomings of themethodological approach.With this work we present a first step towardsthewider aims of an integrative hazard assessment, whichwould have toencompass geophysical, volcanological and geochemical findings.
2. Volcanoes considered in this study
This study will focus on Villarrica and Llaima, two of the most activevolcanoes of South America, whose eruptive record comprises about fiftyeruptions over the past 400 years. Individual testing of other recentlyactive volcanoes of the SVZ may be implementable, though possiblyassociated with more perceptible limitations because of insufficienciesin the documentation of the eruption record, or too low eruption fre-quencies. Chaitén, for example, cannot be statistically analysed since onlyone eruption (7420 BC) is known before the onset of new activity onMay2, 2008.
2.1. Villarrica Volcano
Villarrica Volcano is situated at the northern tip of the southernpart of the large N–S trending Liquiñe–Ofqui Fault Zone (LOFZ), whereit intersects with the W–E trending Mocha–Villarrica Fault Zone at39°25′14″S / 71°56′23″W. It emerged in the Mid- to Late-Pleistoceneby ejecting lava flows as well as violent fallouts, which led to an earlycaldera collapse at 95 ka BP. The following 80 kawere characterised byrecurrent effusive and explosive activity, culminating in anothercaldera formation through release of several voluminous maficpyroclastic flows at 14 ka BP. Continuous explosive activity rebuiltthe current stratocone, interrupted by the 3.7 ka BP eruption of theLicán ignimbrite, which produced a smaller summit caldera. Thehistoric activity has been mainly effusive with some strombolian
explosions. At present, Villarrica Volcano contains a small lava lakeinside the summit crater, subject to permanent degassing (Lara andClavero, 2004). Despite this volcanologically rather weak activitypattern of present time, Villarrica's morphologic features and locationin close proximity to the townships of Pucón and Villarrica and theirtouristic popularity, even smaller eruptions may cause a considerablehazard to people and property. Permanentmonitoring is performed bythe Observatorio Volcanológico de los Andes del Sur of the ServicioNacional de Geología y Minería.
2.2. Llaima Volcano
Llaima Volcano, located slightly westward of the LOFZ at 38°41′30″S /71°43′43″W, is a compound basaltic to andesitic stratovolcano that hasgrown since the Late-Pleistocene, initially dominated by effusive activity.An explosive stage started with a caldera-forming eruption at 13 ka BPand lasted till 7 ka BP, characterised by several large Plinian eruptions.The historical activity consists mostly of effusive behaviour, which isinterrupted by numerous smaller explosions and accompanied byquiescent degassing. Recent explosive activity in 2008 and 2009, whichforcedevacuationof local population and causeddamage toproperty, leadthe Chilean government to support efforts of monitoring and surveillance(Dept. deGeologíaAplicadaof theServicioNacionaldeGeología yMinería,personal communication; Naranjo and Moreno, 2005; Stern, 2004; andreferences therein).
For the two volcanoes studied here, information on past eruptions istaken from the Smithsonian Global Volcanism Programwebsite (www.volcano.si.edu), compiled from Naranjo and Moreno (2005), and Laraand Clavero (2004). Following the convention by Klein (1982), reposetimes are taken tobe the interval of timebetween theonsetof successiveeruptions, which neglects the duration of the individual eruptions.
3. Eruption record
Statistical evaluation of eruption frequencies has been shown to bemore reliable for large eruptions than for smaller ones (e.g. De la Cruz-Reyna, 1991). In this paper, we filter the eruption records of the targetvolcanoes by the Volcanic Explosivity Indices (VEIs), as assigned inliterature data for the individual eruptions. The VEI has been definedby Simkin and Siebert (1994), refined after Newhall and Self (1982),as a measure of eruption magnitude, considering predominantly theerupted tephra volumes, supported by several other eruption param-eters such as eruption duration, column height, and qualitative de-scriptive terms (Newhall and Self, 1982).
As a large number of explosive eruptions occurred at both Llaimaand Villarrica in the past centuries, we will focus here on the historicaldata only (Tables 1a and 1b).
In the historical record, most eruptions from Villarrica did notexceed VEI=2. Eruptions smaller than VEI=2, of which the depositsare more likely removed and therefore unidentifiable, yield a higherrisk of being missed in the chronological eruption documentation. Inparticular in the earlier periods of the eruption record, it is likely thatthe record of smaller eruptions may be incomplete. For this reason,only eruptions with VEI≥2 are considered in this study.
For consistency and comparability of the results, the limit of VEI≥2will also be applied to LlaimaVolcano, although itwould also bepossibleto do the statistical assessment using a VEI≥3 limit for Llaima.
4. Poisson processes
In the simplest and ideal case, the occurrence of a sequence ofevents such as volcanic eruptions can often be modelled as a Poissonprocess, a stochastic process in which events
(1) occur seldom (the probability of two or more events occurringcontemporaneously is virtually zero),
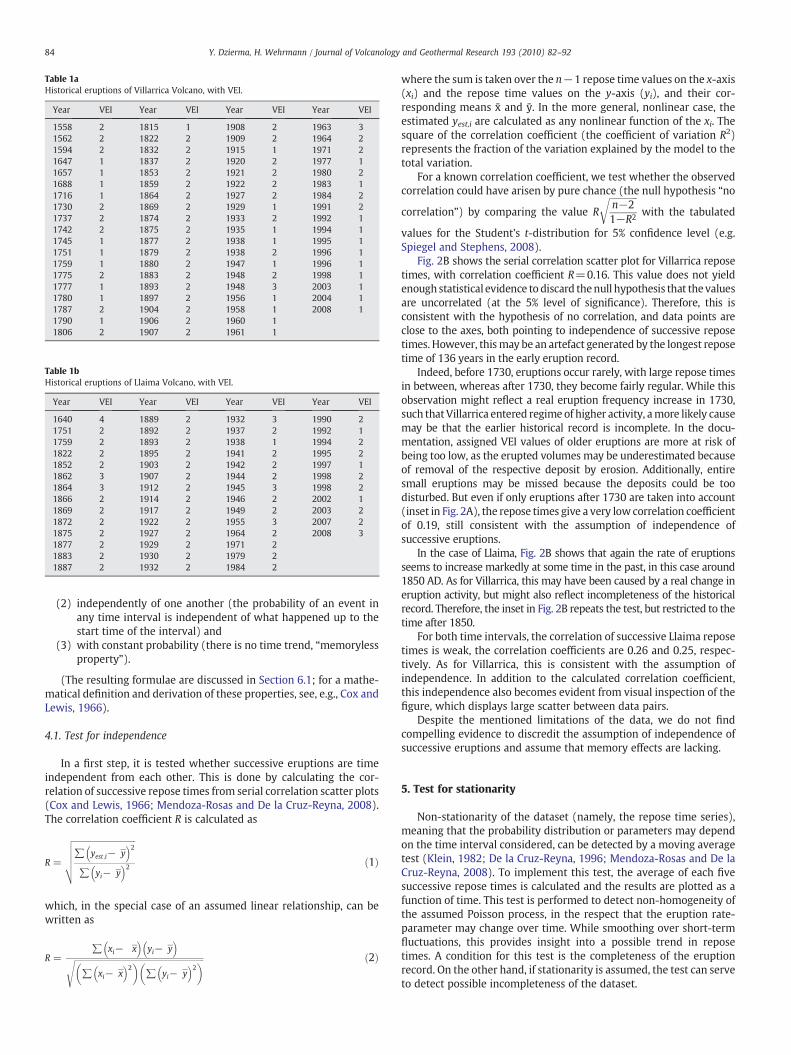
Table 1bHistorical eruptions of Llaima Volcano, with VEI.
Year VEI Year VEI Year VEI Year VEI
1640 4 1889 2 1932 3 1990 21751 2 1892 2 1937 2 1992 11759 2 1893 2 1938 1 1994 21822 2 1895 2 1941 2 1995 21852 2 1903 2 1942 2 1997 11862 3 1907 2 1944 2 1998 21864 3 1912 2 1945 3 1998 21866 2 1914 2 1946 2 2002 11869 2 1917 2 1949 2 2003 21872 2 1922 2 1955 3 2007 21875 2 1927 2 1964 2 2008 31877 2 1929 2 1971 21883 2 1930 2 1979 21887 2 1932 2 1984 2
Table 1aHistorical eruptions of Villarrica Volcano, with VEI.
Year VEI Year VEI Year VEI Year VEI
1558 2 1815 1 1908 2 1963 31562 2 1822 2 1909 2 1964 21594 2 1832 2 1915 1 1971 21647 1 1837 2 1920 2 1977 11657 1 1853 2 1921 2 1980 21688 1 1859 2 1922 2 1983 11716 1 1864 2 1927 2 1984 21730 2 1869 2 1929 1 1991 21737 2 1874 2 1933 2 1992 11742 2 1875 2 1935 1 1994 11745 1 1877 2 1938 1 1995 11751 1 1879 2 1938 2 1996 11759 1 1880 2 1947 1 1996 11775 2 1883 2 1948 2 1998 11777 1 1893 2 1948 3 2003 11780 1 1897 2 1956 1 2004 11787 2 1904 2 1958 1 2008 11790 1 1906 2 1960 11806 2 1907 2 1961 1
84 Y. Dzierma, H. Wehrmann / Journal of Volcanology and Geothermal Research 193 (2010) 82–92
(2) independently of one another (the probability of an event inany time interval is independent of what happened up to thestart time of the interval) and
(3) with constant probability (there is no time trend, “memorylessproperty”).
(The resulting formulae are discussed in Section 6.1; for a mathe-matical definition and derivation of these properties, see, e.g., Cox andLewis, 1966).
4.1. Test for independence
In a first step, it is tested whether successive eruptions are timeindependent from each other. This is done by calculating the cor-relation of successive repose times from serial correlation scatter plots(Cox and Lewis, 1966; Mendoza-Rosas and De la Cruz-Reyna, 2008).The correlation coefficient R is calculated as
R =
ffiffiffiffiffiffiffiffiffiffiffiffiffiffiffiffiffiffiffiffiffiffiffiffiffiffiffiffiffiffiffiffiffi∑ yest;i− �y� �2
∑ yi− �y� �2
vuuuut ð1Þ
which, in the special case of an assumed linear relationship, can bewritten as
R =∑ xi− �x� �
yi− �y� �
ffiffiffiffiffiffiffiffiffiffiffiffiffiffiffiffiffiffiffiffiffiffiffiffiffiffiffiffiffiffiffiffiffiffiffiffiffiffiffiffiffiffiffiffiffiffiffiffiffiffiffiffiffiffiffiffiffiffiffiffiffiffiffiffiffiffiffiffiffi∑ xi− �x� �2� �
∑ yi− �y� �2� �s ð2Þ
where the sum is taken over the n−1 repose time values on the x-axis(xi) and the repose time values on the y-axis (yi), and their cor-responding means x and y. In the more general, nonlinear case, theestimated yest,i are calculated as any nonlinear function of the xi. Thesquare of the correlation coefficient (the coefficient of variation R2)represents the fraction of the variation explained by the model to thetotal variation.
For a known correlation coefficient, we test whether the observedcorrelation could have arisen by pure chance (the null hypothesis “no
correlation”) by comparing the value R
ffiffiffiffiffiffiffiffiffiffiffiffiffin−21−R2
rwith the tabulated
values for the Student's t-distribution for 5% confidence level (e.g.Spiegel and Stephens, 2008).
Fig. 2B shows the serial correlation scatter plot for Villarrica reposetimes, with correlation coefficient R=0.16. This value does not yieldenough statistical evidence to discard thenull hypothesis that thevaluesare uncorrelated (at the 5% level of significance). Therefore, this isconsistent with the hypothesis of no correlation, and data points areclose to the axes, both pointing to independence of successive reposetimes. However, thismay be an artefact generated by the longest reposetime of 136 years in the early eruption record.
Indeed, before 1730, eruptions occur rarely, with large repose timesin between, whereas after 1730, they become fairly regular. While thisobservation might reflect a real eruption frequency increase in 1730,such thatVillarrica entered regime of higher activity, amore likely causemay be that the earlier historical record is incomplete. In the docu-mentation, assigned VEI values of older eruptions are more at risk ofbeing too low, as the erupted volumes may be underestimated becauseof removal of the respective deposit by erosion. Additionally, entiresmall eruptions may be missed because the deposits could be toodisturbed. But even if only eruptions after 1730 are taken into account(inset in Fig. 2A), the repose times give a very low correlation coefficientof 0.19, still consistent with the assumption of independence ofsuccessive eruptions.
In the case of Llaima, Fig. 2B shows that again the rate of eruptionsseems to increase markedly at some time in the past, in this case around1850 AD. As for Villarrica, this may have been caused by a real change ineruption activity, but might also reflect incompleteness of the historicalrecord. Therefore, the inset in Fig. 2B repeats the test, but restricted to thetime after 1850.
For both time intervals, the correlation of successive Llaima reposetimes is weak, the correlation coefficients are 0.26 and 0.25, respec-tively. As for Villarrica, this is consistent with the assumption ofindependence. In addition to the calculated correlation coefficient,this independence also becomes evident from visual inspection of thefigure, which displays large scatter between data pairs.
Despite the mentioned limitations of the data, we do not findcompelling evidence to discredit the assumption of independence ofsuccessive eruptions and assume that memory effects are lacking.
5. Test for stationarity
Non-stationarity of the dataset (namely, the repose time series),meaning that the probability distribution or parameters may dependon the time interval considered, can be detected by a moving averagetest (Klein, 1982; De la Cruz-Reyna, 1996; Mendoza-Rosas and De laCruz-Reyna, 2008). To implement this test, the average of each fivesuccessive repose times is calculated and the results are plotted as afunction of time. This test is performed to detect non-homogeneity ofthe assumed Poisson process, in the respect that the eruption rate-parameter may change over time. While smoothing over short-termfluctuations, this provides insight into a possible trend in reposetimes. A condition for this test is the completeness of the eruptionrecord. On the other hand, if stationarity is assumed, the test can serveto detect possible incompleteness of the dataset.
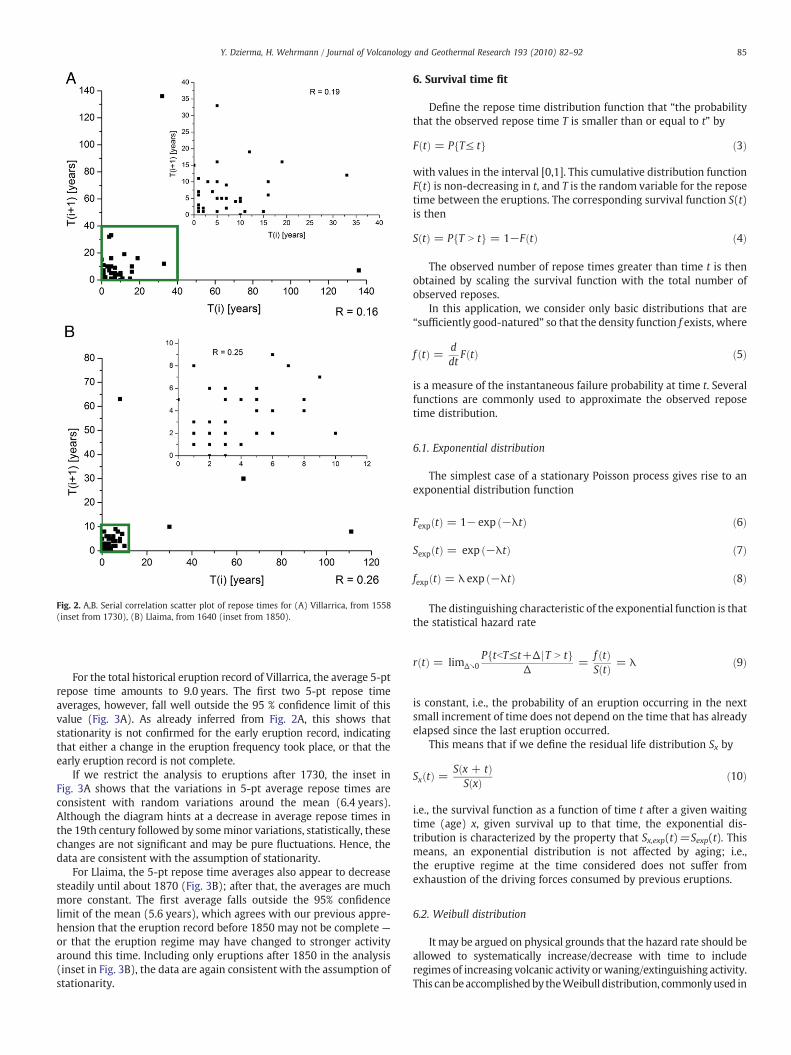
Fig. 2. A,B. Serial correlation scatter plot of repose times for (A) Villarrica, from 1558(inset from 1730), (B) Llaima, from 1640 (inset from 1850).
85Y. Dzierma, H. Wehrmann / Journal of Volcanology and Geothermal Research 193 (2010) 82–92
For the total historical eruption record of Villarrica, the average 5-ptrepose time amounts to 9.0 years. The first two 5-pt repose timeaverages, however, fall well outside the 95 % confidence limit of thisvalue (Fig. 3A). As already inferred from Fig. 2A, this shows thatstationarity is not confirmed for the early eruption record, indicatingthat either a change in the eruption frequency took place, or that theearly eruption record is not complete.
If we restrict the analysis to eruptions after 1730, the inset inFig. 3A shows that the variations in 5-pt average repose times areconsistent with random variations around the mean (6.4 years).Although the diagram hints at a decrease in average repose times inthe 19th century followed by someminor variations, statistically, thesechanges are not significant and may be pure fluctuations. Hence, thedata are consistent with the assumption of stationarity.
For Llaima, the 5-pt repose time averages also appear to decreasesteadily until about 1870 (Fig. 3B); after that, the averages are muchmore constant. The first average falls outside the 95% confidencelimit of the mean (5.6 years), which agrees with our previous appre-hension that the eruption record before 1850 may not be complete —
or that the eruption regime may have changed to stronger activityaround this time. Including only eruptions after 1850 in the analysis(inset in Fig. 3B), the data are again consistent with the assumption ofstationarity.
6. Survival time fit
Define the repose time distribution function that “the probabilitythat the observed repose time T is smaller than or equal to t” by
F tð Þ = P T≤ tf g ð3Þ
with values in the interval [0,1]. This cumulative distribution functionF(t) is non-decreasing in t, and T is the random variable for the reposetime between the eruptions. The corresponding survival function S(t)is then
S tð Þ = P T N tf g = 1−F tð Þ ð4Þ
The observed number of repose times greater than time t is thenobtained by scaling the survival function with the total number ofobserved reposes.
In this application, we consider only basic distributions that are“sufficiently good-natured” so that the density function f exists, where
f tð Þ = ddt
F tð Þ ð5Þ
is a measure of the instantaneous failure probability at time t. Severalfunctions are commonly used to approximate the observed reposetime distribution.
6.1. Exponential distribution
The simplest case of a stationary Poisson process gives rise to anexponential distribution function
Fexp tð Þ = 1− exp −λtð Þ ð6Þ
Sexp tð Þ = exp −λtð Þ ð7Þ
fexp tð Þ = λ exp −λtð Þ ð8Þ
The distinguishing characteristic of the exponential function is thatthe statistical hazard rate
r tð Þ = limΔ↘0P tbT≤t+Δ jT N tf g
Δ=
f tð ÞS tð Þ = λ ð9Þ
is constant, i.e., the probability of an eruption occurring in the nextsmall increment of time does not depend on the time that has alreadyelapsed since the last eruption occurred.
This means that if we define the residual life distribution Sx by
Sx tð Þ = S x + tð ÞS xð Þ ð10Þ
i.e., the survival function as a function of time t after a given waitingtime (age) x, given survival up to that time, the exponential dis-tribution is characterized by the property that Sx,exp(t)=Sexp(t). Thismeans, an exponential distribution is not affected by aging; i.e.,the eruptive regime at the time considered does not suffer fromexhaustion of the driving forces consumed by previous eruptions.
6.2. Weibull distribution
It may be argued on physical grounds that the hazard rate should beallowed to systematically increase/decrease with time to includeregimes of increasing volcanic activity orwaning/extinguishing activity.This canbeaccomplishedby theWeibull distribution, commonlyused in
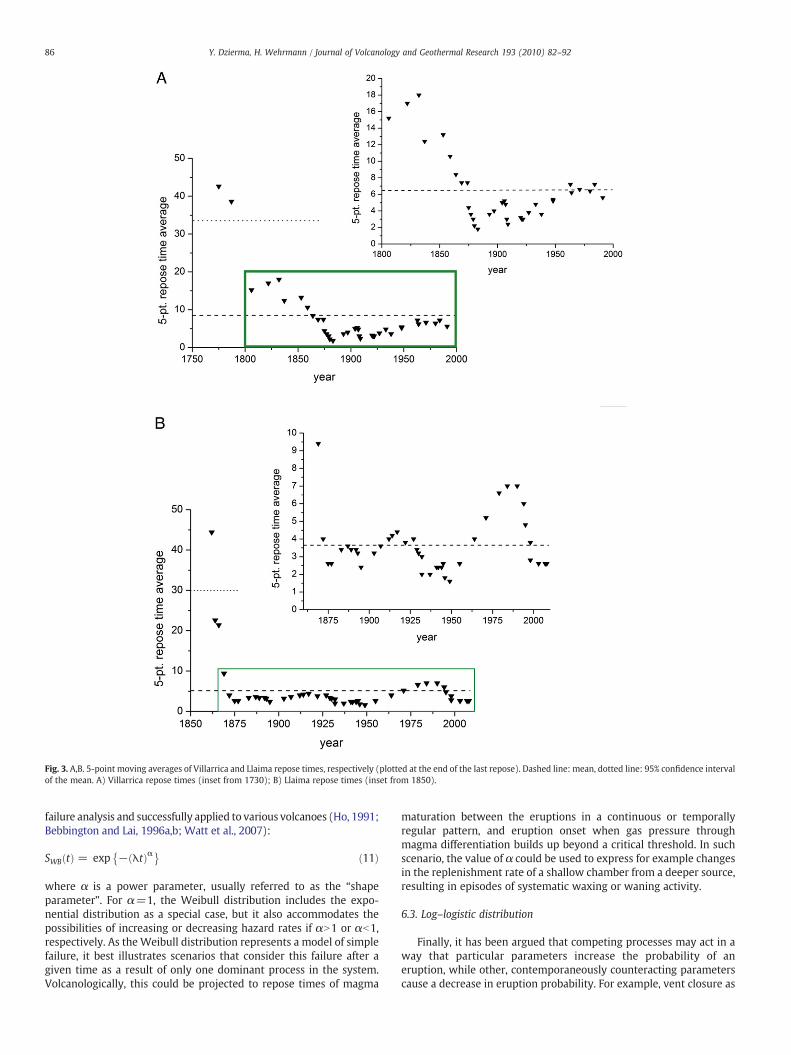
Fig. 3. A,B. 5-point moving averages of Villarrica and Llaima repose times, respectively (plotted at the end of the last repose). Dashed line: mean, dotted line: 95% confidence intervalof the mean. A) Villarrica repose times (inset from 1730); B) Llaima repose times (inset from 1850).
86 Y. Dzierma, H. Wehrmann / Journal of Volcanology and Geothermal Research 193 (2010) 82–92
failure analysis and successfully applied to various volcanoes (Ho, 1991;Bebbington and Lai, 1996a,b; Watt et al., 2007):
SWB tð Þ = exp − λtð Þα� � ð11Þ
where α is a power parameter, usually referred to as the “shapeparameter”. For α=1, the Weibull distribution includes the expo-nential distribution as a special case, but it also accommodates thepossibilities of increasing or decreasing hazard rates if αN1 or αb1,respectively. As the Weibull distribution represents a model of simplefailure, it best illustrates scenarios that consider this failure after agiven time as a result of only one dominant process in the system.Volcanologically, this could be projected to repose times of magma
maturation between the eruptions in a continuous or temporallyregular pattern, and eruption onset when gas pressure throughmagma differentiation builds up beyond a critical threshold. In suchscenario, the value of α could be used to express for example changesin the replenishment rate of a shallow chamber from a deeper source,resulting in episodes of systematic waxing or waning activity.
6.3. Log–logistic distribution
Finally, it has been argued that competing processes may act in away that particular parameters increase the probability of aneruption, while other, contemporaneously counteracting parameterscause a decrease in eruption probability. For example, vent closure as
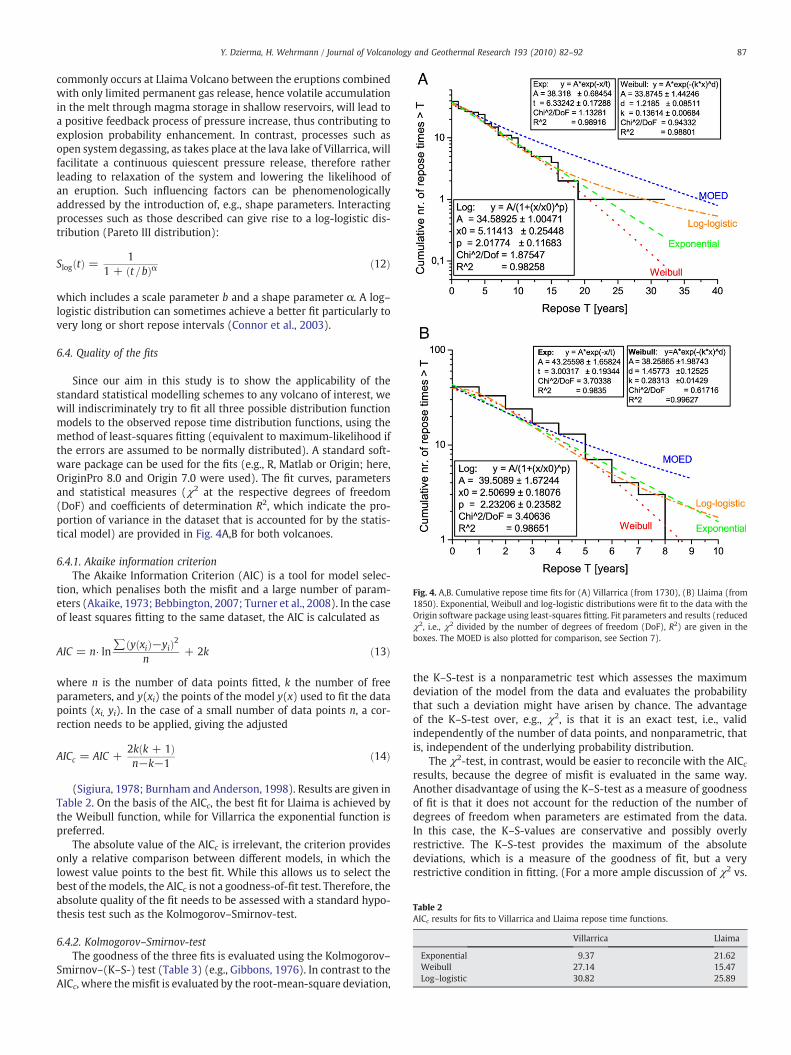
Fig. 4. A,B. Cumulative repose time fits for (A) Villarrica (from 1730), (B) Llaima (from1850). Exponential, Weibull and log-logistic distributions were fit to the data with theOrigin software package using least-squares fitting. Fit parameters and results (reducedχ2, i.e., χ2 divided by the number of degrees of freedom (DoF), R2) are given in theboxes. The MOED is also plotted for comparison, see Section 7).
Table 2AICc results for fits to Villarrica and Llaima repose time functions.
Villarrica Llaima
Exponential 9.37 21.62Weibull 27.14 15.47Log–logistic 30.82 25.89
87Y. Dzierma, H. Wehrmann / Journal of Volcanology and Geothermal Research 193 (2010) 82–92
commonly occurs at Llaima Volcano between the eruptions combinedwith only limited permanent gas release, hence volatile accumulationin the melt through magma storage in shallow reservoirs, will lead toa positive feedback process of pressure increase, thus contributing toexplosion probability enhancement. In contrast, processes such asopen system degassing, as takes place at the lava lake of Villarrica, willfacilitate a continuous quiescent pressure release, therefore ratherleading to relaxation of the system and lowering the likelihood ofan eruption. Such influencing factors can be phenomenologicallyaddressed by the introduction of, e.g., shape parameters. Interactingprocesses such as those described can give rise to a log-logistic dis-tribution (Pareto III distribution):
Slog tð Þ = 11 + t=bð Þα ð12Þ
which includes a scale parameter b and a shape parameter α. A log–logistic distribution can sometimes achieve a better fit particularly tovery long or short repose intervals (Connor et al., 2003).
6.4. Quality of the fits
Since our aim in this study is to show the applicability of thestandard statistical modelling schemes to any volcano of interest, wewill indiscriminately try to fit all three possible distribution functionmodels to the observed repose time distribution functions, using themethod of least-squares fitting (equivalent to maximum-likelihood ifthe errors are assumed to be normally distributed). A standard soft-ware package can be used for the fits (e.g., R, Matlab or Origin; here,OriginPro 8.0 and Origin 7.0 were used). The fit curves, parametersand statistical measures (χ2 at the respective degrees of freedom(DoF) and coefficients of determination R2, which indicate the pro-portion of variance in the dataset that is accounted for by the statis-tical model) are provided in Fig. 4A,B for both volcanoes.
6.4.1. Akaike information criterionThe Akaike Information Criterion (AIC) is a tool for model selec-
tion, which penalises both the misfit and a large number of param-eters (Akaike, 1973; Bebbington, 2007; Turner et al., 2008). In the caseof least squares fitting to the same dataset, the AIC is calculated as
AIC = n⋅ ln∑ y xið Þ−yið Þ2
n+ 2k ð13Þ
where n is the number of data points fitted, k the number of freeparameters, and y(xi) the points of the model y(x) used to fit the datapoints (xi, yi). In the case of a small number of data points n, a cor-rection needs to be applied, giving the adjusted
AICc = AIC +2k k + 1ð Þn−k−1
ð14Þ
(Sigiura, 1978; Burnham and Anderson, 1998). Results are given inTable 2. On the basis of the AICc, the best fit for Llaima is achieved bythe Weibull function, while for Villarrica the exponential function ispreferred.
The absolute value of the AICc is irrelevant, the criterion providesonly a relative comparison between different models, in which thelowest value points to the best fit. While this allows us to select thebest of the models, the AICc is not a goodness-of-fit test. Therefore, theabsolute quality of the fit needs to be assessed with a standard hypo-thesis test such as the Kolmogorov–Smirnov-test.
6.4.2. Kolmogorov–Smirnov-testThe goodness of the three fits is evaluated using the Kolmogorov–
Smirnov–(K–S-) test (Table 3) (e.g., Gibbons, 1976). In contrast to theAICc, where themisfit is evaluated by the root-mean-square deviation,
the K–S-test is a nonparametric test which assesses the maximumdeviation of the model from the data and evaluates the probabilitythat such a deviation might have arisen by chance. The advantageof the K–S-test over, e.g., χ2, is that it is an exact test, i.e., validindependently of the number of data points, and nonparametric, thatis, independent of the underlying probability distribution.
The χ2-test, in contrast, would be easier to reconcile with the AICcresults, because the degree of misfit is evaluated in the same way.Another disadvantage of using the K–S-test as a measure of goodnessof fit is that it does not account for the reduction of the number ofdegrees of freedom when parameters are estimated from the data.In this case, the K–S-values are conservative and possibly overlyrestrictive. The K–S-test provides the maximum of the absolutedeviations, which is a measure of the goodness of fit, but a veryrestrictive condition in fitting. (For a more ample discussion of χ2 vs.
Table 3K–S differences for fits to Villarrica and Llaima repose time functions.
Villarrica Llaima
Exponential 0.169 0.263Weibull 0.205 0.204Log-logistic 0.162 0.199
88 Y. Dzierma, H. Wehrmann / Journal of Volcanology and Geothermal Research 193 (2010) 82–92
K–S-testing, see, e.g., Gibbons, 1976). On the other hand, if the dis-tributions fit to the data are consistent with both χ2 and the K–S-test,this provides some independent insight into the quality of the fit.
For Villarrica Volcano, both the exponential and log-logisticdistributions give K–S-differences smaller than that of the 0.05 levelof significance (0.17 and 0.16, respectively, compared with a cut-offvalue of 0.21), so themodels are consistent with the observations. TheWeibull distribution, however, performs worse than the exponentialdistribution (K–S value of 0.21). This is a somewhat unreasonablecontrast, because the Weibull distribution includes the exponentialdistribution as a special case with a constant shape parameter, there-fore it should perform at least as well as the exponential distribution.The large difference is obtained at the origin, due to the fact that thescale factor A differs markedly from the total number of observedrepose times. If A is fixed in the fitting process, the resulting Weibulldistribution is very similar to the exponential distribution. Indeed, theexponential distribution offers a good fit particularly to small reposetimes, whereas it tends to zero quickly for longer repose times. TheWeibull distribution, if fit with variable A, remedies this problemand provides a good fit to longer repose times with a long tail of thedistribution function, but does not reproduce very short repose timestatistics well, particularly not for a repose time value of 0. If we leaveout the value at T=0 in the K–S-test for Villarrica and limit the fit tofinite repose times, a K–S-difference of only 0.15, well below the 0.21of the 0.05 limit, is obtained. It is justifiable to ignore T=0, becausethe source data provide many eruption dates only as calendar years,rendering it impossible to properly distinguish between 0 and 1. Forinstance, and the only instance in this time series, there were twoVEI≥2 Villarrica eruptions in the calendar year 1948, which aremathematically treated as repose time T=0, while in fact they had arepose time of about ½ year and would have been treated differentlyhad they both occurred two months later, so that the second eruptionwould have fallen into 1949 — a repose time of one year (i.e., T=1)would then have been used for the analysis. Considering eruptiondates on a monthly to weekly time resolution would contribute to abetter precision for the short repose times.
In the case of Llaima, both the Weibull and log-logistic distribu-tions give a good fit to the data within the 0.05 level of significance(both 0.20), whereas the exponential distribution fails the test at thislevel (0.26). While it may seem paradox that the exponential dis-tribution fails the K–S-test, despite a better AICc than the log–logisticdistribution, the lower and hence better AICc is due solely to the lowernumber of parameters and does not reflect less misfit. The combina-tion of the K–S-results with the AICc indicates that a purely stationaryPoisson process is not a good description of the Llaima eruptionsequence, and the time series appear to be more likely affected by anincreasing hazard rate.
7. Different eruption regimes — MOED
Recently, Mendoza-Rosas and De la Cruz-Reyna (2008; 2009)introduced the mixture of exponentials distribution (MOED) intovolcano statistics analysis as a way to take into account possible non-stationarity of the eruption process. In their approach, the historicaleruption record is divided into a number of different regimes: timeintervals over which the eruption rate can reasonably be assumed tobe constant. Statistical methods exist that allow for a mathematicallysound and objective definition of regime boundaries in time series,
which can involve application of hidden Markov models (Mulargiaand Tinti, 1986; Mulargia et al., 1987; Bebbington, 2007). However,within the scope of this work, we decided for the intuitive, visualdefinition of regimes as used for MOED estimation and MOED-basedBayesian analyses (De la Cruz-Reyna, 1996; Mendoza-Rosas and De laCruz-Reyna, 2008, 2009), which is based on visual identification ofpiecewise linear regimes in a plot of cumulative number of eruptionsvs. time (Fig. 5A,B). Although it may seem at first sight that the choiceof the start- and end-points of the intervals is arbitrary to somedegree, the main features are stable: while the regime start and endtimes may be moved by one or two decades at most, this does notinvolve a significant change in the eruption rate for this regime, nor inthe results of the method.
TheMOED is definedas theweighted sumover the individual regimedistribution functions, giving a piecewise exponential behaviour:
FMOED tð Þ = ∑mi = 1wi 1− exp −λitð Þð Þ; ð15Þ
SMOED tð Þ = ∑mi = 1wi exp −λitð Þ ð16Þ
∑mi =1wi = 1 ð17Þ
where m is the total number of identified regimes, λi is the eruptionrate (number of eruptions in regime i divided by duration of theregime), and wi are weighting factors given by
wi =Dt−Di
∑mi = 1 Dt−Dið Þ ð18Þ
with Di being the duration of each regime and Dt the total duration ofthe sampled interval of time.
Following the procedure outlined by Mendoza-Rosas and De laCruz-Reyna (2008), we use the chosen eruption regimes to determinethe parameters of a mixture of exponentials distribution (Table 4aand b). Note that this method does not fit a MOED to give best agree-ment with the data, but reads the MOED parameters from the plot. Inconsequence, the agreement of the MOED with the data will departfrom the optimum on one hand, but on the other hand, this method ismuch easier and more stable than fitting, and certainly more intuitivethan using a readily implemented fitting routine. It is also directlyinsightful because the changes between phases of higher and lowervolcanic activity become apparent in the plots.
For Villarrica, three episodes of differing eruption rates can bevisually derived from Fig. 5A. The highest activity is bracketed by twophases of somewhat lower eruption rates, whichmethod-wise dimin-ishes the scenario that regimes of lower activity are only artefactsof insufficient eruption documentation aggravating when reachingfurther back in the past within this time span.
For Llaima, Fig. 5B shows that the data until 1862 can be groupedtogether in one regime, which has considerably lower eruption fre-quency than the following episode.We already supposed that the erup-tive record up to the year 1850 might not be complete, and have up tonow chosen this year as lower boundary of consideration. This newanalysis, however, suggests that we should only consider Llaima erup-tions after 1862. As mentioned before, it is of course possible that thisflatter slope images a real regime of lower activity, implying that itshould be included in the analysis. However, since this is the oldest partof the historic record, and the rate is saliently different from all laterregimes, it is more plausible that this effect is due to incompletenessof the record and this time interval should be skipped. This also agreeswith the outcome of the stationarity check performed above.
As for the three other distributions, the agreement of the MOEDwith the data is examined with the K–S-test and produces differencesof 0.136 and 0.272 for Villarrica and Llaima, respectively. This gives anexcellent agreement with observations for Villarrica, while failing forLlaima.Wemust, however, take into account that this is based on data
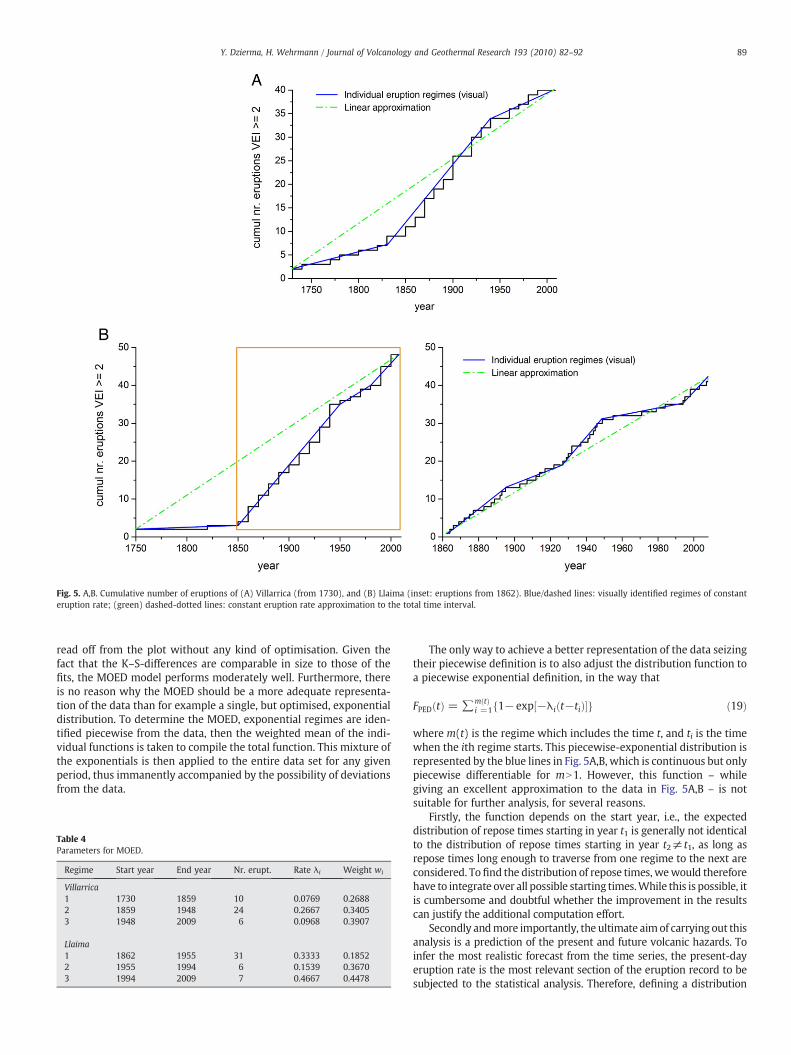
Fig. 5. A,B. Cumulative number of eruptions of (A) Villarrica (from 1730), and (B) Llaima (inset: eruptions from 1862). Blue/dashed lines: visually identified regimes of constanteruption rate; (green) dashed-dotted lines: constant eruption rate approximation to the total time interval.
89Y. Dzierma, H. Wehrmann / Journal of Volcanology and Geothermal Research 193 (2010) 82–92
read off from the plot without any kind of optimisation. Given thefact that the K–S-differences are comparable in size to those of thefits, the MOED model performs moderately well. Furthermore, thereis no reason why the MOED should be a more adequate representa-tion of the data than for example a single, but optimised, exponentialdistribution. To determine the MOED, exponential regimes are iden-tified piecewise from the data, then the weighted mean of the indi-vidual functions is taken to compile the total function. This mixture ofthe exponentials is then applied to the entire data set for any givenperiod, thus immanently accompanied by the possibility of deviationsfrom the data.
Table 4Parameters for MOED.
Regime Start year End year Nr. erupt. Rate λi Weight wi
Villarrica1 1730 1859 10 0.0769 0.26882 1859 1948 24 0.2667 0.34053 1948 2009 6 0.0968 0.3907
Llaima1 1862 1955 31 0.3333 0.18522 1955 1994 6 0.1539 0.36703 1994 2009 7 0.4667 0.4478
The only way to achieve a better representation of the data seizingtheir piecewise definition is to also adjust the distribution function toa piecewise exponential definition, in the way that
FPED tð Þ = ∑m tð Þi =1 1− exp −λi t−tið Þ½ �f g ð19Þ
where m(t) is the regime which includes the time t, and ti is the timewhen the ith regime starts. This piecewise-exponential distribution isrepresented by the blue lines in Fig. 5A,B, which is continuous but onlypiecewise differentiable for mN1. However, this function – whilegiving an excellent approximation to the data in Fig. 5A,B – is notsuitable for further analysis, for several reasons.
Firstly, the function depends on the start year, i.e., the expecteddistribution of repose times starting in year t1 is generally not identicalto the distribution of repose times starting in year t2≠t1, as long asrepose times long enough to traverse from one regime to the next areconsidered. Tofind the distribution of repose times, wewould thereforehave to integrate over all possible starting times.While this is possible, itis cumbersome and doubtful whether the improvement in the resultscan justify the additional computation effort.
Secondly andmore importantly, the ultimate aimof carrying out thisanalysis is a prediction of the present and future volcanic hazards. Toinfer the most realistic forecast from the time series, the present-dayeruption rate is the most relevant section of the eruption record to besubjected to the statistical analysis. Therefore, defining a distribution
90 Y. Dzierma, H. Wehrmann / Journal of Volcanology and Geothermal Research 193 (2010) 82–92
function for an eruption rate in a limited time period that had ter-minated in the past is reduced to an academic exercise with no appli-cation for hazard research. This distribution would express only thisparticular timeperiod andwouldnot bevalid for any later episodes, thusproducing only results irrelevant for forecasting present-day eruptionprobabilities. The only ways to estimate the present-day eruptionrate are therefore (1) to concentrate only on the most recent regime,which is considered to be ongoing, and use the observed eruption rateto extrapolate to the future, or (2) to use the weighted mean of pasteruption rates, because there is no reason to believe that the lastobserved regime is still continuing, it is possible that we just entered anew regime with unknown eruption rate. This last assumption, usingthe weighted mean of all past eruption rates, is the underlying ideabehind the use of the MOED, although the exact functional form ofthe weights may be subject to debate (see above). Therefore, while notproviding as good a fit to the observed eruption data, previous inves-tigators (Mendoza-Rosas and De la Cruz-Reyna, 2008, 2009) have con-sidered the MOED useful for the estimation of future eruptions. Aswe are applying the most common techniques here, also the MOEDwill be used for eruption forecasting later in this work.
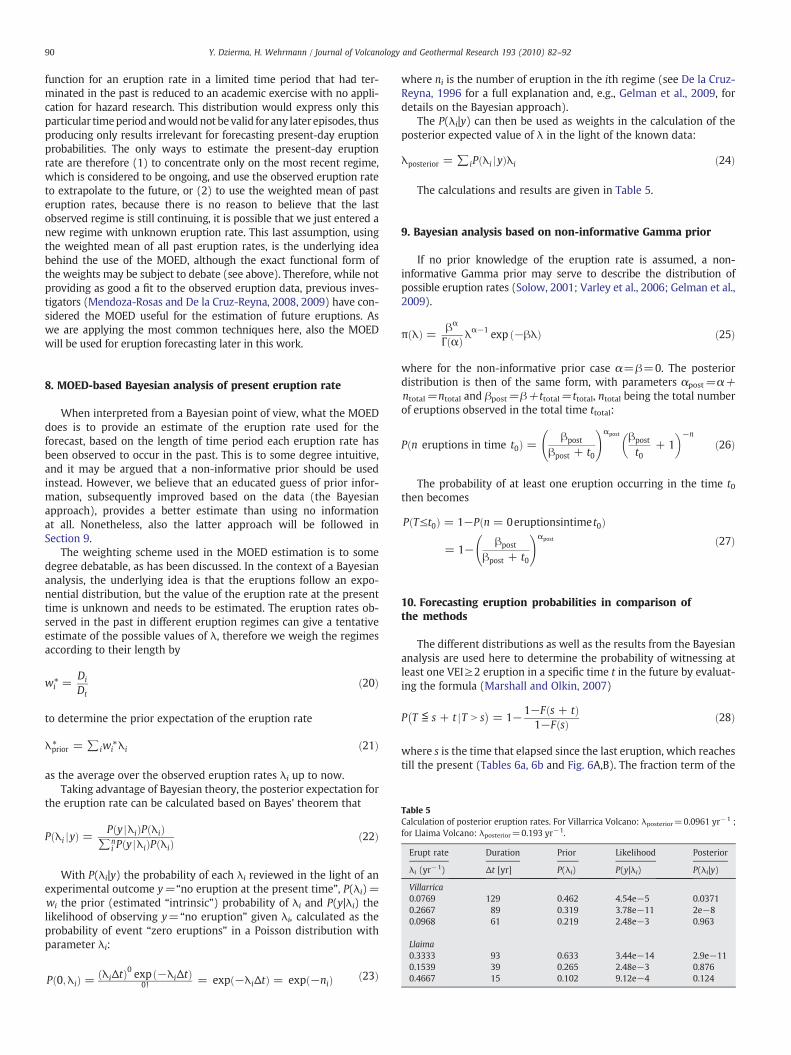
Table 5Calculation of posterior eruption rates. For Villarrica Volcano: λposterior=0.0961 yr−1 ;for Llaima Volcano: λposterior=0.193 yr−1.
Erupt rate Duration Prior Likelihood Posterior
λi (yr−1) Δt [yr] P(λi) P(y|λi) P(λi|y)
Villarrica0.0769 129 0.462 4.54e−5 0.03710.2667 89 0.319 3.78e−11 2e−80.0968 61 0.219 2.48e−3 0.963
Llaima0.3333 93 0.633 3.44e−14 2.9e−110.1539 39 0.265 2.48e−3 0.8760.4667 15 0.102 9.12e−4 0.124
8. MOED-based Bayesian analysis of present eruption rate
When interpreted from a Bayesian point of view, what the MOEDdoes is to provide an estimate of the eruption rate used for theforecast, based on the length of time period each eruption rate hasbeen observed to occur in the past. This is to some degree intuitive,and it may be argued that a non-informative prior should be usedinstead. However, we believe that an educated guess of prior infor-mation, subsequently improved based on the data (the Bayesianapproach), provides a better estimate than using no informationat all. Nonetheless, also the latter approach will be followed inSection 9.
The weighting scheme used in the MOED estimation is to somedegree debatable, as has been discussed. In the context of a Bayesiananalysis, the underlying idea is that the eruptions follow an expo-nential distribution, but the value of the eruption rate at the presenttime is unknown and needs to be estimated. The eruption rates ob-served in the past in different eruption regimes can give a tentativeestimate of the possible values of λ, therefore we weigh the regimesaccording to their length by
wi* =Di
Dtð20Þ
to determine the prior expectation of the eruption rate
λprior* = ∑iwi*λi ð21Þ
as the average over the observed eruption rates λi up to now.Taking advantage of Bayesian theory, the posterior expectation for
the eruption rate can be calculated based on Bayes' theorem that
P λi jyð Þ = P y jλið ÞP λið Þ∑n
i P y jλið ÞP λið Þ ð22Þ
With P(λi|y) the probability of each λi reviewed in the light of anexperimental outcome y=“no eruption at the present time”, P(λi)=wi the prior (estimated “intrinsic”) probability of λi and P(y|λi) thelikelihood of observing y=“no eruption” given λi, calculated as theprobability of event “zero eruptions” in a Poisson distribution withparameter λi:
P 0;λið Þ = λiΔtð Þ0 exp −λiΔtð Þ0! = exp −λiΔtð Þ = exp −nið Þ ð23Þ
where ni is the number of eruption in the ith regime (see De la Cruz-Reyna, 1996 for a full explanation and, e.g., Gelman et al., 2009, fordetails on the Bayesian approach).
The P(λi|y) can then be used as weights in the calculation of theposterior expected value of λ in the light of the known data:
λposterior = ∑iP λi jyð Þλi ð24Þ
The calculations and results are given in Table 5.
9. Bayesian analysis based on non-informative Gamma prior
If no prior knowledge of the eruption rate is assumed, a non-informative Gamma prior may serve to describe the distribution ofpossible eruption rates (Solow, 2001; Varley et al., 2006; Gelman et al.,2009).
π λð Þ = βα
Γ αð Þλα−1 exp −βλð Þ ð25Þ
where for the non-informative prior case α=β=0. The posteriordistribution is then of the same form, with parameters αpost=α+ntotal=ntotal and βpost=β+ttotal=ttotal, ntotal being the total numberof eruptions observed in the total time ttotal:
P n eruptions in time t0ð Þ = βpost
βpost + t0
!αpost βpost
t0+ 1
� �−n
ð26Þ
The probability of at least one eruption occurring in the time t0then becomes
P T≤t0ð Þ = 1−P n = 0eruptionsintime t0ð Þ
= 1−βpost
βpost + t0
!αpost ð27Þ
10. Forecasting eruption probabilities in comparison ofthe methods
The different distributions as well as the results from the Bayesiananalysis are used here to determine the probability of witnessing atleast one VEI≥2 eruption in a specific time t in the future by evaluat-ing the formula (Marshall and Olkin, 2007)
P T ≦ s + t jT N s
= 1−1−F s + tð Þ1−F sð Þ ð28Þ
where s is the time that elapsed since the last eruption, which reachestill the present (Tables 6a, 6b and Fig. 6A,B). The fraction term of the
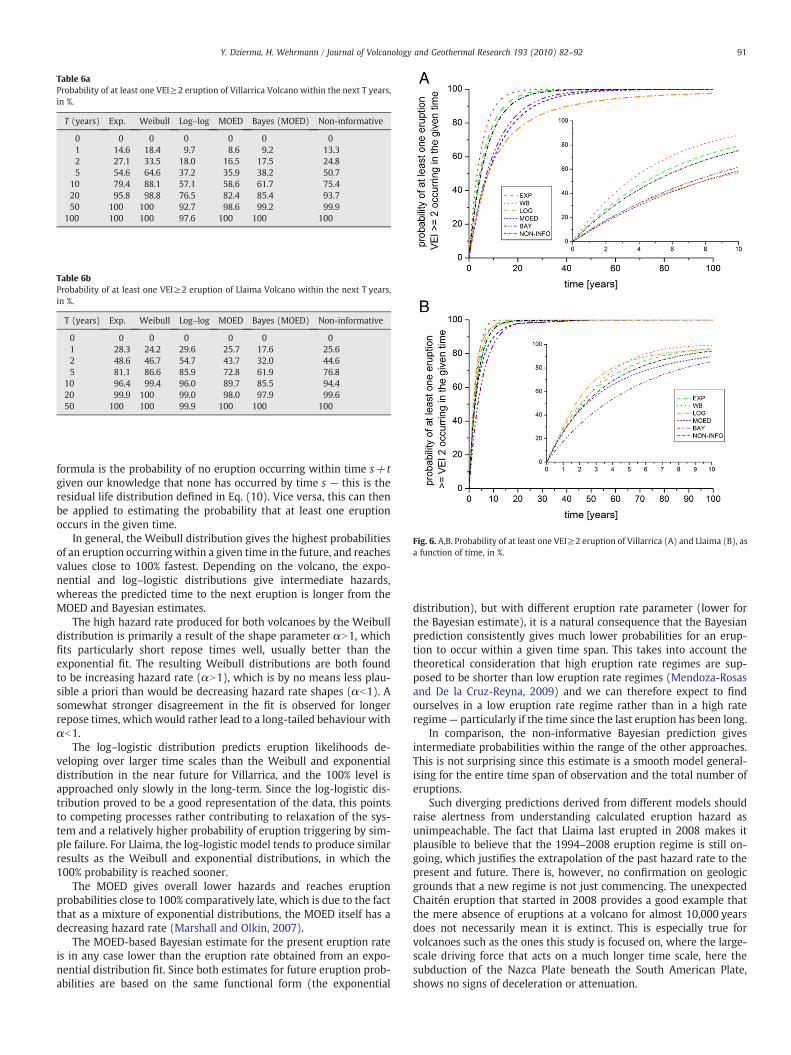
Table 6aProbability of at least one VEI≥2 eruption of Villarrica Volcano within the next T years,in %.
T (years) Exp. Weibull Log–log MOED Bayes (MOED) Non-informative
0 0 0 0 0 0 01 14.6 18.4 9.7 8.6 9.2 13.32 27.1 33.5 18.0 16.5 17.5 24.85 54.6 64.6 37.2 35.9 38.2 50.7
10 79.4 88.1 57.1 58.6 61.7 75.420 95.8 98.8 76.5 82.4 85.4 93.750 100 100 92.7 98.6 99.2 99.9
100 100 100 97.6 100 100 100
Table 6bProbability of at least one VEI≥2 eruption of Llaima Volcano within the next T years,in %.
T (years) Exp. Weibull Log–log MOED Bayes (MOED) Non-informative
0 0 0 0 0 0 01 28.3 24.2 29.6 25.7 17.6 25.62 48.6 46.7 54.7 43.7 32.0 44.65 81.1 86.6 85.9 72.8 61.9 76.8
10 96.4 99.4 96.0 89.7 85.5 94.420 99.9 100 99.0 98.0 97.9 99.650 100 100 99.9 100 100 100
Fig. 6. A,B. Probability of at least one VEI≥2 eruption of Villarrica (A) and Llaima (B), asa function of time, in %.
91Y. Dzierma, H. Wehrmann / Journal of Volcanology and Geothermal Research 193 (2010) 82–92
formula is the probability of no eruption occurring within time s+tgiven our knowledge that none has occurred by time s — this is theresidual life distribution defined in Eq. (10). Vice versa, this can thenbe applied to estimating the probability that at least one eruptionoccurs in the given time.
In general, the Weibull distribution gives the highest probabilitiesof an eruption occurring within a given time in the future, and reachesvalues close to 100% fastest. Depending on the volcano, the expo-nential and log–logistic distributions give intermediate hazards,whereas the predicted time to the next eruption is longer from theMOED and Bayesian estimates.
The high hazard rate produced for both volcanoes by the Weibulldistribution is primarily a result of the shape parameter αN1, whichfits particularly short repose times well, usually better than theexponential fit. The resulting Weibull distributions are both foundto be increasing hazard rate (αN1), which is by no means less plau-sible a priori than would be decreasing hazard rate shapes (αb1). Asomewhat stronger disagreement in the fit is observed for longerrepose times, which would rather lead to a long-tailed behaviour withαb1.
The log–logistic distribution predicts eruption likelihoods de-veloping over larger time scales than the Weibull and exponentialdistribution in the near future for Villarrica, and the 100% level isapproached only slowly in the long-term. Since the log-logistic dis-tribution proved to be a good representation of the data, this pointsto competing processes rather contributing to relaxation of the sys-tem and a relatively higher probability of eruption triggering by sim-ple failure. For Llaima, the log-logistic model tends to produce similarresults as the Weibull and exponential distributions, in which the100% probability is reached sooner.
The MOED gives overall lower hazards and reaches eruptionprobabilities close to 100% comparatively late, which is due to the factthat as a mixture of exponential distributions, the MOED itself has adecreasing hazard rate (Marshall and Olkin, 2007).
The MOED-based Bayesian estimate for the present eruption rateis in any case lower than the eruption rate obtained from an expo-nential distribution fit. Since both estimates for future eruption prob-abilities are based on the same functional form (the exponential
distribution), but with different eruption rate parameter (lower forthe Bayesian estimate), it is a natural consequence that the Bayesianprediction consistently gives much lower probabilities for an erup-tion to occur within a given time span. This takes into account thetheoretical consideration that high eruption rate regimes are sup-posed to be shorter than low eruption rate regimes (Mendoza-Rosasand De la Cruz-Reyna, 2009) and we can therefore expect to findourselves in a low eruption rate regime rather than in a high rateregime— particularly if the time since the last eruption has been long.
In comparison, the non-informative Bayesian prediction givesintermediate probabilities within the range of the other approaches.This is not surprising since this estimate is a smooth model general-ising for the entire time span of observation and the total number oferuptions.
Such diverging predictions derived from different models shouldraise alertness from understanding calculated eruption hazard asunimpeachable. The fact that Llaima last erupted in 2008 makes itplausible to believe that the 1994–2008 eruption regime is still on-going, which justifies the extrapolation of the past hazard rate to thepresent and future. There is, however, no confirmation on geologicgrounds that a new regime is not just commencing. The unexpectedChaitén eruption that started in 2008 provides a good example thatthe mere absence of eruptions at a volcano for almost 10,000 yearsdoes not necessarily mean it is extinct. This is especially true forvolcanoes such as the ones this study is focused on, where the large-scale driving force that acts on a much longer time scale, here thesubduction of the Nazca Plate beneath the South American Plate,shows no signs of deceleration or attenuation.
92 Y. Dzierma, H. Wehrmann / Journal of Volcanology and Geothermal Research 193 (2010) 82–92
11. Applicability of the method
The eruption time series of the very active volcanoes Villarrica andLlaima have not been successfully subjected to the implementedstatistical procedure in previous investigations. De la Cruz-Reyna(1991) found globally Poisson-distributed explosive eruptive activityonly for VEI≥4 and to some degree for VEI≥3, but observed severeshortcomings for VEI≤2. However, since this method has not yet beenubiquitously applied to many volcanoes in the world, also possibledistortions for less explosive eruptions are not thoroughly verified. Inthis study, we are forced to use VEI≥2 eruptions (Villarrica) becauseof the scarcity of eruptions with assigned larger VEI. In the course ofscrutinising the approach, we follow the philosophy that an estimatewith limitations will be far more useful than no estimate at all. Inaddition, this work may help to reveal possible systematic deviationsfrom the expectations, and hence, to adjust and better establish thetechnique. Moreover, it is questionable whether it is appropriateto simply ignore smaller eruptions from hazard considerations. Weacknowledge the fact that despite the focus on eruptions with VEI≥2,also smaller eruptions and non-explosive eruptions releasing lavaflows, debouching flank collapses, triggering lahars, with an eruptiveregime characterised largely by intrusions, thus leading to perma-nent quiescent gas emissions, yield a potential of considerable damageto people, property, and ecosystems, or even devastation of the sur-roundings. These smaller explosive and effusive eruptions are alsoable to stepwise relax the system by pressure and stress release, likelyto affect the explosiveness of and the repose time elapsing until thenext eruption.
12. Conclusions
The implementation of standard failure-analysis statistical tech-niques to the eruption time series of the young volcanoes Villarricaand Llaima in the Chilean Southern Volcanic Zone with historicalVEI≥2 eruption records permits to forecast the probabilities of futureeruptions within given time periods. From the Weibull, exponentialand log-logistic distributions, the 100% likelihood of a future eruptionis generally reached in a shorter time span than from MOED-basedanalyses. The non-informative gamma prior for the Bayesian anal-ysis gives intermediate probabilities. For Llaima, all distributions fore-cast at least one eruption with a VEI≥2 to occur within the next20 years at a probability of N90%, which is reached at Villarrica within50 years.
Despite the discussed limitation of the method, we offer thisapproach as a useful tool for stepping towards hazard evaluation,which should obviously never build up on statistical analyses alone.Volcanic settings have been observed many times to be of untamednature, and statistical eruption forecasting as presented in this studycan do no more than illustrating the likelihood that eruptions willoccur within a time slot considered. For a successful disaster preven-tion, management and mitigation, short-term hazard assessment inthe daily use should be based on informative monitoring techniquessuch as regional recording of seismic activity andquiescent gas release,deformation measurements by GPS networks, constraints on magmacompositions and tectonic features. Joining these sources, and sup-porting them by statistical forecasting, will provide a multi-parameterapproach,which can indicatemuchmore reliably and at shorter noticeif a change in the activity level of the volcanoes is to be expected.
Acknowledgements
This manuscript benefited from many constructive comments ofShane Cronin and an anonymous reviewer. This is contribution num-ber 183 to Sonderforschungsbereich 574 “Volatiles and Fluids in Sub-duction Zones” at Kiel University, funded by the German ResearchFoundation.
References
Akaike, H., 1973. Information Theory and an Extension of the Maximum LikelihoodPrinciple. In: Petrov, B.N., CSAKI, F. (Eds.), Second International Symposium on Infor-mation Theory. Akademiai Kiado, Budapest, pp. 267–281.
Bebbington, M.S., 2007. Identifying volcanic regimes using Hidden Markov Models.Geophys. J. Int. 171, 921–942. doi:10.1111/j.1365-246X.2007.03559.x.
Bebbington, M., 2008. Incorporating the eruptive history in a stochastic model for vol-canic eruptions. J. Volcanol. Geoth. Res. 175, 325–333. doi:10.1016/j.volgeores.2008.03.013.
Bebbington, M.S., Lai, C.D., 1996a. Statistical analysis of New Zealand volcanic occur-rence data. J. Volcanol. Geoth. Res. 74, 101–110.
Bebbington, M.S., Lai, C.D., 1996b. On nonhomogenous models for volcanic eruptions.Math. Geol. 28/5, 585–600.
Burnham, K.P., Anderson, D.R., 1998. Model Selection and Inference: A PracticalInformation-Theoretic Approach. Springer-Verlag, NewYork,NewYork,USA. 353pp.
Connor, C.B., Sparks, R.S.J., Mason, R.M., Bonadonna, C., 2003. Exploring links betweenphysical and probabilistic models of volcanic eruptions: the Soufrière Hills Volcano,Montserrat. Geophys. Res. Lett. 30/13, 1701. doi:10.1029/2003GL017384.
Cox, D.R., Lewis, P.A.W., 1966. The statistical Analysis of Series of Events. Methuen & Co.,London. 285 pp.
Cox, D.R., Oakes, D., 1984. Analysis of survival data. Chapman and Hall, London. 201 pp.De la Cruz-Reyna, S., 1991. Poisson-distributed patterns of explosive activity. Bull.
Volcanol. 54, 57–67.De la Cruz-Reyna, S., 1996. Long-term probabilistic analysis of future explosive erup-
tions. In: Scarpa, R., Tilling, R.I. (Eds.), Monitoring andmitigation of volcanic hazards.Springer, New York, Berlin.
Gelman, A., Carlin, J.B., Stern, H.S., Rubin, D.B., 2009. Bayesian Data Analysis. Chapman &Hall/CRC Texts in Statistical Science, Florida.
Gibbons, J.P., 1976. Nonparametric method for quantitative analysis. Holt, Rinehart andWinston, New York, USA.
Ho, C.-H., 1990. Bayesian analysis of volcanic eruptions. J. Volcanol. Geoth. Res. 43, 91–98.Ho, C.-H., 1991. Time trend analysis of basaltic volcanism for the Yukka Mountain site.
J. Volcanol. Geoth. Res. 46, 61–72.Klein, F.W., 1982. Patterns of historical eruptions at Hawaiian volcanoes. J. Volcanol.
Geoth. Res. 12, 1–35.Lara, L.E., Clavero, J., 2004. Villarrica Volcano (39.5°S), Southern Andes, Chile, vol. 61.
Servicio Nacional de Geología y Minería.Lopez, L., Cembrano, J., Moreno, H., 1995. Geochemistry and tectonics of the Chilean
Southern Andes basaltic Quaternary volcanism (37°–46°S). Rev. Geol. Chile 22 (2),219–234.
Marshall, A.W., Olkin, I., 2007. Life Distributions: Structure of Nonparametric, Semi-parametric, and Parametric Families, Spinger Series in Statistics.
Marzocchi, W., Sandri, L., Gasparini, P., Newhall, C., Boschi, E., 2004. Quantifying prob-abilities of volcanic events: the example of volcanic hazard at Mount Vesuvius.J. Geophys. Res. 109, B11201. doi:10.1029/2004JB003155.
Mendoza-Rosas, A.T., De la Cruz-Reyna, S., 2008. A statistical method linking geologicaland historical eruption time series for volcanic hazard estimations: application toactive polygenetic volcanoes. J. Volcanol. Geoth. Res. 176, 277–290. doi:10.1016/j.volgeores.2008.04.005.
Mendoza-Rosas, A.T., De la Cruz-Reyna, S., 2009. A mixture of exponentials distributionfor a simple and precise assessment of the volcanic hazard. Nat. Hazards Earth Syst.Sci. 9, 425–431.
Mulargia, F., Tinti, S., 1986. Un approccio di soluzione al probleme del punto di svolta.Statistica 46, 47–57.
Mulargia, F., Gasperini, P., Tinti, S., 1987. Identifying different regimes in eruptiveactivity: an application to Etna Volcano. J. Volcanol. Geoth. Res. 34, 89–106.
Muñoz, M., 1983. Eruption patterns of the Chilean volcanoes Villarrica, Llaima, andTupungatito. Pageoph 121 (5–6), 835–852.
Naranjo, J.A., Moreno, H., 2005. Geología del Volcán Llaima, Región Araucaría & CartaGeológica de Chile Basica, No. 88.
Newhall, C.G., Self, S., 1982. The Volcanic Explosivity Index (VEI): an estimate of explo-sive magnitude for historical volcanism. J. Geophys. Res. 87/C2, 1231–1238.
Scarpa, R., Tilling, R.I., 1996. Monitoring and mitigation of volcanic hazards. Springer,New York, Berlin.
Sigiura, N., 1978. Further analysis of the data by akaike's information criterion and thefinite corrections. Comm. Statistics—Theory and Methods 7/1, 13–26. doi:10.1080/03610927808827599.
Simkin, T., Siebert, L., 1994. Volcanoes of the World, 2nd ed. Geosciences Press, Tucson,Arizona, USA.
Solow, A.R., 2001. An empirical Bayes analysis of volcanic eruptions. Math. Geol. 33/1,95–102.
Spiegel, M.R., Stephens, L.J., 2008. Theory and Problems of Statistics, Schaum's OutlineSeries, Forth edition. McGraw-Hill, New York. doi:10.1036/0071485848.
Stern, C.R., 2004. Active Andean volcanism: its geologic and tectonic setting. Rev. Geol.Chile 31–2, 161–206.
Turner, M.B., Cronin, S.J., Bebbington, M.S., Platz, T., 2008. Developing probabilisticeruption forecast for dormant volcanoes: a case study from Mt Taranaki, NewZealand. Bull. Volcanol. 70, 507–515. doi:10.1007/s00445-007-0151-4.
Varley, N., Johnson, J., Ruiz, M., Reyes, G., Martin, K., 2006. Applying statistical analysisto understanding the dynamics of volcanic explosions. In: Mader, H.M., Coles, S.G.,Connor, C.B., Connor, L.J. (Eds.), Statistics in Volcanology. Special Publication ofIAVCEI, 1. Geological Society, London, pp. 57–76.
Watt, S.F.L., Mather, T.A., Pyle, D.M., 2007. Vulcanian explosion cycles: patterns andpredictability. Geology 35/9, 839–842. doi:10.1130/G23562A.1.
Wickman, F.E., 1966. Repose-period patterns of volcanoes. Ark. Min. Geol. 4/7, 291–367.