esample getting started in stock investing & trading illustrated edition
DESCRIPTION
A chapter extract from the new illustrated guide to stocks - from the bestselling Getting Started series by Michael C. Thomsett. This popular and easy-to-use guide to understanding and investing in stocks combines basic and non-technical explanations with many other features: illustrations, definitions in context, examples, charts, key points, and valuable resources including online supplemental learning tools.TRANSCRIPT


v
v
CONTENTS
Acknowledgments viiiElement Key ixIntroduction xi
PART 1 INVESTING
CHAPTER 1 THE NATURE OF STOCK INVESTING 3Favorable Conditions for Owning Stocks 4Relationships between Price and Fundamental Value 5
CHAPTER 2 INVESTMENT RISKS 17Market Risk 18Leverage Risk 20Knowledge and Experience Risk 22Sector Risk 25Political and Economic Risk 26
Infl ation Risk and Tax Risk 27Fundamental Risk 30Lost Opportunity Risk 32
CHAPTER 3 VALUE INVESTMENT AND GROWTH INVESTMENT 37Value Investing and Control 41Value Investing Myths and Facts 43
CHAPTER 4 MARKET STRATEGIES 53A Basic Strategy: Buy and Hold 54A Strategic Requirement: Diversifi cation 55Other Market Strategies 63Ex-Dividend Date Buying 66
CHAPTER 5 FUNDAMENTAL ANALYSIS 71The Balance Sheet 75The Income Statement 77The P/E Ratio: Finding a Bargain-Priced Stock 78Revenue and Earnings: Fundamentals Based on the Operating Statement 83Working Capital: Fundamentals as a Form of Money Management 86
ftoc.indd v 01/02/13 6:33 PM
v
v
CONTENTS
Acknowledgments viiiElement Key ix
noitcudortnI xi
PART 1 INVESTING
CHAPTER 1 THE NATURE OF STOCK INVESTING 3Favorable Conditions for Owning Stocks 4Relationships between Price and Fundamental Value 5
CHAPTER 2 INVESTMENT RISKS 17Market Risk 18Leverage Risk 20Knowledge and Experience Risk 22Sector Risk 25Political and Economic Risk 26
ation Risk and Tax Risk 27Fundamental Risk 30Lost Opportunity Risk 32
CHAPTER 3 VALUE INVESTMENT AND GROWTH INVESTMENT 37Value Investing and Control 41Value Investing Myths and Facts 43
CHAPTER 4 MARKET STRATEGIES 53A Basic Strategy: Buy and Hold 54
cation 55Other Market Strategies 63Ex-Dividend Date Buying 66
CHAPTER 5 FUNDAMENTAL ANALYSIS 71The Balance Sheet 75The Income Statement 77The P/E Ratio: Finding a Bargain-Priced Stock 78Revenue and Earnings: Fundamentals Based on the Operating Statement 83Working Capital: Fundamentals as a Form of Money Management 86
ftoc.indd v 01/02/13 6:33 PM

vi
vi
CHAPTER 6 DIVIDEND STRATEGIES 93Dividend Yield as a Means for Stock Selection 93Calculating Dividend Yield 94Reinvesting Dividends 97When Dividends Are Earned and Paid 98Picking Stocks for Dividends 101
CHAPTER 7 ALTERNATIVES: STOCKS OR MUTUAL FUNDS 107Investment Clubs 108Types of Mutual Funds 110Mutual Fund Fees 112
Classifi cation by Features 115Other Conduit Investments 117Variable Annuities 119
PART 2 TRADING
CHAPTER 8 THE NATURE OF STOCK TRADING 127Favorable Conditions for Trading Stocks 132Relationships between Technical and Fundamental Value 137
CHAPTER 9 TRADING RISKS 143Market Risk and Volatility Risk 145Leverage Risk 149Short Position Risk 152Extreme Reaction Risk 153Technical Knowledge and Experience Risk 156Technical Risk and Market Culture 157
CHAPTER 10 TRADING METHODS: DAY AND SWING TRADING 165 Day Trading 166 Swing Trading 172
Exit and Entry Signals 175
CHAPTER 11 CHARTING TOOLS AND INTERPRETATION 185Traditional Types of Charts 186Candlestick Charts: The Basics 189Combining Candlesticks with Western Technical Analysis 198
ftoc.indd vi 01/02/13 6:33 PM

vii
CHAPTER 12 ESSENTIAL TECHNICAL INDICATORS 203Support and Resistance: The Trading Range as a Defi ning Attribute of Price 204Popular Price Patterns and Their Meaning 212Trend Lines for Spotting Reversals 217Breakouts and Gaps 219Moving Averages, Oscillators, and Volume Tests 222
CHAPTER 13 SIGNALS AND CONFIRMATION 229Swing Trade Reversals 231Candlestick Reversals 234Signal Failure 241
CHAPTER 14 TECHNICAL ANALYSIS, DOW THEORY, AND PRACTICE 247 The Effi cient Market 248
The Random Walk 251Charles Dow and His Market Theory 257
Glossary 265Recommended Reading 289About the Author 291Index 293
vii
ftoc.indd vii 01/02/13 6:33 PM

viii
viii
Th anks to those many readers who wrote to off er their suggestions and insights to previous editions of this book, including constructive criticism and clarifying questions. Th eir letters have helped to improve the ever-changing sets of explanations and examples, defi nitions, and other materials used in this book.
A very special thanks goes to Debra Englander, my editor for many years at John Wiley & Sons, whose encouragement through many editions of this and other books has been greatly appreciated.
Also, my thanks to Nick Wallwork and Gemma Rosey, whose editorial guidance on this edition was so valuable and professional.
ACKNOWLEDGMENTS
flast.indd viii 01/02/13 6:34 PM

ix
ix
ELEMENT KEY
Defi nitionsThis symbol is found in boxed notations providing specifi c defi nitions of options terms. These are placed within the book to accompany and augment discussions relevant to each defi nition
Key PointsThese highlighted sections emphasize key points or add observations, rules of thumb, resources, and added points that options traders can use.
Valuable ResourcesThese sections provide links to web sites where you will fi nd added value for particular options discussions, to further help in expanding your options knowledge base.
ExamplesNumerous examples illustrate points raised in context and provide a view of how the issues might apply using actual options trades. This is intended to demonstrate practical application of the principles being presented.
flast.indd ix 01/02/13 6:34 PM

x
x
flast.indd x 01/02/13 6:34 PM
xi
xi
INTRODUCTION
Th e stock market has become known as a volatile place to invest. Many risks and opportunities are available to investors and traders alike. Any novice stock market investor needs to develop a complete understanding of the risks they face when money is placed in the market. Th is does not mean you should avoid investing; it does point out how important it is to become educated about risk in the stock market. Th ere are no fast or easy ways to gain knowledge or a trading edge. Paid services, the Internet, and fi nancial planners all off er expert services, but in the fi nal analysis it all comes down to each individual learning for themselves what works and what does not. Are you an investor or a trader? Th is book makes a distinction between investing and trading. An investor is an individual interested in identifying and buying shares of stock for long term price appreciation, also called growth; and earning superior returns from dividends while protecting their capital. Part 1 of this book includes chapters about how to develop an investing program to build your portfolio based on the principles of fundamental analysis. A trader is more interested in moving in and out of investment positions in the short term, making a higher volume of smaller profi ts. Traders rely on reading charts, spotting short-term trends, and taking advantage of the market’s tendency to overreact to current news (meaning that the prices of stocks tend to move too far in one direction, and then correct by reversing). Th is price swing is easy to spot in hindsight, but more diffi cult to anticipate ahead of time. Successful traders work on their skills in identifying the signs based on price charts. Part 2 is focused on trading skills and techniques, and is based on the principles of technical analysis. Th e purpose in compiling this book is to present you with a range of ideas, strategies, and market realities, all aimed at helping you to identify your appropriate risk tolerance level, and then determine which investing and trading ideas are going to work best for you. Everyone is diff erent, so no quick fi x or formula is going to work for everyone. In fact, trying to duplicate someone else’s investing or trading system is not a wise
flast.indd xi 01/02/13 6:34 PM

xii
xii
idea because your unique profi le (including income, assets, experience, and perceptions of markets and risks) demand that your approach makes sense. Today, many people are shy about the market. Th e volatility of recent years is a defi nite problem for anyone who puts capital at risk, but does that mean that staying out of the market makes sense? It does not. Th e alternatives are bleak. Savings rates are lower than ever before and do not outpace infl ation. Th is means that even the modest infl ation of recent years erodes the purchasing power of money left in savings. Th e only sensible alternative is to develop a program of investing and trading that minimizes risk while off ering superior returns. Avoiding the market is just as great a problem as taking too many risks within the market; so the best approach is to develop a portfolio defensively. A “defensively” built portfolio is one that is developed with complete knowledge about risk and opportunity, which you build and manage based on thorough research, acquired knowledge, and resistance of market forces. Th is book is designed with this necessity in mind. In the future, markets will go through cycles of relatively low volatility, followed by highly erratic months or even years. Investors and traders can earn profi ts in all kinds of markets, assuming that they have built a defensive portfolio and avoided taking risks they cannot aff ord. Th is makes it essential not only to understand risks, but also to defi ne where you fi t in the risk spectrum. Most people are going to be somewhere in the middle between extreme conservatism and extreme speculation, but that is a broad range. For this reason, both of the fi rst two sections of the book begin with chapters examining and explaining a range of diff erent risks. Th e purpose in this endeavor is not to provide easy answers, but to help you to begin your journey into acquiring knowledge about a complex and changing stock market. Knowledge reduces risk and increases profi t. Th is is the basic premise that has dominated the preparation of this book. Since publishing the fi rst edition, the markets have become even more volatile than in the past. Th is is in some respects a disturbing trend because it means that risks are high for everyone. However, in another sense volatile markets present many opportunities that are not to be found in calmer, less volatile investing environments.
flast.indd xii 01/02/13 6:34 PM

xiii
Several new features have been added to this edition. Th is illustrated edition is designed to appeal visually as well as to greatly improve on the connection between graphics and text. A new Chapter 1 describes the nature of stock investing by examining common myths and beliefs. A new Chapter 6 discusses dividend strategies. Many investors ignore the importance of dividends; but this form of income may represent a very important segment of overall returns. In Part 2, Chapter 8 has been added to set up the following chapters with an examination of the nature of stock trading. In Chapter 13, you fi nd a summary of signals and confi rmation of price movement. Th ese new chapters, together with updated chapters from the fi rst edition, provide novices with an overview of the market; and provide more experienced investors and traders with an important overview of how the market works, keeping risk in mind, and setting up policies and goals to enhance your success in the ever-changing and volatile stock market.
xiii
flast.indd xiii 01/02/13 6:34 PM

xiv
xiv
flast.indd xiv 01/02/13 6:34 PM
xv
xv
GETTING STARTED IN
flast.indd xv 01/02/13 6:34 PM

50 INVESTING
50
c03.indd 50 01/02/13 7:03 PM

51Value Investment and Growth Investment
51
c03.indd 51 01/02/13 7:03 PM

52 INVESTING
52
c03.indd 52 01/02/13 7:03 PM

53Market Strategies
4CHAPTER MARKETSTRATEGIES
Every investor needs to develop a series of strategies for investing. An investment strategy is a set of rules and procedures you use to pick invest-ments, decide when to close positions, and match desired returns with levels of risk. Investing without a specifi ed set of rules and procedures is not advis-able. You need to know what is an acceptable risk and how you are going to manage that risk through a range of selections in your portfolio. Many novice investors focus only on fi nding stocks they believe will increase in value. Th e concept of investing in this approach is summarized in a single idea: Buy stock, wait for it to grow in value, and then sell.
Of course, everyone wants to make a profi t. But without an investment strategy, how do you know which stocks to buy and which are too risky? How long will you hold stocks? What rate of return do you expect, or
Finding stocks with appreciation potential is not enough. You also need to limit your search to stocks with acceptable levels of risk.
Key Point
53
c04.indd 53 01/02/13 7:13 PM

54 INVESTING
Buy Low, Hold Long? Your portfolio contains many well-valued stocks. Because you applied sound fundamental analysis in the selection of these issues, your intention is to hold for the long term. Criteria include growing earnings, exceptionally high dividend yield, low historical volatility, steady debt ratio, and a P/E ranging between 15 and 25. However, you also have self-imposed rules for disposing of stocks. These rules are based on movement of trends outside your well-defi ned parameters for the buy-and-hold strategy.
Examples
what dollar amount of profi t will generate a sale? Th ese are basic ques-tions, but if you do not ask them, then you have not defi ned acceptable risks, appropriate stocks, or procedures for selling when the time is right.
Th e fi rst and best-known market strategy is called buy and hold. Under this plan, you decide which stocks meet your risk criteria and are funda-mentally sound, pay an attractive dividend, and are in a sector you believe has exceptional growth potential. You then buy shares of stock, intending to hold them for the long term. Properly selected value investments are likely to work best in a buy-and-hold strategy. A buy-and-hold strategy may involve purchase of additional shares in the future, reinvestment of dividends, and well-planned diversifi cation to avoid unnecessary market and cyclical risks. If you combine the standards of value investing with a buy-and-hold strategy (often thought to be part of the same investment strategy), you will probably seek companies that pay a higher-than-average dividend, that are leaders in their sectors, and that have at least a 10-year record of exceptional performance under a short list of fundamental indicators (see Chapter 5).
A BASIC STRATEGY: BUY AND HOLD
c04.indd 54 01/02/13 7:13 PM

55Market Strategies
Value companies share many attributes, including a history of growing revenue and profi ts, higher-than-average dividends, and strong working capital controls.
Key Point
Th e idea behind diversifi cation is that it does not make sense to place all of your capital in one place. Th e risk is too great. So you spread risks by selecting diff erent stocks or other products, so that no single economic, cyclical, or market event or news will disrupt your entire portfolio. Th e methods of diversifi cation are many. Best known among these is spreading risk by selecting diff erent stocks. As a basic form of diversifi ca-tion, this move makes sense. Owning three stocks with equal dollar values in each, rather than placing all of your cash into a single stock, means that a decline in value of any one only aff ects one-third of the total.
Buy and hold tends to defi ne an entire portfolio. Investors who are more conservative than average in their approach to portfolio manage-ment are likely to also be value investors. If you fi t this defi nition, you probably will fi nd yourself attracted to stocks that have a long history of outperforming not only the market in general, but other companies in their industry. Th is is one of the attributes of a value investment, and as part of the buy-and-hold approach, you are likely to be comfortable with the buy-and-hold approach to an exceptionally well managed, competi-tive, and adequately capitalized company.
A STRATEGIC REQUIREMENT:DIVERSIFICATION
The Risk of Ineff ective Diversifi cationTh is may not be enough diversifi cation, however. If all three stocks are in the same industry, a change in the economy aff ecting that industry is also likely to aff ect all three stocks. Industries tend to share the same business cycles and to react to economic news (unemployment, interest rates, cur-rency values) in a similar manner. Even diff erent industries may react to the same economic news in the same manner. So simply holding several diff erent stocks might still expose you to market risk. For example, if you hold stock in three companies, all of which do the majority of their business overseas, how will currency exchange trends aff ect value? If all of your companies rely on borrowing
c04.indd 55 01/02/13 7:13 PM

56 INVESTING
Owning several stocks subject to the same kinds of market risks is not diversifi cation; it is simply living with the same risks in diff erent stocks.
Key Point
money to fund operations, how will rising interest rates impact stock prices? To truly diversify among diff erent companies, your holdings should be among companies that do not share the same vulnerability, especially to factors likely to hit the stock price in a negative way. For example, if you buy shares in companies in diff erent industries but all are technology stocks, any factors hurting stock prices are likely to lead to declines in the value of your entire portfolio.
Diversifying by Company SizeAnother consideration in diversifying your portfolio is the level of market capitalization (market cap). Th is is a popular comparative measure-ment, representing the value of a corporation’s net worth (assets minus liabilities). Net worth primarily consists of the value of capital stock and retained earnings. Market capitalization is the sum of all outstanding common shares, multiplied by the current market price per share. So when stock prices rise, so does market cap; and when market price falls, so does market cap. Th e distinctions are made among companies not so much due to daily price fl uctuations, but in broader terms. Th e three primary categories in terms of market cap are large-cap ($10 billion or more of equity value), mid-cap (between $2 and $10 billion), and small-cap (less than $2 bil-lion). Additional distinctions are made by some to include mega-cap, or companies whose net worth is greater than $200 billion; and micro-cap, including companies with equity value between $50 million and $300 million. Th ese distinctions are important because they provide an important method for diversifying beyond simply buying diff erent stocks. Th e big-cap companies are often the strongest in terms of market domination. Th ese companies also tend to fi t the defi nition of blue-chip companies, those paying dividends even in soft markets, with stable and growing earnings and little or no long-term liabilities.
The total dollar value of a company’s net worth, including the most frequently used classifi cations of large-cap, mid-cap, and small-cap.
market capitalization
The dollar value of a company’s equity value (assets less liabilities), divided into capital stock and retained earnings (the sum of all profi ts and losses from year to year) and other equity adjustments.
net worth
c04.indd 56 01/02/13 7:13 PM

57Market Strategies
In selecting large-cap stocks, you opt for safety, but at times this may also mean lower-than-average volatility. Such companies at times, but not always, may move more slowly than the average company in the market. On the other end of the spectrum, small-cap stocks tend to be much more speculative because they are young and do not have a track record. However, those that succeed may do so with dramatic price appreciation. It’s important to remember that every large-cap stock started out as a small-cap stock.
Market capitalization as a factor in diversifying is easily overlooked but can be one of the most important ways to spread risk. It’s similar to buying real estate. Where do you buy? How much are houses worth? Is the neighborhood on the rise or on the decline? Are high-priced homes appreciating faster or slower than average-priced or low-priced homes? Anyone who tracks the real estate market understands quite well how the price range of homes defi nes market trends. Th e same is true for stocks.
A useful article on the topic of market capitalization published by Stanford University can be viewed atwww.stanford.edu/~mikefan/metrics/marketcap.html.
Valuable Resource
Large, well-capitalized companies tend to be safer. They may also tend not to off er as much profi t potential. Picking the right long-term investments is a balancing act.
Key Point
The accumulated sum of a corporation’s after-tax net profi ts, increased each year a profi t is reported, and reduced whenever a net loss occurs.
retained earnings
A classifi cation of companies whose total equity value is between $2 and $10 billion.
mid-cap
A classifi cation of companies whose total equity value is greater than $10 billion.
large-cap
c04.indd 57 01/02/13 7:13 PM

58 INVESTING
How much is a trillion? This amount is impossible to imagine. But some perspective helps. A stack of $100 bills adding up to $1 million is about fi ve feet high. A stack equal to $1 billion is one mile. And a stack equal to $1 trillion is 10 miles high.
Key Point
A method of diversifi cation may be to spread capital among the three major classifi cations (large-cap, mid-cap, and small-cap) to expose yourself to potential price appreciation while also having a portion of the portfolio in safer companies with a longer track record. Th e market is huge, and you will have no problem fi nding companies in any of the classifi cations. Th e total value of all publicly traded compa-nies is about $40 to $50 trillion (Reuters, March 21, 2007; and Federa-tion of Exchanges, www.world-exchanges.org).
Diversifying by market cap is one of many ways to spread risk. An al-ternative to market cap is enterprise value (EV), which is a measurement of the entire business, including both equity and debt capitalization. Market cap is based on valuation of common stock alone; EV adds preferred stock as well as all long-term debt. You can also diversify in terms of liquidation risk, meaning buying some preferred shares to create an ultra-safe position for a part of your portfolio. You may also diversify by buying some domestic and some foreign stocks. Today, with the global online availability of trading, it is easier than ever to invest around the world. Many specialized funds (see later in this chapter) also specialize by country or region. You can also diversify by investing in U.S. companies with a large share of income derived from overseas. Well-known examples include Johnson & Johnson (JNJ), Coca-Cola (KO), and McDonald’s (MCD), among many others.
Companies with equity value above $200 billion.
mega-cap
Companies with equity value of between $50 and $300 million.
micro-cap
A classifi cation of companies whose total equity value is less than $2 billion.
small-cap
c04.indd 58 01/02/13 7:13 PM

59Market Strategies
Mutually Benefi cial: You have devoted a segment of your portfolio to direct ownership of stocks, and another portion to mutual funds. Because you consider yourself a moderate investor, you have selected a primary mutual fund identifi ed as focusing on conservative growth and a second fund identifi ed as emphasizing aggressive income. This level of diversifi cation within the realm of mutual funds is one of many methods for spreading risks.
Examples
Mutual Funds for Diversifi cationDiversifying by combining direct ownership of stock and other meth-ods is a very popular choice. Th e mutual fund has been a widely popular investment vehicle for many decades. A fund is an organization that combines the capital of thousands of individuals to create a single diversi-fi ed portfolio. Funds are organized by investment objective (conservative, aggressive), type of income (growth, income), or a balance of these cri-teria—an income fund, for example, focused on bonds and, to a degree, on stocks paying higher-than-average dividends. A balanced fund buys positions in both equity and debt.
A variety of the traditional mutual fund is the exchange-traded fund (ETF). Th is is a mutual fund that identifi es a basket of stocks in advance and does not change that mix unless one of its components changes. Th e traditional mutual fund can be bought and sold only by communi-cating directly with the fund’s management. Value of a share of a mutual fund is determined at the end of the trading day only. In comparison, an ETF can be bought or sold on the public exchanges, and value changes during the trading day just like stock.
Mutual funds can be found to suit any investment objective and type of investment. A study of performance in all kinds of markets is an important step in selecting a fund.
Key Point
An alternative to the measurement of value based on equity alone, or market cap; EV includes all sources of capitalization, including holders of notes and bonds (debtors), as well as common and preferred stockholders.
enterprise value (EV)
Companies with strong earnings, a history of regular dividend payments, and little or no long-term liabilities; fi nancially strong and stable companies.
blue chip
c04.indd 59 01/02/13 7:13 PM

60 INVESTING
Exchange-traded funds are the hot new kind of mutual fund. They off er many advantages, but these are no guarantee that ETFs will always outperform the traditional fund.
Key Point
One great advantage to the ETF beyond its high liquidity is that it identifi es its components in advance, meaning the management of the fund is virtually automatic. Mutual funds charge for managing a portfolio and once you buy shares you have little to say about the buy and sell deci-sions management makes. In an ETF, you know in advance what is in the fund. Th is is an advantage because it gives you automatic diversifi cation; it is also a disadvantage because the return on an ETF is going to be the average of all its components. For example, if an ETF holds 10 stocks in one sector, of which three outperformed the others, the overall return is going to be equal to the average of all 10, not of the three outperformers.
ETFs exist for a variety of defi ned groups, including:
• Specifi c sectors or industries• Stocks of specifi c countries or regions• Shorts (ETFs that sell components instead of buying)• Emerging markets• Debt instruments, including fi xed-income ETFs• Currencies• Real estate• Commodities
Every month, new ETFs are added to the growing list, and new cat-egories are also added. Th e ETF market is an excellent way to diversify as long as you think the entire basket of stocks (or bonds) is worth holding. Remember, though, that an ETF will only earn the average return of all its components.
(Called ordinary shares in the UK) Ownership in a corporation including voting rights for membership on boards of directors and corporate policies. Common stockholders have the lowest priority in the event of liquidation, below bondholders and preferred stockholders.
Classifi cation of ownership with priority in dividend payments and liquidation above both debtors and common stockholders; however, preferred stockholders have no voting rights.
common stock
preferred stock
c04.indd 60 01/02/13 7:13 PM

61Market Strategies
Under- and Overdiversifi cationTh is brings up a new issue concerning diversifi cation. Clearly, the best-known problem is underdiversifi cation, a condition in which you are exposed to too much risk in your portfolio because your holdings are too similar and subject to the same market forces. Equally destructive is the opposite, or overdiversifi cation, when you have capital spread out so broadly that overall returns are mediocre and, worst of all, below the market average. If you overdiversify, meaning you spread your risks around to too many diff erent stocks, you cannot beat the market average. Th is is a problem faced by mutual funds, especially very large funds. Th ey are required to limit their holdings in any one company, so they have to buy many diff er-ent stocks. As a result, many are overdiversifi ed. As a consequence, most mutual funds report results lower than the popular indexes by which the markets are measured. Only one out of six funds performed better than the bull market of the 1990s (that’s only 42 out of 258 managed equity funds examined). And the average margin by which those beat the aver-ages was very slim. (Th ese funds were measured against the well-known S&P 500 Index.1)
1John C. Bogle, Common Sense on Mutual Funds (New York: John Wiley & Sons, 2000).
Mundane Returns? You have purchased a small number of shares in dozens of companies. Your purpose was to diversify eff ectively. However, some of your holdings have risen in value while others have fallen. Overall, your return last year was lower than the S&P 500. What went wrong? The answer may be that you were overdiversifi ed. A possible solution: Invest part of your portfolio in a market Index, and then focus on a very small number of exceptional companies and track their fundamentals. Buy stock in a few likely winners.
Examples
An investment company designed to combine the capital of many individuals to create a single portfolio designed to meet specifi ed investment and risk objectives.
mutual fund
A type of mutual fund with a pre-identifi ed basket of stocks with a common element. The ETF is traded over public exchanges just like shares of stock.
exchange-traded fund (ETF)
c04.indd 61 01/02/13 7:13 PM

62 INVESTING
It surprises some people to hear that most mutual funds have done worse than the market averages. This happens for many reasons, among them the tendency to overdiversify.
Key Point
A more recent study, from 2004 through 2008, revealed that 66.21 percent of all managed stock funds in the United States reported results worse than the overall market (measured against the S&P Composite 1500 Index.2) Th e overall report of 66.21 percent of all funds means that only about one-third of funds outperformed the overall market. Th is is due to overdiversifi cation as one important factor in the outcome. In selecting a mutual fund for those who decide to choose that route, past performance is important but so is asset size.
Diversifying with mutual funds might seem a logical and easy step. But be aware that smaller funds have greater fl exibility than extremely large ones and can move money around more easily. Buying funds is one way to diversify within the stock market. You can mix directly owned stocks with shares of mutual funds and ETFs. You can also mix between value investments and speculation, as well as stocks in between. Volatility levels are a sound test of market risk, so diversifying by levels of volatility is one fi nal way to spread capital around.____________ 2 Justin Fox, “Breaking News: Mutual Fund Managers Keep Failing to Beat the Market,”Time/CNN, April 20, 2009.
Condition when a portfolio is spread so broadly that exceptional advantages in some holdings are off set by under-performance in others, resulting in a poor overall return.
over-diversifi cation
A common condition in which a portfolio is focused on too few stocks or on stocks exposed to the same market risks.
under-diversifi cation
c04.indd 62 01/02/13 7:13 PM
63Market Strategies
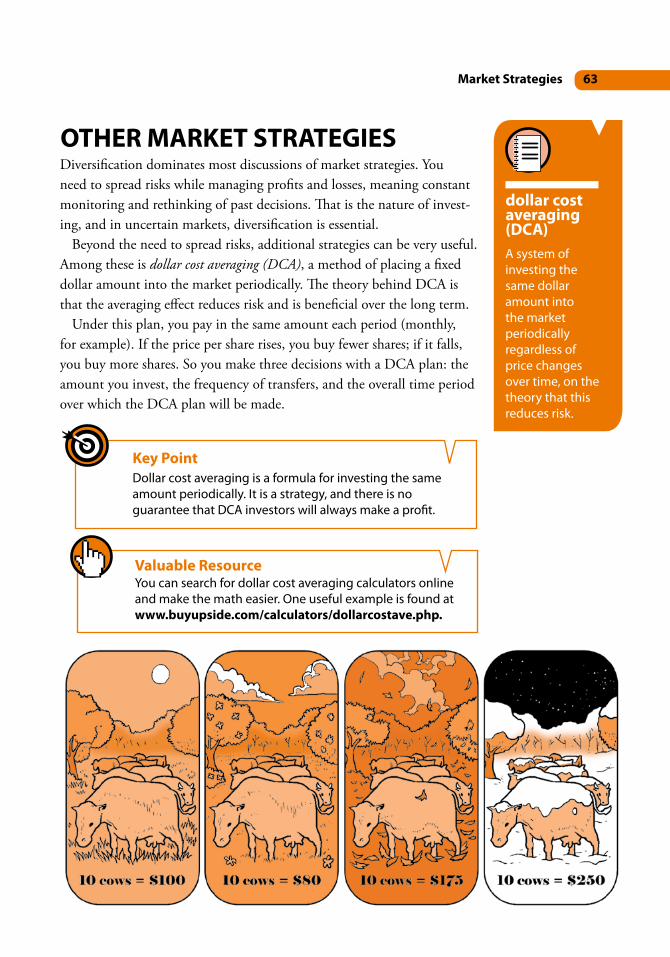
A system of investing the same dollar amount into the market periodically regardless of price changes over time, on the theory that this reduces risk.
dollar cost averaging (DCA)
Diversifi cation dominates most discussions of market strategies. You need to spread risks while managing profi ts and losses, meaning constant monitoring and rethinking of past decisions. Th at is the nature of invest-ing, and in uncertain markets, diversifi cation is essential. Beyond the need to spread risks, additional strategies can be very useful. Among these is dollar cost averaging (DCA), a method of placing a fi xed dollar amount into the market periodically. Th e theory behind DCA is that the averaging eff ect reduces risk and is benefi cial over the long term. Under this plan, you pay in the same amount each period (monthly, for example). If the price per share rises, you buy fewer shares; if it falls, you buy more shares. So you make three decisions with a DCA plan: the amount you invest, the frequency of transfers, and the overall time period over which the DCA plan will be made.
OTHER MARKET STRATEGIES
Dollar cost averaging is a formula for investing the same amount periodically. It is a strategy, and there is no guarantee that DCA investors will always make a profi t.
Key Point
You can search for dollar cost averaging calculators online and make the math easier. One useful example is found at www.buyupside.com/calculators/dollarcostave.php.
Valuable Resource
c04.indd 63 01/02/13 7:13 PM

64 INVESTING
Notice that as the price per share increases, the average price per share tracks the uptrend, but the average is always lower than the current mar-ket price. Th e proponents of DCA point to this as an advantage. Th ere is also an advantage if and when prices fall as shown in Table 4.2. When the share price falls, the average price per share falls as well, but is always higher than current market value. So if you had bought $3,000 of stock at $20 per share in a lump sum, it would get you 150 shares. At the end of the period, it would be worth $2,400, for a loss of $600. In comparison, the approximately 165 shares would be worth $2,719, for a loss of only $281. So in a falling market, DCA reduces the market risk.
Table 4.1 Dollar Cost Averaging, Rising Market
Month Deposit Share Price Number of Shares Average Price per
Share
1 $500 $20 25.00 20.002 500 20.50 24.39 20.253 500 22.00 22.73 20.834 500 22.25 22.47 21.195 500 24.00 20.83 21.756 500 25.00 20.00 22.29
A study of what happens if the stock price moves up or down shows how DCA has appeal to many people. For example, if you transfer $500 per month into a stock currently selling at $20 per share, what happens if the stock price rises every month? An example is shown in Table 4.1.
c04.indd 64 01/02/13 7:13 PM

65Market Strategies
Table 4.2 Dollar Cost Averaging, Falling Market
Month Deposit Share Price Number of Shares Average Price per Share
1 $500 $20 25.00 20.002 500 19.50 25.64 19.753 500 18.75 26.67 19.424 500 18.00 27.78 19.065 500 17.00 29.41 18.656 500 16.50 30.30 18.21
The decision to invest with DCA or by lump sum is a matter of personal choice, including opinions about how rapidly price appreciation (or decline) is likely to occur.
Key Point
To critics of the system, the whole DCA looks like a gimmick. A varia-tion is to time purchases of stock for price dips. Markets rarely move straight up or down over six months, but are more likely to experience price changes in either direction. So if you buy after a signifi cant price decline, you get a better average price. For the long-term-minded value investor, the timing of purchases seems too much like a speculative timing strategy and may easily lead to lost opportunities if the price continues to rise while the investor waits on the sideline for the price dip that never arrives.
To proponents of DCA, the proof is found in a demonstration of what happens in both kinds of markets. In a rising market, the basis is always lower than the current price. In a falling market, the loss is always less than it would have been buying a lump sum at the beginning of the pe-riod.
c04.indd 65 01/02/13 7:13 PM
66 INVESTING
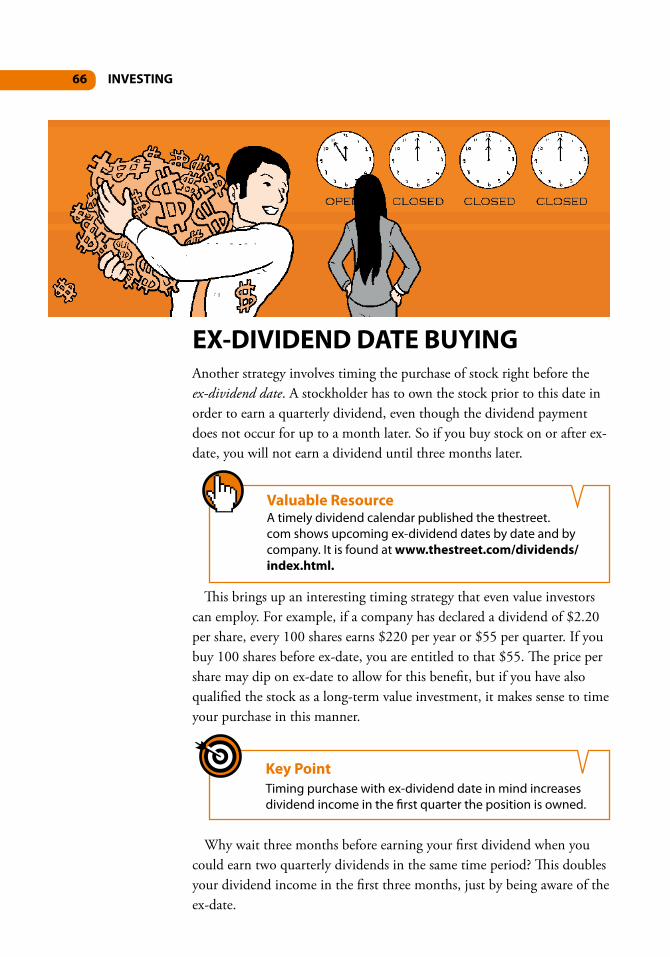
A timely dividend calendar published the thestreet.com shows upcoming ex-dividend dates by date and by company. It is found at www.thestreet.com/dividends/index.html.
Valuable Resource
Another strategy involves timing the purchase of stock right before the ex-dividend date. A stockholder has to own the stock prior to this date in order to earn a quarterly dividend, even though the dividend payment does not occur for up to a month later. So if you buy stock on or after ex-date, you will not earn a dividend until three months later.
Th is brings up an interesting timing strategy that even value investors can employ. For example, if a company has declared a dividend of $2.20 per share, every 100 shares earns $220 per year or $55 per quarter. If you buy 100 shares before ex-date, you are entitled to that $55. Th e price per share may dip on ex-date to allow for this benefi t, but if you have also qualifi ed the stock as a long-term value investment, it makes sense to time your purchase in this manner.
EX-DIVIDEND DATE BUYING
Timing purchase with ex-dividend date in mind increases dividend income in the fi rst quarter the position is owned.
Key Point
Why wait three months before earning your fi rst dividend when you could earn two quarterly dividends in the same time period? Th is doubles your dividend income in the fi rst three months, just by being aware of the ex-date.
c04.indd 66 01/02/13 7:13 PM
67Market Strategies
Knowing when to buy is an important skill. However, it is equally important to know when to sell.
Key Point
A related strategy is to reinvest dividends in the purchase of additional shares, which creates a compound return rather than a simple return based on dividend yield. Most brokerage accounts allow you to make this election at the time you purchase shares. In all market strategies, you will also want to establish clear policies and goals for buying as well as for selling shares of stock. Th e basic goal of buying should be based on a complete analysis of a company’s funda-mentals (see Chapter 5). If you wait for a price dip to buy shares, you are likely to get a short-term bounce on the price, which is a good start to a long-term hold.
It is equally important to know when to sell. Long-term buy-and-hold does not mean keeping a stock in your portfolio no matter what. Value investors need to continually monitor a company to ensure that it continues to meet the criteria for a value investment. As soon as a com-pany’s fundamental strength or profi tability change, it is likely that stock prices will begin to decline. Recognizing the changes as soon as they begin gives you the chance to sell shares and fi nd a new, stronger candidate. By monitoring the fundamental trends, you will be able to spot a reversal or leveling out of those trends, and to decide right away whether to continue holding or to sell. Th e next chapter examines some of the more important fundamental indicators you need to track.
The cutoff date for earning of dividends. Stockholders who own stock the day before ex-date earn a dividend to be paid a few weeks later. Anyone buying stock on or after the ex-date has to wait until the next quarter before earning dividends.
ex-dividend date
c04.indd 67 01/02/13 7:13 PM

68 INVESTING
68
c04.indd 68 01/02/13 7:13 PM

69Market Strategies
69
c04.indd 69 01/02/13 7:13 PM

70 INVESTING
70
c04.indd 70 01/02/13 7:13 PM
293Index
INDEX
Accumulation/distribution line, 224Alcoa, 242Altria, 95–96, 210–211Amazon.com, 23Apple, 213–214AT&T, 211, 212
Back-end sales load, 112, 113Balance sheet, 75–78Balanced fund, 116Bank of America, 215–216Barnes & Noble, 23Basket of stock, 111Bear market, 145Boeing, 205–206Breadth of trading, 146, 168Breakaway gap 221Break-even rate, 29–30Breakouts, 148–149, 219–222Bulkowski, Th omas, 236Bull market, 145Buy and hold, 54–55
Candlestick charts, 186, 189–197, 234–240Capital gains, 4–5Capitalization–based fund, 117Capitalization–weighted average, 258Caterpillar, 80, 82, 84–85, 87, 88–89, 134–135CDSL. See Contingent deferred sales load (CDSL)Chaikin Money Flow (CMF), 224Channel, 210, 211Charles Schwab & Co., 73Charting, 185–199, 234–240Chevron, 217–218, 232
Circuit breaker, 27Citicorp, 103Closed-end fund, 111Coca-Cola, 58Common gap, 221Common stock, 58Compound interest, 4Conduit investments, 107, 117–119Confi rmation, 144, 177, 229–230, 240Consolidation, 18–19Contingent deferred sales load (CDSL), 113Continuation day, 192Cootner, Paul, 253Core earnings, 74Cum dividend, 99Current ratio, 86–87
Day trading, 166–172Debt ratio, 88Delta Airlines, 8Disruption risk, 26Diversifi cation, 55–62Dividends, 4, 41, 48, 66–67, 93–100, 101–103Dogs of the Dow, 102–103Doji, 191Dollar cost averaging (DCA), 63–65Dot-com decline, 251Double top or bottom, 214–216Dow, Charles, 257–258Dow Jones Industrial Average (DJIA), 102–103, 257–258Dow Th eory, 243Dragonfl y doji, 193
293
bindex.indd 293 01/02/13 7:58 PM

294 INDEX
e*Trade, 73Earnings per share (EPS), 79Eastern technical analysis, 186Eastman, George, 7Eastman Kodak, 7–8, 9, 12, 103Economic risk, 26Eff ective tax rate, 29–30Effi cient market theory, 39, 249–251Engulfi ng pattern, 195, 237–238Enron, 30–31Enterprise value (EV), 58Entry and exit signals, 144, 175–181, 241–243Equity fund, 116Exchange-traded fund (ETF), 59–60, 102, 111Ex-dividend date, 66–67, 98–99Exhaustion gap, 222Experience risk, 22–24Exponential moving average (EMA), 223Extreme reaction risk, 153–156Exxon Mobil, 210–211
Fannie Mae (FNMA), 118Financial statements, 44, 71, 75–78Fiscal year, 75Fixed-income fund, 116Forward P/E, 79Freddie Mac (FHLMC), 118Front-end sales load, 112, 113Fundamentals, 5–13, 30–32, 37–38, 41–49, 71–74
General Electric, 217General Mills, 80–81, 83–84, 87, 88–89, 215–215General Motors, 8, 103Ginnie Mae (GNMA), 118Gravestone doji, 193Greater fool theory, 155
Hamilton, William P., 259Hammer and hanging man, 194Harami pattern, 195Head and shoulders, 212–213Hedge fund, 117HELOC, 150Home Depot, 187–188, 189–191
IBM, 220–221, 235–236, 258Income statement, 77–78Index fund, 117Infl ation risk, 27–30Institutional investors, 73Intel, 214–215Intra-day trading, 169
Investment clubs, 108–110Investment, 17–18, 37–38, 41–49, 53–55, 63–65
Japanese candlestick charts, 186, 189–197, 234–240Johnson & Johnson, 58JPMorgan Chase, 212
KB Home, 238Kendall, Maurice, 253Knowledge risk, 22–24Kroc, Ray, 9, 12Large-cap, 56Lehman Brothers, 8Leverage risk, 20–22, 149–152Line charts, 187Liquidity risk, 27, 28Lo, Andrew W., 255, 256n.Load funds, 111, 112Long candles, 192Long-legged doji, 193Lost opportunity risk, 32–33
MacKinley, Charles, 255, 256n.Malkiel, Burton, 253Management fee, 114Margin account, 20–21, 22Market
capitalization, 56, 57 culture, 157–161 cycle, 17
risk, 18–19, 145–149Marubozu, 192McDonald’s, 7, 9–11, 12, 58, 258Mega-cap, 56Mergent, Inc., 102Micro-cap, 56Microsoft, 218Mid-cap, 56, 57Momentum oscillators, 132, 222–225, 233Momentum trading, 169Money market fund, 117Mortgage pools, 117–118Moving average convergence/divergence (MACD), 223Moving averages (MAs), 168, 222–225Mutual fund balanced, 116
basket of stocks, 111 capitalization-based, 117 closed-end, 111
conduit, 107, 117–119contingent deferred sales load (CDSL), 113
bindex.indd 294 01/02/13 7:58 PM

295Index
diversifi cation, 59–60 equity, 116
ETF, 59–60, 102, 111 family, 119 features, 115–117 fees, 112–115 fi xed-income, 116 hedge, 117 index, 117
load, 111, 112management fee, 114money market, 117net asset value (NAV), 115–116
no-load, 112 open-end, 111 prospectus, 114
redemption fee, 114rule 12b-1, 114–115sales load, 111, 112
specialty, 116tax-free bond, 117
types, 110–111unit investment trust, 111variable annuities and, 119–121
Myths and facts, 43–49
Narrow range day (NRD), 173, 178, 191, 231–232NASDAQ, 258National Association of Investors Corporation (NAIC), 108–110Nelson, S.A., 258Net asset value (NAV), 115–116Net worth, 56No-load funds, 112
OHLC chart, 188Open–end fund,111Opening and closing orders, 166Options, 151–152Overdiversifi cation, 61–62
Pacifi c Gas and Electric, 8Paper trading, 23–24Philip Morris, 95–96Political risk, 26PowerShares, 102Preferred stock, 58Price/earnings ratio (P/E), 78–82Price–weighted average, 258Procter & Gamble, 220Profi t motive, 3–4Prospectus, 114Purchasing power, 27, 29
Random walk theory, 39, 251–256Ratios, 44Real body, 189Real estate investment trust (REIT), 118–119Real estate mortgage investment conduit (REMIC), 118Redemption fee, 114Reinvested dividends, 48, 97–98, 103Relative Strength Index (RSI), 224, 233REMIC. See Real estate mortgage investment conduit (REMIC)Resistance, 148, 168Retail investors, 73Retained earnings, 56, 57Revenue and earnings, 83–86Reverse head and shoulders, 213–214Risk disruption, 26 economic, 26
experience, 22–24, 156–157extreme reaction, 153–156
fundamental, 30–32greed and panic, 155
infl ation, 27–30 investment, 17–18
knowledge, 22–24, 156–157leverage, 20–22, 149–152liquidity, 27, 28lost opportunity, 32–33
margin, 20–21market, 18–19, 145–149
political, 26 sector, 25
short position, 152–153 tax, 27–30 technical, 157–161 tolerance, 33 volatility, 145–149Round-trip trade, 166Rule 12b-1, 114–115Runaway gap, 221
S&P, 62, 258S&P Stock Reports, 73, 74Sales load, 111, 112Scottrade, 73Sears Holding, 129–131, 233Secondary market, 118Sector risk, 25Set-up signals, 172Shadows, 189, 239–240Short candles, 193Short position risk, 152–153
bindex.indd 295 01/02/13 7:58 PM

296 INDEX
Signals, confi rmation and failure, 229–230, 241–243Simple interest, 4Small-cap, 56, 57SPDR Gold Trust, 206–207, 236Specialty fund, 116Speculation, 146Spinning top, 194Squeeze alert, 197Stocks, 3–13, 44–49Supply and demand, 18–19Support, 148, 168Swing trading, 172–175, 231–234
Tangible book value, 48Target, 237Tax risk, 27–30Tax-free bond fund, 117TD Waterhouse, 73Technical analysis defi ned, 143
approach to analysis, 5–6chartist, 157, 170
Dow Th eory, 257–261 Eastern, 186 effi cient market, 248–251 indicators, 203–204
market culture, 157–161random walk, 251–256
range fl ip, 205 resistance, 148, 168, 204–212
risk, 157–161support, 148, 168, 204–212
theories, 247–248 Western, 186Th ree black crows, 197, 2363M, 258Th ree white soldiers, 196, 235Total capitalization, 88Toyota Motors, 241–242Trading
accumulation/distribution line, 224breadth, 146, 168breakaway gap, 221breakout, 148–149, 219–222Chaikin Money Flow (CMF), 224channel, 210, 211charts, 167, 185–186common gap, 221
conditions, 132–136 confi rmation, 111, 177, 229–230, 240 congestion, 175–176 day, 166–172
double top or bottom, 214–216
downtrends, 173entry and exit, 144, 175–181exhaustion gap, 222failed signal, 157, 241–243gaps, 157, 176, 178, 180, 219–222
guidance, 136halt, 26head and shoulders, 212–213
intra-day, 169 methods, 165–166
momentum oscillators used for, 132, 222–225, 233
momentum, 169moving averages (MAs), 168, 222–225narrow range day (NRD), 173, 178, 191,
231–232nature of, 127–128price patterns, 212–217
range, 146–148relationship to fundamentals, 137–139Relative Strength Index (RSI), 224, 233reverse head and shoulders, 213–214
risks, 143–144runaway gap, 221set-up signals, 172
signals, confi rmation and failure, 229–230, 241–243
speculation, 146swing, 172–175, 231–234trend lines, 217–218
triangle, 215–217 uptrends, 173
volatility, 132, 134, 145–149, 206, 209volume tests, 173, 175, 222–225
Trend lines, 217–218Triangle, 215–217True range, 180Tulip mania, 153–154
Underdiversifi cation, 61–62United Parcel Service, 219–220Unit investment trust (UIT), 111
Vanguard, 102Variable annuities, 119–121Verizon, 134, 239–240Volatility, 41Volume tests, 222–225
Walmart, 128–131Weber, Martin, 255Western technical analysis, 186Working capital, 86–89
bindex.indd 296 01/02/13 7:58 PM

291Glossary
MICHAEL C. THOMSETT (www.MichaelThomsett.com) has written more than 70 books on investing, real estate, business, and management. He is author of several Wiley books, including the eight editions of the bestselling Getting Started in Options, as well as Getting Started in Fundamental Analysis, Getting Started in Real Estate Investing, and Getting Started in Swing Trading. He also has written numerous other stock investing and trading books, including Winning with Stocks (Amacom Books), Stock Profi ts (FT Press), and Mastering Fundamental Analysis and Mastering Technical Analysis (Dearborn Press). The author contributes regularly to many websites, including the CBOE, Benzinga, Seeking Alpha and on his website, ThomsettOptions.com; and writes articles for the AAII Journal and NAIC’s Better Investing. He also teaches fi ve classes at the New York Institute of Finance (NYIF). Thomsett has been writing professionally since 1978 and full time since 1985. He lives near Nashville, Tennessee.
ABOUT THE AUTHOR
291
babout.indd 291 01/02/13 7:57 PM
More titles from Michael Thomsett

Extracted from Getting Started In Stock Investing & Trading, Illustrated Edition published in 2013 by John Wiley & Sons Singapore Pte. Ltd., 1 Fusionopolis Walk, #07-01, Solaris South Tower, Singapore 138628.
Copyright© 2013 by Michael C. Thomsett.
All rights reserved. No part of this publication may be reproduced, stored in a retrieval system or transmitted in any form or by any means, electronic, me-chanical, photocopying, recording, scanning or otherwise, except as expressly permitted by law, without either the prior written permission of the Publisher, or authorization through payment of the appropriate photocopy fee to the Copyright Clearance Center. Requests for permission should be addressed to the
Publisher, John Wiley & Sons Singapore Pte. Ltd., 1 Fusionopolis Walk, #07-01, Solaris South Tower, Singapore 138628, Tel: 65-6643-8000, Fax: 65- 6643- 8008, email: [email protected]