escr bca update report 190802 final for print
TRANSCRIPT

Benefit Cost AnalysisExecutive Summary
August 2019
East Side Coastal Resiliency

What is a BCA? A tool for comparing a project’s costs to a project’s benefits.
What types of costs?The costs to construct, maintain, and operate the project over its lifespan.
What types of benefits?Reduction in flood risk, as well as additional environmental, social, and economic benefits.
BENEFIT COST ANALYSIS (BCA)EXECUTIVE SUMMARY
At a cost of $1.4 billion, the East Side Coastal Resiliency Project will provide $2-$3 billion in benefits over its lifespan.
This BCA was prepared in accordance with the project’s HUD funding. The total cost
used for the BCA excludes supplemental project features outside the scope of HUD’s
review. Ranges reflect variance in benefits analysis. Numbers presented are net present value using a 7 percent discount rate. Numbers have been rounded for clarity. For more detail and full methodology, refer to the Benefit Cost Analysis Report.
2

The East Side Coastal Resiliency project will benefit:
OVER 1,000BUILDINGS
NEARLY 100,000PEOPLE
OVER 250,000WORKERS
BENEFIT COST ANALYSIS (BCA)EXECUTIVE SUMMARY
3

Over its projected 50-year lifespan, the project will prevent an estimated:
$750 MILLION TO $1.4 BILLION IN PROPERTY DAMAGE
$799 TO $857 MILLION IN RELOCATION COSTS AND BUSINESS DISRUPTION
$183 TO $295 MILLION HUMAN HEALTH IMPACTS AND LOST PRODUCTIVITY
$58 TO $230 MILLION LOSS IN PROPERTY VALUE
$173 MILLION IN DAMAGE TO PARK FACILITIES
$20 TO $58 MILLION IN THE LOSS OF SERVICES
Ranges reflect variance in benefits results. Presented in net present value with a 7% discount rate. Numbers have been rounded for clarity. For more detail and full methodology, refer to the Benefit Cost Analysis Report.
+
BENEFIT COST ANALYSIS (BCA)EXECUTIVE SUMMARY
4

In addition, over its projected 50-year lifespan, the improved park space will provide an estimated:
$2 TO $109 MILLION VALUE IN RECREATION
$800,000 TO $1.3 MILLION VALUE IN OPEN SPACE
$480,000 TO $1.1 MILLION VALUE IN AIR, WATER, AND
CLIMATE BENEFITS
Ranges reflect variance in benefits results. Presented in net present value with a 7% discount rate. Numbers have been rounded for clarity. For more detail and full methodology, refer to the Benefit Cost Analysis Report.
Values are based on a range of methodologies, including surveys of consumer willingness to pay for access to recreation and estimates of
the economic value of recreation.
Air quality benefits are based off estimates of the air pollutants that are
captured by vegetation. Water quality improvements are based off stormwater capture. Climate benefits include cooling effect of trees and carbon sequestration.
Values are based on a range of estimates of aesthetic value
created through open space
improvements.
BENEFIT COST ANALYSIS (BCA)EXECUTIVE SUMMARY
5

$0M
$20M
$40M
$60M
$80M
$100M
$120M
$140M
$160M
Year2030 2040 2050 2060 2070
The BCA assesses project benefits and costs over its 50-year lifespan. Future benefits and costs are discounted, and the discout rate used has a significant effect.
Future benefits are lower with a higher discount rate
3% DISCOUNT RATE
7% DISCOUNT RATE
PR
ES
EN
T V
ALU
E (
MIL
LIO
NS
)
YEAR
BENEFIT COST ANALYSIS (BCA)EXECUTIVE SUMMARY
6

,
New York City Department of Design and Construction
East Side Coastal Resiliency
Updated Benefit-Cost Analysis
August 2019

EAST SIDE COASTAL RESILIENCY BENEFIT COST ANALYSIS
arcadis.com ESCR BCA
EAST SIDE COASTAL RESILIENCY Updated Benefit-Cost Analysis
Prepared for:
NYC DDC
30-30 Thompson Ave
Long Island City, NY, 11101
Prepared by:
Arcadis U.S., Inc.
Our Ref.:
LA003466.0001
Date:
August 2, 2019
This document is intended only for the use of the individual or entity for which it was prepared and may contain information that is privileged, confidential and exempt from disclosure under applicable law. Any dissemination, distribution or copying of this document is strictly prohibited.

EAST SIDE COASTAL RESILIENCY BENEFIT COST ANALYSIS
arcadis.com ESCR BCA
VERSION CONTROL Issue Revision No Date Issued Page No Description Reviewed by
1.0 06-04-2019 Preliminary draft Mary Kimball
2.0 07-19-2019 Second draft Mary Kimball
3.0 07-26-2019 Final draft Mary Kimball
4.0 08-02-2019 Final version Mary Kimball

EAST SIDE COASTAL RESILIENCY BENEFIT COST ANALYSIS
arcadis.com Benefit-Cost Analysis 3
CONTENTS Acronyms and Abbreviations ...................................................................................................................... 11
1 Introduction .......................................................................................................................................... 13
1.1 Project Description ....................................................................................................................... 16
1.1.1 Project Useful Life ............................................................................................................ 18
1.2 BCA Process Overview ................................................................................................................ 18
1.3 Summary of BCA Findings ........................................................................................................... 22
1.3.1 Project Benefits ................................................................................................................ 23
1.3.2 Project Costs .................................................................................................................... 24
1.3.3 BCA Results ..................................................................................................................... 25
1.4 Mitigating Duplication of Benefits or Potential Double counting ................................................... 26
1.5 Sensitivity Analysis ...................................................................................................................... 29
1.5.1 Uncertainty, Assumptions, Sensitivities ............................................................................ 29
1.5.2 Discount Rates ................................................................................................................. 30
2 Losses Avoided .................................................................................................................................... 33
2.1 Hazard Scenarios ........................................................................................................................ 33
2.1.1 Coastal Storm Surge ........................................................................................................ 33
2.1.1.1 Interpreting Coastal Flood Scenarios ...................................................................... 33
2.1.1.2 Updated LiDAR and Grade Elevation QA/QC ......................................................... 34
2.1.2 Hurricane Sandy Scenario ................................................................................................ 34
2.2 Direct Physical Damages to Buildings and Contents ................................................................... 34
2.2.1 Depth Damage Functions ................................................................................................. 35
2.2.2 Data Sources .................................................................................................................... 36
2.2.3 Analysis Steps .................................................................................................................. 37
2.2.3.1 Structure Inventory .................................................................................................. 37
2.2.3.1.1 Structure Square Footage and Residential Units .......................................... 37
2.2.3.1.2 Number of Floors per Structure and Square Footage by Floor ..................... 38
2.2.3.1.3 Structure Grade Elevation ............................................................................. 39
2.2.3.2 Map Structure Type and Occupancy to Depth Damage Functions, Replacement Values, and Hazus Occupancy Types .................................................................................... 39

EAST SIDE COASTAL RESILIENCY BENEFIT COST ANALYSIS
arcadis.com Benefit-Cost Analysis 4
2.2.3.3 Determine the Analysis Square Footage ................................................................ 39
2.2.3.4 Calculate the Building and Contents Replacement Value ...................................... 40
2.2.3.4.1 Building Replacement Value (BRV) .............................................................. 41
2.2.3.4.2 Contents Replacement Value (CRV) ............................................................ 42
2.2.3.5 Analysis Square Footage Exposure ........................................................................ 43
2.2.3.6 Determine Flood Depths Based on Modeled Flood Scenarios ............................... 47
2.2.3.7 Calculate Percent Damage and Physical Loss Values ........................................... 47
2.2.4 Quality Control Evaluations .............................................................................................. 47
2.2.4.1 QA/QC of Elevations ............................................................................................... 47
2.2.4.2 QA/QC of PLUTO Building Class Code .................................................................. 47
2.2.4.3 QA/QC of Direct Physical Damages ....................................................................... 48
2.2.5 Assumptions ..................................................................................................................... 48
2.2.6 Results .............................................................................................................................. 48
2.3 Displacement ............................................................................................................................... 49
2.3.1 Relocation and Business Interruption ............................................................................... 50
2.3.1.1 Expected Impacts ................................................................................................... 50
2.3.1.2 Data Sources .......................................................................................................... 51
2.3.1.3 Analysis Steps ........................................................................................................ 52
2.3.1.4 Relocation Assumptions and Avoidance of Benefit Duplication ............................. 53
2.3.1.5 Relocation Results .................................................................................................. 54
2.3.2 Shelter Needs ................................................................................................................... 55
2.3.2.1 Expected Impacts ................................................................................................... 55
2.3.2.2 Data Sources .......................................................................................................... 55
2.3.2.3 Shelter Needs Analysis Steps ................................................................................. 55
2.3.2.3.1 Shelter Needs Assumptions and Avoidance of Benefit Duplications ............ 58
2.3.2.3.2 Shelter Needs Results .................................................................................. 59
2.3.3 Business Interruption ........................................................................................................ 59
2.3.3.1 Approach ................................................................................................................. 60
2.3.3.2 Assumptions and Avoidance of Benefit Duplication ............................................... 61
2.3.3.3 Results .................................................................................................................... 63
2.4 Human Impacts ............................................................................................................................ 65
EAST SIDE COASTAL RESILIENCY BENEFIT COST ANALYSIS
arcadis.com Benefit-Cost Analysis 5
2.4.1 Casualties ......................................................................................................................... 65
2.4.1.1 Expected Impacts ................................................................................................... 65
2.4.1.2 Data Sources .......................................................................................................... 65
2.4.1.3 Analysis Steps for Injuries ....................................................................................... 66
2.4.1.4 Analysis Steps for Fatalities .................................................................................... 67
2.4.1.5 Assumptions ........................................................................................................... 72
2.4.1.6 Results .................................................................................................................... 74
2.4.2 Mental Stress and Anxiety ................................................................................................ 74
2.4.2.1 Expected Impacts ................................................................................................... 74
2.4.2.2 Data Sources .......................................................................................................... 75
2.4.2.3 Analysis Steps ........................................................................................................ 76
2.4.2.4 Assumptions ........................................................................................................... 78
2.4.2.5 Results .................................................................................................................... 78
2.4.3 Lost Productivity ............................................................................................................... 78
2.4.3.1 Expected Impacts ................................................................................................... 79
2.4.3.2 Data Sources .......................................................................................................... 79
2.4.3.3 Analysis Steps ........................................................................................................ 79
2.4.3.4 Assumptions ........................................................................................................... 81
2.4.3.5 Results .................................................................................................................... 81
2.5 Transportation Loss of Service .................................................................................................... 81
2.5.1 Expected Impacts ............................................................................................................. 81
2.5.2 Data Sources .................................................................................................................... 82
2.5.3 Analysis Steps .................................................................................................................. 82
2.5.3.1 Car Traffic (Roads) ................................................................................................. 82
2.5.3.2 Expected Bus Service Loss .................................................................................... 86
2.5.4 Assumptions ..................................................................................................................... 87
2.5.5 Results .............................................................................................................................. 88
2.6 Public and Essential Facility Loss of Service ............................................................................... 89
2.6.1 Expected Impacts ............................................................................................................. 89
2.6.1.1 Schools ................................................................................................................... 90
2.6.1.2 Libraries .................................................................................................................. 91

EAST SIDE COASTAL RESILIENCY BENEFIT COST ANALYSIS
arcadis.com Benefit-Cost Analysis 6
2.6.1.1 Parks ....................................................................................................................... 91
2.6.2 Assumptions and Avoided Benefit Duplication ................................................................. 92
2.6.3 Results .............................................................................................................................. 92
2.7 Avoided Property Value Loss ....................................................................................................... 92
2.7.1 Data Sources .................................................................................................................... 93
2.7.2 Approach .......................................................................................................................... 93
2.7.3 Assumptions ..................................................................................................................... 94
2.7.4 Results .............................................................................................................................. 94
2.8 Damage to Recreational Facilities ............................................................................................... 95
2.8.1 Assumptions ..................................................................................................................... 96
2.8.2 Results .............................................................................................................................. 96
2.9 Hurricane Sandy Impacts ............................................................................................................. 97
2.9.1.1 Identify Critical, Essential, and Public Assets ......................................................... 97
2.9.2 Public Infrastructure .......................................................................................................... 97
2.9.2.1 Transportation Systems .......................................................................................... 98
2.9.2.2 Water and Wastewater Utilities ............................................................................... 98
2.9.2.3 Electrical Systems ................................................................................................... 99
2.9.3 Residential and Commercial Impacts (Direct Physical Damages and Relocation Costs) 99
2.9.4 Human Impacts .............................................................................................................. 100
2.9.5 Loss of School Service ................................................................................................... 101
2.9.6 Damage to Parks ............................................................................................................ 102
2.9.7 Business Interruption (Economic Impacts) ..................................................................... 102
2.10 No Action Alternative ................................................................................................................. 103
3 Value Added ...................................................................................................................................... 105
3.1 Environmental Value .................................................................................................................. 105
3.1.1 Approach ........................................................................................................................ 105
3.1.2 Assumptions and Avoiding Benefit Duplication .............................................................. 107
3.1.3 Results ............................................................................................................................ 107
3.2 Recreation Benefits .................................................................................................................... 108
3.2.1 Recreation Benefits ........................................................................................................ 108

EAST SIDE COASTAL RESILIENCY BENEFIT COST ANALYSIS
arcadis.com Benefit-Cost Analysis 7
3.2.2 Analysis Steps ................................................................................................................ 109
3.2.2.1 Recreation Benefit Limitation and Assumptions ................................................... 110
3.2.3 Results ............................................................................................................................ 110
3.3 Aesthetic Benefits ...................................................................................................................... 111
3.3.1 Data Sources .................................................................................................................. 111
3.3.2 Approach ........................................................................................................................ 112
3.3.3 Assumptions ................................................................................................................... 112
3.3.4 Results ............................................................................................................................ 113
4 Benefits not Quantified ....................................................................................................................... 114
4.1 Health Benefits ........................................................................................................................... 114
4.2 Avoided Deployment of Emergency Services ............................................................................ 114
4.3 Reduced Costs of Flood Insurance ............................................................................................ 115
5 Conclusion ......................................................................................................................................... 116
5.1 Risks to On-going Project Benefits ............................................................................................ 120
5.1.1 Sea Level Rise Scenario ................................................................................................ 120
5.1.2 ESCR Project Loss of Function ...................................................................................... 120
5.1.3 Other Resilience Measures ............................................................................................ 120
5.2 Potential Challenges to Project Implementation ........................................................................ 120
5.2.1 Implementation Schedule ............................................................................................... 120
5.2.2 Technical Risks .............................................................................................................. 121
5.2.3 Stakeholder Engagement ............................................................................................... 121

EAST SIDE COASTAL RESILIENCY BENEFIT COST ANALYSIS
arcadis.com Benefit-Cost Analysis 8
TABLES Table 1. Summary of Updates Since the 2017 BCA .................................................................................. 14
Table 2. Benefit Summary .......................................................................................................................... 20
Table 3. Summary of Losses Avoided Medium Benefits Scenario (Results Presented in the 000’s) ......... 24
Table 4. Summary of Value Added, Medium Benefits Scenario. (Results presented in 000’s) .................. 24
Table 5. Summary of ESCR Project Costs ................................................................................................. 25
Table 6. BCA Results, Medium Scenario ................................................................................................... 25
Table 7. Summary of Double counting Approach ....................................................................................... 26
Table 8. Summary of Uncertain Variables .................................................................................................. 29
Table 9. Summary of Benefit Range and Present Value ............................................................................ 31
Table 10. Summary of Benefit Range and Benefit Cost Ratio ................................................................... 32
Table 11. Applicable PLUTO and DoITT Attributes .................................................................................... 37
Table 11. USACE NACCS, Number of Stories per Prototype/Depth Damage Function Analysis .............. 40
Table 12. Replacement Values .................................................................................................................. 42
Table 13. Summary of Building Inventory Replacement Value from the 1-Percent Annual Chance Flood Event .......................................................................................................................................................... 43
Table 14. Results for Each Modeled Flood Scenario (Presented in the 000s), Low and Medium Scenario .................................................................................................................................................................... 49
Table 15. Results for Each Modeled Flood Scenario (Presented in the 000s), High Scenario .................. 49
Table 16. Damage State Correlations ........................................................................................................ 53
Table 17. Total Relocation Losses Avoided by Modeled Flood Scenario (Presented in the 000s), Low and Medium Scenario ........................................................................................................................................ 54
Table 18. Total Relocation Losses Avoided by Modeled Flood Scenario (Presented in the 000s), High Scenario ..................................................................................................................................................... 54
Table 19. Weight Factors for Income and Age ........................................................................................... 57
Table 20. Relative Modification Factors ..................................................................................................... 57
Table 21. Constant for Each Combination of Income and Age Class ........................................................ 57
Table 22. Number of People Seeking Shelter by Modeled Flood Scenario, Low and Medium Scenario ... 59
Table 23. Number of People Seeking Shelter by Modeled Flood Scenario, High Scenario ....................... 59
Table 24. Economic Losses Avoided for Each Modeled Flood Scenario ................................................... 63
Table 25. FAA Category Levels and Values ............................................................................................... 66
Table 26. Expected Material Loss (D) Values by Percent Annual Chance Coastal Flood Event ............... 68

EAST SIDE COASTAL RESILIENCY BENEFIT COST ANALYSIS
arcadis.com Benefit-Cost Analysis 9
Table 27. P Factor Descriptions ................................................................................................................. 69
Table 28. P Values ..................................................................................................................................... 70
Table 29. W Factor Descriptions ................................................................................................................ 70
Table 30. W Values .................................................................................................................................... 71
Table 31. Value of Expected Injuries and Fatalities Avoided (Presented in the 000s) ............................... 74
Table 32. Prevalence of Mental Health Issues After a Disaster ................................................................. 76
Table 33. Cost of Treatment After a Disaster (30 Month Duration) Per Person Expected to Seek Treatment ................................................................................................................................................... 77
Table 34. 30-month Loss in Productivity Per Worker, Attributed to Severe Mental Health ........................ 80
Table 35. Roadway Impacts Summary (Presented in the 000s) ................................................................ 85
Table 36. Impacts to Bus Service Summary (Presented in the 000s) ........................................................ 87
Table 37. Summary Transportation Loss of Service Results, Excluding Benefits Removed Due to Potential Double Counting (Presented in the 000s) ................................................................................... 88
Table 38. Park Impacts by Flood Scenario ................................................................................................. 91
Table 39. Annual Benefits for Avoided Lost School, Library and Park Service (Presented in the 000s) ... 92
Table 40. Summary of Assessment Ratios by Tax Class ........................................................................... 93
Table 41. Property Value Benefits of Flood Risk Reduction (Presented in the 000s) ................................ 94
Table 42. Avoided Damage to Specific Park Facilities (Presented in the 000s) ......................................... 96
Table 43. Avoided Damage to Park Landscape and Utilities (Presented in the 000s) ............................... 96
Table 44. Total Benefits for Avoided Losses to Parks (Presented in the 000s) ......................................... 97
Table 45. Human Impacts of Hurricane Sandy (Presented in the 000s) .................................................. 101
Table 46. Business Interruption Post Hurricane Sandy (Presented in the 000s) ..................................... 102
Table 47. Potential Impacts if No Action is Taken (Presented in the 000s)* ............................................ 103
Table 48. Low, Medium, and High Benefit Scenario Approach Summary ................................................ 106
Table 49. Annual Environmental Benefit Dollar Values and Sources ....................................................... 106
Table 50. Environmental Benefits of the ESCR Project ........................................................................... 108
Table 51. Recreation Benefit Results for the Low-, Medium-, and High-Benefit Scenarios (in 000s) ...... 111
Table 52. Aesthetic Benefits of Park Space and Trees ............................................................................ 113
Table 53. Project Scenario Results (Low Estimated Benefits) ................................................................. 116
Table 54. Project Scenario Results (High Estimated Benefits) ................................................................ 116
Table 55. Losses Avoided Results Low Scenario (Presented in the 000s) .............................................. 117

EAST SIDE COASTAL RESILIENCY BENEFIT COST ANALYSIS
arcadis.com Benefit-Cost Analysis 10
Table 56. Losses Avoided Results High Scenario (Presented in the 000s) ............................................. 118
Table 57. Value Added Benefit Results, Low Scenario (Presented in the 000s) ...................................... 119
Table 58. Value Added Benefit Results, High Scenario (Presented in the 000s) ..................................... 119
FIGURES Figure 1. Proposed Project Area Aerial Map …………………………………………………………………15
Figure 2. Project Design Elevation ............................................................................................................. 16
Figure 3. Rendering of Improve East River Park at Delancey St. .............................................................. 17
Figure 4. Factors Considered During Project Design ................................................................................. 18
Figure 5. Illustrative Diagram of Benefit Cost Ratio .................................................................................... 19
Figure 6. Sea Level Rise Curve Comparison ............................................................................................. 33
Figure 7. Expected Structural and Contents Damage from Inundation, NACCS Urban High Rise Prototype. Damage at negative flood depths accounts for impacts to mechanical, electrical, and plumbing systems that may be located at or below grade. ........................................................................................ 35
Figure 8. Summary of Total Estimated Direct Physical Damages for the 1% annual chance flood event (Structural and Contents) ........................................................................................................................... 46
Figure 9. Top Ten Industries Impacted at the 1 Percent Annual Chance Coastal Flood Event ................. 64
Figure 10. Storm Event Hydrograph at The Battery ................................................................................... 71
Figure 11. FDR Route and Alternate Route ............................................................................................... 83
Figure 12. Impacted Streets During the 1 Percent Annual Chance Coastal Surge Event, Plus SLR in the 2050s .......................................................................................................................................................... 84
APPENDIX CONTENTS Methodology and Results Summary Table
ESCR Project Cost Estimates
USACE Structure Depth Damage Functions
USACE Contents Depth Damage Functions
FEMA Displacement Depth Damage Functions
Hazus Restoration Time Table
Mapping Scheme
Hazus Technical Manual Excerpts
Research Valuing Property Value, Recreation, Aesthetic, and Ecosystem Service Benefits

EAST SIDE COASTAL RESILIENCY BENEFIT COST ANALYSIS
arcadis.com Benefit-Cost Analysis 11
Pluto Data Dictionary
Business Interruption Results
ACRONYMS AND ABBREVIATIONS ARC: American Red Cross BBL: Borough-Block-Lot BCA: Benefit Cost Analysis BCAR: BCA Re-Engineering Report BCR: Benefit Cost Ratio BEA: Bureau of Economic Analysis BIN: Building Identification Number BLS: Bureau of Labor Statistics BRV: Building Replacement Value CDC: Centers for Disease Control CRV: Contents Replacement Value CSRV: Contents-to-Structure Ratio Value CSO: Combined Sewer Overflow DDF: Depth-Damage Function DEM: Digital Elevation Model DoITT: Department of Information Technology & Telecommunications ELOF: Economic Loss of Function EPA: U.S. Environmental Protection Agency FAA: Federal Aviation Administration FEMA: Federal Emergency Management Agency GIS: Geographic Information System
IFPS: Integrated Flood Protection System
LiDAR: Light Detection and Ranging
MEP: Mechanical/Engineering/Plumbing NACCS: North Atlantic Coast Comprehensive Study NOAA: National Oceanic and Atmospheric Administration NYC: New York City NYCHA: New York City Housing Authority PFIRM: Preliminary Flood Insurance Map
PLUTO: Primary Land Use Tax Lot Output

EAST SIDE COASTAL RESILIENCY BENEFIT COST ANALYSIS
arcadis.com Benefit-Cost Analysis 12
PTSD: Post-Traumatic Stress Disorder SAM: Social Accounting Matrix SF: Square Feet SLR: Sea Level Rise USACE: U.S. Army Corps of Engineers WTP: Willingness to Pay

EAST SIDE COASTAL RESILIENCY BENEFIT COST ANALYSIS
arcadis.com Benefit-Cost Analysis 13
1 INTRODUCTION On October 29, 2012, Hurricane Sandy (DR-4085) caused severe flooding in low-lying portions of New York City, affecting homes, businesses, critical infrastructure, and residents throughout the City. Hurricane Sandy highlighted New York City’s vulnerability to coastal flooding and motivated the City to increase efforts to reduce the impacts of future storms and climate change. In response to the event, The U.S. Department of Housing and Urban Development (HUD) initiated a design competition (Rebuild by Design) to attract innovative and holistic resilience solutions: those expected to provide social, environmental, and economic benefits in addition to avoided flood loss. The City proposed an integrated flood protection system (IFPS) along the Manhattan waterfront, and HUD selected the project to receive funding. The New York City Department of Design and Construction (DDC) selected the East Side Coastal Resiliency (ESCR) design team to perform a feasibility study and generate conceptual designs for a portion of the Lower East Side integrated flood protection system along 2.4 miles of the East River waterfront, known as the ESCR project (see Figure 1).
HUD requires RBD grantees to develop and submit an Action Plan Amendment that reflects the final designed project as a condition to release funds for project implementation, per 79 FR 62182 and HUD Notice: CPD-16-06. The Action Plan Amendment must include an Environmental Review and benefit cost analysis (BCA). The BCA assesses social, environmental, and economic benefits that will result from the implementation of the ESCR project. In accordance with HUD guidance, the BCA uses federally accepted standard figures and methods to assess project benefits and help inform decision making related to public infrastructure investment.
The City project team and the ESCR design team developed and analyzed four project alternatives through community engagement and agency coordination. A BCA was conducted for the Preliminary Preferred Alternative (PPA) project in 2017. In spring 2018, a constructability review was conducted to assess options to reduce construction risks associated with the proposed approach. As a result, in October 2018, a design update was developed for Project Area One that involves integrating flood protection with the raising and reconstruction of East River Park. This design update includes additional access improvements and the reconstruction of East River Park to protect this valuable resource from flooding during coastal storm events as well as inundation from sea level rise, which would enhance its value as a recreational resource in addition to providing flood protection to the inland communities. See Section 1.1 Project Description for more detail on the project and the design process.
It is important to note that this updated BCA is based not only on revised cost estimates for the new design, but also updated information and updated BCA methodologies. Refer to Table 1 for a summary of updates. The level of protection of the project has not changed.
This updated BCA uses project costs available for the design level complete as of the date of this report. Project costs are subject to change as the City continues to refine the ESCR project’s final design.
After the selection of the preferred alternative, BCA analysts coordinated with the ESCR design team to understand the revised design and any changes to the project’s goals, design, and costs. This BCA report includes five principal sections:
• Section 1 Introduction includes a description of the ESCR project, a description of the process taken to complete the BCA, a summary of BCA findings, and a sensitivity analysis

EAST SIDE COASTAL RESILIENCY BENEFIT COST ANALYSIS
arcadis.com Benefit-Cost Analysis 14
• Section 2 Losses Avoided includes a description of applicable hazards, methods for calculating losses avoided, and analysis results
• Section 3 Value Added presents the method and results of value-added benefits
• Section 4 Benefits not Quantified describes project benefits that cannot be quantified monetarily
• Section 5 Conclusion presents detailed BCA results and project costs
Table 1. Summary of Updates Since the 2017 BCA1
BCA Category Description of Updates since 2017
Project Costs Total project costs have been updated based on the revised design, and revised cost estimates.
Direct Physical Damages to Buildings
Analysis has been updated based on changes to the building inventory and land use data in the study area, an updated digital elevation model (DEM) which provides estimates of the elevation of buildings, as well as updated replacement costs to reflect 2019 costs. Refer to Section 2.2 for more detail.
Human Impacts Analysis has been updated with current population data from the U.S. Census, as well as updated standard federal values on costs of treatments, costs of injuries, and the value of a human life.
Displacement Analysis has been updated with current population data from the U.S. Census, updated relocation costs based on inflation, and updated local rent rates.
Business Interruption
Analysis has been updated with current land use information in the study area, and an updated economic impact assessment was conducted.
Transportation Analysis has been updated with current bus ridership data and the MTA’s current budget.
Public and Essential Facility Loss of Service
Analysis had been updated to include more schools and libraries based on new information on the scope of mitigation projects, as well as current budgets. Losses to park service have also been included.
Avoided Property Value Loss
Analysis has been updated with current property value data.
Damage to Park Facilities
This is a new component of the analysis that has been added.
Environmental Benefits Analysis has been updated based on the revised design.
1 Analysts conducted a high-level analysis of the previous ESCR design, using an estimated project cost of $1.3 billion with updated 2019 base data and found that the prior design had a BCR of 0.97 using the low benefit estimate and 7% discount rate.

EAST SIDE COASTAL RESILIENCY BENEFIT COST ANALYSIS
arcadis.com Benefit-Cost Analysis 15
Figure 1. Proposed Project Area Aerial Map

EAST SIDE COASTAL RESILIENCY BENEFIT COST ANALYSIS
arcadis.com Benefit-Cost Analysis 16
1.1 Project Description The ESCR project area is located along the eastern coast of Manhattan from a southern boundary at Montgomery Street, along Franklin Delano Roosevelt Drive (the FDR) and East River Park, through Stuyvesant Cove Park, and terminates along 25th Street at the VA Hospital Campus (Figure 1). New York City proposes to install an integrated flood protection system that includes a combination of floodwalls, closure structures, and deployable systems, along with infrastructure improvements that would significantly reduce the risk of impact of coastal storm surge flooding and mitigate stormwater runoff concerns within the project area. The project’s benefitting area includes the Lower East Side, East Village, Stuyvesant Town, and Peter Cooper Village. The City expects the ESCR project to mitigate loss from a one percent annual chance coastal flood event, including sea level rise and wave allowances, while providing societal co-benefits, such as improving access to the East River Park waterfront. This analysis assesses losses avoided for a range of flood scenarios, up to the 0.2 percent annual chance flood (with sea level rise), as project design engineers expect that the project will provide a level of loss mitigation for such an event. More detailed assessment of expected inundation from waves overtopping during a 0.2 percent annual chance flood is needed to fully understand the level of losses avoided. As this analysis is not yet available, this benefit cost analysis makes the conservative estimate that 75% of potential damage from the 0.2 percent annual chance flood would be mitigated.
Figure 2. Project Design Elevation

EAST SIDE COASTAL RESILIENCY BENEFIT COST ANALYSIS
arcadis.com Benefit-Cost Analysis 17
The City project team and ESCR design team developed and analyzed four project alternatives. The selected alternative balances cost considerations with the most valued urban design features and access improvements identified through community engagement and agency coordination, while providing a robust and reliable flood protection system that can be feasibly constructed (see Figure 4). The project will elevate and reconstruct East River Park to make it more resilient to coastal storms and inundation from future sea level rise (see Figure 3). The proposed project also includes: integrating flood protection with open space improvements at other parks along the flood protection alignment including Murphy Brothers Playground, Stuyvesant Cove Park, and Asser Levy Playground; an improved shared use path (bikeway/walkway); and a new shared-use flyover bridge to address the narrow and substandard waterfront public access near the Con Edison facility (on the east side of the FDR Drive between East 13th and East 15th Streets) known as the “pinch point.”2 A project of this scale will provide area residents a multitude of benefits, many of which this report describes and quantifies.
Figure 3. Rendering of Improve East River Park at Delancey St.
2 The costs of the flyover bridge have been excluded from this benefit costs analysis as they are not an integral part of the flood protection project as initially funded by HUD.

EAST SIDE COASTAL RESILIENCY BENEFIT COST ANALYSIS
arcadis.com Benefit-Cost Analysis 18
1.1.1 Project Useful Life
The project useful life is the estimated amount of time that the ESCR project will be effective. The evaluation should represent an understanding of project benefits, as well as operations and maintenance costs, for each year the project is effective. The ESCR design team identified a 50-year project useful life for the integrated flood protection system (IFPS) based on FEMA standard values for major infrastructure improvements, though the team expects the project to remain effective beyond this period, particularly with appropriate maintenance and as needed upgrades. FEMA Mitigation Policy FP-108-024-01 identifies a 100-year lifespan for environmental benefits should the community maintain or protect the space providing such benefits. As such, the BCA includes resiliency, social, and economic benefits and costs that would accrue for 50 years and environmental benefits that would accrue for 100 years after project completion. Sections 2.0 and 3.0 of this report describe the nature of the project elements that contribute to these benefits, and the calculation of such benefits.
1.2 BCA Process Overview
This BCA sources methodologies from the Federal Emergency Management Administration (FEMA), the United States Army Corps of Engineers (USACE), the Federal Aviation Administration (FAA), the Environmental Protection Agency (EPA), and other published sources. The report provides enough detail to help the reader understand the research and processes used to arrive at the benefit cost ratio (BCR) and to duplicate results following the same procedures. Benefits fall into two broad categories: Losses Avoided (also referred to by HUD as resilience benefits) consist of expected direct damages to structures, loss of essential services, and direct impacts to the population; and Value Added, which consists of additional benefits beyond flood protection, such as environmental, aesthetic, and recreational benefits. Costs incorporated into the BCA include all project life-cycle costs, including:
• Project capital investment costs, including design, construction and permitting
• Operations and maintenance (O&M) costs over the project useful life
Figure 4. Factors Considered During Project Design

EAST SIDE COASTAL RESILIENCY BENEFIT COST ANALYSIS
arcadis.com Benefit-Cost Analysis 19
Table 2 provides a breakdown of benefit categories, benefits calculated, and methodology sources and descriptions. The BCR captures each benefit described in the table below as monetized values, except for shelter needs, health benefits, and emergency preparedness and response cost reduction. The BCA report describes and estimates these benefits, but the BCR does not include these benefits to avoid double counting project benefits or because analysts could not apply appropriate methodologies. Section 4.0 describes project benefits not quantified.
Figure 5. Illustrative Diagram of Benefit Cost Ratio

EAST SIDE COASTAL RESILIENCY BENEFIT COST ANALYSIS
arcadis.com Benefit-Cost Analysis 20
Table 2. Benefit Summary
Benefit Category Benefits Calculated Description Source(s)
Losses Avoided
Direct Physical Damages to Buildings
• Structure Damage
• Content Loss • Inventory Loss
This project will reduce the risk from flooding to 1,082 buildings. Analysts applied USACE depth-damage functions (DDFs) to vulnerable structures in the study area. The DDFs consider the type of structure, structure or contents replacement value, and expected flood depth within the structure to estimate the dollar value of contents or structure damage (year 2019 values).
• USACE
Human Impacts
• Casualties (Loss of Life and Injury)
• Mental Stress and Anxiety
• Lost Productivity
There are an estimated 91,000 people who will benefit from this project.3 Natural disasters threaten or cause the loss of health, social, and economic resources, which leads to psychological distress. Methodologies to calculate expected Losses Avoided for human impacts are a product of expected flood depth and damage to people’s homes, and are based on FEMA approved methods, as well as a study by the United Stated Center for Disease Control (CDC) post-Sandy.
• FEMA • FAA • CDC
Displacement
• Relocation Costs • Shelter Needs • Business
Interruption time
Displacement occurs as a direct result of the threat and impact of flood events, and analysts can quantify displacement in several ways. Displacement within this BCA is a function of direct physical damage and flood depth and based on FEMA and USACE source material.
• USACE • FEMA
Business Interruption
• Loss of Employment
• Output Loss
The businesses in the study area who will benefit from the risk reduction provided by this project produce a Gross Regional Product of over $47 Billion per year and employ almost 300,000 workers. Analysts calculate expected
• FEMA • IMPLAN
3 This number includes residents of buildings assessed in the direct physical damages analysis, as well as residents in buildings excluded from that analysis because they are within the scope of work for mitigation programs advanced by NYCHA or HPD (see Table 7 for more detail) but will benefit from the risk reduction to parks, infrastructure, and services provided by ESCR.

EAST SIDE COASTAL RESILIENCY BENEFIT COST ANALYSIS
arcadis.com Benefit-Cost Analysis 21
economic losses from structure damage and business displacement by estimating the time that businesses and homeowners are either displaced, or closed, and the financial losses to industries because of the disaster.
Transportation
• Increased Travel Time
• Lost Fare Revenue
In New York City, 5.4 million people use public transportation each day. Due to flood impacts, people may need alternative transportation methods. Losses avoided include additional time necessary to find and use alternative routes for people impacted by flooding.
• FEMA
Public and Essential Facility Loss of Service
• Service Loss
This project will reduce risks from flooding for the 2 libraries, 24 schools, and 54 parks4 located in the study areas. When public facilities, such as parks, libraries and community centers, and essential facilities, such as hospitals and police stations, experience direct physical damage, there is an associated cost to the community in lost service. These costs are a function of the service type, local service data, and flood depths in the facilities.
• FEMA • New York
City Department of Education
• New York City Public Library
• NYC Department of Parks & Recreation
Avoided Property Value Loss
• Avoided property value loss
Reduction in flood risk has multiple benefits to property owners, including an increase in property value and a reduction in flood insurance premiums. This approach captures estimated avoided property value loss because of flood risk reduction.
• Value of Green Infrastructure Guide (2012)
• EPA
Damage to Park Facilities
• Damage to select park facilities
• Damage to park landscape and utilities
By elevating and providing flood protection to East River Park and other parks in the project area, potential damages to park facilities will be reduced. Facilities include those are expensive to replace, such as comfort stations and other buildings, synthetic turf fields, asphalt paths, courts, plantings, and utilities.
• NYC Department of Parks and Recreation
• USACE
4 Parks analyzed included all community and neighborhood parks, gardens, greenstreets, playgrounds, and recreation fields and courts located in the study area and subject to flooding up to the 0.2% annual chance event.

EAST SIDE COASTAL RESILIENCY BENEFIT COST ANALYSIS
arcadis.com Benefit-Cost Analysis 22
Added Value
Environmental Benefits
• Water Quality • Air Quality • Climate
Regulation
This project will result in a net increase of 399 trees and over 20 acres of improved vegetation. Green spaces, trees, and shrubs benefit water and air quality, and support climate regulation. Environmental benefits can be quantified by assessing avoided costs of grey infrastructure, avoided costs of cleaning up air and water pollution, and the benefits of reduced greenhouse gas emissions, among other factors.
• FEMA • United States
Department of Agriculture (USDA)
• New York City Department of Parks and Recreation
Social Benefits • Recreation and
Health Benefits • Aesthetic Value
Social benefits are based on added recreational and community gathering space. There are willingness to pay (WTP) values associated with these amenities for both recreational benefit and aesthetic values. Willingness to pay refers to the maximum price a consumer will spend on a good or service. The BCA quantifies health cost reductions, but the BCR does not incorporate results to avoid double counting benefits.
• FEMA • Earth
Economics • USACE
1.3 Summary of BCA Findings Arcadis analysts have prepared a BCA report that incorporates both the expected monetary value of losses avoided as a result of ESCR project implementation, as well as value added by the project. The BCA considers resiliency, economic, environmental, and social factors. The report presents results in four ways: annual benefits, present value5 of benefits and costs, net present value (NPV) and, ultimately, the BCR (see equations below).
Analysts estimate losses avoided for certain modeled flood scenarios, then apply the annual probability of occurrence to losses at each flood scenario to determine expected annual losses avoided using the formula below. Analysts assessed flood damages from the 10%, 2%, 1%, and 0.2% annual chance floods. The probability of occurrence refers to the percent chance of an expected flood event being met or exceeded in any given year.
!""#$%'("()*+, = !.(/$0((23,,10%,23,,2%) ∗ (10%− 2%) +
!.(/$0((23,,2%, 23,,1%) ∗ (2% − 1%) +
5 The present value is the current value of a sum of money, in contrast to the future value. The present value is determined by discounting the monetized value of expected annual benefits or costs over the life of the project (50 years).

EAST SIDE COASTAL RESILIENCY BENEFIT COST ANALYSIS
arcadis.com Benefit-Cost Analysis 23
!.(/$0((23,,1%, 23,,0.2%) ∗ (1% − 0.2%) +
23,,0.2% ∗ 0.2%
This analysis incorporates 30 inches of sea level rise, which correlates to the 90th percentile projection in the 2050s, into the flood elevation for each return period.6
To compare future benefits to current cost, analysts apply a discount rate to annual benefits expected over the life of the project to calculate present value. Discounting is a standard accounting practice for valuing return on investments. The BCA for the ESCR project is based on a 7 percent or 3 percent discount rate to account for the fact that cost savings in several decades’ time should be valued at a lower rate than cost savings today. The Federal Office of Management and Budget (OMB) requires a discount rate of 7 percent, but HUD also considers a 3 percent discount rate for review per HUD Notice: CPD-16-06 (refer to Section 1.5.2 Discount Rates for a more detailed discussion of the discount rate). The BCR is the project’s total present value of benefits divided by the project’s total present value of costs. A project is considered cost effective if the BCR is greater than 1.0.
>/(,("+?$%#( = @ >/(,("+A3/+ℎC$D+3/ ∗ !""#$%'("()*+3/E3,+
FGHIJKLMJNOPQRNJ(SJTGU)
VWX(SJTG)
Y(+>/(,("+?$%#( = >/(,("+?$%#(3)Z3+$%>/3[(D+'("()*+, − >/(,("+?$%#(3)Z3+$%>/3[(D+E3,+,
'("()*+E3,+\$+*3 =>/(,("+?$%#(3)Z3+$%>/3[(D+'("()*+,
>/(,("+?$%#(3)Z3+$%>/3[(D+E3,+,
Where: Present Worth Factor is a set multiplier based on a discount rate and Project or Benefits Useful
Life, as appropriate7
1.3.1 Project Benefits
Analysts developed high, medium, and low estimations of benefits for some benefit categories based on uncertainties that resulted in either an alternative assumption in methodology or the use of a different methodology altogether (refer to Section 1.5 Sensitivity Analysis for greater detail). At the medium scenario, the ESCR integrated flood protection system will provide a multitude of benefits totalling $2.10 billion using a 7 percent discount rate as required by the Federal OMB. Results presented in Table 3 and Table 4 reflect medium estimated benefits for each benefit category at both the 7 percent and 3 percent discount rates. Summary tables for the high and low scenario can be found in Section 5 Conclusion. All values are presented in thousands of dollars.
6 Analysts used sea level rise projections from the New York City Panel on Climate Change developed in 2019. 7 Circular A-94 Guidelines and Discount Rates for Benefit-Cost Analysis of Federal Programs. Web page. Located at: https://www.whitehouse.gov/sites/default/files/omb/assets/a94/a094.pdf. Circular A-9 Appendix C. Revised November 2015. Web page. Located at: https://www.whitehouse.gov/omb/circulars_a094/a94_appx-c.

EAST SIDE COASTAL RESILIENCY BENEFIT COST ANALYSIS
arcadis.com Benefit-Cost Analysis 24
Table 3. Summary of Losses Avoided Medium Benefits Scenario (Results Presented in the 000’s)
Benefit Annualized
Benefit Present Value (7%
Discount Rate) Present Value (3%
Discount Rate) Direct Physical Damages and Property Impacts Total Structure Damage Costs
$37,776 $521,337 $971,967
Total Structure Contents Losses
$16,587 $228,908 $426,770
Avoided Property Value Loss
$21,259 $134,325 $108,388
Park Damages $12,551 $173,213 $322,934 Displacement Relocation $2,566 $35,415 $66,027 Business Interruption
$55,309 $763,302 $1,423,082
Human Impacts Mental Stress and Anxiety
$4,716 $65,885 $65,885
Lost Productivity $2,679 $37,427 $37,427 Casualties $5,776 $79,720 $148,627 Critical and Essential Assets Transportation $253 $3,495 $6,516 Public Facilities $1,503 $20,086 $38,668
Table 4. Summary of Value Added, Medium Benefits Scenario. (Results presented in 000’s)
Benefit Annualized
Benefit Present Value (7%
Discount Rate) Present Value (3%
Discount Rate) Environmental Benefits
$56 $800 $1,772
Recreation Benefits $2,620 $36,169 $67,431 Aesthetic Benefits $77 $1,067 $1,990
Results presented for medium benefits. See the Conclusion for low and high estimated benefits.
1.3.2 Project Costs
Costs used in the BCA project include the direct costs for the project, including design, construction, and permitting, as well as operations and maintenance (O&M) costs over the project’s useful life. Annual O&M costs are estimated to be $3.4 million, which is converted to a present value. Table 5 summarizes the total present value of each cost category. Refer to the City’s related Action Plan Amendment for a breakdown of funding sources.

EAST SIDE COASTAL RESILIENCY BENEFIT COST ANALYSIS
arcadis.com Benefit-Cost Analysis 25
Table 5. Summary of ESCR Project Costs8
Cost Category Costs (7 percent Discount Rate)
Costs (3 percent Discount Rate)
Direct Project Costs $1,379,245,288 $1,379,245,288 Present Value* O&M $46,922,537 $87,481,198 Total ESCR Project Costs $1,426,167,825 $1,466,726,486
*Calculated using a 7 or 3 percent discount rate.
The BCA uses project costs available for the design level complete as of the date of this report. Project costs are subject to change as the City refines the ESCR project to reach final design.
1.3.3 BCA Results
The primary goals of the ESCR project are to reduce the risks presented by coastal flooding and climate change for the Lower East Side of Manhattan, improve community connection to and enjoyment of the waterfront through integrated landscape and urban design interventions, and to retain and provide enhanced recreational opportunities in the East River Park. The City project team and ESCR design team developed the preferred alternative, which balances these design goals, to produce a project that is practical and implementable given available funding and site conditions.
BCA analysts compared the ESCR project costs to resiliency, social, economic, and environmental project benefits, and found the ESCR project to be cost beneficial based on current conceptual designs (see date of report). The project is expected to provide a range of resilience, social, economic, and environmental benefits totalling to $2.1 billion in today’s dollars, compared to an investment of $1.43 billion, both at the 7 percent discount rate (Table 6). The net present value of the project is $676 million, and the BCR using a 7 percent discount rate is 1.47.9 Table 6. BCA Results, Medium Scenario
Discount Rate Total Present Value of Costs
Total Present Value of Benefits Benefit Cost Ratio
Calculation A B C = B/A
7% Discount Rate $1,426,167,825 $2,101,803,200 1.47 3% Discount Rate $1,466,726,486 $3,730,841,012 2.54
*Results presented for medium benefits. See the Conclusion for low and high estimated benefits.
The BCA uses project costs available for the design level complete as of the date of this report. Project costs are subject to change as the City refines the ESCR project to reach final design.
8 Total costs for the purposes of the BCA exclude certain project features being advanced in coordination with ESCR (the Flyover Bridge and Corlear’s Hook Bridge), but outside the scope of the project as awarded by HUD. These are features that could be advanced separately and are not critical to the scope of the work as awarded by HUD. 9 All values presented here are for the medium scenario. See conclusion for low and high estimated results.
EAST SIDE COASTAL RESILIENCY BENEFIT COST ANALYSIS
arcadis.com Benefit-Cost Analysis 26
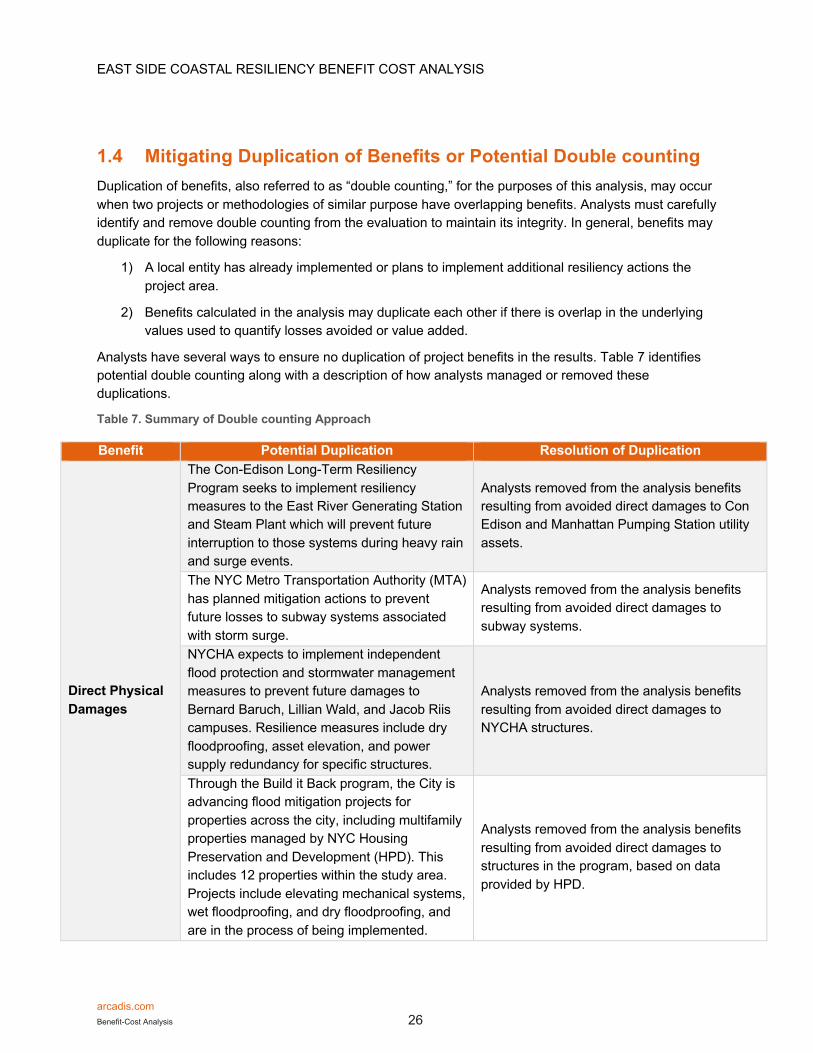
1.4 Mitigating Duplication of Benefits or Potential Double counting Duplication of benefits, also referred to as “double counting,” for the purposes of this analysis, may occur when two projects or methodologies of similar purpose have overlapping benefits. Analysts must carefully identify and remove double counting from the evaluation to maintain its integrity. In general, benefits may duplicate for the following reasons:
1) A local entity has already implemented or plans to implement additional resiliency actions the project area.
2) Benefits calculated in the analysis may duplicate each other if there is overlap in the underlying values used to quantify losses avoided or value added.
Analysts have several ways to ensure no duplication of project benefits in the results. Table 7 identifies potential double counting along with a description of how analysts managed or removed these duplications.
Table 7. Summary of Double counting Approach
Benefit Potential Duplication Resolution of Duplication
Direct Physical Damages
The Con-Edison Long-Term Resiliency Program seeks to implement resiliency measures to the East River Generating Station and Steam Plant which will prevent future interruption to those systems during heavy rain and surge events.
Analysts removed from the analysis benefits resulting from avoided direct damages to Con Edison and Manhattan Pumping Station utility assets.
The NYC Metro Transportation Authority (MTA) has planned mitigation actions to prevent future losses to subway systems associated with storm surge.
Analysts removed from the analysis benefits resulting from avoided direct damages to subway systems.
NYCHA expects to implement independent flood protection and stormwater management measures to prevent future damages to Bernard Baruch, Lillian Wald, and Jacob Riis campuses. Resilience measures include dry floodproofing, asset elevation, and power supply redundancy for specific structures.
Analysts removed from the analysis benefits resulting from avoided direct damages to NYCHA structures.
Through the Build it Back program, the City is advancing flood mitigation projects for properties across the city, including multifamily properties managed by NYC Housing Preservation and Development (HPD). This includes 12 properties within the study area. Projects include elevating mechanical systems, wet floodproofing, and dry floodproofing, and are in the process of being implemented.
Analysts removed from the analysis benefits resulting from avoided direct damages to structures in the program, based on data provided by HPD.

EAST SIDE COASTAL RESILIENCY BENEFIT COST ANALYSIS
arcadis.com Benefit-Cost Analysis 27
Benefit Potential Duplication Resolution of Duplication
Relocation
Relocation costs and business interruption time are two consequences of displacement that result from disaster impacts. Relocation costs and business interruption can be derived as a function of displacement time. Analysts must take care to ensure that these two costs are fully accounted for and that there is no double counting between the two values, particularly in cases where both costs are incurred.
Analysts carefully crafted a methodology to distinguish the relationship between relocation and business interruption based on FEMA Hazus sources so that benefits are not double counted. The main mechanism to avoid benefit duplication is an evaluation of damage state and occupancy for a structure. The analysis assumes that certain types of businesses (such as restaurants, theaters, parking lots, and industrial uses) will not relocate and instead incur business interruption costs. Section 2.0 of this report describes more of these processes.
Relocation costs may be double counted with shelter needs. The relocation approach assumes that all displaced individuals will require alternative living quarters, thus capturing the costs of individuals who may opt or need to go to a shelter.
The BCR does not include costs associated the shelter needs to avoid any possible duplication. Instead, this report provides estimated population expecting to require public shelter in the case of an event for the benefit of the reader.
Business Interruption
Business interruption costs will present a double counting with certain essential service losses that analysts evaluate based on operating budgets or methodologies that consider economic output.
Analysts did not calculate business interruption costs for transportation and utility assets to avoid any potential duplication.
Transportation Loss of Service
The NYC Metro Transportation Authority (MTA) has planned mitigation actions to prevent future losses to subway systems associated with storm surge.
Analysts removed from the analysis loss of subway service.
Public and Essential Facility Loss of Service
The Con-Edison Long-Term Resiliency Program seeks to implement resiliency measures to the East River Generating Station and Steam Plant which will prevent future interruption to those systems during heavy rain and surge events. The Manhattan Pumping Station operated by DEP is elevating critical equipment and installing flood barriers and submersible systems to reduce operation interruptions.
The BCA does not include loss of service for Con Edison and Manhattan Pumping Station utility assets.
Damage to Park Facilities
Flood damage mitigation projects completed or planned within any of the parks in the project area could represent a duplication of benefits.
There are no flood damage mitigation projects in the project area outside of the ESCR project.

EAST SIDE COASTAL RESILIENCY BENEFIT COST ANALYSIS
arcadis.com Benefit-Cost Analysis 28
Benefit Potential Duplication Resolution of Duplication
Recreation
Pier 42, Solar One Initiative, Seward Park/Essex Crossing, Site 5, and Pier 35 are all projects separate from the ESCR scope of work that plan to improve recreational space within the project area. Such improvements may impact park visitation and may duplicate recreation benefits for different park sites.
The BCA calculates recreation benefits by unit of park elements that are new or improved to ensure that the benefits calculated are specific to ESCR park improvements only.
Health
Surveys used to determine consumer surplus values for recreation benefits may inherently include a health benefit component. Thus, consumer surplus values may be duplicative with benefits associated with recreation.
The BCA report describes health benefits of recreation space in a quantitative manner, but analysts did not incorporate results into the benefit-cost ratio to avoid any risk of double counting benefits.
Aesthetic
Two approaches exist to quantify aesthetic values for park improvements: 1) a consumer surplus value per square foot of improvement; 2) consumer surplus value captured by impacts to property values. Pier 42, Solar One Initiative, Seward Park/Essex Crossing, Site 5, and Pier 35 are all projects separate from the ESCR scope of work that plan to improve the quality of parks in the study area.
Analysts use the consumer surplus value per square foot of improvement for aesthetic benefits rather than valuing benefits through impacts to property values because it is not possible to determine which park improvement has a greater positive effect over another.
Property Value Benefits of Flood Risk Reduction
Direct physical damages and property value benefits of flood risk reduction both consider the value of property, though the former considers replacement value and the latter considers market value.
The BCA captures an increase in property value due to a perceived reduction in flood risk as this does not represent a double counting of benefits associated with direct physical damages. The results of direct physical damages represent physical losses avoided due to project implementation, while the benefits of an increase in property value represent the consumer’s perceived added value of the property on the market because the project reduces flood risk. In other words, both benefits are realized.

EAST SIDE COASTAL RESILIENCY BENEFIT COST ANALYSIS
arcadis.com Benefit-Cost Analysis 29
1.5 Sensitivity Analysis Because the BCA requires use of certain assumptions, it is important to understand how these assumptions impact the BCA results. A Sensitivity Analysis demonstrates the extent to which a change in the value of an uncertain variable will impact the present value10 of project benefits or costs and the BCR.
1.5.1 Uncertainty, Assumptions, Sensitivities
Analysts estimated low, medium, and high benefits based on uncertainties that resulted in either an alternative assumption in methodology or the use of a different methodology. The report expresses this range of benefits as a medium, upper limit, and lower limit BCR for environmental, social, and housing elements of the ESCR project. Table 8 summarizes the uncertainties related to these benefits, and the steps taken to address such sensitivities. Table 9 provides low, medium, and high estimated benefits, as well as the likely present value of total project benefits.
Table 8. Summary of Uncertain Variables
Project Benefits Description of Variable Approaches Solution
Environmental Benefits
A variety of sources provide an estimated dollar value of ecosystem goods and services. High, medium, and low estimated benefits are based on the estimated dollar value of ecosystem goods and services gathered from various sources.
Range of sources that value ecosystem services per trees:
• Low: USDA Tree Guide • Medium: Average of Low
and High • High: NYC Parks
Restitution Values Range of sources that value ecosystem services per square foot of grass or herbaceous plant:
• Low: FEMA11 • Medium: Average of Low
and High • High: Earth Economics
Avoided loss of property values
Research reveals that flood events reduce property values from 3 to 12 percent. It is difficult to estimate decreases in property value; thus, the analysis uses high, medium, and low percentages.
Low estimate: 3 percent
Medium estimate: 7 percent
High estimate: 12 percent
10 The Present Value is the discounted monetized value of expected annual benefits over the life of the project. 11 FEMA provides the low estimated value of ecosystem goods and services in exception of carbon sequestration, for which Earth economic provides the low estimate for carbon sequestration.

EAST SIDE COASTAL RESILIENCY BENEFIT COST ANALYSIS
arcadis.com Benefit-Cost Analysis 30
Project Benefits Description of Variable Approaches Solution
Recreation Benefits
Analysts can calculate recreational benefits using different methods, such as WTP values related to a specific recreation activity or a value per square foot of recreation space. Analysts used a variety of valuation methods to account for various methods to estimate recreation benefits.
Low estimate: FEMA value per square foot
Medium estimate: USACE Unit Day Values, Oregon State Consumer Surplus Values High estimate: USACE Unit Day Values, Oregon State Consumer Surplus Values
Direct Physical Damages
The analysis of direct physical damages factor in elevation data. The elevation of the lowest finished floor elevation is estimated using a Digital Elevation Model based on LiDAR data. To assign one elevation to a building, analysis looked at the lowest elevation point within a building footprint, and the average elevation within a building footprint.
Low estimate: Average elevation within a building footprint
Medium estimate: Average elevation within a building footprint
High estimate: Lowest elevation within a building footprint
1.5.2 Discount Rates
The BCA uses a discount rate to capture social “opportunity costs” (the maximum worth of an input among possible alternative uses) and provides one interpretation of the present value of expected annual benefits and costs. In other words, the discount rate attempts to measure the present value of future benefit, and always assumes that a future benefit is of lower value than a present benefit.
HUD guidance for CDBG-DR projects is to use a 7 percent discount rate as directed by OMB Circular A-94: Guidelines and Discount Rates for Benefit-Cost Analysis of Federal Programs.12 However, HUD also allows projects to use an alternate discount rate (no lower than 3%) with justification. Use of alternative discount rates is justified because the 7% discount rate has not been updated in nearly three decades, and since this project is using public not private investment. The Federal government last updated this discount rate in the OMB Circular A-94 in 1992. Sources of literature, such as the article Discount Rate published by the Association of State Floodplain Managers, emphasize the uncertainty surrounding discount rates. Because of this uncertainty, it can also be useful to analyze discount rates employed by other federal agencies. The Government Accountability Office (GAO) is a congressional agency that determines its own discount rate policy. The GAO uses the yield of United States Treasury debt with a maturity of the duration of the Project.13 Appendix C of OMB Circular A-94 (Revised in November of
12 Web page. Located at: https://www.hud.gov/sites/documents/16-06CPDN.PDF 13 Page 4. Located at: http://www.floods.org/PDF/WhitePaper/ASFPM_Discount_%20Rate_Whitepaper_0508.pdf

EAST SIDE COASTAL RESILIENCY BENEFIT COST ANALYSIS
arcadis.com Benefit-Cost Analysis 31
2018), states that the 30-year interest rate is 1.5 percent.14 Furthermore it states that, “Programs with durations longer than 30 years may use the 30-year interest rate in calculating the discount rate.”
OMB Circular A-94 states, analyses should “show the sensitivity of the discounted net present value and other outcomes to variations in the discount rate…. Sensitivity analysis should be considered for estimates of: (i) benefits and costs; (ii) the discount rate; (iii) the general inflation rate; and (iv) distributional assumptions. “
To analyze the impact of the value of the discount rate on the BCR, analysts compared the present value of project benefits and costs using different discount rates recommended by the Housing and Urban Development Agency in HUD Notice: CPD 16-06 (7 percent and 3 percent). Table 9 summarizes the range of present values of individual benefits using both discount rates. Table 10 presents the benefit cost ratios (BCR) for each estimate.
Table 9. Summary of Benefit Range and Present Value
Benefit with Uncertain Variables
Bound Annual Benefit Present Value
Discount Rate: 7%
Environmental Benefits
Low $33,652 $480,183 Medium $56,086 $800,303 High $77,362 $1,103,893
Recreation Benefits Low $145,868 $2,013,082 Medium $2,620,772 $36,168,614 High $7,869,037 $108,598,581
Economic Benefits of Reduced Flood Risk
Low $9,110,897 $57,567,817 Medium $21,258,761 $134,324,905 High $36,443,590 $230,271,266
Aesthetic Benefits Low $63,777 $880,174 Medium $77,364 $1,067,684 High $90,971 $1,298,091
Direct Physical Damages
Low $54,362,592 $750,244,344 Medium $54,362,592 $750,244,344 High $99,108,456 $1,367,770,655
Discount Rate: 3%
Environmental Benefits
Low $33,652 $1,063,354 Medium $56,086 $1,772,251 High $77,362 $1,990,497
Recreation Benefits Low $145,868 $3,753,140 Medium $2,620,772 $67,431,853 High $7,869,037 $202,468,460
14 Web page. Located at: https://www.whitehouse.gov/sites/whitehouse.gov/files/omb/circulars/A94/a094.pdf

EAST SIDE COASTAL RESILIENCY BENEFIT COST ANALYSIS
arcadis.com Benefit-Cost Analysis 32
Benefit with Uncertain Variables
Bound Annual Benefit Present Value
Economic Benefits of Reduced Flood Risk
Low $9,110,897 $65,033,081 Medium $21,258,761 $151,743,855 High $36,443,590 $260,132,322
Aesthetic Benefits Low $63,777 $1,640,974 Medium $77,364 $1,990,564 High $90,971 $2,340,668
Direct Physical Damages
Low $54,362,592 $1,398,736,670 Medium $54,362,592 $1,398,736,670 High $99,108,456 $2,550,037,180
Table 10. Summary of Benefit Range and Benefit Cost Ratio
Benefit Estimate BCR Discount Rate: 7% Low 1.40 Medium 1.47 High 2.17 Discount Rate: 3% Low 2.44 Medium 2.54 High 3.72

EAST SIDE COASTAL RESILIENCY BENEFIT COST ANALYSIS
arcadis.com Benefit-Cost Analysis 33
2 LOSSES AVOIDED Losses avoided is the largest category of benefits that analysts quantified for the ESCR project and are the result of the integrated flood protection system’s expected effectiveness against future flood impacts. The BCA estimates these losses as probabilistic outcomes of flood risk from coastal storm surge and residual risk of surface flooding from rainfall.
2.1 Hazard Scenarios
2.1.1 Coastal Storm Surge
BCA analysts focused on evaluating risk from four storm surge flood scenarios. The scenarios are based on the probability that a given flood elevation will be equaled or exceeded in any particular year. Each scenario represents stillwater flood elevations for the 10 percent, 2 percent, 1 percent, and 0.2 percent annual chance coastal flood events, based on FEMA’s Preliminary Flood Insurance Rate Maps15 (PFIRMs) plus estimated sea level rise (SLR).
The Mayor’s Office of Resiliency (MOR) uses the New York City Panel on Climate Change (NPCC) 90th percentile SLR estimate at year 2050, based on data collected at the Battery tide gauge located on the southern tip on Manhattan, as its offical SLR estimate for planning purposes. This estimate equates to 30 inches, or 2.5 feet (see Figure 6).
2.1.1.1 Interpreting Coastal Flood Scenarios
Grade elevations obtained from 1-foot resolution LiDAR data collected in 2017 were compared to expected stillwater flood elevations16 plus SLR to determine the extent and depth of flooding under each flood scenario. The model result must be refined to remove any area that the model has identified as flooded, but due to topography, is disconnected from the flood source, meaning that the grade elevations surrounding the disconnected flood area would prevent surge waters from reaching said area. All areas not expected to flood due to disconnection from the coastal flood source were removed from the analysis.
15 Released in 2018.
16 Stillwater elevations include the contribution from wave setup.
Figure 6. Sea Level Rise Curve Comparison

EAST SIDE COASTAL RESILIENCY BENEFIT COST ANALYSIS
arcadis.com Benefit-Cost Analysis 34
The ESCR project will protect the study area to the 1 percent annual chance event plus SLR, with residual protection at least into the .2 percent annual chance flood event. The elevations required to meet this level of protection vary throughout the study area based on topography and corresponding flood elevation.
2.1.1.2 Updated LiDAR and Grade Elevation QA/QC
The grade elevation is critical to the BCA analysis because it is used to obtain a flood depth. Flood depth helps determine a percent damage to buildings and contents, as well as displacement costs and business interruption time. The previous BCA was based on 2010 LiDAR data, but this updated BCA uses newer data from 2017. While grade elevations in the study area have likely not changed significantly in those seven years, the data collection and processing methodology did change. Most significantly for this analysis, the 2017 base bare earth digital elevation model (DEM) was created using triangulated surfaces (TINs) between ground-classified (class 2) LiDAR points. Manual and automated processing was used to clean up issues. This means that buildings were removed to represent bare earth elevations more seamlessly than in the 2010 version without creating artificial low elevation areas where building footprints obscured the actual elevation of the ground. This means that many buildings where shown to be located on higher ground that in the previous analysis. For most buildings this change is relatively minor (one to two feet), but in some cases, elevations increased five to seven feet. In addition, more flights were flown for the 2017 LiDAR and the survey used a smaller pulse spacing for greater accuracy. Based on our assessment of these changes, we believe the 2017 data to be more accurate.
2.1.2 Hurricane Sandy Scenario
HUD requires that the BCA provide an evaluation of Hurricane Sandy losses that would have been mitigated by the proposed project. Analysts performed this evaluation (presented in Section 2.8) by using a combination of recorded and modeled losses.
New York City’s low-lying areas are exposed to coastal flooding by hurricanes and tropical storms, such as Hurricane Sandy. Hurricane Sandy caused significant flooding in Lower Manhattan, which is home to a large population, critical infrastructure, and several cultural, natural, and economic resources. Because peak surge coincided with high tide, a record 14.1-foot elevation above the mean low low water (MLLW)17 was recorded at the Battery tide gauge.
The Hurricane Sandy event was simulated using Advanced CIRCulation model coupled with the Unstructured Simulating WAVes in the Nearshore to incorporate wave forces to determine flood depths throughout Lower Manhattan. The Hurricane Sandy storm scenario is used in this BCA to compare and validate modeled results against historical impacts.
2.2 Direct Physical Damages to Buildings and Contents
The ESCR flood protection system is expected to reduce the risk of direct physical damage through the implementation of a coastal flood protection system that will prevent overland flooding from storm surge
17 The average height of the lowest tide recorded at a tide station each day during a recording period.

EAST SIDE COASTAL RESILIENCY BENEFIT COST ANALYSIS
arcadis.com Benefit-Cost Analysis 35
along with drainage mangement elements to minimize interior flooding. Direct physical damages include the destruction and degradation of property and are quantifiable as monetary losses. For this BCA, property loss is categorized as structural damage (damage to the building) and contents damage (damage to personal property or inventory).
Flood impacts can be predicted by modeling expected damages from hypothetical storms. The following section provides a detailed discussion of how expected losses avoided were calculated for different modeled flood scenarios and provides an overview of the results of the direct physical damages analysis.
All direct physical damages have been calculated for the project area’s recorded building stock as of March 2019.
2.2.1 Depth Damage Functions
Analysts calculated direct physical damages associated with the modeled flood scenarios using standardized depth-damage functions (DDFs) specific to the characteristics and occupancy of a structure. A DDF correlates the depth, duration, and type of flooding to a percentage of expected damage to a structure and its contents, including inventory. The USACE produces DDFs that can be used to model direct physical damages. Following Hurricane Sandy, the USACE developed DDFs specific to the New York City Metro Area for coastal flooding in a report titled the North Atlantic Coast Comprehensive Study (NACCS). As this information contains the most current and best available data, analysts used these functions to evaluate direct physical damages. Figure 7 provides a sample depth damage relationship from the USACE NACCS.
Analysts evaluated direct physical damages for two flood hazard types: storm surge and stormwater. Only storm surge results are presented in this report, as the expected stormwater inundation area to be mitigated by the project overlaps with the coastal surge inundation area in all cases.
DDFs are specific to hazard conditions and the primary cause of damage: inundation, wave, or erosion. As such, it is appropriate to use DDFs specific to each flood hazard type and the cause of damage. Saltwater inundation DDFs obtained from the NACCS study were used by analysts to model damages as a result of storm surge.
Figure 7. Expected Structural and Contents Damage from Inundation, NACCS Urban High Rise Prototype. Damage at negative flood depths accounts for impacts to mechanical, electrical, and plumbing systems that may be located at or below grade.

EAST SIDE COASTAL RESILIENCY BENEFIT COST ANALYSIS
arcadis.com Benefit-Cost Analysis 36
2.2.2 Data Sources
BCA analysts utilized the following data sources to calculate expected structure, contents and inventory losses avoided:
• City of New York Primary Land Use Tax Lot Output (PLUTO) Data (March 2019): PLUTO data are developed by the City of New York Department of City Planning and contain tax lot characteristics, structure characteristics, and geographic/political/administrative districts reported at the tax lot level. PLUTO data have been merged with the Department of Finance’s digital tax map to create MapPLUTO for use with Geographic Information Systems (GIS).
• City of New York Department of Environmental Protection Digital Elevation Model (2017): The Digital Elevation Model (DEM) is derived from LiDAR collected in 2017 over New York City. A DEM models the ground surface and excludes ground features such as trees and buildings. The DEM was generated by interpolating the LiDAR ground points to create a 1-foot resolution seamless surface.
• Department of Information Technology and Telecommunications (DoITT) Building Footprints (April 2019): Building footprints represent the perimeter extent of buildings and provide the building height above grade and the number of stories. Data also contain the Building Identification Numbers (BINs), which is a unique number assigned to specific buildings, and the Borough-Block-Lot (BBL) number, which identifies the locations of properties.
• RS Means Building Construction Cost Data (2016): This publication provides location-specific building replacement square foot costs for 160 building occupancy types. Analysts applied those costs to each of the 27 Hazus occupancy classes and then calculated building replacement square foot costs for structures in the project area.18 As updated RS Means costs were not available, costs were escalated to 2019 costs using the Consumer Price Index from the U.S. Bureau of Labor Statistics.
• USACE West Shore Lake Pontchartrain Hurricane and Storm Damage Risk Reduction Study (2014): This study conducted by the USACE produced contents-to-structure ratio values (CSRVs) for residential and non-residential structures. CSRVs were used as a percentage of the total building replacement values to determine total contents replacement values for structures in the project area.
• USACE North Atlantic Coast Comprehensive Study (NACCS) Physical Depth Damage Function Summary Report (2015): Following Hurricane Sandy, the USACE collected empirical data to estimate the damages that would occur from future events. This report produced coastal damage functions for residential, non-residential, and public property. DDFs were obtained from this study to estimate direct physical damages related to modeled storm surge scenarios.
• Modeled 10-, 50-, 100-, and 500-year Inundation Depth Data with Sea Level Rise (2015): Flood elevations for the 10 percent, 2 percent, 1 percent, and 0.2 percent storm events are from FEMA’s Preliminary Flood Insurance Rate Maps (PFIRMs). Thirty inches of sea level rise has been included in the PFIRM flood elevations, which is the 90th percentile sea level rise projections from the New York City Panel on Climate Change.
18 Hazus occupancy classes are a building occupancy classification system developed by FEMA Hazus-MH Flood Technical Manual to categorize like buildings so that standard values can be applied to similar structure types.

EAST SIDE COASTAL RESILIENCY BENEFIT COST ANALYSIS
arcadis.com Benefit-Cost Analysis 37
2.2.3 Analysis Steps
2.2.3.1 Structure Inventory
Analysts captured and merged two structure data sets, PLUTO and DoITT, based on key identifying information and spatial location. The fields described in Table 11 are from the PLUTO and DoITT datasets and were used in the analysis.
Table 11. Applicable PLUTO and DoITT Attributes
Attribute Dataset Use in analysis Building Identification Number (BIN)
PLUTO and DoITT Key location identifier
Structure name (if applicable) PLUTO and DoITT Location identifier and key asset identifier
Address PLUTO and DoITT Location identifier Total Square Footage PLUTO Used in Square Footage Analysis Building Class PLUTO Building type Land Use PLUTO Secondary identifier of building type Number of Stories DoITT Used in Square Footage Analysis Roof Height DoITT Used in Square Footage Analysis Square footage of residential, commercial, etc. uses
PLUTO Used in Square Footage Analysis and economic analysis
Basement Type PLUTO Used in replacement value calculation
The DoITT dataset is based on the footprint of a building, while the PLUTO dataset is aggregated to the parcel. The DoITT dataset was used to identify structure location, the structure footprint, the number of stories, and the structure height. In some cases, building footprints in the DoITT dataset were broken into two or more unique structures to more accurately represent split-level buildings. Additionally, some footprints in the DoITT dataset were removed from the building inventory if the building no longer existed or if the footprint represented a small structure such as a toll booth or canopy.
The PLUTO dataset was used to obtain the square footage of residential and commercial space, building use type and land use, basement type, and other key information relevant to the analysis. Key building specific fields from the DoITT dataset were used, in conjunction with the PLUTO dataset, to further refine the tax lot data (data reported at the parcel level) to building specific fields. For example, the square foot of a building is reported in the PLUTO dataset, which means building square footage is aggregated to the parcel level; therefore, analysts used key information in the DoITT dataset to derive the building area for each structure from the total building area of the parcel.
2.2.3.1.1 Structure Square Footage and Residential Units
The PLUTO dataset separates the total square footage by use: residential, retail, office, storage, factory, garage, and other. However, PLUTO’s data sources are unique for each of these use types, causing some discrepancies between the reported total square footage and the sum of the reported residential

EAST SIDE COASTAL RESILIENCY BENEFIT COST ANALYSIS
arcadis.com Benefit-Cost Analysis 38
and commercial values. To respond to these discrepancies, analysts assumed that the actual total building square footage was equal to the maximum of the reported total building square footage and the sum of the square footage of the residential and all commercial subcategories. If there was any difference between the reported square footage and the sum of the parts, and if the residential area was reported as zero, but there were more than zero residential units on a parcel, the remaining square footage was assigned to the residential category. Any other remaining square footage was distributed over the parcel based on the ratio of the square footage for each use type on for each individual parcel.
After this redistribution, if there was still no residential square footage for a parcel but there was a more than zero residential units, the number of residential units was zeroed out.
Because the total square footage for structures was reported at the parcel level, obtaining the square footage per structure required additional calculation. For parcels with one structure, analysts assigned the total building square footage recorded in the PLUTO dataset to the structure. For parcels with multiple buildings, the structure height was multiplied by the structure footprint area to calculate the volume for each structure. To obtain the square footage for each building located on a parcel, analysts distributed the total square footage from the PLUTO data to each building based on a ratio of the building volume to the total volume of all buildings on that parcel. The method described above is applied to each use provided in the PLUTO dataset to obtain the area of use types for each structure.19 The number of residential units was also distributed to individual buildings using the same methodology as the square footage.
For structures that did not have a building area recorded in the PLUTO dataset (a total of 5 structures or less than 1 percent of the building inventory in the study area had this issue), analysts confirmed the presence of a structure, and then used the theoretical maximum square footage for the building, equivalent to the number of floors multiplied by the area of the building footprint. The average ratio of each use type square footage to the total building square footage for each PLUTO Building Class Code was then used to distribute the building square footage to the different use types. Analysts used Google Street View and footprints to confirm the estimated square footage accurately represented the size of the building.
Similarly, an average ratio of square footage per residential unit value was calculated for each PLUTO Building Class code and was used to distribute units to buildings with nonzero residential square footage that did not have a reported number of residential units.
2.2.3.1.2 Number of Floors per Structure and Square Footage by Floor
The number of stories and building height are recorded within the DoITT data set. When the number of stories was not available, analysts divided the building height by 10 feet and rounded to the nearest whole number to determine the approximate number of floors. In cases where this calculation results in 0, the number of stories was rounded to 1.
Similarly, when the building height was not available (for use in the volume calculation described in the square footage analysis section above), analysts multiplied the number of floors by 10 to approximate the
19 Analysts use the total occupancy type square footage for each structure to obtain an output per square foot value used in the Business Interruption Analysis. For more details regarding economic evaluation methods see the Business Interruption section.

EAST SIDE COASTAL RESILIENCY BENEFIT COST ANALYSIS
arcadis.com Benefit-Cost Analysis 39
building height. There were no instances where both the building height and the number of floors were missing from the structure attribute data.
To determine the square footage by floor, the total analysed square footage of the structure was divided by the total number of stories calculated. This value is significant to determine the square footage used in the BCA, explained in more detail later in this section.
2.2.3.1.3 Structure Grade Elevation
Structure grade elevation is an essential field used to estimate the approximate flood depth within structures. To determine the structure grade elevation, analysts extracted both the minimum and the average elevation within a structure footprint from the digital elevation model in GIS. The minimum elevation was used to determine the maximum damage values for the high estimate of benefits, and the average elevation was used for the damage values for the medium and low estimate of benefits.
2.2.3.2 Map Structure Type and Occupancy to Depth Damage Functions, Replacement Values, and Hazus Occupancy Types
Structures may be classified per both construction features (type) and use (occupancy). Such classifications are often used to determine further information about the structure. For example, building types and occupancies can be mapped to classifications used by RS Means to estimate replacement value for the structure. Each mapping to PLUTO Building Class Code required an independent evaluation, always starting with the building class code identified within the PLUTO data set. Analysts completed the following mappings based on PLUTO Building Class Codes:
• PLUTO Codes were mapped to USACE NACCS prototypes to assign appropriate DDFs using knowledge of a building height (high, medium, or low-rise) and the presence of a basement.
• PLUTO Codes were mapped to Hazus occupancy classes using a knowledge of the number of residential units in each building to estimate a replacement value for structures, as well as apply the appropriate business interruption time multipliers, one-time disruption costs, and for certain uses, the percent owner occupancy, and CSRV’s from the USACE Lake Pontchartrain Study.
• PLUTO Codes were mapped to IMPLAN economic industry groups so that direct economic impacts may be calculated and then used to model indirect and induced effects. See 2.3.3 Business Interruption for more details.
2.2.3.3 Determine the Analysis Square Footage
Damages to NACCS prototypes must be assessed based on the square footage within a certain number of stories NACCS identifies for each prototype’s damage function.20 The number of stories analyzed by the DDF is related to the structure type and the expected location and value of mechanical, electrical, and plumbing (MEP) in buildings. A significant portion of a building’s value is captured in such assets; damage costs to these assets can therfore be disproportionate to those of other assets. Urban high rise damage
20 U.S. Army Corps of Engineers. North Atlantic Coast Comprehensive Study (NAACS). http://www.nad.usace.army.mil/CompStudy

EAST SIDE COASTAL RESILIENCY BENEFIT COST ANALYSIS
arcadis.com Benefit-Cost Analysis 40
functions, for example, analyze damages as a percent of the square footage of the first ten floors given the NACCS assumption that MEP assets are located within the basement or first floor of the structure.
To calculate the structure square footage for the analysis, analysts multiplied the square footage per floor by the prototype number of stories identified in the USACE NACCS (refer to Table 12) or the total number of stories, whichever is less, for each structure. Certain PLUTO Building Class Codes represent structures that are of mixed uses. For structures identified as mixed use, an analysis square footage is developed for both residential and commercial square footage. The analysis square footage is used to calculate the building and contents replacement value relevant for the analysis, as described in the following steps.
Table 12. USACE NACCS, Number of Stories per Prototype/Depth Damage Function Analysis
Prototype No. Building Types Stories (for Analysis) 1A-1 Apartment 1-Story, No Basement 1 1A-3 Apartment 3-Story, No Basement 3 2 Commercial Engineered 2 3 Commercial Non-Engineered 1 4A Urban High Rise 10 4B Beach High Rise 10 5A Residential 1-Story, No Basement 1 5B Residential 2-Story, No Basement 2 6A Residential 1-Story, With Basement 1 6B Residential 2-Story, With Basement 2 7A Building on Open Pile Foundation 1 7B Building on Pile Foundation with Enclosures 1
Source: North Atlantic Coast Comprehensive Study: Resilient Adaptation to Increasing Risk. Physical Depth Damage Function Summary Report. January 2015.
2.2.3.4 Calculate the Building and Contents Replacement Value
Building replacement values (BRVs) and Contents Replacement Values (CRVs) are required to determine expected damage to buildings within the project area. These values are ultimately applied to the analysis square footage and the percent structural and contents damage related to the flood depth in the DDFs to determine expected damages. Analysts used RS Means 2016 Square Foot Costs to obtain replacement values.

EAST SIDE COASTAL RESILIENCY BENEFIT COST ANALYSIS
arcadis.com Benefit-Cost Analysis 41
2.2.3.4.1 Building Replacement Value (BRV)
The BCA Re-engineering Guide defines the BRV as, “the building replacement value for a specific component of the building, expressed in dollars”.21 Building replacement values per square foot were obtained from RSMeans square footage costs for building types that are based on Hazus occupancy classes.22 RSMeans is a construction cost estimating resource published each year often used by engineers to evaluate different construction cost possibilities. Labor and material costs are captured, and other information such as city cost indexes, productivity rates, crew composition, and contractors overhead and profit rates are also available. Analysts used the appropriate RSMeans city cost indices of 1.31 for residential uses and 1.35 for commercial uses to accommodate NYC-specific construction conditions. Table 13 below shows the BRV values determined from RSMeans that are applicable to this analysis with the city cost index increase for New York County. The building replacement value represents the cost to repair or rebuild damaged buildings in current dollars.
a. Mixed Use Building Occupancies
It is common for multiple story buildings to serve multiple uses in New York City. Analysts identified mixed use structures and the total amount and type of residential and commercial space within those buildings using PLUTO data. To obtain a BRV for mixed use buildings, the analysis square footage was categorized according to the amount and type of commercial space or residential space in a building. Analysts assigned commercial replacement values to the area of the bottom floors, using the assumption that the bottom floors are used as non-residential space. More specifically, analysts reasoned retail space is located on the bottom floors followed by other commercial uses, if applicable. RS Means provided replacement values for different types of commercial space. If there is remaining analysis square footage, the replacement cost was assigned based on the remaining uses within the building to represent values as accurately as possible. The BRV of the bottom floors and the BRV of the remaining analysis square footage is combined to obtain a total BRV for the analyzed square footage of the building.
b. Basement Replacement Value Adjustment
The basement replacement value is based on the RSMeans square footage cost for certain building types. Like the BRV, city cost indices are applied to basement replacement values. The total basement replacement value is a product of the replacement value per square foot and the area of the basement, which is obtained from the PLUTO dataset. The basement replacement value represents the added cost of a basement compared to a structure that does not have a basement. Analysts added the basement replacement value to the BRV to obtain a total BRV for each building.
21 Federal Emergency Management Agency. Benefit Cost Analysis Re-engineering Guide. Full Flood Data. 2009. Located at: http://www.fema.gov/media-library-data/20130726-1738-25045-2254/floodfulldata.pdf
22 Hazus occupancy classes represent a certain building type based on use, and the FEMA Hazus-MH Flood Technical Manual applies an average square footage to each occupancy class. This average square footage was used to choose the appropriate replacement value per square foot from the RSMeans cost data book.

EAST SIDE COASTAL RESILIENCY BENEFIT COST ANALYSIS
arcadis.com Benefit-Cost Analysis 42
2.2.3.4.2 Contents Replacement Value (CRV)
The USACE NACCS did not include content replacement ratios, therefore analysts used the next best available data. The contents replacement value is based on the contents-to-structure ratio values (CSRV) for residential and non-residential structures from data obtained through surveys in the West Shore Lake
Pontchartrain Hurricane and Storm Damage Risk Reduction Study.23 The CSRV’s used in the analysis are shown in Table 13. To calculate the total contents replacement value, analysts multiplied the total BRV by the appropriate CSRV, which is mapped to the Hazus occupancy class. Because the contents values are based on percentages, they increase coincident with an increase in the BRV and therefore do not need to be updated to NYC values for this analysis.
c. Mixed Use Building Occupancies
• The CSRV for a specific type of residential or commercial use was assigned to the appropriately categorized analysis square footage.
• Next, the CSVR was applied to the BRV to obtain the CRV for each use type.
• The CRV for all use types analyzed in the analysis square footage were added together to obtain the total CRV.
Table 13. Replacement Values
Hazus Occupancy Code BRV/SF CSRV CRV/SF Basement Value/SF
COM1 Retail Trade $163.22 1.19 $194.23 $37.56 COM2 Wholesale Trade $158.18 2.07 $327.44 $42.53 COM4 Business/Professional/Technical Services $235.52 0.54 $127.18 $57.64 COM5 Depository Institution $355.02 0.54 $191.71 $49.52 COM6 Hospital $506.06 0.54 $273.27 $52.12 COM7 Medical Office/Clinic $286.89 0.54 $154.92 $50.37 COM8 Entertainment and Recreation $299.09 1.70 $508.46 $51.77 COM9 Theaters $251.30 0.54 $135.70 $0.00 COM10 Parking $105.92 0.54 $57.20 $0.00 EDU1 Schools/Libraries $270.81 1.00 $270.81 $50.09 EDU2 Colleges/Universities $237.82 1.00 $237.82 $53.17 GOV1 General Services $201.55 0.55 $110.85 $45.48 GOV2 Emergency Response $336.35 1.50 $504.52 $45.33 IND1 Heavy Industrial $179.93 2.07 $372.45 $46.38 IND2 Light Industrial $158.18 2.07 $327.44 $42.53 REL1 Church/Membership Org $252.89 0.55 $139.09 $51.07 RES1 SF Dwelling $167.79 0.69 $115.78 $24.70
23 USACE. 2014. West Shore Lake Pontchartrain Hurricane and Storm Damage Risk Reduction Study – Final Integrated Feasibility Study Report and Environmental Impact Statement. November.

EAST SIDE COASTAL RESILIENCY BENEFIT COST ANALYSIS
arcadis.com Benefit-Cost Analysis 43
Hazus Occupancy Code BRV/SF CSRV CRV/SF Basement Value/SF
RES2 Mob Home $161.14 1.14 $183.70 $0.00 RES3A Multifamily 1-2 units $138.04 0.69 $95.25 $53.92 RES3B Multifamily 3-4 units $266.46 0.69 $183.85 $53.92 RES3C Multifamily 5-10 units $266.46 0.69 $183.85 $53.92 RES3D Multifamily 10-20 units $253.68 0.69 $175.04 $53.92 RES3E Multifamily 20-50 units $245.97 0.69 $169.72 $53.92 RES3F Multifamily 50+ units $237.58 0.69 $163.93 $53.92 RES4 Temporary Lodging $247.34 0.69 $170.66 $52.77 RES5 Institutional Dormitory $284.49 0.69 $196.30 $53.35 RES6 Nursing Home $289.40 0.69 $199.68 $48.59
2.2.3.5 Analysis Square Footage Exposure
Table 14 and Figure 8 summarize the number and types of buildings expected to benefit from the preferred project at the 1 percent annual chance coastal flood event plus sea level rise and the average replacement value of each building type. Replacement values are discussed in detail in 2.2.3.4 Calculate the Building and Contents Replacement Value. The total building and contents exposures for the analysis square footage provide a general understanding of the total value of building square footage (and its contents) at risk to flooding in the project area from the 1 percent annual chance flood event. The replacement values below represent an average replacement value of the square footage analysis based on the depth damage functions, not the average replacement value of a total structure.
Table 14. Summary of Building Inventory Replacement Value from the 1-Percent Annual Chance Flood Event
Building Use Category Number
of Buildings
Average Replacement
Value (Structure)
Average Replacement
Value (Contents)
Estimated Structure Exposure
Estimated Contents Exposure
Calculation A B C D = A x B E = A x C
Commercial & Office Buildings, > 1 & < 10 Stories
9 $1,342,567 $1,699,704 $12,083,101.33 $15,297,340.08
Commercial & Office Buildings, >= 10 Stories
1 $41,754,842 $22,796,085 $12,083,101 $15,297,340
Commercial & Office Buildings, 1 Story
8 $777,337 $713,403 $41,754,842 $22,796,085
Industrial & Manufacturing
6 $580,295 $1,055,847 $6,218,698 $5,707,225

EAST SIDE COASTAL RESILIENCY BENEFIT COST ANALYSIS
arcadis.com Benefit-Cost Analysis 44
Building Use Category Number
of Buildings
Average Replacement
Value (Structure)
Average Replacement
Value (Contents)
Estimated Structure Exposure
Estimated Contents Exposure
Calculation A B C D = A x B E = A x C
Buildings, > 1 & < 10 Stories
Industrial & Manufacturing Buildings, 1 Story
3 $354,436 $692,417 $3,481,770 $6,335,082
Mixed Residential & Commercial Buildings, > 1 & < 10 Stories
199 $829,882 $671,816 $1,063,308 $2,077,252
Mixed Residential & Commercial Buildings, >= 10 Stories
31 $33,707,796 $24,194,662 $165,146,614 $133,691,475
Mixed Residential & Commercial Buildings, 1 Story
8 $1,389,413 $974,521 $1,044,941,687 $750,034,517
Multi-Family Elevator Buildings, >= 10 Stories
26 $29,126,590 $20,050,744 $11,115,308 $7,796,170
Multi-Family Elevator Buildings, >= 3 & < 10 Stories
71 $7,063,364 $4,806,876 $757,291,332 $521,319,348
Multi-Family Elevator Buildings, 1-2 Stories
2 $979,395 $668,562 $501,498,849 $341,288,206
Multi-Family Walk-Up Buildings, >= 10 Stories
1 $17,605,987 $12,011,814 $1,958,790 $1,337,124
Multi-Family Walk-Up Buildings, > 2 < 10
299 $1,515,112 $1,014,091 $17,605,987 $12,011,814
One & Two Family Buildings, >1 & < 10 Stories
2 $253,302 $174,778 $453,018,516 $303,213,090
One & Two Family Buildings, Basement, >1 & < 10 Stories
8 $329,714 $203,410 $506,603 $349,556

EAST SIDE COASTAL RESILIENCY BENEFIT COST ANALYSIS
arcadis.com Benefit-Cost Analysis 45
Building Use Category Number
of Buildings
Average Replacement
Value (Structure)
Average Replacement
Value (Contents)
Estimated Structure Exposure
Estimated Contents Exposure
Calculation A B C D = A x B E = A x C
Open Space & Outdoor Recreation, 1 Story
1 $1,564,258 $2,659,239 $2,637,710 $1,627,280
Public Facilities & Institutions, > 1 & < 10 Stories
49 $4,194,256 $3,454,123 $1,564,258 $2,659,239
Public Facilities & Institutions, 1 Story
4 $1,130,745 $576,297 $205,518,560 $169,252,009
Total 728 $144,499,293 $98,418,389 $3,231,928,915 $2,299,097,999

EAST SIDE COASTAL RESILIENCY BENEFIT COST ANALYSIS
arcadis.com Benefit-Cost Analysis 46
Figure 8. Summary of Total Estimated Direct Physical Damages for the 1% annual chance flood event (Structural and Contents)
Mixed Residential & Commercial Buildings, > 1 &
< 10 Stories
Public Facilities & Institutions, > 1 & < 10
Stories
Multi-Family Walk-Up Buildings, > 2 < 10
31%
Multi-Family Elevator Buildings, >= 3 & < 10 Stories
One & Two Family Buildings, >1 & < 10 Stories
Industrial & Manufacturing Buildings, 1 Story
Multi-Family Elevator Buildings, 1-2 Stories
Open Space & Outdoor Recreation, 1 Story
One & Two Family Buildings, Basement, >1 & < 10Stories
Public Facilities & Institutions, 1 Story
Industrial & Manufacturing Buildings, > 1 & < 10Stories
Commercial & Office Buildings, 1 Story
Mixed Residential & Commercial Buildings, 1 Story
Commercial & Office Buildings, > 1 & < 10 Stories
Multi-Family Walk-Up Buildings, >= 10 Stories
Commercial & Office Buildings, >= 10 Stories
Mixed Residential & Commercial Buildings, > 1 & <10 Stories
Public Facilities & Institutions, > 1 & < 10 Stories
Multi-Family Walk-Up Buildings, > 2 < 10

EAST SIDE COASTAL RESILIENCY BENEFIT COST ANALYSIS
arcadis.com
Benefit-Cost Analysis 47
2.2.3.6 Determine Flood Depths Based on Modeled Flood Scenarios
Analysts subtracted grade elevations for each structure footprint in the study area from the modeled 10
percent, 2 percent, 1 percent, and 0.2 percent flood elevations, plus sea level rise, in order to determine
the expected flood depths in structures. The DDFs provided in the USACE NACCS account for expected
first floor elevation (FFE) by occupancy type and age, as well as the presence of mechanical, electrical,
and plumbing (MEP) located in the basement. Since these building attributes have been incorporated into
the DDFs, it is not necessary to account for FFE in the structure inventory. Nevertheless, many of the
structures in the study area have FFEs at grade, confirmed through Google Earth, or have basements
vulnerable to flooding at or below grade elevation. To determine the depth of flooding for structures in the
study area, analysts obtained the maximum modeled flood elevation within a building footprint for each
flood scenario. The minimum or average grade elevation within the building footprint was then subtracted
from the respective flood elevations to obtain a flood depth in each structure for each scenario.
2.2.3.7 Calculate Percent Damage and Physical Loss Values
As previously mentioned, DDFs are a relationship between the depth of floodwater in a structure and the
percent of damage that can be attributed to the flooding. Once the expected flood depths were defined for
each storm surge scenario, analysts applied the DDFs to estimate the percent of structural and contents
damage costs. The percent of structural and contents damage is related to 0.5- or 1-foot depth
increments and are multiplied by a structure or contents total replacement value to produce a physical
loss value in dollars. The results of this analysis are provided in Table 15.
2.2.4 Quality Control Evaluations To reduce uncertainties and increase the accuracy of the evaluation, analysts performed several quality
control actions as described in the following subsections.
2.2.4.1 QA/QC of Elevations
Grade elevation mapping was subjected to quality control review by GIS and BCA analysts. To perform a
quality review, analysts compared LiDAR data to surveyed ground elevations within the project area. In
addition, analysts reviewed the elevations at which the upper quartile of buildings that showed significant
damage at the 10 percent and 2 percent flood events were expected to flood. As needed, based on site-
specific evaluations conducted through the development of the structure inventory, analysts manually
adjusted elevations at which buildings were expected to flood. NACCS first floor elevation assumptions
were considered. A tertiary analysis was performed for key assets such as critical facilities to determine if
any resiliency actions had taken place to date.
2.2.4.2 QA/QC of PLUTO Building Class Code
PLUTO Building Class Codes were confirmed through a randomized review of Certificates of Occupancy
located in the NYC Department of Buildings Property Profile Database. In addition, analysts conducted
randomized street views in Google Earth to confirm PLUTO Building Class Codes and adjusted where

EAST SIDE COASTAL RESILIENCY BENEFIT COST ANALYSIS
arcadis.com
Benefit-Cost Analysis 48
appropriate. Any structures for which accurate building occupancies were unclear, or which were agency-
owned, were subject to a site-specific evaluation using GIS and Google Earth street view.
2.2.4.3 QA/QC of Direct Physical Damages
Structures that experienced a high percent loss and/or those with high replacement costs required site
specific analysis. Analysts reviewed expected flood depths, ground elevation, DDF, and replacement
value to ensure the accuracy of the data and the expected damages. At times, Google Earth was used to
confirm a building’s number of stories. This data point informs (along with the building use type) the DDF
that is used to determine the percent damage. Furthermore, additional structures were manually removed
from the analysis due to location outside of the protected area or that are known to have implemented or
plan to implement resiliency actions that could duplicate benefits with the preferred alternatives.
2.2.5 Assumptions
• The USACE NACCS DDFs account for underground vulnerabilities by applying a percent
damage for negative flood depths. The underground networks of the City could not be analyzed
due to security concerns, lack of available data, and budget / time constraints.
• For PLUTO Building Class Codes that contain a mixture of residential and commercial uses,
commercial occupancies are assumed to be located on the bottom two floors with residential
above.
• When estimating the number of stories for structures without story data, the average height of a
floor was assumed to be ten feet. The building height was divided by 10 to determine the total
number of stories.
• An average building square footage based on PLUTO Building Class Code was applied to
structures that did not have an area recorded in the PLUTO dataset (10 structures did not have
an area recorded in the dataset).
2.2.6 Results Table 15 summarizes damages that are expected to occur at each modeled flood scenario. Annualized
benefits are calculated using the formula provided in Section 1.3 and in the tables below. The design
level of protection for ESCR integrated flood protection system is the 1 percent annual chance event, plus
sea level rise. Based on professional engineer opinion, the ESCR flood protection system is
conservatively expected to prevent 75 percent of the losses associated with a 0.2 percent annual chance
event, plus sea level rise.

EAST SIDE COASTAL RESILIENCY BENEFIT COST ANALYSIS
arcadis.com
Benefit-Cost Analysis 49
Table 15. Results for Each Modeled Flood Scenario (Presented in the 000s), Low and Medium Scenario
Loss Category
Losses Avoided in 2019 Dollars by Annual Chance Coastal Flood Event, Including Sea Level Rise (Presented in 000s)
10% 2% 1% 0.2%* Annualized Benefits**
Present Value***
Calculation A B C D
E (See
footnote)
F=E*PV coefficient
Total Structure Damage Costs
$167,578 $462,282 $592,189 $823,411 $37,7756 $521,337
Total Structure Contents Costs
$71,603 $197,8767 $266,163 $403,759 $16,587 $228,907
Total Direct Physical Damages
$239,181 $660,159 $858,353 $1,227,170 $54,363 $750,244
*Based on engineering opinion, the ESCR project is expected to reduce .2 percent annual chance coastal flood scenario expected losses by no less than 75 percent. As such, 75 percent of the expected pre-mitigation losses have been incorporated as benefits into the analysis. ** E = Average (A, B)*(10%-2%) + Average (B,C)*(2%-1%)+Average (C,D)*(1%-0.2%)+D*0.2% ***Calculated using at 7 percent discount rate.
Table 16. Results for Each Modeled Flood Scenario (Presented in the 000s), High Scenario
Loss Category
Losses Avoided in 2019 Dollars by Annual Chance Coastal Flood Event, Including Sea Level Rise (Presented in 000s)
10% 2% 1% 0.2%* Annualized Benefits**
Present Value***
Calculation A B C D
E (See
footnote)
F=E*PV coefficient
Total Structure Damage Costs
$347,997 $774,225 $969,377 $1,142,136 $64,337 $887,902
Total Structure Contents Costs
$182,400 $414,550 $532,874 $670,767 34,771 $479,869
Total Property Loss $530,397 $1,188,776 $1,502,251 $1,812,903 $99,108 $1,367,771
*Based on engineering opinion, the ESCR project is expected to reduce .2 percent annual chance coastal flood scenario expected losses by no less than 75 percent. As such, 75 percent of the expected pre-mitigation losses have been incorporated as benefits into the analysis. ** E = Average (A, B)*(10%-2%) + Average (B,C)*(2%-1%)+Average (C,D)*(1%-0.2%)+D*0.2% ***Calculated using at 7 percent discount rate.
2.3 Displacement Occupants bear displacement costs during the time when a building becomes uninhabitable due to flood
damage. To determine displacement values, analysts consider three interrelated methodologies which
quantify the cost of residential and non-residential displacement: relocation costs, business interruption
costs, and shelter needs. Each of the methodologies are presented herein, including a description of how
potential double counting of benefits is avoided.

EAST SIDE COASTAL RESILIENCY BENEFIT COST ANALYSIS
arcadis.com
Benefit-Cost Analysis 50
2.3.1 Relocation and Business Interruption Relocation costs and business interruption are two consequences that result from disaster impacts.
Relocation costs are associated with moving a household or a business to a new location and resuming
business in that new location. Business interruption is associated with income lost as a result of an event
that interrupts the operations of the business, or the removal of a piece of real estate, both rental and sale
properties, from the market as a result of disaster impacts.
Relocation costs are derived from displacement time, while business interruption is based on restoration
time. Displacement time is derived from depth damage functions that relate a depth of flooding to an
amount of time a structure is not usable. Restoration time is “time for physical restoration of the damage
to the building, as well as time for clean-up, time required for inspections, permits and the approval
process, as well as delays due to contractor availability.”24 Restoration time is based on the occupancy
type, flood depth, and extent of damage.
Some businesses may relocate and resume business elsewhere; some businesses may be unable to
relocate while they are displaced. Therefore, impacted businesses or residents may incur both, one, or
neither of relocation costs and business interruption. For example, a business may have to restock its
damaged inventory before being able to relocate and start operations in a new space, thus incurring both
business interruption and relocation costs.
Care must be taken to ensure that these two costs are accounted for fully and that there is no double
counting between the two values, particularly in cases where both costs are incurred. Analysts took care
to appropritely account for each cost associated with displacement without duplication by applying a
Business Interruption Time Multiplier, categorized by business type, to restoration time. More detail on
potential benefit duplication is provided in the 2.3.1.4 Assumptions section below.
This analysis assumes that all interrupted businesses are eventually able to return to business as usual. This is a conservative assumption; FEMA’s Institute for Business and Home Safety states that “one-fourth of all businesses that close because of a disaster never reopen.”
2.3.1.1 Expected Impacts
The overall approach taken to identify appropriate relocation costs and business interruption is as follows:
1. Identify flood depths and damage expected to occur in 10 percent, 2 percent, 1 percent, and 0.2
percent annual chance flood events within the project area.
2. Calculate expected displacement and building restoration times based on flood depths and
building use.
3. Apply Business Interruption Time Multipliers to restoration time based on Hazus occupancy class
and extent of damage.
4. Use displacement and adjusted building restoration times (step 3) to calculate relocation costs
and business interruption without benefit duplication.
24 Hazus-MH Flood Technical Manual. Located at: http://www.fema.gov/media-library-data/20130726-1820-25045-8292/hzmh2_1_fl_tm.pdf

EAST SIDE COASTAL RESILIENCY BENEFIT COST ANALYSIS
arcadis.com
Benefit-Cost Analysis 51
2.3.1.2 Data Sources
• Hazus-MH 2.1 Flood Technical Manual and Earthquake Technical Manual: Methodologies
from Hazus-MH 2.1 were used to determine restoration time and the costs of relocation,
supplemented with local rental rates. Specifically, the Flood Technical Manual provided
restoration time and the Earthquake Technical Manual provided the Business Interruption Time
Multipliers based on damage category.25
• Hazus 2.1 One-time Disruption Cost Defaults: Hazus provides national one-time relocation
costs per square foot based on Hazus occupancy class. These costs are provided in 2006 dollars
and have been normalized to 2016 dollars based on inflation.
• US Census Bureau American Community Survey 5-Year Estimate (2013-2017): The percent
owner occupancy by census block for residential uses was obtained from the local 2013-2017
American Community Survey 5-year estimates. Hazus 2.1 default values were applied to
commercial structures as local figures were not readily available.
• Hazus 2.1 Percent Owner Occupancy Defaults: Hazus provides percent owner occupancy for
non-residential uses by Hazus occupancy class (local value not available).
• Hazus 2.1 Business Interruption Time Modifiers: Modifiers represent median values for
probability of business or service interruption for Hazus occupancy classes, based on damage
state and restoration time.
• Direct Physical Damages: Flood impacts were modeled for different flood scenarios to
determine which structures are expected to flood and the depth of flooding within the structure
(see Section 2.2 above).
• FEMA BCA Toolkit 5.1: Depth displacement tables were not provided with the USACE NACCS
DDFs used in the Direct Physical Damage evaluation, therefore analysts extracted displacement
tables from the Toolkit to determine displacement time for structures based on flood depth.
• Analysts researched local rental rates within the study area and applied these rates by
occupancy. Local residential rental rates were established from an online survey of different sizes
and types of residential spaces currently available for rent within the project area. Local
commercial rental rates were obtained in the same manner as residential rental rates. Loopnet
was used to obtain commercial rental values, and the April 2019 Elliman Report was used to
determine residential rates. Analysts also surveyed Zillow and Trulia to confirm residential rents
(See Appendix).
25 The Earthquake Technical Manual is applicable because of the hazard neutral approach to loss of function; additionally, Hazus methodologies related to flood hazard are often adapted from methods developed for the earthquake hazard. While the cause and extent of damage differ for these two hazard types, the consequences of such hazards (damage, displacement, loss of function) are generally the same. As such, the Flood Technical Manual will often refer to the Earthquake counterpart for greater detail, as was the case in obtaining information for detailed calculations necessary to determine business interruption.

EAST SIDE COASTAL RESILIENCY BENEFIT COST ANALYSIS
arcadis.com
Benefit-Cost Analysis 52
2.3.1.3 Analysis Steps
The following steps were taken to determine expected displacement impacts for different modeled flood
scenarios.
1. Identify Impacted Structures: The Direct Physical Damages analysis identified structures expected
to be impacted at the 10 percent, 2 percent, 1 percent, and 0.2 percent annual chance events.
2. Identify Impacted Square Footage: For relocation calculations, the total impacted square footage
was identified by using the total square footage of the first floor for structures that are expected to
experience less than ten feet of flooding. The total square footage of the first two floors is used for
structures experiencing more than 10 feet of flooding. For business interruption calculations, the
same rule applied for low-rise (under 4-story) buildings, but analysts assumed that in the event of
damage to taller buildings where there is a dependence on elevators to access higher floors, the
entire building square footage would be impacted.
3. Identify and Apply Percent Owner Occupied by Occupancy: For residential uses, Census Block
level data provided the percent owner occupied. All non-residential uses were assigned default
percent owner occupancy obtained from Hazus-MH 2.1.
4. Identify Rental Rates by Occupancy: Analysts categorized available rental units by commercial
and residential uses for the project area, and then an average rent price per square foot per year
was calculated for each use. The results of this analysis state that the average annual price per
square foot for commercial properties in 2019 is $75.74, and the average annual price per square
foot for residential properties in 2019 is $68.09. These values were then converted to an average
price per square foot per day (Price/SF/Day), for use in the Relocation Expenses calculation
outlined below.
5. Evaluate Displacement Time: The estimated flood depth within each structure is correlated to
USACE depth displacement tables to estimate displacement time for each modeled flood
scenario.
6. Process Relocation Costs: The Hazus Flood Technical Manual provides guidance to calculate
relocation costs to building occupants based on occupancy type:26
RELi = Σ if %DAM - BLi,j > 10%: Fai,j * [ (1 - %OOi) * (DCi) + %OOi * (DCi + RENTi * DTi,j)] Where:
RELi = Relocation costs for occupancy class i (in dollars)
Fai,j = Floor area of occupancy group i and depth j (in square feet)
%DAM - BLi,j
= Percent building damage for occupancy i and water depth j, (from
depth-damage function), if greater than 10%
26 It is important to note that this equation incorporates only owner-occupied structures when calculating displacement values. The reason for this is that a renter who has been displaced would likely cease to pay rent to the building owner of the damaged property, and instead would pay rent to a new landlord. As such, the renter could reasonably be expected to incur no new rental expenses. Conversely, if the damaged property is owner-occupied, then the owner will have to pay for new rental costs in addition to any existing costs while the building is being repaired. This model assumes that it is unlikely that an occupant will relocate if a building is slightly damaged (less than 10 percent structure damage).

EAST SIDE COASTAL RESILIENCY BENEFIT COST ANALYSIS
arcadis.com
Benefit-Cost Analysis 53
DCi = Disruption costs for occupancy i (in dollars)
DTi,j = Displacement time (in days) for occupancy i and water depth j (in
days)
%OOi = Percent owner occupied for occupancy l
RENTi = Rental cost for occupancy l (in $/ft2/day)
7. Evaluate Restoration Time: The estimated flood depth within each structure is compared to the
restoration time by occupancy provided by the Hazus 2.1 Flood Hazard Technical Manual to
determine the restoration time for each modeled flood scenario.
8. Assign Damage State: Analysts assigned FEMA damage states to each impacted structure based
on the percent damage to each structure for each modeled flood scenario (see Table 17).
Table 17. Damage State Correlations
Damage State None Slight Moderate Extensive Complete
Percent Damage Threshold 0% >0% >5% >25% >50%
9. Determine Business Interruption Time (Adjusted Restoration Time): The business interruption time
expected to be incurred by businesses that occupy damaged structures was determined by
applying the Business Interruption Time Multiplier to expected restoration periods. Business
Interruption Time Multipliers vary based on occupancy and damage state. Business interruption
costs have been calculated in accordance with the methodology described in Section 2.3.3
Business Interruption.
10. Complete the Analysis: The analysis described above was completed for damages expected at
four recurrence intervals: the 10 percent, 2 percent, 1 percent, and 0.2 percent annual chance
flood events, including sea level rise.
Using input output modeling in IMPLAN, analysts used the business interruption time to calculate the loss
of output in dollars for businesses in various industries. The approach to calculate output loss, in addition
to an economic impact analysis of such losses, is provided as a separate methodology in 2.3.3 Business Interruption.
It should be noted that relocation costs are only calculated for floors expected to be directly impacted. In reality, there are times when the entire structure will be displaced as a result of flood impacts. Thus, this approach produces conservative results.
2.3.1.4 Relocation Assumptions and Avoidance of Benefit Duplication
The following assumptions were made to prevent double counting benefits associated with relocation
costs and lost output due to business interruption:
• Some businesses will choose to relocate their operations while structure damage is being
repaired to minimize output loss. To do so, these businesses may rent additional space
elsewhere, thus choosing to incur relocation costs during building restoration as opposed to

EAST SIDE COASTAL RESILIENCY BENEFIT COST ANALYSIS
arcadis.com
Benefit-Cost Analysis 54
economic losses; this scenario assumes that business output will remain the same upon
relocation.
• Analysts assume, in concurrence with Hazus 2.1, that businesses that qualify as entertainment
(COM8), theatres (COM9), parking facilities (COM10), and heavy industry (IND1) will not relocate
after a disaster due to the type of activities that take place in such structures. As such, no
relocation costs are associated with these uses, though business interruption costs are
calculated.
• Depth displacement tables used in the analysis do not consider flooding below grade. Utilities and
other critical assets often lie below grade within the City of New York. When these areas flood,
occupants may be displaced, even if flood waters do not reach above the first floor. Such
displacement is not captured in the analysis.
• Only floors expected to be directly impacted by the flood scenario will be displaced. Nevertheless, one time disruption costs are determined at the building level because analysts assumed mechanical, electrical, and plumbing (MEP) assets are located at or below grade, and impacts to these systems affect the entire building.
2.3.1.5 Relocation Results
Only relocation cost results are presented in Table 18; business interruption costs are presented in 2.3.3
Business Interruption.
Table 18. Total Relocation Losses Avoided by Modeled Flood Scenario (Presented in the 000s), Low and Medium Scenario
Loss Category
Losses Avoided in 2019 Dollars by Annual Chance Coastal Flood Event, Including Sea Level Rise
10% 2% 1% 0.2%* Annualized Benefits**
Present Value***
Calculation A B C D E (See footnote) F=E*PV coefficient
Relocation Costs
$7,935 $31,245 $44,992 $79,016 $2,602 $35,916
*Based on engineering opinion, the ESCR project is expected to reduce .2 percent annual chance coastal flood scenario expected losses by no less than 75 percent. As such, 75 percent of the expected pre-mitigation losses have been incorporated as benefits into the analysis. **E = Average (A, B)*(10%-2%) + Average (B,C)*(2%-1%)+Average (C,D)*(1%-0.2%)+D*0.2% ***Calculated using 7 percent discount rate.
Table 19. Total Relocation Losses Avoided by Modeled Flood Scenario (Presented in the 000s), High Scenario
Loss Category
Losses Avoided in 2019 Dollars by Annual Chance Coastal Flood Event, Including Sea Level Rise
10% 2% 1% 0.2%* Annualized Benefits**
Present Value***
Calculation A B C D E (See footnote) F=E*PV coefficient
Relocation Costs
$25,970 $84,856 $112,375 $159,725 $6,827 $94,218
EAST SIDE COASTAL RESILIENCY BENEFIT COST ANALYSIS
arcadis.com
Benefit-Cost Analysis 55
*Based on engineering opinion, the ESCR project is expected to reduce .2 percent annual chance coastal flood scenario expected losses by no less than 75 percent. As such, 75 percent of the expected pre-mitigation losses have been incorporated as benefits into the analysis. **E = Average (A, B)*(10%-2%) + Average (B,C)*(2%-1%)+Average (C,D)*(1%-0.2%)+D*0.2% ***Calculated using 7 percent discount rate.
2.3.2 Shelter Needs Impacted residents may need to shelter if they cannot access their homes due to flooding. Even though
the home may not be damaged, people will be displaced if they are evacuated or cannot physically
access their property by foot, vehicle, or transit due to flooded roadways and transit systems. The ESCR
project will protect residential housing and transportation systems from the risk of flooding.
2.3.2.1 Expected Impacts
The principle resources used in this analysis include FEMA’s Hazus Flood Technical Manual27 cross-
checked with documented accounts of shelter needs during Hurricane Sandy. Sheltering needs are
based on a displaced population, determined using flood depths. To determine how many of the
displaced individuals will seek shelter, the number of displaced individuals is modified by factors
accounting for income and age. Low-income individuals, as well as young families and the elderly, are
more likely to seek shelter per FEMA.28 The population seeking shelter is reported with the overall benefit
cost analysis, but is not assigned a monetary value to avoid double counting benefits associated with
Relocation Costs.
2.3.2.2 Data Sources
• US Census Bureau American Community Survey (ACS) (2013-2017): Household income
estimates, population counts by age, and persons per household were obtained from the 2013-
2017 ACS 5-year estimates. Income and age data are used to weight the displaced population
to determine the number of individuals who will seek shelter.
• Direct Physical Damages: Flood depths for each structure from the Direct Physical Damages analysis are used to identify impacted buildings and impacted population.
• City of New York Primary Land Use Tax Lot Output Data (2019): The square footage
analysis derived from PLUTO data provides the total residential square footage within the study
area. This data is used along with US Census data to distribute the population among the
buildings.
2.3.2.3 Shelter Needs Analysis Steps
1. Population Analysis
27 HAZUS-MH Flood Technical Manual. FEMA. Located at: http://www.fema.gov/media-library-data/20130726-1820-25045-8292/hzmh2_1_fl_tm.pdf
28 HAZUS Flood Technical Manual. FEMA. Pg. 432 Located at: http://www.fema.gov/media-library-data/20130726-1820-25045-8292/hzmh2_1_fl_tm.pdf

EAST SIDE COASTAL RESILIENCY BENEFIT COST ANALYSIS
arcadis.com
Benefit-Cost Analysis 56
To analyze human impacts for each building, the total population in the study area must be distributed to
each building that has residential space. To do so, analysts distributed the population (from the 2013-
2017 ACS) in the project area to each building based on the amount of residential square footage for a
building compared to the total residential square footage in the Census Block that the structure is located
within.
2. Identify Impacted Buildings and Determine Displaced Individuals
Access to an area is assumed to be obstructed at a depth between 6 inches (the typical height of a curb)
and 12 inches.29 For this analysis, any residential unit with a flood depth that equals or exceeds 12 inches
is expected to cause displacement of residents and create a need for short-term sheltering, at minimum.
3. Displaced Population Likely to Seek Public Shelter
The number of displaced persons must be modified to account for the likelihood that an individual may
seek out other shelter options such as a hotel or staying with friends or family. Based on the methodology
presented in the Hazus-MH Flood Technical Manual, two factors that may impact these choices are
income and age (vehicle ownership and other potential factors, such as race or ethnicity, are not
considered).30 Individuals who seek shelter are most likely low-income and/or do not have family in the
area; age plays a secondary role, as some individuals may seek shelter even if they have the financial
means to do otherwise, such as the young and elderly.31
FEMA has developed a constant to adjust for income and age using weight and modification factors (see
equation below). Weight and modification factors are based primarily on income, because even though
young and elderly families may statistically prefer to use publicly provided shelters, these populations
tend to be lower income or on fixed incomes.32 Default weight and modification factors obtained from the
Hazus-MH Flood Technical Manual were used in this analysis, and are provided in Table 20 and Table
21. Per the Hazus methodology, block groups with 60% or more of households with income over $35,000
have slightly different constants that are used.
!"#$%&#% = ()*+,ℎ%/"0+#1"2* ∗ 0*4&%+5*2"6+/+1&+%"#/&1%"0/"0+#1"2*) + ()*+,ℎ%/"0&,*∗ 0*4&%+5*2"6+/+1&%+"#/"0&,*)
For example, the constant for Income Class IM1 (household income < $10,000) and Age Class AM1
(population < 16) is 0.33, meaning that 33% of the population meeting those criteria will seek shelter.
0.33 = (0.8 ∗ 0.4) + (0.2 ∗ 0.05)
29 Federal Emergency Management Agency. HAZUS Flood Technical Manual.[web page] Located at: http://www.fema.gov/media-library-data/20130726-1820-25045-8292/hzmh2_1_fl_tm.pdf
30 Federal Emergency Management Agency. HAZUS Flood Technical Manual. [web page] Located at: http://www.fema.gov/media-library-data/20130726-1820-25045-8292/hzmh2_1_fl_tm.pdf
31 Ibid.
32 Ibid.

EAST SIDE COASTAL RESILIENCY BENEFIT COST ANALYSIS
arcadis.com
Benefit-Cost Analysis 57
Table 22 provides a summary of constants, all of which come from the Hazus-MH Flood Technical
Manual and are used to estimate the total population who will seek shelter assistance.
Table 20. Weight Factors for Income and Age
Class Description Default IW Income Weighting Factor 0.8
AW Age Weighting Factor 0.2
Table 21. Relative Modification Factors
Class Description Default Default for Block Groups with 60% or More of Households with Income
> $35,000 Income
IM1 Household Income < $10,000 0.4 0.46
IM2 IM2 $10,000 < Household Income <
$15,000 0.30 0.36
IM3 $15,000 <Household Income < $25,000 0.15 0.12
IM4 $25,000 < Household Income < $35,000 0.10 0.05
IM5 $35,000 < Household Income 0.05 0.01
Age AM1 Population under 16 0.05 -
AM2 Population between 16 and 65 0.20 -
AM3 Population over 65 0.50 -
Table 22. Constant for Each Combination of Income and Age Class
Constant = (IW*IM)+(AW*AM) Class Default 60 % HH > 35K IM1-AM1 0.33 0.378
IM1-AM2 0.36 0.408
IM1-AM3 0.42 0.468
IM2-AM1 0.25 0.298
IM2-AM2 0.28 0.328
IM2-AM3 0.34 0.388
IM3-AM1 0.13 0.106
IM3-AM2 0.16 0.136
IM3-AM3 0.22 0.196
IM4-AM1 0.09 0.05

EAST SIDE COASTAL RESILIENCY BENEFIT COST ANALYSIS
arcadis.com
Benefit-Cost Analysis 58
Constant = (IW*IM)+(AW*AM) IM4-AM2 0.12 0.08
IM4-AM3 0.18 0.14
IM5-AM1 0.05 0.018
IM5-AM2 0.08 0.048
IM5-AM3 0.14 0.108
4. Determine Distribution of Population by Income and Age Class
Data obtained from the American Community Survey provided the percentage of the population in each income and age class as shown in Table 20 and Table 21.
5. Determine Sheltering Needs
Sheltering needs can be determined using the following equation provided in the Hazus-MH Flood
Technical Manual:
@*"A4*B$+#,$ℎ*4%*0$
=C C (D
EFG1"#$%&#%HE ∗ 6+$A4&1*6A"AB4&%+"#
I
HFG
∗ A*01*#%&,*"/A"AB4&%+"#+#J+#1"2*14&$$ ∗ A*01*#%&,*"/A"AB4&%+"#2&,*14&$$)
The constants listed in Table 22 for each combination of income and age classes are used to estimate
what percentage of the total displaced population would seek shelter based on income and age
characteristics of each census block group.
2.3.2.3.1 Shelter Needs Assumptions and Avoidance of Benefit Duplications
• Sensitivity analyses conducted by FEMA indicated that small modifications in weight and
modification factors had little effect on the estimated shelter needs. It was recommended that
these factors be used unless there are local statistical data available on populations that use
shelters.
• FEMA national default income and wage factors are applicable to the project area.
• The entire residential population of a structure is displaced when a structure is flooded.
• Shelter needs do not consider displacement associated with pre-event evacuation, only expected
direct flood impact.
• When considering displacement costs, the shelter needs approach is double counting when
compared to the relocation approach. The relocation approach assumes that all displaced
individuals will require alternative living quarters, thus capturing the costs of individuals that may
opt to go to a shelter. Moreover, the number of individuals which will require shelter after a flood
event should be considered conservative compared to historical accounts of shelter needs. To
account for this benefit duplication, costs associated with sheltering displaced populations are not
calculated nor incorporated into the benefit-cost ratio.

EAST SIDE COASTAL RESILIENCY BENEFIT COST ANALYSIS
arcadis.com
Benefit-Cost Analysis 59
2.3.2.3.2 Shelter Needs Results
The results presented in Table 23 represent the number of individuals that are expected to require
publicly-provided shelter for a flood event. As discussed in Shelter Needs Assumptions above, costs
associated with sheltering individuals are not reported nor included in the benefit-cost ratio because they
represent a duplication of Relocation Costs.
Table 23. Number of People Seeking Shelter by Modeled Flood Scenario, Low and Medium Scenario
Category
Number of People Seeking Shelter by Annual Chance Coastal Flood Event, Including Sea Level Rise
10% 2% 1% 0.2% Annualized Total**
Calculation A B C D E (See footnote)
Persons Seeking Shelter 794 2,085 2,524 4,205 174
*Based on engineering opinion, the ESCR project is expected to reduce .2 percent annual chance coastal flood scenario expected losses by no less than 75 percent. As such, 75 percent of the expected pre-mitigation losses have been incorporated as benefits into the analysis.. **E = Average (A, B)*(10%-2%) + Average (B,C)*(2%-1%)+Average (C,D)*(1%-0.2%)+D*0.2%
Table 24. Number of People Seeking Shelter by Modeled Flood Scenario, High Scenario
Category
Number of People Seeking Shelter by Annual Chance Coastal Flood Event, Including Sea Level Rise
10% 2% 1% 0.2% Annualized Total**
Calculation A B C D E (See footnote)
Persons Seeking Shelter 1,761 3,518 4,003 6,017 301
*Based on engineering opinion, the ESCR project is expected to reduce .2 percent annual chance coastal flood scenario expected losses by no less than 75 percent. As such, 75 percent of the expected pre-mitigation losses have been incorporated as benefits into the analysis.. **E = Average (A, B)*(10%-2%) + Average (B,C)*(2%-1%)+Average (C,D)*(1%-0.2%)+D*0.2%
2.3.3 Business Interruption This portion of the methodology models existing economic relationships within New York County and
expected impacts to those relationships in a post-disaster situation. Such economic impacts are based on
expected business interruption time resulting from flooding, calculated in Relocation and Business Interruption. This analysis calculates the direct loss of economic output by industry. Direct output losses
are then imported into input-output modeling software to estimate the effects of direct output loss on
relationships with other industries and spending patterns in the economy, generating indirect and induced
output losses.33 The integrated flood protection system proposed by the ESCR project is expected to
33 Indirect effects are defined by the IMPLAN group as the impact of local industries buying goods and services from other local industries. The cycle of spending works its way backward through the supply chain until all money leaks from the local economy, either through imports or payments to value added. The impacts are calculated by applying direct effects to the Type 1 Multipliers.

EAST SIDE COASTAL RESILIENCY BENEFIT COST ANALYSIS
arcadis.com
Benefit-Cost Analysis 60
prevent disruption from flooding to businesses and residences within the study area. Thus, the expected
conditions of existing economic relationships in a post-disaster situation may be considered an avoided
loss and the use of multipliers is appropriate. The results of indirect and induced economic loss are
analyzed within the context of New York County only and are presented as such. No broader effects
(such as all five City boroughs, metropolitan area, state, national, or international) are considered.
2.3.3.1 Approach
The approach to calculate expected business interruption due to flood impacts is threefold: building uses
(PLUTO codes) must be mapped to IMPLAN economic industries using a crosswalk similar to the process
used to map building uses to Hazus occupancy classes described in Direct Physical Damages. Once
building uses are mapped, direct economic impacts are calculated, and then used to model indirect and
induced effects. The approach to calculate and model economic impacts is described herein at a high
level and are broken down further in the Assumptions and Avoidance of Benefit Duplication section.
The purpose of mapping IMPLAN economic industries to PLUTO codes is to identify and assign an
appropriate economic industry to each building use within the ESCR study area. Through the crosswalk,
analysts are able evaluate direct economic output losses for various economic industries by identifying
structures that are impacted by floodwaters. Analysts began crosswalk development by matching
IMPLAN economic industries and PLUTO codes to economic groups, such as residential, office, and
retail. PLUTO data and IMPLAN data are then aggregated and at the group level to derive an average
output loss value per square foot for each economic industry. The crosswalk for business interruption is
provided in the Appendix.
The principle calculation used to determine direct output loss is sourced from the Hazus 2.1 Flood
Technical Manual (TM), Direct Economic Losses Chapter 14. The direct output loss approach uses the
results of the direct physical damages and relocation analyses, demonstrated in the equation below.
Minor revisions were made to the original calculation, as discussed in the Assumptions and Avoidance of
Benefit Duplication section of this methodology.
K+0*1%LB%AB%M"$$= NB$+#*$$O#%*00BA%+"#P+2* ∗ Q4""0R0*&"/O2A&1%*6S%0B1%B0*∗ R5*0&,*LB%AB%A*0K&TA*0SUB&0*Q""%/"0V1"#"2+1O#6B$%0T
The third step in this analysis is to import direct output loss results into software that models the indirect
and induced effects of direct impacts within the New York County economy. Analysts used IMPLAN input-
output modeling software for this portion of the analysis. The software uses a combination of social
accounting matrices and economic multipliers to estimate the result of changes or activities in the study
area. The 2017 IMPLAN New York County dataset—the latest available—was used for the model;
indirect and induced impacts are thus measured throughout New York County. Greater regional and
national consequences are not accounted for in the model.
Induced effects are defined by the IMPLAN group as the response by an economy to an initial change (direct effect) that occurs through re-spending of income received by a component of value added. IMPLAN’s default multiplier recognizes that labor income (employee compensation and proprietor income components of value added) is not a leakage to the regional economy. This money is recirculated through household spending patterns, causing further local economic activity.

EAST SIDE COASTAL RESILIENCY BENEFIT COST ANALYSIS
arcadis.com
Benefit-Cost Analysis 61
2.3.3.2 Assumptions and Avoidance of Benefit Duplication
Because there are many assumptions associated with the business interruption analysis, they are
organized into three categories: Crosswalk Development, Output Loss Calculations, and IMPLAN
Modeling. A discussion of how benefit duplication is avoided is also presented below.
1. Crosswalk Development
Due to information available in the PLUTO building data, the crosswalk rarely identifies a one-to-one
relationship between a PLUTO code and an IMPLAN economic industry. Instead, analysts must make
assumptions and aggregate economic industries and PLUTO codes into groups. Once such groups are
formed, analysts assign each group an average value per square foot for output losses.
As the smallest geographic area in which IMPLAN data is available is the zip code level, the zip code
study area is the basis of the crosswalk. Analysts assumed that average values for the zip code are
accurate for a sub-area within the zip code. IMPLAN economic data and PLUTO building data for the
applicable project area zip codes were used in the analysis.
To account for the mixed-use nature of New York City buildings, PLUTO data deconstructs square
footage for a single parcel into residential, retail, office, garage, storage, factory space, and other.
Analysts distributed the garage, storage, and other square footage for each parcel to one of the other
land use categories based on the building classification, and then mapped square footage of uses to
appropriate economic sectors based on assumptions for each building class. For instance, retail square
footage was mapped to retail sector for buildings classified as colleges and universities, education, office,
and residential, but was mapped to the sector associated with the building classification in all other cases,
such as clinics and death care services. Factory square footage, however, was always mapped to
industry, but office, storage or parking were mapped to an industry sector appropriate to the building
class, such as healthcare, government, manufacturing, etc. Residential area was mapped to residential
except in the case of hotels, which are their own industry sector.
2. Output Loss Calculations
Many IMPLAN industries are aggregated into groups for the crosswalk. Nevertheless, output losses must
be calculated for each IMPLAN industry, even if they have been aggregated into a group. In the output
loss calculations, IMPLAN industries within a group must be weighted based on output. The impacted
square footage for a PLUTO code is then distributed to economic industries in the family based on the
weighted value. This weighted value is necessary because it is inappropriate to assume that each
economic industry within a family is equally prevalent in the study area. For example, it is not fair to
assume that a 2,500 square foot computer technology store has the same output as a clothing store of
the same size, even though those industries are both in the retail family. By weighting industries based on
output, the expected damage to each industry is appropriately modified to reflect the approximate
presence of the industry in the local economy.
Other assumptions and limitations in output loss calculations include:
• Output loss calculations are based solely upon direct physical damages to buildings. Thus,
results shown do not provide a logical connection to significant disaster impacts to services such
as transportation or utilities. This is a limitation of the analysis and likely yields conservative
results.

EAST SIDE COASTAL RESILIENCY BENEFIT COST ANALYSIS
arcadis.com
Benefit-Cost Analysis 62
• For buildings less than four stories, only the area of the floors that are below the flood elevation
are used. If the expected flood depth within the structure is less than ten feet, the area of the first
floor is used to calculate output loss. In the case that expected flood depth is more than ten feet,
analysts assumed that some portion of the second story of the structure was inundated, and the
interrupted area of the first floor is doubled.
• For buildings more than four stories, the structure is assumed to have an elevator which would be
out of service with any level of flooding, and the floor area of the entire structure is used in the
analysis.
• Mixed use structures are assumed to have all non-residential space located on the lower floors.
• The original output loss calculation provided by the Earthquake Technical Manual incorporates a
recapture factor, which represents output losses that can be recouped to some extent by working
overtime after a flood event. These recapture factors have not been included in the output loss
calculation. The analysis assumes that, as soon as a business relocates or reopens after a
disaster, returns immediately to pre-storm output. Recapture factors are not appropriate for use
because they do not consider opportunity costs.
3. IMPLAN Modeling
IMPLAN input-output software is used in the analysis to identify indirect and induced economic losses
that result from business interruption, and therefore serves to model the economic relationships present
within the New York County economy. The below assumptions must be considered when observing the
IMPLAN results:
• The results display the economic impacts expected within New York County due to expected
output loss in the study area. These impacts are conservative, as the local economy for the study
area has economic linkages that impact areas far beyond New York County.
• IMPLAN does not account for price elasticities (i.e., responsiveness of demand to price changes)
that result from business interruption, nor does it account for changes in consumer/industry
behavior in response to effects such as changes in spending patterns within sectors that are
indirectly affected by business interruption.
• Analysts applied the local purchase percentage (LPP) provided by the IMPLAN social accounting
matrix (SAMs) to the output losses input into the software. The local purchase percentage
represents the typical allocation of expenditures for an industry in the defined region and is in
many cases less than 100 percent. The result is that the output losses for an industry are
discounted by its local purchase percentage, therefore modeling a more conservative estimate of
economic loss throughout the local economy.
• Seasonal variation in economic output of various sectors included in the analysis was not
considered due to data limitations.
• Results are presented in 2019 dollars.
4. Avoiding Benefit Duplication

EAST SIDE COASTAL RESILIENCY BENEFIT COST ANALYSIS
arcadis.com
Benefit-Cost Analysis 63
Business interruption time, and costs of that time, present a potential double counting issue given the
other methodologies used in this BCA. The approach to identify business interruption time has been
specifically modified to avoid a duplication of benefit with displacement time, as further explained in the
Relocation section. Business interruption costs also overlap with the benefits associated with loss of
service for certain critical assets, particularly transportation and utility assets. Benefits are duplicated for
transportation and utility assets because the loss of service methodology is based on the actual cost of
the service to individuals, which is incorporated into economic output values for the transportation and
utility industries. Despite this fact, neither loss of service nor business interruption to transportation or
utility assets are included in the analysis to avoid double counting benefits with other planned resiliency
measures. Service interruption for other facilities that provide a critical service, such as schools and police
stations, are not a benefit duplication because loss of service calculations for those assets consider
operating budgets, which are not incorporated into economic output values for those industries (Section
2.6).
2.3.3.3 Results
Table 25 presents business interruption results for each modeled flood scenario. Results include direct,
indirect, and induced effects,34 and employment, labor income, value added, and total output loss35 for
each effect type. Additionally, Figure 9 summarizes the top ten industries impacted by the 1 percent
annual chance event; results for other scenarios are provided in the Appendix. Real estate, wholesale
trade, owner-occupied dwellings, and hospitals are the top industries impacted by each modeled flood
scenario. The real estate industry is the buying and selling of property, and the owner-occupied dwellings
industry is simply the act of owning property. These results indicate many homes are impacted during the
modeled flood scenarios.
Table 25. Economic Losses Avoided for Each Modeled Flood Scenario
Flood Scenario Impact Type Employment
(Jobs) Labor Income
(in 000s) Value Added
(in 000s) Total Output (in
000s)
10% Annual Chance
Direct Effect 631 $39,430 $115,285 $146,848
Indirect Effect 105 $11,716 $21,850 $28,207
Induced Effect 6 $433 $715 $1,018
34 IMPLAN defines direct effects as production changes or expenditures as a result of an activity or policy (in this case, as a result of expected loss of function due to flooding). In this analysis, direct effects take place in the zip codes contained within the core ESCR study area. Indirect effects are defined as the impact of local industries buying goods and services from other local industries. Induced effects are the response by an economy to an initial change (direct effect) that occurs through re-spending of income received by a component of value added. In this analysis, indirect and induced effects are captured across all the zip codes in New York County outside of the core ESCR study area as spillover activity resulting from the direct effects.
35 Employment represents the number of jobs impacted by business interruption. Labor income is all forms of employment income, including employee compensation (wages and benefits) and proprietor income. Value added is the difference between an industry's or an establishment's total output (sales or receipts and other operating income, plus inventory change) and the cost of its intermediate inputs (goods and services purchased from other industries or imported). Value added consists of all labor income, taxes on production and imports less subsidies, and gross operating surplus. Total output represents the value of industry production and includes the values for both labor income and value added. In IMPLAN these are annual production estimates for the year of the data set and are in producer prices. For manufacturers, this would be sales plus/minus change in inventory. For service sectors production = sales. For Retail and wholesale trade, output = gross margin and not gross sales.

EAST SIDE COASTAL RESILIENCY BENEFIT COST ANALYSIS
arcadis.com
Benefit-Cost Analysis 64
Flood Scenario Impact Type Employment
(Jobs) Labor Income
(in 000s) Value Added
(in 000s) Total Output (in
000s) Total Effect 742 $51,579 $137,849 $176,073
2% Annual Chance
Direct Effect 2,231 $184,480 $464,771 $598,806
Indirect Effect 458 $53,945 $93,468 $122,081
Induced Effect 42 $3,363 $5,535 $7,793
Total Effect 2,730 $241,787 $563,775 $728,680
1% Annual Chance
Direct Effect 2,752 $213,174 $580,718 $744,300
Indirect Effect 557 $64,750 $113,897 $148,507
Induced Effect 36 $2,852 $4,699 $6,639
Total Effect 3,345 $280,776 $699,314 $899,446
0.2% Annual Chance
Direct Effect 3,898 $281,279 $791,356 $1,015,612
Indirect Effect 757 $87,143 $155,321 $202,018
Induced Effect 66 $5,358 $8,819 $12,412
Total Effect 4,721 $373,780 $955,496 $1,230,041 *Based on engineering opinion, the ESCR project is expected to reduce .2 percent annual chance coastal flood scenario expected losses by no less than 75 percent. As such, 75 percent of the expected pre-mitigation losses have been incorporated as benefits into the analysis..
Figure 9. Top Ten Industries Impacted at the 1 Percent Annual Chance Coastal Flood Event

EAST SIDE COASTAL RESILIENCY BENEFIT COST ANALYSIS
arcadis.com
Benefit-Cost Analysis 65
2.4 Human Impacts
2.4.1 Casualties Casualties, which include loss of life and injuries, are an unfortunate risk inherent to hazard events. One
significant benefit offered by the ESCR project is the reduction in risk of injuries and fatalities during future
coastal storm and intense rain events. The subsections below outline the data and methodology used to
analyze expected casualties avoided by the ESCR integrated flood protection system within the study
area.
In May of 2013, the CDC published an article titled “Deaths Associated with Hurricane Sandy.” Per the
report, one of the 117 deaths related to Hurricane Sandy was directly adjacent to the ESCR study area. In
addition to deaths, many injuries were sustained due to Hurricane Sandy’s storm surge. In October 2014,
the CDC published another report titled “Nonfatal Injuries 1 Week after Hurricane Sandy.” The report
suggests that 10.4 percent of residents in the inundation zone were injured within the first week after
Hurricane Sandy, mostly during attempts to evacuate or navigate or clean up debris.
2.4.1.1 Expected Impacts
The ESCR project is expected to reduce the number of casualties experienced in the project area during
future storm events. The detailed approaches for both injuries and fatalities are provided below.
2.4.1.2 Data Sources
• Direct Physical Damages: Analysts used flood depths for each structure from the Direct Physical
Damages analysis to identify impacted buildings, and therefore, impacted residents.
• U.S Department of Transportation values: The U.S. Department of Transportation issues
guidance on the treatment of the economic value of a statistical life.36
• Federal Aviation Administration (FAA) values: The Federal Aviation Administration (FAA)
categorizes injuries and fatalities as shown in Table 26. FEMA has acknowledged the validity of
these life safety values and permits their use in benefit cost analyses.
• CDC injury rates: The CDC report from October 2014 titled “Nonfatal Injuries 1 Week after
Hurricane Sandy” estimates 10.4 percent of residents in the inundation zone were injured within
the first week of Hurricane Sandy.
• BRNO University of Technology fatality risk methodology: The approach is based on three
main factors: materials loss, population preparedness, and warning.
36 U.S. Department of Transportation, Guidance on Treatment of the Economic Value of Statistical Life, 2016

EAST SIDE COASTAL RESILIENCY BENEFIT COST ANALYSIS
arcadis.com
Benefit-Cost Analysis 66
Table 26. FAA Category Levels and Values37
Injury Category Description of Injury
Fraction of WTP*
Value of Life
WTP Value
AIS 1 Superficial abrasion or laceration of skin; digit sprain; first-degree
burn; head trauma with headache or dizziness (no other
neurological signs).
0.3% $31,106
AIS 2 Major abrasion or laceration of skin; cerebral concussion
(unconscious less than 15 minutes); finger or toe crush/amputation;
closed pelvic fracture with or without dislocation.
4.7% $ 479,379
AIS 3 Major nerve laceration; multiple rib fracture (but without flail chest);
abdominal organ contusion; hand, foot, or arm crush/amputation. 10.5% $1,070,952
AIS 4 Spleen rupture; leg crush; chest-wall perforation; cerebral
concussion with other neurological signs (unconscious less than 24
hours).
26.6% $2,713,079
AIS 5 Spinal cord injury (with cord transection); extensive second- or
third- degree burns; cerebral concussion with severe neurological
signs (unconscious more than 24 hours).
59.3% $6,048,330
AIS 6 Injuries, which although not fatal within the first 30 days after an
accident, ultimately result in death. 100% $10,497,200
Source: Economic Values for Evaluation of FAA Investment and Regulatory Decisions, 2016. *Willingness to pay, which refers to the maximum price a customer will pay for a good or service (in this case, to decrease risk to their health)
2.4.1.3 Analysis Steps for Injuries
To quantify the value of injuries expected to be sustained in future impacts from coastal storms and
flooding from precipitation, analysts developed the below equation based on the CDC study post-Sandy
referenced above. To produce a more conservative analysis, it is assumed that all injuries sustained are
categorized as FAA AIS1 minor injuries ($31,106).
W&4B*"/O#XB0+*$ = O2A&1%*6@"AB4&%+"# ∗ 10.4% ∗ $31,106
1. Identify Impacted Population
The population that resides within the inundation area for each flood scenario is needed to estimate the
number of injuries expected for each scenario, respectively. The population within any building that
experiences any amount flooding is considered impacted for this analysis. As noted under the Shelter Needs section of this report, the total population in the study area must be distributed to each building
that has residential space to analyze human impacts for each building. To do this, the population in the
37 Revised Departmental Guidance: Treatment of the Value of Preventing Fatalities and Injuries in Preparing Economic Analyses. Located at: https://www.faa.gov/regulations_policies/policy_guidance/benefit_cost/media/Revised%20Value%20Of%20Life%20Guidance%20Feburary%202008.pdf

EAST SIDE COASTAL RESILIENCY BENEFIT COST ANALYSIS
arcadis.com
Benefit-Cost Analysis 67
study area is apportioned to each building based on the amount of residential square footage for a
building compared to the total residential square footage in the structure’s Census Block.
2. Estimate Injuries
Analysts applied the 10.4 percent injury rate to the total population expected to be impacted to estimate
the number of individuals that are expected to be injured in a post-disaster situation within one week of
the event.38 The daily worker or transient population is not included in this analysis.
3. Value Injuries
The benefits associated with avoiding these expected injuries are provided in the Results section below.
2.4.1.4 Analysis Steps for Fatalities
Most existing methodologies that estimate fatalities use two groups of characteristics: hydraulic
characteristics such as water depth, rate of water rising, stream velocities, wind, and temperature; and
area characteristics including factors such as population density, land use, warning systems, and
vulnerability of the population.39 Arcadis analysts considered material loss, population preparedness, rate
of water rise, and warning capabilities. This approach is the most appropriate since it accounts both for
event damage characteristics and the community’s capacity to prepare for and react to flood events,
which are related to vulnerability. This is especially important because it takes into consideration the
City’s recent initiatives to increase flood hazard awareness.
The approach chosen to estimate reduced fatalities within the project area is based on a study completed
by the Brno University of Technology in 2013.40 This approach is used to consider the number of
fatalities expected for the 10 percent, 2 percent, 1 percent, and 0.2 percent annual chance flood events,
including sea level rise. The equation (shown below) is based on three main factors: materials loss,
population preparedness, and warning.
MLM = 0.075 ∗ K_.D`a ∗ (@ + 2)bD.c_d ∗ (e + 2)bG._Gd
LOL: Loss of life
D: Material Loss (in dollars)
P: Population preparedness (based on aggregated population preparedness factors)
W: Warning (also factor-based)
1. Determine D, W, and P Factor
38 CDC report titled “Nonfatal Injuries 1 Week after Hurricane Sandy,” October 2014, page 1. http://www.cdc.gov/mmwr/preview/mmwrhtml/mm6342a4.htm
39 Jonkman, S.N. and J.K. Vrijling. 2002. Loss of life models for sea and river floods. Flood Defence. Wu et al. (eds) Science Press, New York Ltd.
40 Brazdova, M. and J. Riha. 2014. A simple model for the estimation of the number of fatalities due to floods in central Europe. Nat Hazards Earth Syst Sci. 14. June 12.

EAST SIDE COASTAL RESILIENCY BENEFIT COST ANALYSIS
arcadis.com
Benefit-Cost Analysis 68
D Factor. The D factor (material loss) consists of building damage and contents loss; both values were
determined through the approach to estimate Direct Physical Damages. For the purposes of this
analysis, only structure and contents damage for residential structures are evaluated for the appropriate
flood scenarios. Analysts assumed such losses reflect both the destructive ability of the event and the
number of endangered inhabitants. Damage to constructed assets, such as roads or utility systems, are
not considered in this analysis. The values used as D in the formula are listed in Table 27.
Table 27. Expected Material Loss (D) Values by Percent Annual Chance Coastal Flood Event (using Medium Estimate)
Percent Annual Chance Coastal Flood Event
Residential Damages (Building and Contents)
10% $239,181,341
2% $660,158,846
1% $858,352,530
0.2%* $1,227,169,638
Source: Direct Physical Damage Results, Section Detailed Results.
*Based on engineering opinion, the ESCR project is expected to reduce .2 percent annual chance coastal flood scenario expected losses by no less than 75 percent. As such, 75 percent of the expected pre-mitigation losses have been incorporated as benefits into the analysis.
P Factor. Factor P (population preparedness) expresses the preparedness of the community for flood
management and resiliency, and is intended to reflect the population’s awareness of flooding and
required preparations. This value is determined by rating eight sub-factors on a scale of -1 to 1. The
descriptions associated with each value are provided in Table 28.
The evaluation of the P sub-factors is based on existing conditions within the project area community.
The flood knowledge held by the general public in New York City greatly increased as a result of
Hurricanes Sandy and Irene. In addition, the area’s flood maps were updated and the City focused on
developing emergency flood procedures and providing accurate and reliable flood information to the
public.
Analysts evaluated the P sub-factors to determine the below ratings for P1 to P8. Because of the
frequency and amount of flood prevention and awareness activities present in New York City, analysts
assumed that the same P subfactors apply for all four flood scenarios. The final P Factor was determined
using the equation below, where P is the aggregated preparedness score presented in Table 23.41
@ = G`∗ ∑ @+`
gFG
41 Brazdova, M. and J. Riha. 2014. A simple model for the estimation of the number of fatalities due to floods in central Europe. Nat Hazards Earth Syst Sci. 14. June 12.

EAST SIDE COASTAL RESILIENCY BENEFIT COST ANALYSIS
arcadis.com
Benefit-Cost Analysis 69
Table 28. P Factor Descriptions
Pi Score
-1.0 -0.5 0.0 0.5 1.0
P1
No flood awareness or
knowledge about flood
hazard, sometimes
ignorance
Poor awareness,
underestimation
of flood hazard
Common flood
awareness
Fair knowledge
about flood
hazards obtained
mostly from the
media
Excellent knowledge
about flood hazards
via the media,
education, training,
etc.
P2
Area never flooded, no
experience with
flooding
Area flooded
decades ago,
poor records
concerning flood
losses
Area flooded
decades ago,
good records
concerning the
risks
Flooding still in
the memory of the
population
Personal experience
with flooding
P3
Flood extent maps or
flood management
plans not available
Existing flood
extent maps are
outdated
Flood extent
maps drawn up
based on current
hydrologic data,
but only poor
flood
management
plans exist
Flood extent maps
drawn up, flood
management and
evacuation plans
available
Flood extent maps
drawn up, updated
digital versions of flood
management and
evacuation plans
available
P4
Individuals have no
idea about actions to
take during floods
Limited (vague)
understanding of
what to do during
floods
General
understanding of
what to do
before and
during a flood
Quite good
knowledge of
flood
management
plans and
corresponding
activities
Perfect knowledge of
flood management
plans and understand
of what to do in the
event of flooding, good
preparedness
P5 No flood committee
established
Flood committee
established but
not trained, only
equipped with
flood fighting
facilities
Flood committee
established and
generally
trained, poorly
equipped with
flood-fighting
facilities
Only moderately
experienced but
trained committee
with standard
flood fighting
facilities
Experienced and well-
trained flood
committee equipped
with flood-fighting
facilities
P6
No response to
hydrological forecast,
no understanding or
belief
Poor understand
of hydrological
forecast and poor
response
Approximate
understanding of
forecast and
adequate
response
Fair
understanding of
hydrological
forecast and good
response
Very good
understanding of
hydrological forecast
and very good
response
P7
No response to
warning, no idea about
warning procedures
and response
Only poor
response to
warning, warning
system not
trusted
Adequate
response
Good response to
warning
Immediate and fast
response to warning

EAST SIDE COASTAL RESILIENCY BENEFIT COST ANALYSIS
arcadis.com
Benefit-Cost Analysis 70
Pi Score
-1.0 -0.5 0.0 0.5 1.0
P8
Rescue system does
not exist, no staff or
equipment available
Organized rescue
system does not
exist, volunteer
basis, no trained
staff available
with randomly
acquired
equipment
Poorly organized
but functioning
rescue system,
basic rescue
equipment of
adequate quality
Functioning
rescue system,
trained staff with
equipment of fair
quality
Efficiently functioning
rescue system, well-
trained, experienced
and well-equipped
personnel
Table 29. P Values
P Subfactor Factor Description Existing
Conditions Evaluation42
P1 Flood awareness and general knowledge of hazards 1.0
P2 Flood memory 1.0
P3 Existing flood documentation 1.0
P4 Understanding of activities and behavior during floods 0.0
P5 Initiatives and activities of flood committees 0.0
P6 Response to hydrological forecast 0.5
P7 Response to flood warning 0.0
P8 Evacuation and rescue activities 1.0
Aggregated Preparedness (Final P Factor for all flood scenarios): 2.13
W Factor. The W factor (warning) includes factors that warn the community that an event could take
place. The contributing factors include a hydrological forecast, the type of warning system employed, the
speed of flooding, and the rate of water level rise. Because these factors are somewhat based on the
frequency and extent of flooding, the W Factor is evaluated for each of the four flood scenarios. The
scoring system for the sub-factors is provided in Table 30.
Table 30. W Factor Descriptions
Wi Score
-1.0 -0.5 0.0 0.5 1.0
W1
No hydrologic forecast, forecast not possible (e.g. at
Only vague and general forecast
General forecast for medium size catchment
Hydrologic forecast provided in a standard way
Reliable hydrologic forecast based on contemporary technical and
42 The evaluation is applicable to all flood scenarios.

EAST SIDE COASTAL RESILIENCY BENEFIT COST ANALYSIS
arcadis.com
Benefit-Cost Analysis 71
Wi Score
-1.0 -0.5 0.0 0.5 1.0
small catchments)
by hydrologic services
modelling techniques
W2
Flood may arrive within several tens of minutes
Flood arrives faster than 45 min
Flood arrives within several hours
Flood arrives within 1 day
Flood arrives within several days
W3 Warning system does not exist
Poorly designed and functioning warning system
Only moderately reliable warning system
Fully functioning traditional warning system
Sophisticated warning system including digital online alarm systems
W4
Water rises at a rate of several meters per hour (floods in 1998, 2009)
Water level rise about 1 m per hour (small catchments in 2013)
Rate of several meters per day
About 1 m per day (floods in 1997, 2002)
Water level rise of several meters over several days
For factor W4, water rise rates were
determined based on the storm event
hydrograph in Figure 10. This
hydrograph shows 19 storms that are
modeled to determine the PFIRM events
at The Battery for the 1 percent and 0.2
percent storms.
Evaluations for W1 to W4 values are
provided for each flood scenario in
Table 31. The aggregated effect of
Factor W was evaluated using the
equation below, here W is the sub-factor
score.43
e =14 ∗Ce+
a
gFG
Table 31. W Values
W Subfactor
Subfactor Description 10% Flood Scenario
2% Flood Scenario
1% Flood Scenario
0.2% Flood Scenario
W1 Reliability of hydrological
forecast 0.5 0.5 0.5 0.5
43 Brazdova, M. and J. Riha. 2014. A simple model for the estimation of the number of fatalities due to floods in central Europe. Nat Hazards Earth Syst Sci. 14. June 12.
Figure 10. Storm Event Hydrograph at The Battery

EAST SIDE COASTAL RESILIENCY BENEFIT COST ANALYSIS
arcadis.com
Benefit-Cost Analysis 72
W2 Speed of flood arrival 1.0 1.0 1.0 0.5
W3 Warning system 1.0 1.0 1.0 0.5
W4 Rate of water level rise 0.0 0.0 0.0 -0.5
Aggregated Warning Factor Score (W Factor for each flood scenario) 1.38 1.38 1.38 0.25
2. Complete Calculation
Loss of life is obtained by plugging the factors (D, P, and W) into the equation below, repeated for ease of reference.
MLM = 0.075 ∗ K_.D`a ∗ (@ + 2)bD.c_d ∗ (e + 2)bG._Gd Where: LOL: Loss of life D: Material Loss (in dollars) P: Population preparedness W: Warning
For example, the calculation to determine the number of casualties in the 1 percent annual chance event scenario includes:
D Value = $736,232,316 P Value = 2.13 W Value = 1.38
0.79!&$B&4%+*$ = 0.075 ∗ $858,352,530_.D`a ∗ (2.13 + 2)bD.c_d ∗ (1.38 + 2)bG._Gd
3. Value Fatalities
The benefits associated with avoiding these fatalities can be calculated using Federal Aviation
Administration (FAA) Willingness to Pay (WTP) values for a fatality ($9.6 million). The result of the
estimated number of fatalities and the value of those fatalities for each annual chance event evaluated is
presented in the Results section.
2.4.1.5 Assumptions
The results of this analysis are considered conservative based on the following limitations and assumptions. Injuries Approach
• The results are calculated based on historical data from a CDC survey conducted 5 to 12 months
after Hurricane Sandy. The timing of the evaluation, coupled with the fact that the data is only
provided for one event, increases uncertainty. Nevertheless, the study was performed within the
study area, which means that conditions under which the survey was completed are largely
transferable. The survey is thus an appropriate source from which to transfer expected results.

EAST SIDE COASTAL RESILIENCY BENEFIT COST ANALYSIS
arcadis.com
Benefit-Cost Analysis 73
• Injuries reported are only for a one-week period following Hurricane Sandy. Injuries sustained
while repairing damages from Sandy more than one week following the event are not considered
in the analysis.
• All of the estimated injuries are considered to be minor. Moderate and serious injuries are not
included in this BCA.
• People with multiple injuries are quantified the same as people with only one injury.
• People in buildings that do not experience flooding and people injured from road damage and
closures are not considered in this BCA.
• Worker and transient populations are not considered in this analysis.
• Population growth is not considered in this analysis.
Fatalities Approach
• Road and non-structural asset damages were not incorporated into the analysis. Therefore, the
results presented do not include casualties related to road closures or damage, or any fatalities
that could occur due to driving a vehicle into flood waters (a common cause of death).
• Loss of life post-disaster can be affected by many factors not considered in this methodology,
including the financial and physical health of the population, mental stress and anxiety, and other
factors not considered.
• Fatalities may not be calculated on a per-structure basis due to the nature of P values, which
consider the flood preparedness characteristics of the whole study area population. This includes
individuals who do not reside within the inundation area. Furthermore, the formula used to
calculate loss of life can only be applied to a single level of geography, meaning that results at one
or more levels of geography (per structure) cannot be summed to represent a larger area (the
study area). The same rules apply when reviewing impacts within multiple study areas; results
cannot be summed. Instead, a new calculation must be performed with the largest study region to
avoid duplicating benefits.
• Population growth is not considered in this analysis.
• The BRNO University of Technology fatality risk methodology is based on a region with a
significantly lower population density when compared to the study area. Nevertheless, because
the BRNO study represents the best available data, analysts must assume that the results are
transferable to the study area. The author of the BRNO methodology reasons population density is
the most important factor to consider because of its effect on warning systems and evacuation;
risk is likely higher in more densely populated areas. It is thus safe to assume that results are
conservative for this analysis and could be updated if future studies examine flood casualty risk in
more densely populated areas.

EAST SIDE COASTAL RESILIENCY BENEFIT COST ANALYSIS
arcadis.com
Benefit-Cost Analysis 74
2.4.1.6 Results
To quantify the value of casualties expected to be sustained in future events, analysts applied standard
life safety values from the FAA: the FAA’s WTP value for one minor injury is $31,106, while the value of a
fatality is $10.5 million. FEMA and HUD have acknowledged the validity of these life safety values and
permits their use in benefit cost analyses. The results are summarized in Table 32.
Table 32. Value of Expected Injuries and Fatalities Avoided (Presented in the 000s)
Loss Category
Losses Avoided in 2019 Dollars by Annual Chance Coastal Flood Event, Including Sea Level Rise
10% 2% 1% 0.2%* Annualized Benefits**
Present Value***
Calculation A B C D E (See footnote) F=E*PV coefficient
Value of Injuries Avoided
$33,467 $59,859 $73,7250 $96,854 $5,276 $116,584
Value of Fatalities Avoided
$3,663 $5,410 $5,983 $9,282 $500 $11,035
*Based on engineering opinion, the ESCR project is expected to reduce .2 percent annual chance coastal flood scenario expected losses by no less than 75 percent. As such, 75 percent of the expected pre-mitigation losses have been incorporated as benefits into the analysis. **E = Average (A, B)*(10%-2%) + Average (B,C)*(2%-1%)+Average (C,D)*(1%-0.2%)+D*0.2% ***Calculated using at 7 percent discount rate.
2.4.2 Mental Stress and Anxiety Natural disasters threaten or cause loss of health, social, and economic resources, which leads to
psychological distress.44 Research indicates that individuals who experience significant stressors, such as
property damage or displacement, are more likely to experience symptoms of mental illness, Post-
Traumatic Stress Disorder (PTSD), and higher levels of stress and anxiety after a disaster.45
As mental health issues increase after a disaster, it is expected that mental health treatment costs will
also increase. Increased health costs burden individuals and society as whole. The ESCR project is
expected to reduce damage to homes, public transportation, and critical systems, and thus reduce risk of
mental stress and anxiety post-disaster.
2.4.2.1 Expected Impacts
Numerous studies have shown that there are mental health impacts after disasters, but only a few studies
have tried to place a monetary value on these impacts after disaster events. The American Red Cross
44 Hobfoll, S.E. 1989. Conservation of resources: A new attempt at conceptualizing stress. American Psychologist. 44:513–524. [PubMed: 2648906].
45 Rhodes, J., Chan, C.,Pacson, C., Rouse, C.E., Waters, M., and E. Fussell. 2010.. The Impact of Hurricane Katrina on the mental and physical health of low-income parents in New Orleans. Am J Orthopsychiatry. April; 80(2): 237-247.

EAST SIDE COASTAL RESILIENCY BENEFIT COST ANALYSIS
arcadis.com
Benefit-Cost Analysis 75
(ARC) estimates that 30 to 40 percent of an impacted population will need mental health assistance.46
Multiple studies corroborate the estimates made by the American Red Cross. Galea (2005) has found
that 1 to 11 percent of an impacted population will experience PTSD.47 Wang et al (2007) conducted a
survey of Hurricane Katrina survivors and found that 31 percent of respondents met the criteria for a
mood or anxiety disorder after the event.48 Further, research conducted by Schoenbaum et al (2009)
demonstrated that the prevalence of mental health issues after Hurricanes Katrina and Rita was 6 percent
for major mental health issues and 26 percent for mild to moderate mental health issues.49
Post-Hurricane Sandy research demonstrates that there was a measurable spike in mental stress
disorders after the event, including PTSD, anxiety, and depression.50 Notwithstanding the difference in
severity and damage related to Hurricanes Katrina and Sandy, respectively, FEMA has incorporated post-
disaster mental health impacts into its standard values for benefit-cost analysis and assumes that a
person will be mentally affected if they personally experience damage to their residence. Thus, it is
appropriate to estimate the costs of mental health treatment in post-disaster scenarios and consider them
as losses avoided that should be included in the benefit-cost ratio.
2.4.2.2 Data Sources
• Federal Emergency Management Agency’s (FEMA) Final Sustainability Benefits Methodology Report (2012)51: This report provides a method to calculate benefits related to
avoided mental stress and anxiety costs.
• Direct Physical Damages: Flood depths for each structure from the Direct Physical Damages
analysis are used to identify impacted buildings, and therefore, impacted population. Population
figures were obtained from the 2013-2017 American Community Survey 5-year Estimates and
were assigned to individual buildings based on the method described above under Analysis Step 1
for injuries.
46 Welker, Catherine. 2011. American Red Cross Liaison Officer to FEMA Headquarters Disaster Services. Personal correspondence, December 6.
47 Galea, Sandro; Nandi, Arijit Nandi; and David Vlahov. 2005. The Epidemiology of Post-Traumatic Stress Disorder after Disasters. Epidemiologic Reviews, (July) 27 (1): 78-91. Located online at: http://epirev.oxfordjournals.org/content/27/1/78.full.pdf+html.
48 Wang, Phillip; Gruber, Michael; Powers, Richard; Schoenbaum, Michael; Speier, Anthony; Wells, Kenneth; and Ronald Kessler. 2007. Mental Health Service Use among Hurricane Katrina Survivors in the Eight Months After the Disaster. Psychiatric Service. Vol. 58 Number 11. November.
49 Schoenbaum, Michael; Butler, Brittany; Kataoka, Sheryl; Norquist, Grayson; Springgate, Benjamin; Sullivan, Greer; Duan, Naihua; Kessler, Ronald; and Kenneth Wells. 2009. Promoting Mental Health Recovery After Hurricanes Katrina and Rita: What Can Be Done at What Cost. Archives of General Psychiatry, Vol. 66, #8, August.
50 Beth Israel Medical Center data indicate a 69% spike in psychiatric visits in November 2012. Healthcare Quality Strategies Inc. reviewed Medicare claims before and after Hurricane Sandy in select communities in New Jersey and found that PTSD was up 12.2%, anxiety disorders were up 7.8%, and depression or proxy disorders were up 2.8%.
51 Federal Emergency Management Agency. Final Sustainability Benefits Methodology Report. August 23, 2012.

EAST SIDE COASTAL RESILIENCY BENEFIT COST ANALYSIS
arcadis.com
Benefit-Cost Analysis 76
2.4.2.3 Analysis Steps
The principle resource used to conduct the analysis includes FEMA’s Final Sustainability Benefits
Methodology Report that accompanies the FEMA BCA Toolkit. Benefits of avoided mental health
treatment costs can be based on three factors: cost, prevalence, and course. Prevalence is the
percentage of people who experience mental health problems after a disaster event, and course is the
rate at which mental health symptoms reduce or increase over time. Cost is simply the cost of treatment
to those who seek it.
1. Determine Prevalence Rate and Course
FEMA’s Final Sustainability Benefits Methodology Report52 uses prevalence percentages and mental
health expenses from Schoenbaum (2009) to derive a standard value for mental stress and anxiety costs
that can be used in the FEMA BCA Toolkit. Prevalence percentages are adjusted over different time
periods. Mild to moderate impacts will reduce over time as treatment is provided, and severe mental
health problems may persist much longer, possibly never being fully resolved.53 For this reason, mild to
moderate mental health prevalence percentages reduce over time, while severe mental health prevalence
percentages remain consistent after a disaster. Findings from Kessler et al. (2008) support this trend,
reporting increasing rates of PTSD and severe mental health issues between six months after a hurricane
and approximately one year after.54 It is possible, if left untreated, that PTSD and severe mental illness
can become more entrenched over time, while mild or moderate mental illness symptoms attenuate.55
Table 33 provides a summary of prevalence considering course over four different time periods.56 It is
important to note that FEMA methodology only captures mental health impacts for the first 30 months
because prevalence rates after this time period are not available.
Table 33. Prevalence of Mental Health Issues After a Disaster
Time after Disaster Severe Mild/Moderate 7-12 months 6% 26%
13-18 months 7% 19%
19-24 months 7% 14%
25-30 months 6% 9% Source: FEMA Updated Social Sustainability Methodology Report
52 FEMA. 2012. Final Sustainability Benefits Methodology Report. August 23.
53 Schoenbaum, Michael; Butler, Brittany; Kataoka, Sheryl; Norquist, Grayson; Springgate, Benjamin; Sullivan, Greer; Duan, Naihua; Kessler, Ronald; and Kenneth Wells. 2009. Promoting Mental Health Recovery After Hurricanes Katrina and Rita: What Can Be Done at What Cost. Archives of General Psychiatry, Vol. 66, #8, August.
54 Kessler RC, Galea S, Gruber MJ, Sampson NA, Ursano RJ, and S. Wessely. 2008. Trends in mental illness and suicidality after Hurricane Katrina. Molecular Psychiatry. 13:374–384.
55 Rhodes, J., Chan, C.,Pacson, C., Rouse, C.E., Waters, M., and E. Fussell. 2010.. The Impact of Hurricane Katrina on the mental and physical health of low-income parents in New Orleans. Am J Orthopsychiatry. April; 80(2): 237-247.
56 FEMA. 2014. Updated Social Benefits Methodology Report. December 18.

EAST SIDE COASTAL RESILIENCY BENEFIT COST ANALYSIS
arcadis.com
Benefit-Cost Analysis 77
2. Determine Cost
Schoenbaum provides an estimate of treatment costs in an ideal scenario where all needs are met.
FEMA argues that treatment costs from the study must be adjusted to consider only those with mental
health problems who will seek out treatment (41 percent).57 According to Wang et al, of the 41 percent, 16
percent receive adequate care and 25.1 percent receive inadequate care. FEMA uses the following steps
to adjust total treatment costs from Schoenbaum for percentage of individuals who seek treatment and for
prevalence.
!"$%A*0A*0$"#$**J+#,%0*&%2*#%= iP0*&%2*#%1"$%A*0A*0$"#58 ∗ 0.16j + (P0*&%2*#%1"$%A*0A*0$"# ∗ 0.251)∗ A0*5&4*#1*
For example,
$666.0459 = ($6,232.79 ∗ 0.16) + ($6,232.79 ∗ 0.251) ∗ 0.26
This methodology is applied to each time period, adjusting for prevalence. The values provided by
FEMA’s Social Benefits Methodology Report have been normalized using the Consumer Pricing Index
(CPI) Inflation Calculator,60 and the costs for both severe and mild/moderate mental health problems over
each time period are added together to provide a total treatment cost of $2,891 per person over 30
months. Table 34 provides a summary of treatment costs in current dollars.
Table 34. Cost of Treatment61 After a Disaster (30 Month Duration) Per Person Expected to Seek Treatment
Time after Disaster
Severe Mild/Moderate Total per person
7-12 months $235 $738 $973
13-18 months $274 $483 $757
19-24 months $274 $398 $672
25-30 months $234 $256 $489
Total $2,891 Source: FEMA Updated Social Sustainability Methodology Report
57 Wang, Philip S., MD, DrPH; Lane, Michael, MS; Olfson, Mark, MD, MPH; Pincus, Harold A., MD; Wells, Kenneth B., MD, MPH; Kessler, Ronald C., PhD. 2005. Twelve-Month Use of Mental Health Services in the United States: Results from the National Comorbidity Survey Replication. Archives of General Psychiatry, v. 62, June.
A., MD; Wells, Kenneth B., MD, MPH; and Ronald C. Kessler, PhD. 2005. Twelve-Month Use of Mental Health Services in the United States: Results from the National Comorbidity Survey Replication. Archives of General Psychiatry, v. 62, June.
58 Schoenbaum, Michael; Butler, Brittany; Kataoka, Sheryl; Norquist, Grayson; Springgate, Benjamin; Sullivan, Greer; Duan, Naihua; Kessler, Ronald; Wells, Kenneth. 2009. Promoting Mental Health Recovery After Hurricanes Katrina and Rita: What Can Be Done at What Cost. Archives of General Psychiatry, Vol. 66, #8, August 2009.
59 Value not normalized to current dollars.
60 U.S. Bureau of Labor Statistics. Undated. CPI Inflation Calculator. [web page] Located at: http://www.bls.gov/data/inflation_calculator.htm.
61 Bureau of Labor Statistics. https://www.bls.gov/news.release/ecec.nr0.htm. Accessed 6/3/2019.

EAST SIDE COASTAL RESILIENCY BENEFIT COST ANALYSIS
arcadis.com
Benefit-Cost Analysis 78
3. Identify Impacted Population
The total number of residents in buildings that experience flooding during a 1 percent annual chance
event are considered impacted and are included in the total population that may seek treatment (See
Injuries analysis, Step 1 above). The cost of treatment per person over a 30-month period ($2,891) was
applied to this population to determine mental stress and anxiety costs.
2.4.2.4 Assumptions
• Research analysis is limited to 30 months after a disaster; therefore, estimated losses avoided are
limited to this time period. Mental health avoided losses beyond two and a half years after a
disaster, though expected, are not valued in this analysis.
• Benefits are calculated the entire impacted population. However, research indicates that only that
portion of the population with mental health issues can be expected to seek treatment. This would
significantly lower the calculated treatment costs and would not consider the full costs to society.
• Population growth is not considered in this analysis.
2.4.2.5 Results
The benefits calculated provide an economic value for the first 30 months only because there was
insufficient literature to estimate impacts beyond 30 months. For this reason, analysts added treatment
costs for the 1-percent annual chance event ($65,885,000) as a lump sum value to the present value of
project benefits, rather than determining annual benefits. This methodology is based on a FEMA-
approved methodology that takes the results for the flood scenario at which the study area will be
protected by the ESCR project and adds that value as a lump sum to the present value of project
benefits.62
2.4.3 Lost Productivity Work productivity can be lost due to mental illness as described in research on the impact of psychiatric
disorders on work loss days (Kessler and Frank, 1997). This report found that the average prevalence of
psychiatric work loss days63 is six days per month per 100 workers, and work cutback days64 is 31 days
per month per 100 workers.65 Further research conducted by Kessler et al (2008) found that respondents
with serious mental illness will experience a $16,306 reduction in a 12-month earning period compared to
respondents without mental illness, and a study of 19 countries by the World Health Organization showed
62 Federal Emergency Management Agency. Final Sustainability Benefits Methodology Report. August 23, 2012.
63 A psychiatric work loss day is the complete inability to work or perform normal activities due to mental illness or its treatment.
64 Work cutback days is the reduced work activity due to mental illness or its treatment.
65 1: Kessler RC, Frank RG. The impact of psychiatric disorders on work loss days. Psychol Med. 1997 Jul; 27(4):861-73. PubMed PMID: 9234464.

EAST SIDE COASTAL RESILIENCY BENEFIT COST ANALYSIS
arcadis.com
Benefit-Cost Analysis 79
a lifetime 32 percent reduction in earnings for respondents with mental illness.66 The historical impacts
indicate that mental health issues will increase after a disaster, and this, paired with research related to
lost productivity due to mental illness, indicates that economic productivity can be impacted by an
increase in mental health issues post-disaster.67
2.4.3.1 Expected Impacts
Implementation of the ESCR project will help reduce the number of stressors (such as damage to homes
and places of business) post-disaster, in turn reducing mental health impacts. Fewer mental health
impacts will reduce lost work productivity.
2.4.3.2 Data Sources
• Federal Emergency Management Agency’s (FEMA) Final Sustainability Benefits Methodology Report (2012):68 This report provides a method to calculate benefits related to
avoided lost productivity.
• US Census Bureau American Community Survey 5 Year Estimates (2013-2017): The average
number of workers per household and persons per household are used to determine the number
of impacted workers.
• Direct Physical Damages: Flood depths for each structure from the Direct Physical Damages
analysis are used to identify impacted buildings, and therefore, impacted population. Population
figures were obtained from the 2013-2017 American Community Survey 5-Year Estimates and
were assigned to individual buildings based on the method described in the Injuries Section, Step
1.
2.4.3.3 Analysis Steps
1. Determine Value of Work Productivity
Analysts researched several sources of literature related to lost productivity due to mental illness,
focusing on a study conducted under the auspices of the World Health Organization World Mental Health
(WMH) Survey Initiative. In this study, Levinson et al (2010)69 make broader estimates on the human
capital costs of mental disorders based on the results of WHO WMH survey data collected from 19
countries. The study found that individuals in the United States with mental health illnesses experience as
much as a 25.5 percent reduction in earnings. The national Employer Cost for Employer Compensation,
66 Levinson, et al. 2010. Associations of Serious Mental Illness with Earnings: Results from the WHO World Mental Health Surveys. British Journal of Psychiatry. August; 197(2): 114–121. http://www.ncbi.nlm.nih.gov/pmc/articles/PMC2913273
67 Insel, Thomas. Assessing the Economic Costs of Serious Mental Illness. American Journal of Psychiatry. 165:6 June 2008. / Kessler et al. Individual and Societal Effects of Mental Disorders on Earnings on the United States: Results from the National Comorbidity Survey Replication. American Journal of Psychiatry. 165:6. June 2008.
68 Federal Emergency Management Agency. Final Sustainability Benefits Methodology Report. August 23, 2012.
69 Levinson, et al. 2010. Associations of Serious Mental Illness with Earnings: Results from the WHO World Mental Health Surveys. British Journal of Psychiatry. August; 197(2): 114–121. http://www.ncbi.nlm.nih.gov/pmc/articles/PMC2913273

EAST SIDE COASTAL RESILIENCY BENEFIT COST ANALYSIS
arcadis.com
Benefit-Cost Analysis 80
as reported by the US Bureau of Labor Statistics, was $36.32 per hour in December 2018.70 This
multiplied by the average number of hours worked per day (6.9)71 produces a daily U.S. value of $250.60.
Thus, a 25.5 percent reduction in earnings would equal a loss of $63.91 daily, or $1,917.30 monthly.
2. Determine Prevalence Rates
The prevalence of mental health issues were presented in Table 33. The number of months of each time
period after the disaster (Column 1 of Table 35) is applied to the monthly productivity loss ($1,917.30) to
determine possible lost productivity for that time period. Prevalence factors from Schoenbaum (2009) are
used to adjust productivity loss, as only a portion of the population will experience mental health impacts
post-disaster. The prevalence factor is based on severe mental health issues because there is insufficient
literature to document the impacts of mild/moderate mental health issues on productivity.72
Table 35. 30-month Loss in Productivity Per Worker, Attributed to Severe Mental Health
Time after Disaster Potential Productivity Loss due to Severe
Mental Illness
Prevalence Factor in Impacted Population
Proportionate Productivity Loss Share per Worker in
Impacted Population 1-12 months (12 mo.) $23,008 6% $1,380
13-18 months (6 mo.) $11,504 7% $805
19-24 months (6 mo.) $11,504 7% $805
25-30 months (6 mo.) $11,504 6% $690
Total Productivity Loss per Worker
$3,681
For example,
($1,917.30A*02"#%ℎ ∗ 122"#%ℎ$) ∗ 6% = $1,380.46
3. Identify Impacted Population
The total population in residential buildings that experience flooding during a 1 percent annual chance
event are considered impacted for this analysis. See Injuries analysis, Step 1 above for details describing
how the population in the study area was distributed among buildings. The average number of persons
per household (2.61) along with population data was used to determine number of households in the
project area. The average number of workers per household in New York City (1.18 workers) is applied to
the number of households impacted during the 1 percent annual chance event to determine the number
of wage-earning residents who will experience flooding. The total lost productivity share per worker for 30
months ($3,681) is applied to the number of wage-earning residents who will experience flooding during a
1 percent annual chance event (the level of protection of the project) to value avoided productivity losses.
70 Employer Costs for Employee Compensation. March 2015. United States Department of Labor, Bureau of Labor Statistics.
71 Average week hours of overtime of all employees. Web page. Located at: http://www.bls.gov/news.release/empsit.t18.htm
72 FEMA. 2014. Updated Social Benefits Methodology Report. December 18.

EAST SIDE COASTAL RESILIENCY BENEFIT COST ANALYSIS
arcadis.com
Benefit-Cost Analysis 81
2.4.3.4 Assumptions
• Analysts assumed that the average number of workers per household and the average number of
persons per household for New York City is applicable to the study area.
• Lost wage is provided for the first 30 months only because there is insufficient literature available
to analyze longer periods of time.
• Prevalence rates are based on severe mental issues because there is insufficient literature related
the impacts of mild or moderate mental health problems on worker productivity. Thus, results are
considered conservative.
• Population growth is not considered in this analysis.
2.4.3.5 Results
The expected benefits provide an economic value for the first 30 months only because there was
insufficient literature to estimate impacts beyond 30 months. For this reason, analysts added treatment
costs for the 1-percent annual chance event ($65,885,00073) as a lump sum value to the present value of
project benefits, rather than determining annual benefits. This methodology is based on a FEMA-
approved methodology that takes the results for the flood scenario at which the study area will be
protected by the ESCR project and adds that value as a lump sum to the present value of project
benefits.74
2.5 Transportation Loss of Service New York City has a complex transportation system consisting of car, taxis, bus, and truck traffic on
roads, subways, commuter rail, bike share, and ferries. Inundation from flooding can cause service
disruptions to all of these modes, forcing New Yorkers and visitors to find alternate means of
transportation to and from work, costing valuable work and leisure time.
2.5.1 Expected Impacts Lost transportation service can be estimated as a function of the lost time to travelers due to disrupted
transportation networks. The basic economic concept is that personal time has value, regardless of
formal employment compensation. Therefore, it can be argued that one hour of work is equal to one hour
of leisure time because the opportunity cost of a leisure hour is equal to the wage that could be earned for
an hour of work. The value of an hour of time is represented in this analysis by the federal Department of
Transportation’s (DOT) 2016 Guidance on The Value of Time, which is $14.10 per hour nationally for all-
purpose local (as opposed to intercity) travel, or $0.24 per minute.75
73 Calculated using a 7 percent discount rate.
74 Federal Emergency Management Agency. Final Sustainability Benefits Methodology Report. August 23, 2012. 75 U.S. Department of Transportation, Revised Departmental Guidance on Valuation of Travel Time in Economic Analysis, 2016, https://www.transportation.gov/sites/dot.gov/files/docs/2016%20Revised%20Value%20of%20Travel%20Time%20Guidance.pdf

EAST SIDE COASTAL RESILIENCY BENEFIT COST ANALYSIS
arcadis.com
Benefit-Cost Analysis 82
Impacts to transportation in this analysis are based on lost use and delays as a result of inundation on
road traffic, including both car and bus traffic. Because the subway system is receiving independent flood
protection, subways are excluded from the analysis.
2.5.2 Data Sources
• New York State Department of Transportation (DOT) Annual Average Daily Traffic (AADT) Beginning 1977. Annual Average Daily Traffic (AADT) is an estimate of the average daily traffic
along a defined segment of roadway. This value is calculated from short term counts taken along
the same section which are then factored to produce the estimate of AADT. Because of this
process, the most recent AADT for any given roadway will usually be for the previous year. For
this analysis, the most recent AADT available for NYC is from 2015. Data is available for all New
York State Routes and roads that are part of the Federal Aid System.
• Metropolitan Transportation Authority (MTA) Ridership by Bus Route. Provides ridership by
bus route as well as overall annual ridership. For this analysis, analysts used daily weekday
ridership data averaged from 2013-2017 for each bus route and annual ridership data from 2018.
• EPA Dynamometer Drive Schedules. Vehicle chassis dynamometer driving schedules utilized at
the National Vehicle and Fuel Emissions Laboratory to determine vehicle fuel economy. The New
York City Cycle (NYCC) features low speed stop-and-go traffic conditions.
• MTA 2019 Adopted Budget and Financial Plan. Provides annual operating revenue by division
for the MTA, including fare revenue by mode.
• Transportation During and After Hurricane Sandy, Rudin Center for Transportation, NYU Wagner Graduate School of Public Service, November 2012. This was a valuable resource for
estimating the impacts of a flood event similar to Hurricane Sandy, particularly increased commute
time and change in mode-share following the storm.
• U.S. Department of Transportation TIGER Benefit-Cost Analysis (BCA) Resource Guide. Produced by the US Department of Transportation, this source provides standard economic
values to evaluate transportation benefits; this will be referred to as the TIGER value.
• FEMA’s Benefit Cost Analysis Re-engineering (BCAR) Guide. This report provides accepted
methodologies for calculating loss of service for a variety of public services, including roads and
bridges.
2.5.3 Analysis Steps
2.5.3.1 Car Traffic (Roads)
Analysts estimated loss of service for roads based on the area of roads expected to be inundated to any
depth during each recurrence interval, and the increase in travel time that would be expected on those
road segments following a storm surge flood event.
Analysts assumed that FDR Drive would be closed as a precautionary measure during a storm event
regardless of project implementation, and after depending on whether the road could be expected to flood

EAST SIDE COASTAL RESILIENCY BENEFIT COST ANALYSIS
arcadis.com
Benefit-Cost Analysis 83
pre- and post-project implementation. There is precedent for closing major roads and bridges during
extreme weather, as during Hurricane Irene, Sandy, and during the Blizzard of 2015. For this reason, the
AADT data associated with the FDR was analysed as a separate impact from other roads. Assuming the
FDR would be closed in the study area, an alternate route on local streets not impacted by flooding was
drawn in Google Maps (See Figure 11), which also provided an estimated travel time. The travel time for
the alternate route was increased by 56 percent to account for traffic congestion following a storm event,
based on the reported increase in commute time following Hurricane Sandy. This increased travel time
was multiplied by the TIGER value and the AADT on the FDR as show in the following formula:
∆% ∗ R ∗ W% Where:
∆% = change in travel time per vehicle
W%= Value of time (TIGER value)
R = AADT
Figure 11. FDR Route and Alternate Route
There are challenges to using this method for roads other than FDR Drive because it is not possible to
determine origin and destination information for trips using the AADT data, and the non-hierarchical grid
system of lower Manhattan streets and avenues typically allows multiple alternative routes for traffic. For
these reasons, analysts considered it more conservative to only assume increased travel time along the
flood-impacted sections of side streets.
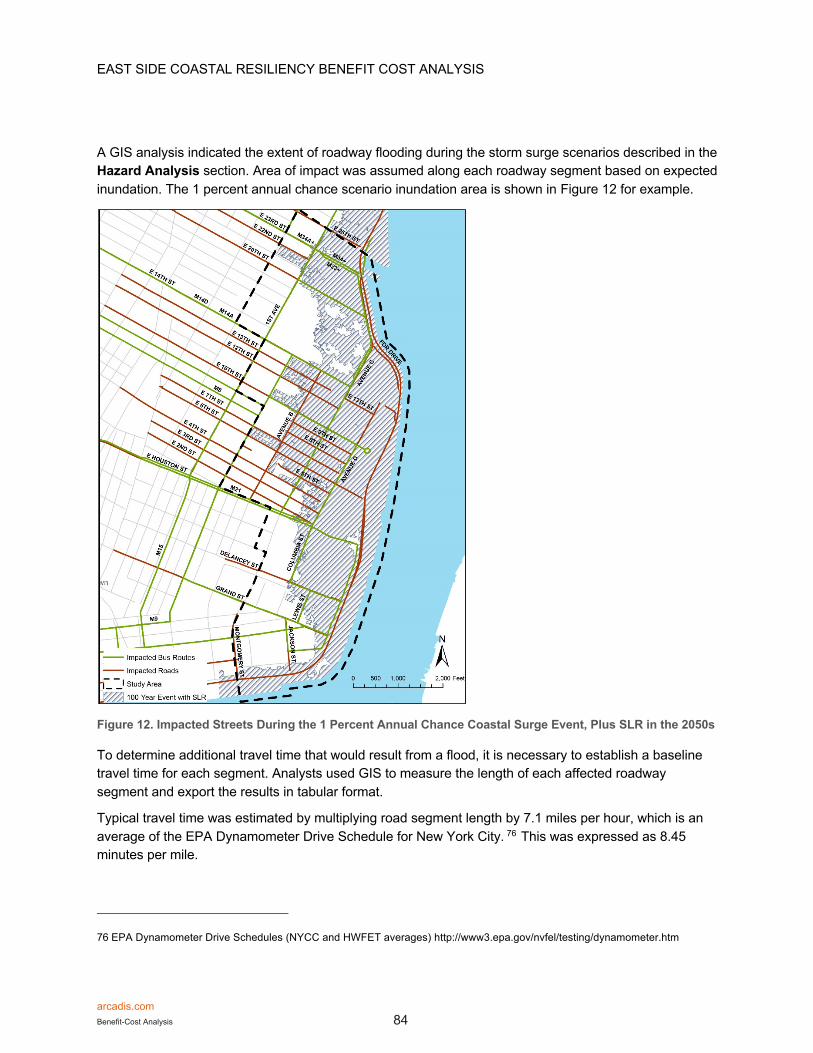
EAST SIDE COASTAL RESILIENCY BENEFIT COST ANALYSIS
arcadis.com
Benefit-Cost Analysis 84
A GIS analysis indicated the extent of roadway flooding during the storm surge scenarios described in the
Hazard Analysis section. Area of impact was assumed along each roadway segment based on expected
inundation. The 1 percent annual chance scenario inundation area is shown in Figure 12 for example.
Figure 12. Impacted Streets During the 1 Percent Annual Chance Coastal Surge Event, Plus SLR in the 2050s
To determine additional travel time that would result from a flood, it is necessary to establish a baseline
travel time for each segment. Analysts used GIS to measure the length of each affected roadway
segment and export the results in tabular format.
Typical travel time was estimated by multiplying road segment length by 7.1 miles per hour, which is an
average of the EPA Dynamometer Drive Schedule for New York City. 76 This was expressed as 8.45
minutes per mile.
76 EPA Dynamometer Drive Schedules (NYCC and HWFET averages) http://www3.epa.gov/nvfel/testing/dynamometer.htm

EAST SIDE COASTAL RESILIENCY BENEFIT COST ANALYSIS
arcadis.com
Benefit-Cost Analysis 85
The congestion factor was based on a post-Sandy survey performed by the NYU Wagner School of
Public Policy, which found that Manhattan residents’ commute time increased by approximately 56
percent in the days following the storm.77 The process can be expressed by the following formula:
(∆% ∗ W%%)R
Where:
Δt = Increase in travel time per vehicle in minutes
Vtt = Value of time (TIGER value) per minute
A = AADT (for road segment)
For example, the segment of East 23rd Street between Broadway and Avenue C is 0.26 miles in length
and has an AADT of 17,886 vehicles, and on a typical day it takes 2.19 minutes for a vehicle to traverse.
If the travel time is increased by 56 percent, the new travel time will be 3.42 minutes and Δt will be 1.23
minutes. This increase in travel time, expressed as Δt, is multiplied by the TIGER value of time per
minute, in this case a value of $0.24, which is represented in the formula as Vtt. The resulting amount,
which expresses the cost of increased travel time for each rider affected – in this case, $0.29 per vehicle
– can be multiplied by the total number of vehicles to estimate the total cost of the congested roadway,
which in this case is $5,161 per day. The daily cost for all roadways affected under each recurrence
interval are then doubled to account for an assumed 2 days of increased travel time immediately following
a storm surge event. The total results for impacts to roadway car traffic in dollars are summarized below
in Table 36 as impacts per recurrence interval, annualized benefits, and present values derived from the
annualized benefits over the project useful life using both 3 and 7 percent discount rates. The calculations
used to derive these values are provided in Table 38.
Table 36. Roadway Impacts Summary (Presented in the 000s)
Impacts to Roadway Traffic
10% Annual Chance Event
2% Annual Chance Event
1% Annual Chance Event
.2% Annual Chance Event78
FDR $818 $818 $818 $614
Other Streets $137 $158 $184 $144
Total $955 $977 $1,002 $757
77 Transportation During and After Hurricane Sandy, Rudin Center for Transportation, NYU Wagner Graduate School of Public Service, November 2012. http://wagner.nyu.edu/faculty/publications/transportation-during-and-after-hurricane-sandy
78 Based on engineering opinion, the ESCR project is expected to reduce .2 percent annual chance coastal flood scenario expected losses by no less than 75 percent. As such, 75 percent of the expected pre-mitigation losses have been incorporated as benefits into the analysis.

EAST SIDE COASTAL RESILIENCY BENEFIT COST ANALYSIS
arcadis.com
Benefit-Cost Analysis 86
Total Annualized Benefits $96 Present Value (7% Discount Rate) $1,321 Present Value (3% Discount Rate) $2,463
2.5.3.2 Expected Bus Service Loss
The expected loss of bus service is similar to the roadway approach in that it measures the increased
travel time due to increased traffic congestion. By contrast to the roadway approach, the entire length of
each bus route affected was taken into consideration in calculating increased travel time and associated
costs to capture the full impact of increased congestion to riders. For this reason, bus route lengths were
calculated independently of roadway segment lengths. Additionally, in some cases, affected bus lines
include several variations on roughly the same route or are broken into segments. In most such cases, for
each bus line, GIS analysts used the segment of the route shared between variations on a given route as
the baseline for determining route length. Additional lengths corresponding with route segments which
differ amongst variations were added to the baseline route length individually for each route variation
affected, per recurrence interval.
Lost revenue due to free fares on buses is also projected, as transit fares were suspended for five days
following Hurricane Sandy, although buses continued to provide service to the public.
A GIS analysis indicated the extent of bus route flooding as a result of the storm surge scenarios
described in the Hazard Analysis section. Bus routes affected were projected based on expected
inundation in each scenario. The increased travel time along the entire length of the bus route due to
congestion was multiplied by the ridership of each affected bus route and by the value of lost time.79 The
sum total daily costs for all riders on bus routes affected under each recurrence interval were then
doubled to account for an assumed 2 days of increased travel time immediately following a storm surge
event. The formula for the cost to bus passengers for a delayed bus route is as follows:
∆% ∗ W% ∗ R0 Where:
Δt = Change in travel time
Vt = Value of time (TIGER value)
Ar = Average daily ridership
To determine lost fare revenue, the 2019 operating revenue from fare collection on buses was divided
proportionally by route according to share of overall ridership. The analysis assumes 5 days of lost fare
revenue. The total impacts to bus ridership in dollars are summarized below in Table 37 as impacts per
recurrence interval, annualized benefits, and present values derived from the annualized benefits over the

EAST SIDE COASTAL RESILIENCY BENEFIT COST ANALYSIS
arcadis.com
Benefit-Cost Analysis 87
project useful life using both 3 and 7 percent discount rates. The calculations used to derive these values
are provided in Table 38.
Table 37. Impacts to Bus Service Summary (Presented in the 000s)
Impacts to Bus Service
10% Annual Chance Event
2% Annual Chance Event
1% Annual Chance Event
.2% Annual Chance Event80
Rider Time Loss Cost $904 $983 $2,038 $1,529
Revenue Loss $460 $460 $782 $586
Sum Total Loss $1,364 $1,443 $2,820 $2,112
Total Annualized Benefits $158 Present Value (7% Discount Rate) $2,174 Present Value (3% Discount Rate) $4,054
2.5.4 Assumptions
• In the case of an event, transportation service will begin immediately after the threat has passed
and any evacuation order has ceased.
• Roads will be entirely out of service during a storm surge event, so the loss of service reflects 2
days immediately following, based on the number of days of “emergency-level gridlock” that
followed Sandy.
• Traffic gridlock will persist for the same period+ of time for any road projected to be inundated in a
given storm surge flood scenario, as following Hurricane Sandy.
• Impacts similar to Hurricane Sandy are expected to occur, though only for areas expected to flood
in each flood scenario.
• Increased travel time for car traffic will only occur on the affected roadway segment, and not on
the entire roadway or adjacent roadways. As such, increased congestion in other, non-flooded
areas as a result of flooded transportation networks is not captured in this analysis.
• Increased travel time for buses will occur along the entire length of each bus route affected. The
entire ridership of a bus route will be impacted by the expected increased travel time associated with
the inundated bus route.
• Congestion would be consistent on all affected roads.
80 Based on engineering opinion, the ESCR project is expected to reduce .2 percent annual chance coastal flood scenario expected losses by no less than 75 percent. As such, 75 percent of the expected pre-mitigation losses have been incorporated as benefits into the analysis.

EAST SIDE COASTAL RESILIENCY BENEFIT COST ANALYSIS
arcadis.com
Benefit-Cost Analysis 88
• Alternate routes will be protected from flooding.
• Roadways and bus routes subject to a 0.2% annual chance flood event will only be protected to a
level of 75%.
2.5.5 Results Table 38. Summary Transportation Loss of Service Results, Excluding Benefits Removed Due to Potential Double Counting (Presented in the 000s)
Loss Category
Losses Avoided in 2019 Dollars by Annual Chance Coastal Flood Event, Including Sea Level Rise
10% 2% 1% 0.2%* Annualized Benefits**
Present Value***
Calculation A B C D E (see footnote) F=E*PV coefficient
Cars $ 955 $977 $1,002 $757 $96 $1,321
Bus $1,364 $1,443 $2,820 $2,115 $158 $2,174
Total $2,319 $2,419 $3,822 $2,872 $253 $3,496 *Based on engineering opinion, the ESCR project is expected to reduce .2 percent annual chance coastal flood scenario expected losses by no less than 75 percent. As such, 75 percent of the expected pre-mitigation losses have been incorporated as benefits into the analysis. ** E = Average (A, B)*(10%-2%) + Average (B,C)*(2%-1%)+Average (C,D)*(1%-0.2%)+D*0.2% ***Calculated using at 7 percent discount rate.

EAST SIDE COASTAL RESILIENCY BENEFIT COST ANALYSIS
arcadis.com
Benefit-Cost Analysis 89
2.6 Public and Essential Facility Loss of Service FEMA defines a critical, or essential, facility as a one for which “even a slight change of flooding is too
great a threat.” Typical critical facilities include hospitals, fire stations, EMS stations, police stations, public
utilities, storage of critical records, and similar facilities.”81 It is necessary to separate the analysis of
critical facilities from the analysis of general residential and commercial buildings because, in addition to
being structures vulnerable to flooding, critical facilities provide public services that can be essential in an
emergency. The value of the service provided by critical facilities can be quantified and included as a
benefit in addition to any expected physical property damages. FEMA’s Benefit Cost Analysis Re-
engineering (BCAR) Guide quantifies standard service values for many typical critical facilities and
provides methods to calculate benefits. Standard values and methods are explained and used in each
section below.
2.6.1 Expected Impacts The first step in analyzing critical facilities was to determine the number and type of such facilities located
within the project area. Critical facilities82 were located and divided into the following categories:
• Police Stations
• EMS Stations
• Fire Stations
• Hospitals and Emergency Medical Care Facilities
• Schools
• Libraries
• Parks
• Hospitals
• Utility Assets (power, water, wastewater)
Facilities expected to be impacted by the 10 percent, 2 percent, 1 percent, and 0.2 percent modeled flood
scenarios were determined using GIS. Schools, parks and libraries are the only public and essential
facilities assessed within this methodology, because none of the EMS stations or fire stations located in
the project area would be impacted by any one of the modeled flood scenarios. Utility, police, and
university assets that are expected to be impacted within the study area are receiving separate flood
protection and have been removed to avoid double counting benefits for those projects. More detail on
such assets is provided in 1.4 Mitigating Duplication of Benefits or Potential Double Counting.
82 Cultural assets such as museums and other tourism attractions are not yet considered in this analysis.

EAST SIDE COASTAL RESILIENCY BENEFIT COST ANALYSIS
arcadis.com
Benefit-Cost Analysis 90
Facility-specific information was gathered for each of the critical facilities that will be impacted. Information
gathered included location, service population, operating budget, and additional facility-specific
information. An essential facility log was developed to document information gathered on all facilities
including their locations. Finally, an analysis was completed for the impacted facilities. This analysis is
outlined below.
2.6.1.1 Schools
Following Hurricane Sandy, all 1,750 New York City public
schools were closed for a week, and many remained
closed, or were relocated the following week.83 Per a
Liberty Street Economics report, there were 86 schools
that were closed due to direct flood damage, and the
disruption to students’ education was significant. By
November 16, 2012, three weeks after the event, students
at all 86 of these facilities had returned to class, though 24
schools were still operating out of relocated facilities.
There are approximately 32 schools located in the ESCR
study area. Data needed to calculate the loss of service from a school shutdown includes the service
interruption time (or closure time) and the annual operating budget, or if unavailable, the student
population of the school. A daily operating budget can be derived from the annual budget, and this value
is used to determine the monetary value of lost school service for any number of days.
An Annual Financial report published by the City of New York Department of Education was used for the
fiscal year 2017 to calculate service loss.84 To estimate the annual operating budget for the schools
where budgets were unavailable, the average value per student per year was determined for all schools
with available budgets. The expenditure by the Department of Education for direct school services per
student per year was found to be $20,724. This figure is applied to the number of students to determine
an annual operating budget.
The number of days of interrupted service is calculated in the 2.3 Displacement as the recovery or
relocation time. The daily operating budget is applied to the number of recovery days to estimate the
value of lost service. 24 schools stand to benefit from the ESCR flood protection systems and the
expected losses avoided are summarized in Table 40.
83 Chakrabarti, Rajashri and Livingston, Max. 2012. The Impact of Superstorm Sandy on NYC School Closures and Attendance. [Web page] Located at: http://www.huffingtonpost.com/rajashri-chakrabarti/hurricane-sandy-school-days_b_2360754.html. December 24.
84 NYC Department of Education. 2017. NYC Department of Education. [Web page] http://schools.nyc.gov/Offices/DBOR/AM/default.htm
“The challenges of relocation impose a heavy burden on the students and teachers forced to move, the schools accepting the displaced, and on the DOE as it coordinates the relocations. The system does not have a large buffer of empty schools or seats, so finding a place to send over 20,000 students is no simple task.”
- Liberty Street Economics (2012)

EAST SIDE COASTAL RESILIENCY BENEFIT COST ANALYSIS
arcadis.com
Benefit-Cost Analysis 91
2.6.1.2 Libraries
There are two public libraries that stand to benefit from the ESCR flood protection project: the Tompkins
Square Park Library on East 10th St, and the Hamilton Fish Park Library on Columbia St. Annual
operating budgets were calculated based on The New York Public Library Annual report for Fiscal year
201885. These were based on the Branch library Expenses and Systemwide expenses for management
and library services, divided across the 88 Branch locations to reach an annual operating cost of
$3,362,575 per branch. Because the Hamilton Fish Park Library is located in the same building as one of
the schools analysed, New Explorations into Science Technology and Math, results for schools and
libraries are integrated into one loss avoided analysis to avoid duplication.
2.6.1.1 Parks
There are 54 parks that stand to benefit from the ESCR flood protection project, totalling over 2 million
square feet. This includes parks that are being improved and elevated as part of the scope of work, such
as East River Park, as well as other neighborhood and pocket parks inland of the coastal area but within
the floodplain. GIS analysis was used to identify park area that would be flooded by each flood scenario,
and analysts coordinated with the Department of Parks and Recreation to estimate days that parks would
be out of service for each flood scenario, summarized in Table 39.
Table 39. Park Impacts by Flood Scenario
Flood Scenario 10% 2% 1% .2%
Area Flooded (000s Square Feet)
1,960 18,585 $31,024 $53,490
Days out of Service 1 3 10 21
An annual operating budget per square foot for parks was calculated based on the 2019 annual operating
budget for the Department of Parks and Recreation ($501.9 million)86 divided by the total parkland in the
city (30,000 acres or 1.307 million square feet) to arrive at $2.60 per square foot. This value was
translated into a daily per square foot operating cost and multiplied by the days out of service and flooded
square feet for each flood scenario.
M"S =N&365
∗ @/ ∗ K"S
Where:
LoS = Loss of Service
Ba = Annual Budget
85 New York public Library Annual Report for 2018. https://www.nypl.org/help/about-nypl/annual-report. 86 https://council.nyc.gov/budget/wp-content/uploads/sites/54/2018/05/FY19-Department-of-Parks-and-Recreation.pdf

EAST SIDE COASTAL RESILIENCY BENEFIT COST ANALYSIS
arcadis.com
Benefit-Cost Analysis 92
Pf = Park area flooded (square feet)
DoS = Days out of Service
2.6.2 Assumptions and Avoided Benefit Duplication As discussed in 2.3.3 Business Interruption, facility loss of service costs could be duplicative with
business interruption costs for some facilities. Additionally, essential facilities that have implemented or
plan to implement flood protection measures separate from the scope of the ESCR are also duplicative.
Thus, the ConEdison East River Generating Station, the ConEdison East River Steam Plant, NYU
Hospital for Joint Diseases Orthopedic Institute, Police Service Area 4, all MTA facilities, and the
Manhattan Pumping Station have been omitted from this analysis to avoid double counting benefits.
2.6.3 Results Table 40. Annual Benefits for Avoided Lost School, Library and Park Service (Presented in the 000s)
Losses Avoided in 2019 Dollars by Annual Chance Coastal Flood Event, Including Sea Level Rise
Asset 10% 2% 1% .2%* Annual Benefits**
Calculation A B C D E (See footnote) Schools and Libraries
$1,502 $18,585 $31,024 $53,490 $1,497
Parks $14 $52 $178 $315 $6
TOTAL $1,516 $18,637 $31,202 $53,805 $1,503 *Based on engineering opinion, the ESCR project is expected to reduce .2 percent annual chance coastal flood scenario expected losses by no less than 75 percent. As such, 75 percent of the expected pre-mitigation losses have been incorporated as benefits into the analysis. ** E = Average (A, B)*(10%-2%) + Average (B,C)*(2%-1%)+Average (C,D)*(1%-0.2%)+D*0.2% ***Calculated using a 7 percent discount rate.
2.7 Avoided Property Value Loss The ESCR project will implement flood protection measures that will reduce flood risk in the study area.
Research indicates that property values decrease with the perception of flood risk and increase from a
visible or perceived reduction in flood risk and increase in aesthetic quality. These benefits are mutually
exclusive, and therefore may be quantified without duplication.87 The benefits related to flood risk
reduction are quantified herein through hedonic pricing research (willingness to pay values demonstrated
in the housing market).
87 Impacts of park improvements on property values are described in the Aesthetic Benefits section.

EAST SIDE COASTAL RESILIENCY BENEFIT COST ANALYSIS
arcadis.com
Benefit-Cost Analysis 93
2.7.1 Data Sources • City of New York Primary Land Use Tax Lot Output Data (2019): This dataset provided the
assessed value of buildings in the study area.
• FEMA Preliminary Flood Insurance Rate Map: These data were used to identify structures
subject to building code and insurance requirements that will benefit from the perception of
reduced flood risk through increased property value.
• The Value of Green Infrastructure: A Guide to Recognizing Its Economic, Environmental, and Social Benefits (2010): This guide provided sources of literature that value increases in
property value due to a reduction in flood risk.
2.7.2 Approach Research shows that for when properties are flooded, property value can decrease from 3 to 12 percent
after a flood event. Bin et al. (2008) found that, in areas where there is a high level of risk awareness in
the community due to regulatory standards, homes located in the floodplain experienced a 7 percent
reduction in value. The same study conducted a survey of other studies and found that location within a
floodplain lowers property value from 3 to 12 percent.88 Another study by the same researcher (Bin et al.
2013) analyzed loss in property value following significant storms and found a 5.7% decrease after
Hurricane Fran, and 8.8% decrease after Hurricane Floyd. The approach below presents high-, medium-,
and low- scenarios using 3 percent, 7 percent, and 12 percent in avoided property value loss.
1. Identify benefitting structures
Based on the approach described above, analysts assumed that structures expected to be protected from
flooding by the ESCR project decrease in property value over time due to flood events and perceived
flood risk. The ESCR project is designed to provide protection to the 1-percent annual chance event.
Therefore, analysts identified structures that are expected to be impacted by the 1-percent annual chance
event as structures benefitting from the ESCR project.
2. Obtain market values
The assessed value of buildings that will be protected from inundation by the ESCR project was
converted to market value. An assessed value is the valuation placed on a property by a public tax
assessor for purposes of taxation, while fair market value is the agreed upon price between a willing and
informed buyer and seller under usual and ordinary circumstances. In other words, market value is the
best estimate of the price the property will bring when offered for sale on the open market. Tax assessors
often apply an assessment ratio to the fair market value to determine the assessed value (see Table 41).
Analysts converted the assessed value to market value by reversing the assessment ratio used by the
City.
Table 41. Summary of Assessment Ratios by Tax Class
88 Bin, O., Brown Kruse, J., and C.E. Landry. 2008. Flood Hazards, Insurance Rates, and Amenities: Evidence from Coastal Housing Market. Journal of Risk and Insurance. Vol. 75 No. 1. Pp. 63-82

EAST SIDE COASTAL RESILIENCY BENEFIT COST ANALYSIS
arcadis.com
Benefit-Cost Analysis 94
Tax Class Tax Class Description Assessment Ratio
1 One-, two- and three-family residential properties and small
condominiums
6%
2 All other residential properties, including rentals and multi-family
cooperatives and condominiums
45%
3 Utility real properties 45%
4 All other real properties, such as office buildings, factories, stores, and
vacant lands
45%
Source: NYC Tax Revenue Forecasting Documentation November 2015
3. Calculate property value loss avoided
The percent decrease in property value was applied to the total market value of each benefitting structure
to obtain a total decrease in property value. This value must be converted to annual benefits. Earth
Economics suggests that 1 percent of the overall decrease in property value is reasonable to expect per
month. As such, 12.68 percent89 of the expected decrease is applied to the property value to obtain an
annual benefit. It is important to note that the decrease in property value represents a cap for which the
annual decrease per year should not exceed. Therefore, the annual decrease is realized each year
beginning in year zero until the loss avoidance is reached (approximately 7.5 years).
2.7.3 Assumptions
• The benefits that result from perceived flood risk reduction and proximity to aesthetic amenities
are not considered to be double counting because the estimated increase in property value is
considered conservative for both benefits and such benefits are mutually exclusive according to
the research. In any case, aesthetic benefits are not captured in this analysis.
• Perceived flood risk reduction is expected to only be realized in structures that flood during the 1
percent annual chance scenario as depicted on the FEMA Flood Insurance Rate Map. Structures
evaluated for an increase in property value are those that meet such criteria.
2.7.4 Results Table 42 summarizes the property value benefits of flood risk reduction offered by the project that are
included in the benefit cost ratio. Benefits are expected to occur each year until the total increase in
property value is reached.
Table 42. Property Value Benefits of Flood Risk Reduction (Presented in the 000s)
Low Scenario (3%) Medium Scenario (7%) High Scenario (12%) Annual losses avoided for the first 7 years
$9,111 $21,253 $36,444
89 Accounts for compounding interest.

EAST SIDE COASTAL RESILIENCY BENEFIT COST ANALYSIS
arcadis.com
Benefit-Cost Analysis 95
Annual Benefit for the last year $8,076 $18,845 $32,305
Total Benefits $71,853 $167,656 $287,410
2.8 Damage to Recreational Facilities The ESCR project will provide flood risk reduction benefits to existing park facilities located in the study
area, specifically in East River Park, Murphy Brothers Playground, Asser Levy Park, and Stuyvesant
Cove Park. The project will elevate many facilities located in East River Park above projected flood levels
and mitigate risk to facilities in other parks. Without the project, these facilities could be damaged by
projected flooding, would need to be replaced or repaired, and access to these assets would be disrupted
during rehabilitation (disruption of access is accounted for in the Loss of Service section above)
NYC Department of Parks and Recreation’s Design and Planning for Flood Resiliency: Guidelines for NYC Parks (DPR’s Design Guide) and expert consultations with engineering staff and NYC DPR provide
the basis for the methodology.
Analysts estimated potential damage to general to park utilities and plantings on a per square foot basis,
and calculated direct damages to specific park facilities expected to incur significant additional
replacement costs (such as synthetic turf fields, play equipment, comfort stations, and the greenway).
Analysts used figures extracted from ESCR project cost estimates developed by the design team to
calculate existing park feature replacement costs, as appropriate (see Appendix). All flood depths were
pulled from modeled flood scenarios described in Section 2.1. For park structures (comfort stations,
tennis building, track & field building, and maintenance & operations buildings), analysts used depth
damage functions from the U.S. Army Corps of Engineers. For all other facilities, the following
assumptions were developed to estimate the percent damage due to each flood hazard scenario:
• Using descriptions from DPR’s Design Guide and guidance from DPR staff, the analysis assumes
synthetic turf to be 75% damaged at 1 foot of flooding, and 100% damaged at 2 feet of flooding.
Additional increments of flood damage were developed through interpolation.
• Using descriptions from DPR’s Design Guide and guidance from DPR staff, the analysis assumes
play equipment to be 25% damaged at 2 feet of flooding, 75% damaged at 6 feet of flooding, and
100% at 9 feet of flooding. Additional increments of flood damage were developed through
interpolation.
• Using descriptions from DPR’s Design Guide and guidance from DPR staff, the analysis assumes
surfacing materials, such as the track surface, tennis courts, and the greenway, to be 75%
damaged at 1 foot of flooding and 100% damaged at 3 feet of flooding. Additional increments of
flood damage were developed through interpolation.
Analysts calculated expected damages to open spaces by developing a per square foot cost of for park
construction ($131/SF) developed from expert consultation, and taking into account NYC-area
construction costs. This cost was applied to the square footage of parks within the project area inundated
by the 10 percent, 2 percent, 1 percent, and 0.2 percent modeled flood scenarios.

EAST SIDE COASTAL RESILIENCY BENEFIT COST ANALYSIS
arcadis.com
Benefit-Cost Analysis 96
2.8.1 Assumptions This analysis assumes that the per square foot cost of replacing the existing park assets is comparable to
the costs of replacing features within the ESCR project. In some cases, the ESCR project includes
improvements to existing facilities. As such, analysts calculated replacement costs for the existing
facilities on a per square foot basis, based on project costs. For instance, the proposed new tennis
building is about 1,000 square feet larger than the existing tennis building, so the cost to replace the
existing facility that is used in this analysis is lower than the cost of the proposed, larger building.
2.8.2 Results Table 43. Avoided Damage to Specific Park Facilities (Presented in the 000s)
Losses Avoided in 2019 Dollars by Annual Chance Coastal Flood Event, Including Sea Level Rise
Asset 10% 2% 1% .2%*
Equipment $1,018 $1,417 $1,817 $2,157
Structure $4,305 $13,330 $14,658 $18,065
Surfacing $5,016 $7,009 $7,039 $7,223
Synthetic Turf $4,223 $12,358 $12,642 $12,642
TOTAL $14,562 $34,115 $36,156 $40,087 *Based on engineering opinion, the ESCR project is expected to reduce .2 percent annual chance coastal flood scenario expected losses by no less than 75 percent. As such, 75 percent of the expected pre-mitigation losses have been incorporated as benefits into the analysis.
Table 44. Avoided Damage to Park Landscape and Utilities (Presented in the 000s)
Losses Avoided in 2019 Dollars by Annual Chance Coastal Flood Event, Including Sea Level Rise
10% 2% 1% .2%* TOTAL $71,257 $144,163 $206,484 $229,258
*Based on engineering opinion, the ESCR project is expected to reduce .2 percent annual chance coastal flood scenario expected losses by no less than 75 percent. As such, 75 percent of the expected pre-mitigation losses have been incorporated as benefits into the analysis.

EAST SIDE COASTAL RESILIENCY BENEFIT COST ANALYSIS
arcadis.com
Benefit-Cost Analysis 97
Table 45. Total Benefits for Avoided Losses to Parks (Presented in the 000s)
Losses Avoided in 2019 Dollars by Annual Chance Coastal Flood Event, Including Sea Level Rise
Asset 10% 2% 1% .2%* Annualized Benefits**
Present Value***
Calculation A B C D E (See footnote) F=E*PV coefficient TOTAL $71,257 $144,162 $206,484 $229,258 $12,551 $71,257
*Based on engineering opinion, the ESCR project is expected to reduce .2 percent annual chance coastal flood scenario expected losses by no less than 75 percent. As such, 75 percent of the expected pre-mitigation losses have been incorporated as benefits into the analysis. ** E = Average (A, B)*(10%-2%) + Average (B,C)*(2%-1%)+Average (C,D)*(1%-0.2%)+D*0.2% ***Calculated using a 7 percent discount rate.
2.9 Hurricane Sandy Impacts Hurricane Sandy caused widespread flood damage to homes, businesses, and critical infrastructure. The
impacts of Hurricane Sandy have inspired New York City to make a commitment to adapt to the impacts
of climate change and to become more resilient to coastal storms; all of which will make New York City
stronger, safer, and more resilient. The impacts of Hurricane Sandy are discussed below to compare
historical damages with expected losses avoided and to increase confidence in the BCA results. As
required by HUD Notice: CPD-16-06, this section is intended to describe the costs that might be avoided
if a disaster similar to Hurricane Sandy struck again. Only impacts due to storm surge and surface
flooding that were experienced in the Lower East Side area to benefit from the ESCR project are
discussed herein.
2.9.1.1 Identify Critical, Essential, and Public Assets
Analysts further refined the data set to identify specific assets for additional analysis or removal from the
evaluation to avoid duplication of benefits (see Section 1.0):
• The Con-Edison Long-Term Resiliency Program seeks to implement resiliency measures to the
East River Generating Station and Steam Plant which will prevent future interruption to those
systems during heavy rain and surge events. Therefore these utility assets were removed from
the analysis. Analysts also removed MTA assets due to the ongoing implementation of resiliency
measures independent of the ESCR project.
• Identified public, critical, and essential facilities for potential additional analysis based on loss of
service and loss of function, or removal due to potential duplication of benefits with other ongoing
resiliency projects.
2.9.2 Public Infrastructure An aging public infrastructure system vulnerable to natural hazards is a challenge faced by New York City
as it serves its growing population. Disruption of essential services can have a tremendous impact on the
daily lives of residents, such as dangerous health impacts and economic losses due to blackouts, or
hampered response and relief efforts due to telecommunication disruption. Water distribution failures

EAST SIDE COASTAL RESILIENCY BENEFIT COST ANALYSIS
arcadis.com
Benefit-Cost Analysis 98
pose risk to public health as residents can be exposed to contaminated water and potential mold issues
due to drainage failure. The Lower East Side was extremely vulnerable to infrastructure failures at the
time of the event, and virtually all systems were impacted.
2.9.2.1 Transportation Systems
The Metropolitan Transportation Authority (MTA) implemented its emergency protection plan for the subway system before Hurricane Sandy made landfall. Actions included closing and sandbagging stations, closing vents, and having pumps and generators on hand to remove floodwaters from the system. Nevertheless, these actions did not prevent extensive damage to several subway stations and tunnels due to low-lying access points and corrosive floodwaters. After Hurricane Sandy, most subway lines in Lower Manhattan were down between three and seven days. Residents had to rely on alternative modes of transportation such as walking, biking, carpooling, telecommuting, and busing. Closed subways caused increased traffic on the roadways and increased commute times. The First Avenue station and L Train Tunnel are in the project area. The MTA is expected to partially close the L line in 2019 for 18 months to conduct tunnel repairs and station improvements due to damage caused by Hurricane Sandy (8th Ave. Station, 6th Ave. Station, 14th St. Station, 3rd Ave. Station, and 1st Ave Station). The repairs and improvements, which include fixing crumbling walls and damaged tracks and cables, are expected to cost more than $800 million. 400,000 passengers use the L line daily, and 225,000 use the line to travel between Manhattan and Brooklyn, specifically.90 The MTA is conducting resiliency actions independent of the ESCR project; nevertheless, the ESCR project will provide the first layer of defense against the impacts of coastal storms.
2.9.2.2 Water and Wastewater Utilities
New York City’s wastewater system comprises 14 treatment plants that treat 1.3 billion gallons of
wastewater a day. The system is vulnerable to coastal storms and flooding because critical assets are
often located on or near the waterfront. The Manhattan Pumping Station, located within the project area,
transports flow collected from 4,300 acres of Lower Manhattan to the Newtown Creek Wastewater
Treatment Plant in Brooklyn. The Manhattan Pump Station experienced three feet of flooding above
grade and was without power for 24 hours due to the event.91 The pump station was inoperable for two
days due to flooding and power loss.92 Preliminary damage costs were $15 million.93 Even though New
York City Department of Environmental Protection is conducting independent mitigation of the Manhattan
Pump Station, the ESCR project will provide an additional layer of protection against the impacts of
coastal storms.
90 Emma G. Fitzsimmons. July 25, 2016. L Train Will Shut Down from Manhattan to Brooklyn in ’19 for 18 Months. The New York Times. Web page. Located at: http://www.nytimes.com/2016/07/26/nyregion/l-train-will-shut-down-between-manhattan-and-brooklyn-in-2019-for-18-months.html?_r=0
91 New York City Wastewater Resiliency Plan. New York City Department of Environmental Protection. Web Page. Located at: http://www.nyc.gov/html/dep/pdf/climate/climate-executive-summary.pdf
92 B. Atieh, C. Marra, E. Lehan, and K. Moriarty. The Manhattan Pump Station: Fortifying for the Future. Hazen and Sawyer. Web Page. Located at: http://www.hazenandsawyer.com/publications/the-manhattan-pump-station-fortifying-for-the-future/
93 New York City Department of Environmental Protection. December 12, 2012. Impacts of Hurricane Sandy to NCYDEP WWTPS and Pump Stations. Web Page. Located at: http://www.harborestuary.org/ppt/Sandy/KMahoney_sandy.pdf

EAST SIDE COASTAL RESILIENCY BENEFIT COST ANALYSIS
arcadis.com
Benefit-Cost Analysis 99
The combined sewer system in New York City collects domestic and industrial waste and stormwater in
the same pipes. During heavy rain, snow, flooding, or coastal storms, the system’s capacity may be
exceeded and untreated wastewater is released into local waterbodies, such as the East River, via
outfalls. Events such as these, called combined sewer overflow (CSO), can be a major source of water
quality impairment, as they release bacteria and pathogens from raw sewage. There were ten partially
treated or untreated wastewater discharges within New York City waterways during Hurricane Sandy. It is
expected CSO outfalls in the project area will be closed during any future events similar to Hurricane
Sandy as a result of the ESCR project.
2.9.2.3 Electrical Systems
An explosion at Consolidated Edison’s (ConEd) 13th Street substation left Lower Manhattan without power
following Hurricane Sandy. Flooding and downed lines also contributed to the power outage. It took from
four-to-seven days to restore power to as many as 750,000 residents.94 Power loss restricts availability of
drinking and potable water, access to elevators and higher floors, refrigeration for medication, and causes
the loss of normal and even emergency lighting, as well as heating and air conditioning. Such impacts
can have a disproportionate effect on vulnerable populations. ConEd is implementing a $1 billion
Fortifying the Future storm-hardening program, which seeks to address vulnerabilities brought to light
during Hurricane Sandy.95 Nevertheless, the ESCR project will provide the first line of defense against the
impacts of coastal storms and flooding.
2.9.3 Residential and Commercial Impacts (Direct Physical Damages and Relocation Costs)
Storm surge associated with Hurricane Sandy was as great as 14 feet in some locations, causing an
estimated $19 billion in property damage in the City of New York alone,96 which includes the ESCR
project area. The Federal Reserve Bank of New York stated the primary causes for reduced business
was the loss of power, loss of communications, and the inability of workers to commute to work.97 This is
especially true in the Lower East Side, which lost power for several days because of the explosion at
ConEd’s 13th Street substation. Merchants in the Lower East Side stated that business stopped for a
week following Hurricane Sandy, and did not return to normal until subway service returned two weeks
later.98 The Lower East Side Business Improvement District (BID) provided financial support for
94 October 31, 2012. ConEd Explosion During Hurricane Sandy Rocks Manhattan’s Lower East Side (VIDEO). The Huffington Post. Web Page. Located at: http://www.huffingtonpost.com/2012/10/30/coned-explosion-hurricane-sandy-video_n_2044097.html
95 Con Edison’s Plan Helps New York Prepare for the Next Storm of the Century. Con Edison. Web Page. Located at: http://www.coned.com/fortifying-the-future/index.html
96 Colvin, Jill and Shapiro, Julie. 2012. Hurricane Sandy Cost City $19 Billion, Bloomberg Says. DNAinfo. [web page] located at: http://www.dnainfo.com/new-york/20121126/new-york-city/bloomberg-says-hurricane-sandy-cost-city-19-billion.
97 Evan Burgos. The Plight of the Lower East Side Small Business. NY City Lens. Web Page. Located at: http://archives.jrn.columbia.edu/2013-2014/nycitylens.com/index-p=8714.html
98 Evan Burgos. The Plight of the Lower East Side Small Business. Web Page. Located at: http://archives.jrn.columbia.edu/2013-2014/nycitylens.com/index-p=8714.html

EAST SIDE COASTAL RESILIENCY BENEFIT COST ANALYSIS
arcadis.com
Benefit-Cost Analysis 100
businesses impacted by Hurricane Sandy, and many businesses lost at least $1,000 in daily revenue
each day they were closed.
A review of news articles and research papers indicates the following residential and commercial impacts
were likely experienced in the project area and could reasonably be expected to be prevented or
significantly reduced in the future because of the ESCR project:
• Approximately 20 percent of homes were rendered uninhabitable in Hurricane Sandy’s inundation zone.99
• Seventy percent of businesses in Lower Manhattan were able to reopen in less than one week, and 85 percent of businesses in Lower Manhattan were reopened within 2 weeks. It is assumed that businesses that were able to do so either experienced minimal structural damage or relocated elsewhere.
• Sixty-five percent of offices in Lower Manhattan were closed for less than one week.100
• Ninety-five percent of businesses impacted by Hurricane Sandy were small or medium enterprises, employing 50 or fewer people.101 Such businesses faced inventory loss, equipment damage, and damages to the structure and interior space. Business losses experienced as a result of Hurricane Sandy are discussed in greater detail below.
Thus, an analysis using the evaluation methods described in 2.3 Direct Physical Damages to Buildings and Contents and 2.4 Displacement was conducted to gain an understanding of impacts to residential
and commercial structures and their inhabitants. Hurricane Sandy is expected to have caused
approximately $866 million in building and contents damages within the project area. Hurricane Sandy is
expected to have caused approximately $49 million in relocation costs to residents and businesses with
the project area.
2.9.4 Human Impacts Approximately 95,000 residents in the project area102 are at risk of displacement due to flooding. Those
who experience property damage from flooding, or are displaced, are more likely to experience symptoms
of mental illness, Post-Traumatic Stress Disorder (PTSD), and higher levels of stress and anxiety.103
Moreover, those same individuals can be expected to have diminished work productivity, which can have
an impact on earnings long term.
In May of 2013, the CDC published an article titled “Deaths Associated with Hurricane Sandy.” Per the
report, one of the 117 deaths related to Hurricane Sandy was directly adjacent to the ESCR study area.
99 CDC. 2013. Nonfatal Injuries 1 Week after Hurricane Sandy. October.
100 Downtown Alliance. Back to Business: The State of Lower Manhattan Four Months After Hurricane Sandy. March 2013. [Web page] Located at: http://www.downtownny.com/sites/default/files/pdfs/Back%20to%20Business-State%20of%20LM-Report_2013_Final_Reduced1.pdf
101 Downtown Alliance. Back to Business: The State of Lower Manhattan Four Months After Hurricane Sandy. March 2013. [Web page] Located at: http://www.downtownny.com/sites/default/files/pdfs/Back%20to%20Business-State%20of%20LM-Report_2013_Final_Reduced1.pdf 102 Population data is from 2015. Hasn’t been updated to reflect conditions during Hurricane Sandy. 103 Rhodes, J., Chan, C.,Pacson, C., Rouse, C.E., Waters, M., and E. Fussell. 2010.. The Impact of Hurricane Katrina on the mental and physical health of low-income parents in New Orleans. Am J Orthopsychiatry. April; 80(2): 237-247.

EAST SIDE COASTAL RESILIENCY BENEFIT COST ANALYSIS
arcadis.com
Benefit-Cost Analysis 101
Most deaths were from drowning due to the storm surge.104 In addition to the loss of life, many people
sustained injuries as a result of floodwaters. The CDC determined through a survey that 10.4 percent of
residents living within an inundation zone reported sustaining an injury in the first week after Hurricane
Sandy; of these, more than 70 percent sustained more than two injuries.105 These injuries were primarily
from evacuation or repair of a damaged/destroyed structure.106 The most common injuries were arm/hand
cuts, followed by back strain/sprain and leg cuts. 25 percent of people with an injury received treatment
from a hospital, emergency department, or doctor’s office, though this varied by household type.
An analysis of the human impacts caused by Hurricane Sandy was conducted using the methods
described in 2.5 Human Impacts, and the results are presented in Table 46. The ESCR project will
protect the residents of the Lower East Side against the human impacts of coastal storms.
Table 46. Human Impacts of Hurricane Sandy (Presented in the 000s)
Loss Category Hurricane Sandy
Mental Stress and Anxiety $71,943
Lost Productivity $40,905
Fatalities -
Injuries $80,504
Total $193,353
2.9.5 Loss of School Service During the first week following Hurricane Sandy, 1,750 public schools in New York City were closed. The
following week many schools remained closed or were damaged. Students in the affected schools were
relocated one week after the hurricane, including students in the 32 schools located in the ESCR project
area. Schools were forced to close due to flood damage, power outages, and transportation challenges.
By November 16, 2012, three weeks after the event, students at 86 schools had a place to go, though 24
schools were still operating out of relocated facilities. School attendance dropped by seven percent in
schools that reopened the first week after Hurricane Sandy, and attendance at relocated schools was
lower than 33 percent in the first two weeks follow Hurricane Sandy.107 The ESCR project will protect
schools and residents against the impacts of coastal storms, allowing students to return to their studies
more quickly.
104 Casey-Lockyer, M., Heick, R.J., Mertzlufft, C.E., Yard, E.E., Wolking, A.F., Noe, R.S., and M. Murti. 2013. Deaths Associated with Hurricane Sandy – October-November 2012. Morbidity and Mortality Weekly Report. Centers for Disease Control. 62(20);393-397. May 24.
105 Brackbill, R.M., Caramanica, K., Maliniak, M., Stellman, S.D., Fairclough, M.A., Farfel, M.R., Turner, L., Maslow, C.B., Moy, A.J., Wu, D., Yu, S., Welch, A.E., Cone, J.E., and Walker, D.J. 2014. Nonfatal Injuries 1 Week after Hurricane Sandy – New York City Metropolitan Area, October 2012. Morbidity and Mortality Weekly Report. Centers for Disease Control. 63(42); 950-954. October 24.
106 CDC. 2013. Nonfatal Injuries 1 Week after Hurricane Sandy. October.
107 Livingston, Max and Rajashri Chakrabarti.2012. The Impact of Superstorm Sandy on New York City School Closures and Attendance. Liberty Street Economics. [web page] Located at http://libertystreeteconomics.newyorkfed.org/2012/12/the-impact-of-superstorm-sandy-on-new-york-city-school-closures-and-attendance.html#.VcNNB6PD-mQ. December 19.

EAST SIDE COASTAL RESILIENCY BENEFIT COST ANALYSIS
arcadis.com
Benefit-Cost Analysis 102
2.9.6 Damage to Parks The Department of Parks & Recreation (DPR) closed all City parks in advance of Sandy’s landfall, and
parks remained closed for several days to allow for park inspections and clean-up. Most parks were
reopened within three days, but nearly 400 parks were damaged significantly and remained closed for
significant repairs. Approximately 20,000 street and park trees were damaged or downed.108 By elevating
the waterfront parks and protecting inland parks through the integrated coastal protection design, ESCR
will reduce risk of park damage in the event of future events like Sandy.
2.9.7 Business Interruption (Economic Impacts) Hurricane Sandy caused physical damage to structures which resulted in substantial impacts to New York
City’s local and regional economy. Business activity was interrupted, and some businesses were forced
to close temporarily, or even permanently, or relocate to resume function, resulting in industry output loss.
Hurricane Sandy caused approximately $20 billion in net economic losses within the Northeast region of
the US; more than a quarter of which was concentrated in New York City alone.109 Analysts used the
methods described in 2.4 Displacement to model economic impacts of business interruption due to
Hurricane Sandy.110 Business interruption estimates for Hurricane Sandy are summarized in Table 47.
Results include direct, indirect, and induced effects111, and employment, labor income, and output loss112
for each effect type.
Table 47. Business Interruption Post Hurricane Sandy
Impact Type Employment (Jobs)
Labor Income (in 000s)
Value Added (in 000s)
Total Output (in 000s)
Direct Effect 3,024 $236,838 $634,668 $818,128
Indirect Effect 621 $72,420 $126,906 $165,389
Induced Effect 18 $1,348 $2,231 $3,204
Total Effect 3,663 $310,606 $763,805 $986,721
FEMA’s Institute for Business and Home Safety states that “one-fourth of all businesses that close because of a disaster never reopen.” This estimate is higher for small businesses.
108 New York City. 2013. A Stronger, More Resilient New York. 109 New York City. 2015. Action Plan Incorporating Amendments 1-9 for CDBG-DR Funds. Located online at: http://www.nyc.gov/html/cdbg/downloads/pdf/CDBG-DR_Action_Plan_incorporating_Amendments_1-9.pdf. May. 110 Analysis was conducted with 2015 data and not updated to reflect Hurricane Sandy impacts. 111 Direct effects are production changes as a result of an activity or policy. Indirect effects are the impact of local industries buying goods and services from other local industries. Induced effects are the response by an economy to an initial change (direct effect) that occurs through re-spending of income received by a component of value added.
112 Employment represents the number of jobs impacted by business interruption. Labor Income is all forms of employment income, including Employee Compensation (wages and benefits) and Proprietor Income. Output represents the value of industry production. In IMPLAN these are annual production estimates for the year of the data set and are in producer prices. For manufacturers, this would be sales plus/minus change in inventory. For service sectors, production is equal to sales. For Retail and wholesale trade, output is equal to the gross margin and not gross sales.

EAST SIDE COASTAL RESILIENCY BENEFIT COST ANALYSIS
arcadis.com
Benefit-Cost Analysis 103
2.10 No Action Alternative It is important to consider, realistically, what would happen in the future if no action is taken, as required
by HUD Notice: CPD-16-06. The hazard scenarios described in 2.1 Hazard Scenarios are expected not
only to perpetuate into the future, but also to worsen due to climate change and sea level rise. As the
Lower East Side becomes more densely populated and the expected flood inundation area expands,
flood risk will increase and more residents and structures will become vulnerable to the escalating
impacts of coastal storms and surface flooding.
If the ESCR project is not implemented, the Lower East Side will continue to be exposed to widespread
inundation due to coastal storm surge. Homes, businesses, critical infrastructure, and thousands of
residents in New York City will continue to be affected by increasingly frequent and more intense coastal
storms. Coastal storms, such as Hurricane Sandy, will continue to cause catastrophic damage to
property, threaten the health and safety of residents, and disrupt economic activity and residents’ daily
lives in no action is taken.
This BCA estimated the losses avoided and value added that is expected to occur if the ESCR project is
implemented. The BCA estimated the dollar values of avoided property damage, loss of public services,
injury and loss of life, mental stress and anxiety, lost productivity, and business interruption. It is possible
to project future storm impacts in five, twenty, and fifty years using annualized avoided losses. Based on
an evaluation of probabilities and the consequences of the 10 percent, 2 percent, 1 percent, and 0.2
percent annual chance coastal storm events, the cumulative cost of coastal storms to residents, business
owners, and the New York City government within the study area could be $827 million over five years,
$2.22 billion over twenty years, and $3.66 billion over fifty years when annualized costs are considered.
Table 48 summarizes potential avoided losses by category.
Table 48. Potential Impacts if No Action is Taken (Presented in the 000s)*
Loss Category Five Years Twenty Years Fifty Years
Physical Damages $248,965 $808,778 $1,398,737
Relocation Costs $11,752 $38,178 $66,027
Business Interruption $253,298 $822,855 $1,423,082
Transportation $1,160 $3,768 $6,517
Loss of Services $6,854 $22,265 $38,507
Casualties $26,455 $85,939 $148,627
Mental Stress and Anxiety $65,885 $65,885 $65,885
Lost Productivity $37,427 $37,427 $37,427
Damage to Parks $57,480 $186,727 $322,934
Property Value Loss $118,618 $151,744 $151,744
Total $827,921 $2,223,659 $3,659,646 *Based on medium scenario and 7% discount rate

EAST SIDE COASTAL RESILIENCY BENEFIT COST ANALYSIS
arcadis.com
Benefit-Cost Analysis 104
The BCA also considers value added by the ESCR project including expected environmental and social
benefits. Such benefits would not be realized if the ESCR project is not implemented. The ESCR project
is expected to increase connectivity between disjointed neighborhoods, provide improved recreation
opportunities, and increase ecosystem services within the natural environment through added and
improved park amenities. Benefits such as these would aid in reducing overall social vulnerability and
increasing social cohesion in the Lower East Side.

EAST SIDE COASTAL RESILIENCY BENEFIT COST ANALYSIS
arcadis.com
Benefit-Cost Analysis 105
3 VALUE ADDED
This section describes the various methods used to quantify benefits associated with value added by the
project separate from losses avoided. These benefits include:
• Environmental benefits in the form of reduced energy use, reduced air pollution, and reduced
carbon dioxide emissions
• Social benefits in the form of recreational value
• Aesthetic benefit generated from making the study area more desirable for businesses and
residents to collocate in the area
3.1 Environmental Value The ESCR project will increase the number of trees and the
amount of vegetation which is expected to provide a range
of environmental benefits, also known as ecosystem goods
and services. The value of ecosystem goods and services
provided by trees and vegetation may be quantified to
estimate their economic benefit to society. Such benefits
are categorized as carbon sequestration, air pollutant reduction,
energy savings, reduced water treatment needs, increase in water
quality, and pollination.
3.1.1 Approach The USDA’s Northeast Community Tree Guide (Tree
Guide),113 New York City Street Tree Census,114 FEMA’s Final
Sustainability Benefits Methodology Report, and Earth Economics
are sources used to develop the low-, medium-, and high- benefit
scenarios for various vegetation types and benefits. Table 50 below
identifies which sources provide the dollar values used to quantify
benefits related to trees and vegetation in the benefit cost
analysis; values presented have been normalized to 2019 dollars.
The high and low benefit scenarios are averaged to determine a
medium benefit scenario. Table 49 summarizes the approach taken to develop a benefit value per
vegetative unit for each benefit scenario.
113 United States Department of Agriculture. 2007. Northeast Community Tree Guide. [web page] located at: https://www.itreetools.org/streets/resources/Streets_CTG/PSW_GTR202_Northeast_CTG.pdf.
114 New York City Parks Department. 2016. Street Tree Census. [web page] located at: https://tree-map.nycgovparks.org/

EAST SIDE COASTAL RESILIENCY BENEFIT COST ANALYSIS
arcadis.com
Benefit-Cost Analysis 106
Table 49. Low, Medium, and High Benefit Scenario Approach Summary
Vegetation Type Low Benefit Scenario Medium Benefit Scenario High Benefit Scenario
Tree Annual benefits per tree are sourced from the Tree Guide
Annual benefits per tree are the average of the low and high benefit scenarios.
Annual benefits per tree are the results of the 2015-2016 New York City Street Tree Censuses.
Vegetation
Annual benefits per vegetative square foot are a combination of benefits sourced from FEMA’s Final Sustainability Report and the results of vegetation performance studies conducted in settings similar to New York City.
Annual benefits per vegetative square foot are the average of the low and high benefit scenarios.
Annual benefits per vegetative square foot are a combination of benefits sourced from FEMA’s Final Sustainability Report and the results of vegetation performance studies conducted in settings similar to New York City.
Table 50. Annual Environmental Benefit Dollar Values and Sources
Vegetation Type Unit Benefit Low Medium
(Average) High
Tree
Annual $/Tree Air Quality $8.68 $9.12 $9.56
Annual $/Tree Energy Savings $36.06 $78.73 $121.40
Annual $/Tree Carbon Sequestration $1.05 $3.47 $5.89
Annual $/Tree Reduced Stormwater Runoff
$11.66 $13.57 $15.48
Annual $/Tree Total Annual Benefit $57.44 $104.89 $149.81
Vegetation
Annual $/SF Air Quality $0.005 $0.006 $0.007
Annual $/SF Carbon Sequestration $0.0004 $0.001 $0.001
Annual $/SF Water Quality $0.008 $0.008 $0.008
Annual $/SF Pollination $0.003 $0.003 $0.003
Annual $/SF Total Annual Benefit $0.016 $0.017 $0.019
Legend: Value Source
E. Gregory McPherson, James R. Simpson, Paula J. Peper, Shelley L. Gardner, Keliane E. Vargas,
and Qingfu Xiao. August 2007. Northeast Community Tree Guide: Benefits, Costs, and Strategic
Planning. United States Department of Agriculture.
New York City Department of Parks. 2005-2006. Street Tree Census.
New York City Department of Parks. 2015. Street Tree Census.
FEMA. 2012 Final Sustainability Benefits Methodology Report. August 23, 2012.

EAST SIDE COASTAL RESILIENCY BENEFIT COST ANALYSIS
arcadis.com
Benefit-Cost Analysis 107
Jun Yang, Qian Yu, and Peng Gong. 2008. Quantifying air pollution removal by green roofs in
Chicago. Atmospheric Environment 42, 7266-7273.
Kim, J., Whalen, J., Fleur, M. One Drop at a Time: Methodology for Landscape Performance Benefits.
Landscape Performance Series
3.1.2 Assumptions and Avoiding Benefit Duplication
• Tree benefits are based on a net increase of 399 trees.
• The value of the landscaped area was based on cost estimates to purchase and install the
landscaping. All landscaped areas were assumed to be improved (not new) and the value is
discounted by 50 percent to avoid double counting benefits that would occur without the
improvements. Environmental benefit would be realized with the existing vegetation, however;
improved vegetation is expected to render greater benefits.
• Analysts assumed that the trees added are fully developed medium-sized trees; therefore, the
benefits calculated pertain to medium trees.
• The USDA’s Northeast Community Tree Guide accounts for tree morbidity over time (33.95
percent). This assumption is factored into the figures provided by the Tree Guide and in the low
scenario; therefore, it is not included as a separate function in the calculation. Tree morbidity is not
considered for the high scenario.
3.1.3 Results Results presented in Table 51 are for new and improved vegetation planned for ESCR project
implementation. Ecosystem benefits extend beyond the useful life of the project level of protection. Based
on FEMA’s Final Sustainability Benefits Methodology Report and FEMA Mitigation Policy FP-108-024-01,
it is common to assign a 100-year useful life to environmental benefits; therefore, the annual benefit is
discounted over a 100-year useful life to obtain the present value. Operation and maintenance costs
associated with new or improved trees and vegetation features are captured within the O&M project costs
as detailed in Table 5.

EAST SIDE COASTAL RESILIENCY BENEFIT COST ANALYSIS
arcadis.com
Benefit-Cost Analysis 108
Table 51. Environmental Benefits of the ESCR Project
Vegetation Type Annual Low Value of Benefit
Annual Medium Value of Benefit
Annual High Value of Benefit
Vegetation $7,170 $7,734 $8,297
Trees $26,481 $48,352 $69,065
Total Annual Environmental
Benefit $33,652 $56,086 $77,362
Present Value at 7% Discount $464,000 $795,000 $1,127,000
Present Value at 3% Discount $1,028,000 $1,762,000 $2,496,000
3.2 Recreation Benefits Urban parks help improve the quality of life and social sustainability of cities by providing recreational
opportunities and aesthetic enjoyment, promoting physical health, contributing to psychological well-
being, enhancing social ties, and providing opportunities for education.115 The ESCR project proposes to
improve the East River Park by adding new park elements and enhancing others. Improvements are
expected to sports fields, tennis and basketball courts, meandering paths, green open spaces, themed
playgrounds, and water features. These park improvements will increase the opportunity for residents to
participate in a variety of recreation activities, thereby enhancing the health and well-being of those who
use the facilities, increasing social capital116 and improving the quality of life in the greater community.117
There are two approaches to quantifying improved outdoor recreation opportunities: 1) consumer-
reported value of increased outdoor recreation (recreation benefits), and 2) health benefits related to
increased activity as a result of park improvements (health benefits). Due to potential benefit duplication,
as outlined 1.4 Mitigating Duplication of Benefits or Potential Double Counting, and a lack of sources
that provide a direct and specific correlation between physical activity and reduced health costs, results of
the health benefits analysis are not incorporated in the benefit cost ratio, but are described in 4.1 Health Benefits of the 4.0 Qualitative Benefits.
3.2.1 Recreation Benefits Recreation benefits quantify the consumer value of increased outdoor recreation expected as a result of
park improvements. Two approaches to value recreation benefits are provided within this methodology,
115 Zhou, X. and M.P. Rana. 2011. Social benefits of urban green space. A conceptual framework of valuation and accessibility
measurements. Management of Environmental Quality: An International Journal.
116 Gomez, E., Baur, J.W.R., Hill, E., and S. Georgiev. 2015. Urban Parks and Psychological Sense of Community. Journal of Leisure Research.
117 Lestan, K.A., Erzen, I., and M. Golobic. 2014. The Role of Open Space in Urban Neighbourhoods for Health-Related Lifestyle. 2014. International Journal of Environmental Research and Public Health. June

EAST SIDE COASTAL RESILIENCY BENEFIT COST ANALYSIS
arcadis.com
Benefit-Cost Analysis 109
and are used as the low-, medium-, and high-value scenarios for recreation benefits. The low-value
method is based on FEMA’s Final Social Sustainability Methodology Report, and assigns a value per
square foot of open space. The medium- and high-value methods use Earth Economics and United
States Army Corps of Engineers (USACE) sources to estimate and value an increase in recreation activity
based on statewide activity days and planned park improvements. Both approaches require the square
footage of new and improved park improvements proposed by the ESCR project, which are derived from
project cost estimates.
3.2.2 Analysis Steps 1. FEMA Methodology Approach
FEMA adopted $0.13118 per square foot as the standard annual recreation value for green open space.
This annual recreational value is generated using nationwide, rural, and suburban willingness to pay
(WTP) studies.119 FEMA’s WTP value is applied to the total area of new and enhanced ESCR park
amenities to estimate the recreational value of park improvements. Again, improved (enhanced) spaces
are discounted by 50 percent.
2. Earth Economics Approach
The Earth Economics approach to evaluate recreation benefits also considers consumer surplus value.
This value is based on certain recreational activities, such as hiking, cycling, and picnicking, rather than
square footage of added recreational space. To generate an estimate of the current recreational activity in
East River Park, baseline recreational activity of New York State residents is gathered from the New York
Statewide Comprehensive Outdoor Recreation Plan (SCORP). Recreational activity data are provided in
the form of activity days, which is the total number of days a recreational activity is performed within a
year for a given population. More simply stated, activity days can be thought of as a ratio of recreational
activity to a total population. Statewide activity days can be used to derive local activity rates for residents
within a quarter mile of the East River Park because local usage rates were not available. The result is an
expected number of current recreational activity days for the population within a quarter mile of East River
Park.
118 Value normalized to 2019 dollars.
119 It is important to note that the studies considered by FEMA are limited in scope regarding the size and composition of population and type of recreational space analyzed, and therefore result in conservative values for recreation benefits in the urban context. Brander and Koetse (2011) conducted a meta-analysis of different hedonic pricing and contingent valuation results and found in both types of analyses that there is a positive relationship between value of open space and population density, and that urban parks are more highly valued than other types of urban open space. Jim and Chen (2010) conducted a hedonic pricing study in Hong Kong and found that the high population density has considerably increased the value of urban open space. The authors reason that increased population density leads to increased use of parks, strengthening the relationship between local residents, and therefore, increasing the value of parks.
Brander, L.M. and M.J. Koetse. 2011. The Value of Urban Open Space: Meta-analyses of contingent valuation and hedonic pricing results. Journal of Environmental Management. 92 (2011) 2763-2773. October
Jim and Chen. 31 August 2009. External effects of neighborhood parks and landscape elements on high-rise residential value. Land Use Policy 27, 662-670.

EAST SIDE COASTAL RESILIENCY BENEFIT COST ANALYSIS
arcadis.com
Benefit-Cost Analysis 110
The recreational benefit is quantified by applying USACE unit day values (UDVs) 120 to the estimated
number of current recreation activity days; the resulting recreation benefit is then distributed over the total
area of East River Park to yield a baseline benefit per square foot of recreation space (medium estimate:
$2.29 and high estimate: $6.87). The USACE UDVs provide a range of possible recreation values based
on activity type, and analysts used the highest and lowest applicable values to produce a range of
benefits. The baseline benefit values are applied to the area of new and improved park features to
estimate the increased value of recreation due to the project. Improved amenities are discounted by 50
percent.
3.2.2.1 Recreation Benefit Limitation and Assumptions
• To avoid double counting benefits associated with park improvements planned at nearby parks,
analysts removed residents that were within 0.25 mile of another park with planned improvements
from the population within 0.25 mile of the ESCR park improvements.
• The park improvements within the ESCR study area are categorized as new or improved.
Benefits of park amenities being replaced are considered improved amenities. Recreation
benefits presented within this methodology only incorporate benefits of net new and improved
area; improved areas are discounted by 50 percent. The 50 percent discount is a transferred
approach based on feedback from the New York City Housing Authority (NYCHA121) staff related
to expected increases in par use resulting from improved amenities proposed at nearby NYCHA
properties.
• A different approach to value improved/enhanced park amenities and spaces would be to
estimate the increased useful life of the amenity and calculate recreation benefits of the extended
useful life. The simple discounting approach is taken in this analysis for ease of review.
• The results of previously conducted studies are applicable to the study area. The FEMA value
relies on studies, which are limited in scope, but are considered applicable nationwide. This
approach does not consider location-specific factors known to impact the results of studies that
value recreational benefits, such as population density, resident age, and income distribution.122
• Analysts assumed that the ratio of annual activity days to persons is the same in New York City
as it is statewide. Outdoor demand surveys are the primary data collected for the Statewide
Comprehensive Outdoors Recreation Plan. While these data are collected statewide, it is the only
primary data source available to support estimation of current recreation activity.
3.2.3 Results The results of each of the two approaches to quantify recreation benefits associated with new and
improved park space are presented in Table 52 as low-, medium-, and high-value benefit scenarios. The
120 United States Army Corps of Engineers. 2016. Economic Guidance Memorandum, 16-03 Unit Day Values for Recreation for Fiscal Year 2016. Located at: http://planning.usace.army.mil/toolbox/library/EGMs/EGM16-03.pdf
121 The New York City Housing Authority is a public agency responsible for 328 public housing developments across the City’s five boroughs.
122 Brander, L.M. and M.J. Koetse. 2011. The Value of Urban Open Space: Meta-analyses of contingent valuation and hedonic pricing results. Journal of Environmental Management. 92 (2011) 2763-2773. October

EAST SIDE COASTAL RESILIENCY BENEFIT COST ANALYSIS
arcadis.com
Benefit-Cost Analysis 111
present value of these benefits may be integrated with other resiliency values and inherent values to
determine total present value of benefits and the benefit cost ratio.
Table 52. Recreation Benefit Results for the Low-, Medium-, and High-Benefit Scenarios (in 000s)
Benefits Low Benefit
Scenario
Medium (Averaged)
Benefit Scenario
High Benefit Scenario
Total Annual Benefits $145 $2,621 $7,869 Total Present Value, 7% Discount Rate123 $1,134,899 $20,390,477 $61,223,715
Total Present Value, 3% Discount Rate $3,753 $38,015,492 $114,143,953 *Includes new and improved recreational space, and reduced space as a reduction.
3.3 Aesthetic Benefits The ESCR project includes flood protection measures and park improvements, that may render the study
area more appealing to existing and future residents and businesses, in turn possibly creating a positive
effect for residents and the local economy. Attractive views are one of the factors that can contribute to
this positive effect. The benefits of increased aesthetic amenities may be quantified through hedonic
pricing (WTP values inferred from statistical analysis of the housing market), and on a standard value-per-
square foot basis. The ESCR project is one of several plans to improve the quality of parks and
playgrounds in the study area. Improvements to other parks would also have a positive effect for
residents and the local economy that can be estimated through hedonic pricing. It is nearly impossible to
know which park improvement in the study area has a greater or lesser impact when valuing benefits
using hedonic pricing methods. To avoid potential double counting of benefits related to other planned
park improvements in the study area, aesthetic benefits are quantified herein using standard values
provided by FEMA, the Northeast Tree Guide, and the New York City Department of Parks and
Recreation Tree Census.
3.3.1 Data Sources • FEMA’s Final Sustainability Benefits Methodology Report (2012)124: This report contains an
aesthetic value of green open space per acre per year.
• The Northeast Community Tree Guide (2007): This report provides a value for the aesthetic
benefits of public trees.
123 To compare future benefits to current cost, the Present Value of Annual Benefits is calculated using a discount rate applied to the annual dollar value of benefits accruing over the life of the project. The Present Value represents the total value of recreation benefits realized over the life of the project. The life of the project is 50 years.
124 Federal Emergency Management Agency. 2012. Final Sustainability Benefits Methodology Report. August 23, 2012.

EAST SIDE COASTAL RESILIENCY BENEFIT COST ANALYSIS
arcadis.com
Benefit-Cost Analysis 112
• New York City (NYC) Parks Department (2005-2006) Street Tree Census: The results of the
censuses were used to obtain environmental and social benefits provided per tree in New York
City.
3.3.2 Approach Analysts used FEMA’s methodology presented in its Final Sustainability Benefits Methodology Report to
value the aesthetic benefit of specific park improvements. FEMA’s report uses benefit transfer
methodology125 to obtain an aesthetic value per acre per year of green open space. Analysts normalized
this value to 2019 dollars and converted it to square feet. This value is applied to the area of new and
improved green park space to value aesthetic benefits. Improved spaces were discounted by 50 percent.
Trees may also increase the aesthetic quality of the park and surrounding areas. The U.S. Forest
Service’s Tree Guide and the NYC Street Tree Census provide annual aesthetic values per tree that are
used to develop low- and high- benefit scenarios, respectively. The annual values per tree from both
sources were normalized to 2019 dollars. The high and low benefit scenarios are averaged to determine
a medium benefit scenario. The annual value per tree for each scenario is applied to the net increase in
trees resulting from the ESCR Project.
3.3.3 Assumptions
• Aesthetic values of green open spaces can be estimated using econometric hedonic price
methods. Literature indicates that green spaces can increase property values by 2 percent to 20
percent, with greater increases associated with more urban places. The park enhancements
planned as part of ESCR will be implemented around the same time as improvements at other
parks in the study area. All planned park enhancements in the study area will increase the
aesthetic quality of the community, making it difficult to determine if one project will have a greater
affect than another. To avoid double counting of benefits with other projects in the study area, an
increase in property values was not used to determine aesthetic benefits.
• Aesthetic benefits valued using FEMA’s methodology consider new or improved recreational
space, including green space and hardscape.
• Analysts assumed that the results of previous studies used by FEMA to determine standard
values, are transferable to the study area. FEMA values are based on studies FEMA considers to
be applicable nationwide. Research indicates that higher population density results in a
considerable increase in the value of urban parks and open space.126 Increased value in urban
areas is not captured in this analysis due to the use of FEMA standard figures.
• Analysts assumed that the added trees are fully developed medium-sized trees; therefore, the
benefits calculated pertain to medium trees.
125 The benefit transfer method applies the results of previously conducted primary studies to another geography.
126 Brander, L.M. and M.J. Koetse. 2011. The Value of Urban Open Space: Meta-analyses of contingent valuation and hedonic pricing results. Journal of Environmental Management. 92 (2011) 2763-2773. October

EAST SIDE COASTAL RESILIENCY BENEFIT COST ANALYSIS
arcadis.com
Benefit-Cost Analysis 113
• The USDA’s Northeast Community Tree Guide accounts for tree morbidity over time (33.95
percent). This assumption is factored into the figures provided by the Tree Guide and in the low
scenario; therefore, it is not included as a separate function in the calculation. Tree morbidity is
not considered for the high scenario.
3.3.4 Results Table 53 summarizes the aesthetic benefits related to green open space and trees. These aesthetic
benefits are specific to the natural improvements proposed as part of the East Side Coastal Resiliency
project, and do not double count benefits for improvements at other parks within the study area.
Table 53. Aesthetic Benefits of Park Space and Trees
Annual Low Benefit Scenario127
Annual Medium Benefit Scenario
Annual High Benefit Scenario
Park Space, Annual Benefit $19,242 $19,242 $19,242
Trees, Annual Benefit $19,075 $32,672 $46,269
Total Annual Benefit $63,777 $77,374 $90,971
Present Value, 3 Percent Discount Rate $1,640,974 $1,990,564 $2,340,668
Present Value, 7 Percent Discount Rate $880,174 $1,067,684 $1,255,471
127 Annual benefits for green open space are represented as dollars per total square feet of added space, while annual benefits for trees are represented as dollars per total count of removed trees.

EAST SIDE COASTAL RESILIENCY BENEFIT COST ANALYSIS
arcadis.com
Benefit-Cost Analysis 114
4 BENEFITS NOT QUANTIFIED
The ESCR project may provide other benefits that were not valued in this BCA due to insufficient data.
These benefits are described as follows.
4.1 Health Benefits Studies have found that physical improvements and increased access to parks can increase the number
of parks users and the frequency of exercise.128 There is strong evidence from the Center for Disease
Control (CDC) that access to parks and/or recreation areas increases the frequency of exercise within the
local population.129 Findings from a CDC study indicate that “creation of or enhanced access to places for
physical activity led to a 25.6 percent increase in the percentage of people exercising on three or more
days per week”130 where access can be enhanced by building trails or reducing barriers. Implementation
of the ESCR project is expected to increase access to the East River Park, enhance existing recreational
amenities, and improve connectivity between adjacent neighborhoods. As such, analysts expect the
frequency and volume of physical activity in the park to increase, thereby increasing the number of
residents that meet physical fitness guidelines. Increased exercise improves health, and therefore,
reduces health care costs and increases worker productivity.
It is difficult to estimate how much new/improved park space and what types of improvements will result in
more people exercising, and it is assumed that because people exercise, they meet fitness guidelines,
thus requiring less medical attention. Due to a lack of sources stating a direct relationship between
increased physical activity and reduced health care costs coupled with potential double counting of
benefits with recreation values, health benefits are not included in the BCR.
4.2 Avoided Deployment of Emergency Services After Hurricane Sandy, equipment, fuel, and human resources were required to alleviate flood conditions,
including generators, dehumidifiers, trailers, pumps, and other machinery. The quantity of equipment
required, and the space that equipment occupied on sidewalks and streets impacted traffic and
pedestrian circulation in the area. Both vehicles and pedestrians had to be re-routed through the area,
increasing commute times and likely impacting commuters’ decisions on mode of transportation.
Moreover, residents complained about air quality and noise pollution, both of which are associated with
negative health impacts. Such complaints also indicate that the equipment had a negative impact on
quality of life for residents in the area. By reducing the risk of flooding from storm surge, the ESCR project
would reduce the need for heavy machinery and equipment associated with cleanup after flood events,
thus reducing traffic, environmental, and quality of life issues in the study area. City responders would
128 Tester and Baker. 2009. Making the playfields even: Evaluating the impact of an environmental intervention on park use and physical activity. Journal of Preventive Medicine 48: 316-320.
129 Kahn et al. 2001. Increasing Physical Activity: A report on recommendations of the task force on community preventive services. [web page] located at: http://www.cdc.gov/mmwr/preview/mmwrhtml/rr5018a1.htm
130 Sherer, P. 2006. The Benefits of Parks: Why America Needs More City Parks and Open Space. San Francisco: The Trust for Public Land.

EAST SIDE COASTAL RESILIENCY BENEFIT COST ANALYSIS
arcadis.com
Benefit-Cost Analysis 115
also experience a reduction in the amount of time, energy, and resources required for post-disaster
response in the study area, avoiding the need for City and federal emergency funding.
4.3 Reduced Costs of Flood Insurance A potential benefit of the ESCR project is a reduction in flood insurance premiums to property owners in
the protected area. This benefit is unquantified because of the uncertainty regarding the impact of the
ESCR project on future flood insurance premiums.

EAST SIDE COASTAL RESILIENCY BENEFIT COST ANALYSIS
arcadis.com
Benefit-Cost Analysis 116
5 CONCLUSION
The ESCR project will be a national and global example of adapting urban environments to be resilient to
the increased risk of coastal flooding caused by climate change. The primary goals of the ESCR project
are to reduce the risk of coastal flooding in the Lower East Side of Manhattan, improve community
connection to and enjoyment of the waterfront through integrated landscape and urban design
interventions, and to retain and provide enhanced recreational opportunities in the East River Park. The
City project team and the ESCR design team developed the preferred project, which balances these
design goals, to produce a project that is practical and implementable given available funding and site
conditions.
BCA analysts compared the ESCR project costs to resiliency, social, economic, and environmental
project benefits, and found the ESCR project to be cost beneficial using low, medium, or high estimated
benefits (see Table 3, Table 4, Table 54, and Table 55). Using a 7 percent discount rate, the low-end
estimate of the present value of project benefits is $1.99 billion, and project cost is $1.43 Billion, indicating a BCA ratio of 1.40, at minimum.
Over 1,000 structures and nearly 100,000 residents stand to benefit from the implementation of the ESCR
flood protection system. The total annualized flood losses avoided over the life of the project are
approximately $156 million, including avoided direct physical damages, business interruption, relocation
costs, property value loss, impacts to critical infrastructure, and human impacts; while value added
benefits in the form of environmental, recreation, and aesthetic value added benefits are approximately
$240,000 annually (refer to Table 56, Table 58, and Table 59). The findings of the ESCR BCA indicate
that the project would not only reduce risk of coastal flooding, but enhance the quality of the East River
Park to provide enhanced recreational amenities and access to the waterfront.
Table 54. Project Scenario Results (Low Estimated Benefits)
Discount Rate Total Costs Total Benefits Benefit Cost Ratio
7% Discount Rate $1,426,167,825 $1,987,009,511 1.40
3% Discount Rate
$1,466,726,486 $3,572,935,571 2.44
Table 55. Project Scenario Results (High Estimated Benefits)
Scenario Total Costs Total Benefits Benefit Cost Ratio
7% Discount Rate $1,426,167,825 $2,980,697,443 2.17
3% Discount Rate
$1,466,726,486 $5,243,992,131 3.72

EAST SIDE COASTAL RESILIENCY BENEFIT COST ANALYSIS
arcadis.com Benefit-Cost Analysis 117
Table 56. Losses Avoided Results Low Scenario (Presented in the 000s)
Benefit 10% Annual
Chance Event Benefit
2% Annual Chance Event
Benefit
1% Annual Chance Event
Benefit
0.2% Annual Chance Event
Benefit
Annualized Benefit
Present Value (7% Discount
Rate)*
Present Value (3% Discount
Rate)* Direct Physical Damages Total Structure Damage Costs
$167,578 $462,282 $592,189 $823,411 $37,776 $521,337 $971,967
Total Contents Losses $71,603 $197,877 $266,163 $403,759 $16,587 $228,908 $426,770 Park Damages $71,257 $144,162 $206,484 $229,258 $12,551 $173,213 $322,934 Property Value Loss* $9,111 $57,568 $65,033 Displacement Relocation $7,833 $30,794 $44,267 $78,122 $2,566 $35,415 $66,027 Business Interruption $176,073 $728,680 $899,446 $1,230,041 $55,309 $763,302 $1,423,082 Human Impacts Mental Stress and Anxiety131
$29,908 $53,494 $65,885 $86,555 $4,716 $65,885 $65,885
Lost Productivity $16,989 $30,394 $37,427 $49,191 $2,679 $37,427 $37,427 Casualties $37,130 $65,269 $79,708 $106,136 $5,776 $79,720 $148,628 Critical and Essential Assets Transportation $2,319 $2,419 $3,822 $2,869 $253 $3,495 $6,516 Public Facilities $1,516 $18,637 $31,202 $53,805 $1,503 $20,740 $38,668 Total Losses Avoided $582,206 $1,734,008 $2,226,594 $3,063,146 $156,903 $1,987,010 $3,572,936
131 Per FEMA methodology, mental stress and anxiety and lost productivity losses avoided at the project’s designed level of protection are added as a lump sum to the project benefits present value because mental stress and lost productivity benefits are calculated for the first 30 months only.

EAST SIDE COASTAL RESILIENCY BENEFIT COST ANALYSIS
arcadis.com Benefit-Cost Analysis 118
Table 57. Losses Avoided Results High Scenario (Presented in the 000s)
Benefit 10% Annual
Chance Event Benefit
2% Annual Chance Event
Benefit
1% Annual Chance Event
Benefit
0.2% Annual Chance Event
Benefit132
Annualized Benefit
Present Value (7% Discount
Rate)*
Present Value (3% Discount
Rate)* Direct Physical Damages Total Structure Damage Costs
$347,997 $774,225 $969,377 $1,142,136 $64,337 $887,902 $1,655,381
Total Contents Losses $182,400 $414,550 $532,874 $670,767 $34,771 $479,869 $894,655 Park Damages $71,257 $144,162 $206,484 $229,258 $12,551 $173,213 $322,934 Property Value Loss* $36,444 $230,271 $260,132 Displacement Relocation $25,359 $83,732 $111,191 $158,549 $6,734 $92,938 $173,272 Business Interruption $176,073 $728,680 $899,446 $1,230,041 $55,309 $763,302 $1,423,082 Human Impacts Mental Stress and Anxiety133
$50,150 $92,352 $106,193 $120,057 $7,838 $106,193 $106,193
Lost Productivity $28,500 $52,513 $60,362 $68,262 $4,456 $60,362 $60,362 Casualties $59,780 $108,750 $124,811 $143,625 $9,270 $127,934 $238,516 Critical and Essential Assets Transportation $2,319 $2,419 $3,822 $2,869 $253 $3,495 $6,516 Public Facilities $12,311 $49,574 $71,718 $105,423 $4,001 $55,219 $102,949 Total Losses Avoided $956,147 $2,450,958 $3,086,279 $3,870,987 $268,269 $2,980,697 $5,243,992
*Calculated as one-time damage for 1% annual chance flood
132 Benefits decrease from the 1% chance event because the project is designed to the 1% chance surge elevation and mitigates 75% of the damage above that elevation. 133 Per FEMA methodology, mental stress and anxiety and lost productivity losses avoided at the project’s designed level of protection are added as a lump sum to the project benefits present value because mental stress and lost productivity benefits are calculated for the first 30 months only.

EAST SIDE COASTAL RESILIENCY BENEFIT COST ANALYSIS
arcadis.com Benefit-Cost Analysis 119
Table 58. Value Added Benefit Results, Low Scenario (Presented in the 000s)
Benefit Annual Benefit Present Value (7% Discount
Rate)
Present Value (3% Discount
Rate) Recreation $146 $2,013 $3,753
Environmental $34 $480 $1,063 Aesthetic $64 $880 $1,641 Total Benefits $243 $3,373 $6,457
Table 59. Value Added Benefit Results, High Scenario (Presented in the 000s)
Benefit Annual Benefit Present Value (7% Discount
Rate)
Present Value (3% Discount
Rate) Recreation $7,869 $108,599 $202,468
Environmental $77 $1,104 $2,445 Aesthetic $91 $1,255 $2,341 Total Benefits $8,037 $110,958 $207,254

EAST SIDE COASTAL RESILIENCY BENEFIT COST ANALYSIS
5.1 Risks to On-going Project Benefits
The following sections describe key risks and uncertainties that may affect the positive and negative
effects of the project and measures to adapt to these risks.
5.1.1 Sea Level Rise Scenario
The ESCR design team used a specific sea level rise projection when establishing the project level of
protection. Nevertheless, the design team has accounted for the possible need to adapt the system to
higher SLR projections. Should the project need to adapt to a higher SLR projection, project benefits
would increase along with the overall cost of the project, as avoided losses from more severe flood
events would be incorporated as benefits.
5.1.2 ESCR Project Loss of Function
Certain elements of the ESCR project require human intervention prior to a coastal storm to be effective.
The need for human intervention increases the risk that the IFPS may not function properly during a
hazard event. Moreover, the IFPS will require regular maintenance to ensure all elements are fully
functioning. The City is developing a robust operations and maintenance manual and an emergency
preparedness plan in order to mitigate this risk. These measures will help the City ensure regular
maintenance of the flood protection system and will help the City receive FEMA accreditation for this
project.
5.1.3 Other Resilience Measures
There are several resilience projects underway in Lower Manhattan, as described throughout this report.
These projects protect critical infrastructure and public housing, but do not provide flood protection to
private residences and businesses. Where identified, benefits to structures and infrastructure
experiencing multiple lines of defense have been excluded from this BCA to avoid possible duplication of
benefits. This is a conservative approach, as the ESCR project will be New York City’s first line of defense
against the impacts of coastal storms and flooding and will certainly provide benefits to structures that
have a second line of defense.
5.2 Potential Challenges to Project Implementation
5.2.1 Implementation Schedule
The ESCR project has the full support and commitment of the New York City Mayor’s Office and is under
the project management of the NYC Department of Design and Construction. The project was certified
into ULURP, the City’s land use review process, in April 2019 and is expected to be approved by the City
Planning Commission and the City Council in September 2019. While a successful vote is anticipated at
this time, unexpected issues could delay implementation, and therefore delay project benefits as
presented in this analysis. The project also requires environmental review in order to proceed, which is

EAST SIDE COASTAL RESILIENCY BENEFIT COST ANALYSIS
being pursued in coordination with the ULURP process. A Final Environmental Impact Statement is
expected to be issued in September 2019.
5.2.2 Technical Risks
At this time, the ESCR project design is early in the final design phase. Geotechnical data and utility
surveys are still ongoing. This data and information will be finalized and incorporated as the project
reaches 100 percent final design. It is expected that any technical risks will be identified and addressed
prior to the ESCR project reaching final design.
5.2.3 Stakeholder Engagement
Community outreach is critical during the design process to bolster broad community support. The public
has been, and will continue to be, engaged in the design process via a public hearing and public
comment period to incorporate the community’s feedback into the project design. The City will ensure all
public populations and groups have access to project information and an opportunity to provide feedback.
Arcadis U.S., Inc.
www.arcadis.com