escuela tÉcnica superior de ingenieros ... -...
TRANSCRIPT

UNIVERSITÀ DEGLI STUDI DI PADOVA DIPARTIMENTO DI INGEGNERIA
CORSO DI LAUREA MAGISTRALE IN INGEGNERIA ELETTRICA TESI DI LAUREA MAGISTRALE
ANALYSIS OF
LIGHTING ILLUMINATION OF
COMMON AREAS OF
ESCUELA TÉCNICA SUPERIOR DE
INGENIEROS INDUSTRIALES OF
VIGO UNIVERSITY
RELATORE: PROF. MARIA ELENA VALCHER
DIPARTIMENTO DI INGEGNERIA DELL’INFORMAZIONE
CO-RELATORE: PROF CAMILO JOSÉ CARRILLO
GONAZÁLEZ
UNIVERSITÀ DI VIGO
LAUREANDO: DAVIDE MENEGHEL
ANNO ACCADEMICO 2012-2013

2

3
TABLE OF CONTENTS
SUMMARY 5
INTRODUCTION 7
CHAPTER 1 – ENERGY AND LIGHTING NOWADAYS 9
1.1 BACKGROUND
1.2 ABOUT THE ANNEX 45
1.3 ELECTRICIY CONSUMPTION OF LIGHTING
1.4 EUROPEAN ENERGY EFFICIENT POLICY: PLAN 2011
1.5 THE TECHNICAL BUILDING CODE (CÓDIGO TECNICO DE
LA EDIFICACIÓN)
1.5.1 EFFICIENCT ENERGY OF LIGHTING INSTALLATIONS
CHAPTER 2 – ARTIFICIAL LIGHTING AND DAYLIGHT 21
2.1 FLUORESCENT LAMPS INSTALLATION
2.2 ENERGY ASPECTS OF LUMINAIRES
2.3 DAYLIGHT IN INTERIORS
2.3.1 ENERGY COST
2.3.2 CONTROL OF ARTIFICIAL LIGHTING
2.3.3 VISUAL COMFORT
2.3.4 PSYCOLOGICAL ASPECTS OF LIGHT

4
CHAPTER 3 – MEASUREMENTS AND ENERGY ANALYSIS 31
3.1 OVERVIEW
3.2 GLOBAL SOLAR RADIATION ANALYSIS
3.2.1 DIRECT SOLAR RADIATION
3.2.2 DIFFUSE SOLAR RADIATION
3.2.3 RESULTS
3.3 MODELLING SIMULATION USING DIALux
3.4 LIGHTING ENERGY CONSUMPTION
3.4.1 RESULTS
CHAPTER 4 – LIGHITNG CONTROL SYSTEMS 43
4.1 SOLUTIONS OF LIGHTING CONTROLS
4.2 LIGHT CONTROL DEVICES
4.2.1 LIGHT INTENSITY SWITHCES Noark Ex9LD
4.2.2 DIGITAL TIME SWITCH (TIME AND LIGHT CONTROL) Theben TR 644
4.2.3 SENSOR/CONTROLLER Philips OccuSwitch DALI
BIBLIOGRAPHY 53

5
SUMMARY
On a worldwide scale, lighting accounts for 20% to 50% of buildings’ energy balance and
19% of the global electricity consumption, and therefore represents a key driver for energy
efficiency efforts in different countries. Among the various strategies developed to foster
efficient lighting, the inclusion of some lighting control devices, that control the daylight and
the occupancy staff, has shown good energy savings potential.
This thesis work focuses on a global solar radiation analysis of daylight in Vigo and the
modelling of the common areas of the school. Once developed these step-by-step techniques,
we noted that lighting energy saving is very high.
Thanks to commercial devices presents in the electrical market, we could verify that, with a
few attention, exist an efficient energy for the common areas analysed. Surely, this topic can
be applied to other school zones and obtain a more lighting energy saving.

6

7
INTRODUCTION
The present work deals with energy efficiency in lighting with a particular focus on daylight
behaviour in Vigo and usage of lighting control devices for efficiency energy. The work has
been developed during the author’s permanence at the University of Vigo, according to the
Erasmus statement in the academic year 2012/2013.
Chapter 1 outlines the impact of lighting on the world global energy consumption, with
a particular focus on Spanish and European situation. Attention is given to regulations,
policies and strategies recently developed in the two aforementioned countries to foster
energy efficiency in lighting, and to their results.
Chapter 2 introduces different aspects of artificial lighting, like which kind of luminaires we
considered for the analysis of this present work, and which are the consequences of artificial
lighting. For example, visual comfort and its psychological effects are important for the
occupants wellness into the buildings during them school activities.
Chapter 3 analyses the adopted methodology. In fact, we proceeded to make technical and
electrical measures of the common areas, and then we simulated the different cases with
DIALux software. The obtained results we said us that a good energy saving was possible
with the usage of specified lighting control devices.
Chapter 4 demonstrates the validity of our considerations in the previous chapter, i.e.
introducing lighting control devices produce energy saving. The analysed devices are
available in the actual electrical market, and so, with a little investment, everyone could
apply a modest lighting energy saving.

8

9
Chapter 1
Energy and Lighting nowadays
The present work focuses on the specific topic of energy efficiency and its
characteristics. Specifically, this thesis will deal with energy efficient lighting that is
nowadays among the top priorities for different countries and local authorities, both
for exterior and interior lighting, both in public and private environments. In fact the
Annex 45 of IEA International Energy Agency and ECBCS Energy Conservation in
Buildings and Community Systems, as well as the European Standard EN 12464-1,
will be considered for developing all the analysis of the present thesis.
1.1 Background
Lighting is a large and rapidly growing source of energy demand and greenhouse gas
emissions. In 2005, grid-based electricity consumption for lighting was 2650 TWh
worldwide, which was about 19% of the total global electricity consumption.
Furthermore, each year 55 billion litres of gasoline and diesel are used to operate
vehicle lights. More than one-quarter of the population of the world uses liquid fuel
(kerosene oil) to provide lighting (IEA 2006). Global electricity consumption for

10
lighting is distributed approximately 28% to the residential sector, 48% to the service
sector, 16% to the industrial sector, and 8% to street and other lighting. In the
industrialized countries, national electricity consumption for lighting ranges from 5%
to 15%, while in developing countries the value can be as high as 86% of the total
electricity use.
A more efficient use of the energy used for lighting would limit the rate of increase of
electric power consumption, reduce the economic and social costs resulting from the
construction of new generating capacity, and reduce the emissions of greenhouse
gases and other pollutants into the environment. At the moment, important factors
concerning lighting are energy efficiency, daylight use, individual control of light,
quality of light, emissions during the life-cycle, and total costs.
Efficient lighting has been found in several studies to be a cost effective way to reduce
CO2 emissions. The Intergovernmental Panel on Climate Change for non-residential
buildings concluded that energy efficient lighting is one of the measures covering the
largest potential and also providing the cheapest mitigation options. Among the
measures that have potential for CO2 reduction in buildings, energy efficient lighting
comes first largest in developing countries, second largest in countries with their
economies in transition, and third largest in the industrialized countries.
The report by McKinsey (Fig. 1.1) shows the cost-effectiveness of lighting systems in
reducing CO2 emissions. The global “carbon abatement cost curve” provides a map of
the world’s abatement opportunities ranked from the least-cost to the highest-cost
options. This cost curve shows the steps that can be taken with technologies that either
are available today or look very likely to become available in the near future. The
width of the bars indicates the amount of CO2 emissions that we could abate, while the
height shows the cost per ton abated. The lowest-cost opportunities appear on the left
of the graph.

11
Fig. 1.1 Costs of different CO2 abatement opportunities (McKinsey 2008)
1.2 About the Annex 45
First of all, Annex 45 treated energy efficient electric lighting for buildings and its
goal was to identify and to accelerate the widespread use of appropriate energy
efficient high-quality lighting technologies and their integration with other building
systems, making them the preferred choice of lighting designers, owners and users.
The aim was to assess and document the technical performance of the existing
promising, but largely underutilized, innovative lighting technologies, as well as
future lighting technologies. These novel lighting system concepts have to meet the
functional, aesthetic, and comfort requirements of building occupants.
1.2.1 Structure of Annex 45
The work of Annex 45 was divided into four subtasks:
- Subtask A: Targets for energy performance and human well-being
- Subtask B: Innovative technical solutions
- Subtask C: Energy efficient controls and integration
- Subtask D: Documentation and dissemination

12
Subtask A: Targets for energy performance and human well-being
The objectives of this subtask were to set targets for energy use, lighting quality and
human well-being. Another aim was to propose an upgrade of lighting
recommendations and codes to improve the energy performance of indoor lighting
installations. The performance criteria include the quality of light (spectrum, colour
rendering and colour temperature) and user acceptance. The energy criteria include the
energy efficiency of lighting, life-cycle energy considerations, and the maintenance
and control of light. The economic criteria include the initial costs and operating costs.
Subtask B: Innovative technical solutions
The objective of this subtask was to identify, assess and document the performance,
energy and economic criteria of the existing promising and innovative future lighting
technologies and their impact on other building equipment and systems. The purpose
was to reduce the energy use of buildings by investigating the saving potential, by
comparing the existing and future technologies and by providing information on
concepts, products and lighting solutions. The technical solutions cover connection
devices (ballast, control gear, current sources, etc.), light sources, luminaries, and
control techniques.
Subtask C: Energy efficient controls and integration
Subtask C focused on the optimal use of controls that enable energy savings to be
made whilst the users (occupants, facility managers, operation and maintenance
teams) have the chance to adjust the electric lighting according to their personal needs
and preferences, within acceptable building operation requirements.
Subtask D: Documentation and dissemination
The objective of subtask D was to compile and widely disseminate the results of
subtasks A, B and C, and to identify ways to influence energy policies and regulations
in order to promote the use of energy efficient lighting. The aim of subtask D was to
improve current lighting practices in a manner that accelerates the use of energy
efficient products, improves overall building performance and enhances the
occupants’ environmental satisfaction.

13
Fig. 1.2.1 Structure of Annex 45
1.3 Electricity consumption for lighting
Lighting was the first service offered by electric utilities and it continues to be a major
source of electricity consumption.
Fig. 1.3 Global lighting energy use (IEA 2006)
Globally, almost one fifth of the total amount of electricity generated is consumed by
the lighting sector. The total electricity consumption of lighting is more than the
global electricity produced by hydro or nuclear plants, and almost the same as the
electricity produced with natural gas. More than 50% of the electricity used by
lighting is consumed in IEA member countries1, but this is expected to change in the
1 The IEA is made up of 28 member countries: Australia (joined: 1979), Austria (founding member:
1974), Belgium (founding member: 1974), Canada (founding member: 1974), Czech Republic (joined:
14
coming years because of the increasing growth rate of lighting electricity use in non-
IEA countries.
Almost half of the global lighting electricity (48%) is consumed by the service sector.
The rest is distributed between the residential sector (28%), industrial sector (16%),
and street and other lighting (8%). The share of electricity consumption for lighting of
the total electricity consumption varies from 5% to 15% in the industrialized
countries.
The amount of consumption of light in the world has been constantly increasing with
the increase in the per capita light consumption and the increase in the population. The
average annual per capita light consumption of people with access to electricity is 27.6
megalumen-hours2, whereas the people without access to electricity use only 50
kilolumen-hours per person annum. Thus the light consumption of people with access
to electricity is more than 500 times more compared to people without access to
electricity. Even within the electrified places, there exist large variations in the
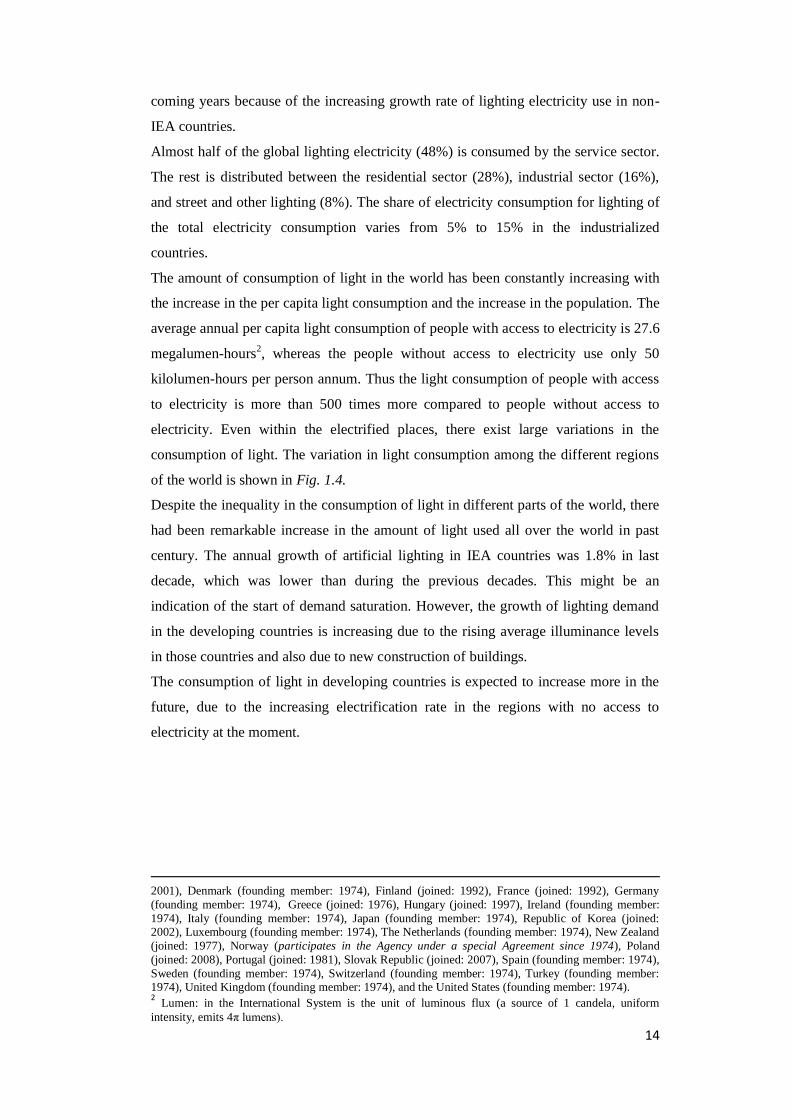
consumption of light. The variation in light consumption among the different regions
of the world is shown in Fig. 1.4.
Despite the inequality in the consumption of light in different parts of the world, there
had been remarkable increase in the amount of light used all over the world in past
century. The annual growth of artificial lighting in IEA countries was 1.8% in last
decade, which was lower than during the previous decades. This might be an
indication of the start of demand saturation. However, the growth of lighting demand
in the developing countries is increasing due to the rising average illuminance levels
in those countries and also due to new construction of buildings.
The consumption of light in developing countries is expected to increase more in the
future, due to the increasing electrification rate in the regions with no access to
electricity at the moment.
2001), Denmark (founding member: 1974), Finland (joined: 1992), France (joined: 1992), Germany
(founding member: 1974), Greece (joined: 1976), Hungary (joined: 1997), Ireland (founding member:
1974), Italy (founding member: 1974), Japan (founding member: 1974), Republic of Korea (joined: 2002), Luxembourg (founding member: 1974), The Netherlands (founding member: 1974), New Zealand
(joined: 1977), Norway (participates in the Agency under a special Agreement since 1974), Poland
(joined: 2008), Portugal (joined: 1981), Slovak Republic (joined: 2007), Spain (founding member: 1974),
Sweden (founding member: 1974), Switzerland (founding member: 1974), Turkey (founding member: 1974), United Kingdom (founding member: 1974), and the United States (founding member: 1974). 2 Lumen: in the International System is the unit of luminous flux (a source of 1 candela, uniform
intensity, emits 4π lumens).
15
Fig.1.4 Estimated per capita consumption of electric light (IEA 2006)
1.4 European energy efficient policy: Plan 2011
Energy efficiency is at the heart of the EU’s Europe 2020 Strategy for smart,
sustainable and inclusive growth and of the transition to a resource efficient economy.
Energy efficiency is one of the most cost effective ways to enhance security of energy
supply, and to reduce emissions of greenhouses gases and other pollutants. In many
ways, energy efficiency can be seen as Europe’s biggest energy resource. This is why
the Union has set itself a target for 2020 of saving 20% of its primary energy
consumption compared to projections, and why this objective was identified in the
Commission’s Communication on Energy 2020 as a key step towards achieving our
long-term energy and climate goals.
Substantial steps have been taken towards this objective, notably in the appliances and
buildings markets. Nonetheless, recent Commission estimates suggest that the EU is
on course to achieve only half of the 20% objective. The EU needs to act now to get
on track to achieve its target. Responding to the call of the European Council of 4
February 2011 to take determined action to tap the considerable potential for higher
energy savings of buildings, transport and products and processes, the Commission
has therefore developed this comprehensive new Energy Efficiency Plan.
The plan focused on instruments to trigger the renovation process in public and private
buildings and to improve the energy performance of the components and appliances
used in them. It promotes the exemplary role of the public sector, proposing to
accelerate the refurbishment rate of public building through a binding target, and to

16
introduce energy efficiency criteria in public spending. It also foresees obligations for
utilities to enable their customers to cut their energy consumption.
This plan builds on the contributions of the European Parliament, notably the recent
own-initiative report on energy efficiency, of many stakeholders, and on experience
gained with the 2006 Energy Efficiency Action Plan. The Commission estimates that
the measures already in place, combined with those newly presented in this plan,
should ensure the full achievement of the 20% target. The leading principle of this
plan is to propose stringent binding measures without binding national targets.
The Union’s success in implementing this plan will depend on close cooperation
between the EU institutions, Member States and all relevant stakeholders. The
Commission counts on the involvement and commitment of all parties concerned in
this ambitious endeavour.
Aiming at these European energy efficiency goals, this work thesis concentrated on
building’s efficiency target.
1.5 The Technical Building Code (Código Tecnico de la Edificación)
By referring to the previous European targets but with a look at the normative, it is
appropriate to introduce here a description of the Spanish Technical Building Code or
TBC (only the third part of the whole code, that deals with efficient energy of lighting
installations), which explains how to operate for achieving some work thesis
objectives. A few aspects of this Code were considered to develop the lighting
analysis of the Industrial department of University of Vigo, Galicia, Spain.
The Spanish TBC promotes innovation and technological development, so it has
adopted the most modern approach to building norms: Performance-Based Codes or
objectives.
The use of these new regulations based on performance calls for the configuration of a
more flexible environment, easily updated in accordance with the development of
techniques and the demands of society, and based on the experience of traditional
norms.
Spanish society increasingly demands building quality, which means satisfying certain
basic requirements with respect to both safety and aspects linked to human welfare.
The TBC is intended as a structured normative framework and seeks to facilitate their
application and fulfilment, in harmony with European regulations.
European regulations will be regarded as basic documents whose consideration will be
mandatory in drawing up the TBC.

17
1.5.1 Efficient energy of lighting installations
This third part of the Spanish TBC describes the guidelines to gain the efficient energy
of lighting installations. In this present work, we will consider only few sections of
this Spanish normative, the remaining parts not be addressed into this work thesis.
Scope
1) This section regards the interior lighting installations into:
a. new buildings;
b. restoration of existing buildings;
c. rehabilitation of commercial and administrative buildings for
refurbishing lighting installation.
2) Are excluded from the scope:
a. buildings and monuments with historical or architectural recognized
value, when complying the requirements of this part could
unacceptably alter their character or appearance;
b. temporary buildings with a planned time of use not exceeding two
years;
c. industrial sites, workshops and non-residential agricultural buildings;
d. separate buildings with a total useful floor area of less than 50 m2;
e. interior parts of residential buildings.
3) Where excluded in the previous list, the project will justify the solutions
adapted;
4) Emergency lighting is excluded to this scope

18
Verification procedure
For the purposes of this section, we should follow the sequence of checks that are
exposed as follows:
1) calculate the value of energy efficiency of the installation VEEI in each area,
by paying attention that it does not exceed the limit values given in Tab.1.1;
Tab.1.1 Limit values of VEEI (red sign is the limit value for this work thesis)
2) check the existence of a control system and, where appropriate, optimize the
control of the daylight use;
3) check the existence of a maintenance plan.
VEEI: value of the energy efficiency of the installation
1) The efficient energy of a lighting installation of an area is determined by the
value of the energy efficiency of the installation per 100 lux, using the
following expression:

19
Where
P is the power lamp over the auxiliary circuit [W]
S is the illuminated surface [m2]
Em is the average maintained illuminance [lux]
2) In order to establish the corresponding limit values of energy efficiency,
lighting installations will be attributed to one of the two following groups
(they compare in Tab1.1):
a. Group 1: areas of no representation or spaces in which the design
criteria, the image or comfort you want to convey to the user with
lighting, is relegated to a back seat to other criteria such as the level of
illumination, visual comfort, safety and energy efficiency.
b. Group 2: zones of representation or spaces where design criteria or
comfort you want to convey to the user with lighting, are dominant
compared to energy efficiency criteria.
Control and regulations systems
Lighting installations shall have, for each zone, a control and regulation system
satisfying the following conditions:
1) every area will have at least one on/off manually controlled system, when
there is no other control system. Sporadic use zones will have an on/off
control system for presence detection or a timing system;
2) will be install systems that use daylight and regulate the light level depending
on the amount of daylight, only in the following case:
a. in the areas of Group 1 and Group 2 of Tab1.1 that have glass walls to
the outside, when they meet all of the following conditions:
i. the angle θ from the middle point of the glass to the building
obstacle peak, measured in degrees, exceeds 65° (θ > 65);
ii. the following inequality holds: T (AW/A) > 0.11

20
where
T is the light transmission coefficient of the glass of the
window
AW is the glazed area of the window [m2]
A is the total considered area with the windows [m2] ???
Fig.1.5 Situation with obstructing building and daylight harvesting
Now, the present project can continue to analyse the different common zones along
the following guidelines:
- the common zones introduced in this work project could be modified, so the
scope is refurbish any building zones;
- the value of energy efficiency of the installation VEEI is 4.5, because the
common zones considered belong to Group 1 of Tab1.1;
- there are on/off manually controlled systems;
- the expression T (AW/A) > 0.11 is verified, because the light transmission
coefficient of the glass of the window T is 0.90, AW is 92.8 m2 and A is 237.6
m2.
21
Chapter 2
Artificial Lighting and Daylight
Artificial lighting is being used more and more in the world. The usage is quite non-
homogeneous. In developing countries, we can still find a widespread use of fuel based
lighting but nowadays the situation is changing and the demand for electric based lighting is
growing. Electric lighting consumes about 19% of the world total electricity use. So, we
should remember and consider that the improvement in energy efficient lighting will also be
helpful for the progress in developing countries. Every change in technologies, in customers’
consumption behaviour, even in lifestyle, has influences on global energy consumption and
indirectly, on environment. Therefore, energy saving in lighting, and the methods of
achieving this goal should be considered at different levels (state, region, town, enterprise)
and by supranational organisations, too.
People stay in indoor environment for most of the day. Characteristics of light in indoor
environment are much different than that of natural outdoor environment. On the other
people do not stop activities after sunset. The artificial lighting has therefore impact on their
well-being. The needed artificial light has to be provided in energy efficient and
environmentally conscious way. It is important to search for the technological solutions

22
which meet human needs with the lowest impact on the environment during operation, when
most of the impacts take place. The environmental impacts also include production and
disposal of lamps, and related materials.
Artificial lighting is based on systems: lamps, ballasts, starters, luminaires and controls.
Ballasts are needed for discharge lamps to connect the lamp to the mains. Lamps, ballasts
and starters are mounted in the luminaire with the wiring and lamp bases, reflectors
distribute and redirect the light emitted from the lamp and louvers shield the user from glare.
Control systems interact with the building where they are installed. This means that the
spider net of interactions and impacts is related with the architecture of the building (shape,
space orientation, etc. have influence for daylight contribution), with the supply network and
with the different equipment installed, e.g. the heating, ventilation, cooling or electronic
devices. Last, but not least, lighting systems are made for human beings who have individual
needs and behaviours. User habits can be supported by automatic controls (for example,
occupancy sensors), but the user habits cannot be overridden, and here education plays a
major role. First of all, the perfect lighting system offering the best solution for every
application does not exist. Every technology, including the more innovative and trendy ones,
has its own limitations and its full potential is mainly related to specific application field.
Furthermore, the best lamp, if used with poor or incompatible luminaire or ballast, loses
most of its advantages. Combining good lamp, ballast and luminaire in a wrong installation
may not meet the user needs or provide lighting service in an inefficient way. Combination
of a good lighting system in a well-designed installation takes strong advantage from control
devices, to drive the lighting system according to, for instance, on daylight availability and
occupancy. In the case of new buildings the integration of daylight is important in order to
reduce the energy consumption.
To summarize, energy savings/efficiency and economics are dependent on:
- Improvement of lighting technologies
- Making better use of available cost-effective and energy efficient lighting
technologies
- Lighting design (identify needs, avoid misuses, proper interaction of technologies,
automatic controls, daylight integration)
- Building design (daylight integration and architecture)
- Knowledge dissemination to final users
- Knowledge dissemination to operators (designers, sellers, decision makers)

23
- Reduction of resources by recycling and proper disposal, size reduction, using less
aluminium, mercury, etc.
- Life-Cycle Cost Assessment LCCA1
2.1 Fluorescent lamps installation
A fluorescent lamp is a low-pressure gas discharge light source, in which light is produced
predominately by fluorescent powders activated by ultraviolet radiation generated by
discharge in mercury. The lamp, usually in the form of a long tubular bulb with an electrode
at each end, contains mercury vapour at low pressure with a small amount of inert gas for
starting. The majority of the emission (95%) takes place in the ultraviolet (UV) region and
the wavelengths of the main emission peaks 254 nm and 185 nm. Hence, the UV radiation is
converted into light by a phosphor layer on the inside of the tube. Since one UV-photon
generates only one visible photon, 65% of the initial photon energy is lost as dissipation heat.
On the other hand, the final spectral distribution of emitted light can be varied by different
combination of phosphors. Correlated colour temperatures vary from 2700 K (warm white)
and 6500 K (daylight) up to 17000 K and colour rendering indices from 50 to 95 are
available. The luminous efficacy of the latest T5 fluorescent lamp is up to 100 lm/W
(without ballast losses). Dimming is possible down to 1% of the normal luminous flux, and
with special high voltage pulse circuits down to 0.01%.
Fig. 2.1 Operation principle of a fluorescent lamp
1 Life-cycle cost analysis (LCCA) is a method for assessing the total cost of facility ownership. It takes into
account all costs of acquiring, owning, and disposing of a building or building system. LCCA is especially useful
when project alternatives that fulfil the same performance requirements, but differ with respect to initial costs and operating costs, have to be compared in order to select the one that maximizes net savings.

24
Fluorescent lamps display negative voltage-current characteristics, requiring a device to limit
the lamp current. Otherwise the ever-increasing current would destroy the lamp. Pure
magnetic (inductive) ballast needs an additional starting element such as a glow switch.
Electronic control gear incorporates all the equipment necessary for starting and operating a
fluorescent lamp. Compared to conventional magnetic ballasts which operate lamps at a line
frequency of 50 Hz (or 60 Hz), electronic ballasts generate high frequency currents, most
commonly in the range of 25-50kHz. High frequency operation reduces the ballast losses and
also makes the discharge itself more effective. Other advantages of the electronic ballasts are
that the light is flicker-free and there is the opportunity of using dimming devices.
Advantages of fluorescent lamps:
- inexpensive
- good luminous efficacy
- long lamp life, 10000 – 16000 h
- large variety of correlated colour temperatures and colour rendering indices
Disadvantages of fluorescent lamps
- ambient temperature affects the switch-on and light output
- need of auxiliary ballast and starter2 or electronic ballast
3
- light output depreciates with age
- contain mercury
- short burning cycles shorten lamp life
The linear fluorescent lamps have enhanced their performance and efficacy with time. From
the old, bulky T12, passing through T8, to the present T5 lamps not only the diameter is
reduced. The T5 has a very good luminous efficacy (100 lm/W), the same lamp surface
luminance for different lamp powers (some lamps), and optimal operating point at higher
ambient temperature. T5 lamps are shorter than the correspondent T8 lamps, and they need
electronic ballasts. Dedicated luminaries for T5 lamps may reach a better light output ratio,
2 When voltage is applied to the fluorescent lamp, the starter (which is timed switch) allows current to flow through the
filaments at the ends of the tube. The current causes the starter’s contacts to heat up and open, thus interrupting the flow of
current. 3 Ballast providing a controlled current to the lamps is an essential component of any discharge lighting system.

25
as the lamp diameter is smaller thus allowing the light to be redirected in a more effective
way.
Fig. 2.2 Comparison of tube diameter of different fluorescent lamps
The performance of a fluorescent lamp is sensitive to the ambient temperature. T5 lamps
perform best at the ambient temperature of 35°C, and T8 lamps at 25°C. A temperature of
35°C inside the luminaire is more realistic for indoor installations. There are also amalgam
lamps whose performance varies less with the temperature.
This kind of lamps are ideal for general lighting in most working places (including shops,
hospitals, open spaces, etc.), but also in some residential applications. In our study case those
lamps are commonly used into scholastic environments.
Other tips could be the following: – the choice of the lamp is always related to the
application. Always consider the correlated colour temperature and the colour rendering
index. – By using lamps of different correlated colour temperature in the same luminaire and
proper dimming, it is possible to have dynamic light, where the colour is selected by the
user. – As some T5 lamp types have the same luminance for different powers, it is very easy
to build “continuous lines”, like our analysed work thesis.
2.2 Energy aspects of luminaires
A luminaire is a device forming a complete lighting unit, which comprises of a light source
and electric operating devices (transformer, ballast, etc.). It also includes the parts for
positioning and protecting the lamp/s (casing, holder, wiring), and connecting the lamp/s to
the power supply, and the parts for distributing the light (optics). The function of luminaire
(if not a pure decorative fitment) is to direct light to desired locations, creating the required
visual environment without causing glare or discomfort. Choosing luminaires that efficiently
provide appropriate luminance patterns for the application is an important part of energy
efficient lighting design.

26
The luminaire is an important part of the electricity-luminance-chain (lamp including ballast,
luminaire, and room). It is decisive for the energy efficiency of the lighting installation. The
energy efficiency of a luminaire is characterized by the light output ratio, which is given by
the ratio between the total luminous flux of the lamp when installed on the luminaire and the
lamps alone.
The efficiency of a luminaire depends mainly on the lamp type, control gear and optical
components (defining the optical efficiency). The new generation of linear fluorescent
lamps, the T5 (diameter 16 mm), together with high frequency ballasts, allows us to increase
energy efficiency and decrease the costs at the same time, compared to the old magnetic
ballasts and T12 and T8 technologies. New generations of lamp of compact fluorescent
lamps, high-pressure sodium, metal halide and “infra-red coating” incandescent lamp types,
have been introduced. Together with the appropriate luminaire technology and lighting
controls they can reduce energy consumption of lighting significantly.
Fig. 2.3 Historical development of linear lamp luminaires regarding energy consumption

27
2.3 Daylight in interiors
Until 1950’s, buildings were designed to allow natural light reach virtually all parts of the
building interior. With fluorescent lamp development and cheap energy, taller deeper plan
buildings grew in popularity particularly in city centres where land was extremely expensive.
In addition, air and noise pollution made it necessary to keep windows closed and provide air
conditioning. The energy crisis of the 1970’s made designers think again. In the 1990’s
public awareness of environmental issues has made engineers even more aware of the
importance of conserving energy.
Sick Building Syndrome (SBS) was another factor which moved designers away from wholly
artificial indoor environments. Daylight deprivation is a significant factor in people’s
dissatisfaction with buildings and hence SBS. Research shows that people value the variety
of daylight, enjoy the presence of sunlight in a building and want some view of the outside
world. Buildings of the 21th century are likely to rely more on natural daylight, with
supplementary artificial lighting being automatically controlled but with local override
facilities provided for staff.
There are three reasons to provide daylight:
1. Healthier and more satisfactory indoor environment;
2. Economic advantage in energy savings;
3. Conserves earth’s resources and improve company’s “Green Image”.
2.3.1 Energy cost
The cost of energy for artificial lighting is a substantial part of the total energy for most
buildings. Typically, light energy would be between 20% and 50% of the total energy bill.
For example, when lighting levels are reduced, there is a reduction in the mechanical cooling
load for the building as well as the electrical load. In some cases, automatic control of
artificial lighting combined with good daylight penetration may even tilt the balance between
the need for air conditioning or natural ventilation for some buildings.
The substitution of daylight for artificial light can produce savings of 30% - 70% if artificial
light is well controlled. Care must be taken however, to shield occupants from direct effects

28
of sunlight by providing blinds or other shading devices which can be controlled by
occupants.
2.3.2 Control of artificial lighting
The ideal control system will modulate artificial light levels in each area with the level of
daylight. Dimming should operate very slowly in response to increasing daylight. In this way
transient variations in daylight are ignored and people working in the area will not notice the
artificial light level increase.
Automatic switching of lights as daylight levels increase is likely to be annoying to staff;
manual switching by staff in the area is acceptable however, because they feel they have
control. If artificial lighting reduced to 20% output when daylight levels are high then
occupants will have the impression that artificial lighting is “on” and they will not feel any
sense of deprivation. Exactly this sensation is one of the objectives that we wanted to
achieve for ensuring staff’s visual comfort.
Not only, the incorporation of daylight into interior lighting design is desirable for the
following reasons:
– energy costs are reduced if good control of artificial lighting is provided;
– a room or common places which does not provide a view of the outside where one could
have been reasonably expected, will be considered unsatisfactory to most building
occupants;
– colour rendering4 will be improved in most interiors with good daylight penetration. If
exact colour rendering is necessary however, account must be taken of the changing spectral
composition of daylight with time of day and change of season;
– the natural variation of daylights provides information about the weather and time of day
which occupants will deem desirable.
Modern lighting controls allow the simulation of external conditions in interiors where
daylight is excluded. Not only is illuminance varied with the time of day but so also is the
colour appearance of the lamps used. So I can think of some discharge lamps that have a
natural colour shift when dimmed and this effect is used to advantage in these schemes.
Nonetheless these artificial schemes are never as satisfactory to building occupants as a real
view of the outside.
4 Colour rendering (of a light source): the ability of the source to render colours accurately. “Good colour rendering” suggests
the source is rendering colours similar to the way daylight would.

29
2.3.3 Visual comfort
In order to be able to develop the visual comfort objective, let us look at what visual comfort
means when we analyse the buildings interiors.
There are a number of lighting-related factors that may cause visual discomfort and there is
no straight-forward path to follow in creating visually comfortable luminous environments.
The current indoor lighting recommendations give ranges of illuminance values for different
types of rooms and activities. In addition, guidelines on light distribution in a space, the
limitation of glare, and the light colour characteristics are given. Attention also needs to be
paid to the elimination of veiling reflections and to the formation of shadows in the space.
The recommendations and guidelines concern mainly the elimination of visual discomfort,
but lighting designer can add on that to provide visual comfort. Causes of visual discomfort
can be too little and too much light, too much variation in luminous distribution, too uniform
lighting, annoying glare, veiling reflections, too strong shadows, and flicker from light
sources.
Fig. 2.4 Examples of luminaires and windows that can induce visual discomfort
2.3.4 Psychological aspects of light
Lighting visual comfort can affect psychological aspects of building occupants because
people perceive their luminous environment through eyes, but they process this information
with their brain. Light scenes are therefore judged in connection with references and
expectations. The luminous environment can be appreciated in many ways e.g., more or less
agreeable, more or less attractive, more or less appropriate to the function of the space, more
or less highlighting the company image. Variations of luminances and colours can strengthen

30
attractiveness, trigger emotions, and affect our mood, the impact of lighting depending much
on the individuals and their state of mind. A lighting installation that does not meet the user’s
expectations can be considered unacceptable even if it provides the conditions for adequate
visual performance. Unacceptable lighting conditions may impact on task performance and
thus productivity through motivation.

31
Chapter 3
Measurements and energy analysis
People measure and analyse the energy performance of buildings for many reasons.
Comparisons of energy use may be made among nations, regions, individual buildings, or
systems within a building. Policy makers, owners, designers, operators, raters, and
researchers use energy performance data. Many tools (or approaches) have been developed
to analyse energy performance in different ways, at different levels of effort and precision,
and at different stages in the life of a building. Each tool quantifies the building energy
performance to fit the users’ needs. However, methods and metrics are often inconsistent
with each other.
In order to describe what had been done in the present work, we introduce the objectives that
had been followed for achieving, at the end, a lighting energy saving:
- View which is the daylight behaviour during the seasons, the days and the hours of
the day, considering the definition of solar radiation.
- Study the model layout with the software called DIALux.

32
- Analyse how much energy saving it is possible to obtain considering different
lighting control devices or systems.
- Comply the visual interior comfort of light for maintaining lighting normative
standards.1
All of these tasks were developed for one common zone, the corridor that appears in Fig.3.1,
but for the other two common zones, namely the halls of the school, no analysis was carried
on, due to the limited time available during Erasmus period.
3.1 Overview
It is important to remember that “daylight” is considered to be diffuse light provided by the
sky as a whole and not direct sunlight. The term “skylight” is often used instead of
“daylight”.
Daylight varies with latitude, season, coastal or inland location, climate and air quality. The
amount of daylight received within a building depends on its orientation, the presence of
obstructions and the reflectance of adjacent structures. For example, the area in a room to
which daylight will be considered to contribute significantly to task illuminance extends to
about twice the window height – provided glass is clear, there are no obstructions (inside or
outside) and the window sill is not significantly higher than the working plane.
In the case of the present work, the coordinates of the building, where the corridor of
“Escuela Técnica Superior de Ingenieros of Vigo” is located, are: -8.72° longitude and
42.23° latitude. An obstructing building is located in front of it and its orientation is
represented in the picture. Another parameter to be considered is the working plane; it’s the
floor; in fact, just the normative says that the working plane for common zones, like
corridors, entrance halls, and circulation areas, must be considered the floor.
1 EN 12464-1: Light and Lighting – Lighting of work places – Part 1: Indoor work places

33
Fig. 3.1 On the left, the orientation of corridor (interior view). On the right, a view of the obstructing
building (the arrow points to the corridor with external view)
Another consideration, in addition to the previous thoughts, is that daylight and artificial
light must not be considered separately to the other energy using aspects of a building
3.2 Global solar radiation analysis
Two components of solar radiation come to the Earth surface. One component comes
directly from the sun (direct solar radiation) and the other originates from dispersing of
direct solar radiation in the atmosphere (diffuse solar radiation). Global solar radiation
consists of direct and diffuse solar radiation.
The radiation that reflects from surroundings (so called albedo) is of importance for some
surfaces that are included under some angle to the horizontal surface. This radiation is
mainly diffuse and comes to the receiving surface under different angles. The intensity of the
reflected solar radiation depends on the surroundings that it is reflected from.

34
3.2.1 Direct solar radiation
The direct solar radiation represents a component of global solar radiation that comes
directly to the earth in a bright and clear day. For us, a clear day was when measured global
solar radiation was greater of the 80% of estimated direct solar radiation. The direction of the
direct radiation can be defined on every spot on the earth surface by geometric method. The
direct solar radiation is the dominant component of global solar radiation on clear days.
To define the intensity of the direct solar radiation that comes to the Earth surface, it was
used the following equation:
[W/m2]
The two parameters a and b, as explained below, fluctuate with a sinusoidal state, and they
don’t have any physical meaning, while A is the solar height.
The two coefficients a and b are calculated by means of the following formulas:
(
)
(
)
where the parameter d appearing in these and other subsequent equations is the day of the
year (1÷365).
The solar height A is evaluated by means of the following equation:
In this last formula two more parameters appear: the latitude φ (the value in Vigo is 42.23°)
and the time angle ω that is the angle between sun position at a specific hour of the day and
its position at midday, measured on its circle orbit. Specifically
,
where ts is the local solar hour (0:00 to 24:00).

35
Below, a sample diagram of direct and diffuse estimated solar radiation during 24 hours of
the day is reported. We report the estimated solar radiations because were applied the
formulas above.
Fig.3.2 Estimated solar radiations during the day
3.2.2 Diffuse solar radiation
In addition to the direct solar radiation, every surface receives part of solar radiation that
comes to it indirectly. It is called diffuse solar sky radiation. Even on a brightest day, with
minimal amount of water steam, about 8% of the whole energy of solar radiation that comes
to the earth originates from diffuse radiation. During cloudy days almost complete radiation
is diffuse and we called cloudy the day where the measured global solar radiation was lower
than the 130% of estimated diffuse solar radiation.
The intensity of the diffuse solar radiation is described by the following formula:
[W/m2]
The coefficient c is a statistic coefficient, without physical meaning, that takes into account
statistic measures of water vapour and pollution into atmosphere during the year. This
coefficient was taken from the table below and it was defined by ASHRAE Apl/82, p.57.2.

36
Tab.3.1 c parameter for calculating diffuse solar radiation
month Jan Feb Mar Apr May Jun Jul Aug Sep Oct Nov Dec
c 0.058 0.060 0.071 0.097 0.121 0.134 0.136 0.122 0.092 0.073 0.063 0.057
3.2.3 Results
At this point of the thesis, we could to be able to implement the previous formulas with an
Excel sheet, knowing that the considered period of time was from 1st April 2009 to 30
th April
2013. Hence, it was possible to calculate how much clear days, cloudy days and partially
cloudy days there were in each seasons in each year considered.
Since we wanted the number of these days divided on each season, we decided to compose:
- Spring composed by April, May and June;
- Summer composed by July, August and September;
- Autumn composed by October, November and December;
- Winter composed by January, February and March.
Tab.3.2 Number of the days on each season in the years 2009-2013
Type of the day
Seasons Months Clear Cloudy Partially cloudy
Winter
January 45 18 59
February 60 7 46
March 53 4 67
Spring
April 70 1 78
May 63 2 59
June 64 6 50
Summer
July 78 6 40
August 85 1 38
September 85 1 34
Autumn
October 69 9 46
November 43 10 65
December 31 26 66

37
It is evident that in Vigo more than 50% of the days are clear, a little bit more than 43% are
partially cloudy days and the remaining 6% are cloudy days. After this partial result, we
commented that there would have been a lighting energy saving due to the little use of
installed luminaires and the daylight harvesting.
Related to the solar radiation analysis, Fig.3.3 shows what happened when we considered the
period of time aforementioned, and so from 1st April 2009 to 30
th April 2013.
The estimated solar radiation was based on the data provided by the meteorological station
of Vigo.
Fig.3.3 Report of the global solar radiation

38
Based on this data, the present thesis focused its priority on the model layout of the corridor
and began to study it with light building software called DIALux.
3.3 Modelling simulation using DIALux
DIALux is a free and complete software developed for professional light planning and is
open to luminaires of all manufacturers. A software by planners for planners. Used by many
hundred thousands of light planners and designers worldwide.
This software allows you to create virtual worlds simply and intuitively, document results in
breath-taking and photorealistic visualizations. In addition delights you with daylight and
artificial light scenarios through which they can glide with wild camera runs.
While you plan creatively, DIALux determines the energy your light solution requires and
supports you in complying with the respective national and international regulations.
Fig.3.4 Modelling of internal view (left) and external view (right) of the corridor
Fig.3.4 evidences layout situation without none luminaire that are actually installed, while
the Fig.3.5 shows the model layout with actual installed luminaires.
Compared to Fig.3.1, the model layout is slightly different from the real picture taken and
this happens because it is impossible to design the external part of the eaves with DIALux.
Moreover, there was another design problem: the reflection coefficient of the obstructing
building. It had a very high value, due to white colour of its side-façade, and this led us to
wrong results if we didn’t take into account. For this reason, we modified the value of this
coefficient with the settings of DIALux, and we resolved the problem.

39
Fig.3.5 Corridor internal view with actual installed luminaires
The luminaire introduced in Fig.3.5 was Philips TCS460 2xTL5-14W HFP C8 (founded into
DIALux database). This kind of luminaire was very similar than those already installed in the
corridor. In fact, its main characteristics were the same, i.e. same source fluorescent power
(14W for each fluorescent tube), same number of fluorescent tubes (2 tubes in this case), and
same total source power (33W, also considering ballast, lamp and starter).
The total number of installed luminaires was 50 and this number had to be considered for
calculations of energy consumption.
After all these considerations, there were only two remaining aspects to take into account:
- how many hours the luminaires were to remain switched on during the typical day;
- what was the required illuminance (lux quantity) in this common zone of the school.
Therefore, the day-type, considered in this work project, was 8:00a.m. ÷ 9.30p.m, and we
had a time interval of luminaries that could be of 13.5 hours. Also, the required illuminance
was calculated every 3 hours, this means at 8:00a.m., at 11:00a.m., at 2:00p.m., at 5:00p.m.,
at 8:00p.m., at 9.30p.m. This decision of day-type was based on the typical working schedule
of the building, namely based on when people start to live into the school and when they
leave it.
Regarding the necessary required illuminance, the European Standard EN12464-1, described
in the Annex A, says that the standard value for common zones is 100 lux.

40
To verify that the model layout introduced with DIALux was acceptable, we took some
empirical measures using an illuminance meter2. The result was good because a tolerance of
10% between empirical measure and simulated value was verified.
3.4 Lighting energy consumption
Briefly, let us look at the impact of lighting energy consumption on the environment. The
environmental impacts of lighting are caused by the energy consumption of lighting, the
material used to produce lighting equipment, and the disposal of used equipment. Emissions
during the production of electricity and also as a result of the burning of fuel in vehicle
lighting and in fuel-based lighting are responsible for most of the lighting-related greenhouse
gas emissions. Hazardous materials (e.g. lead, mercury, etc.) used in the lamps and ballasts,
if not disposed properly, can cause harmful impacts on the environment. Lighting also
affects the environment due to wastefully escaped light into the night sky (light pollution).
The environmental impacts of electric lighting depend on the electricity generation method.
Thermal power generation system has the highest impact on the environment due to
combustion fuel, gas emissions, solid waste production, water consumption, and thermal
pollution. Electricity generated from renewable energy sources has the lowest effect on the
environment. Lighting is one of the biggest causes of energy-related greenhouse gas
emissions. Energy efficient lighting reduces the lighting energy consumption and is thus a
means to reduce CO2 emissions. Replacing fuel based lighting with energy efficient electric
lighting will provide means to reduce greenhouse gas emissions associated with lighting
energy consumption.
3.4.1 Results
To obtain lighting energy saving, it was taken into account that the installed luminaires were
divided into 3 sectors (16 luminaires for each sector), and so there was the possibility to
control each sector. Thus we proceeded in this way, and for each clear, cloudy and partially
cloudy day of each season, we calculated the necessary hours of artificial lighting, according
to the required standard illuminance. For example, it could be necessary to switch on 1 or 2
sectors, and this depending on the daylight, the season and the hour of the day.
2 Illuminance meter YOKOGAWA model 51002 – Measuring ranges: 0.00-9.99/99.9/999/9 990/99 990/999 000 lux – Power
supply: 9 V dry cell battery 6F22 (S-0068)/6LR61 or an AC adaptor (optional)

41
Tab.3.1 Artificial lighting hours in different seasons
Spring Summer Autumn Winter
Artificial lighting hours
Brightly day 4.5 3 4.5 7.5
Cloudy day 7.5 4.5 7.5 13.5
Partial cloudy
day 4.5 3 4.5 10.5
At this point, we noted that any energy-savings measures adopted to obtain a good lighting
energy saving, in this common zone, would have to comply with Tab.3.1, and so observing
those work hours of artificial lighting. Under these working conditions, we could observe
which cost energy saving we would have.
3.4.2 Electricity costs
Also the cost of electric energy is accounted for in lighting energy saving discussion.
We remark that the final energy price includes both the real electricity cost and all the
governmental fees. In this analysis, we considered only electric energy cost and the figure
below represents the electricity cost in Spain, divided in hour sections, where each hour
section depends on the different energy consumption during the day.
Fig.3.6 Hour sections in Spain (Font: www.iberdrola.es)

42
Now, considering the real electricity cost of the Spanish electric company Iberdrola, one can
see the different electricity cost for hour sections.
The voltage supply of the school is 20kV (T represents the voltage) and so it was considered
the first line of the table in Fig.3.6. Moreover, Te is the electric energy cost by electric power
consumption of the installed luminaires.
Fig.3.7 Electricity costs for each hour section (called in spanish “periodo”) (Font:
www.iberdrola.es)
A more specification had to be made: we considered 3 cases of possible lighting energy:
- standard day: 50 luminaires switch on for 13.5 hours during any day
- winter day: 1 or 2 sectors of luminaires switch on based on Tab.3.1
- no-winter day: 1, 2 or no sector of luminaires switch on based on Tab.3.1
Finally, we obtained the following table:
Tab.3.2 Electricity energy cost
Standard day Winter day No-winter day
1094.43€ 485.03€ 244.82€
Once we arrived at this analysis point, it is seen how, inserting a few energy-saving
measures, it is been possible to achieve a fair lighting energy saving.
Looking at the obtained results, we can say that:
- in case of winter day we have an energy saving of +55.7%;
- in case of no-winter day we have an energy saving of +77.6%,
with respect to the case of standard day.

43
Chapter 4
Lighting control systems
Due to the increase of environmental concerns, lighting control systems will play an
important role in the reduction of energy consumption of the lighting, without impeding
comfort goals. As mentioned in the IEA Annex 31 (IEA 2001), energy is the single most
important parameter to consider when assessing the impacts of technical systems in the
environment. Energy related emissions are responsible for approximately 80% of air
emissions, and central to the most serious global environment impacts and hazards, including
climate change, acid deposition, smog and particulates. Lighting is often the largest electrical
load in offices, but the cost of lighting energy consumption remains low when compared to
the personnel costs. Thus its energy saving potential is often neglected.
The human requirements and the quality of the working environment are often expressed in
terms of thermal and visual comfort. The optimal conditions of thermal comfort can be easily
described as the neutral perception of the interior environment, where occupants do not feel
the need for change towards warmer or colder conditions. Visual comfort, however, is not
described easily. Rather than referring to a state of neutral perception of the interior
environment, it is perceived as receiving a message. Aspects such as daylighting, glare,

44
luminance ratios, intensity and contact to the outside have their influences on our perception
of visual comfort.
To fulfil the requirements about comfort and energy efficiency, building managers have
implemented programs to reduce lighting energy requirements by installing more efficient
light sources and luminaires. However, this is not sufficient. Lighting energy management
has to provide the optimal lighting level for the tasks being performed using the most
efficient light source suitable for the application, and providing light only when and where it
is needed. This can be achieved by using lighting control strategies and lighting control
system. The main purpose of these systems is to reduce energy consumption while providing
a productive visual environment.
This includes:
- providing the right amount of light
- providing that light where it’s needed
- providing that light when it’s needed
4.1 Solutions for lighting controls
Various lighting control strategies have been developed, based on time scheduling, load
shedding, occupancy sensing and light level tuning.
The main solutions for lighting controls can be divided into four categories:
a) Light level tuning: generates energy savings by reducing the electric lighting level
away from the recommended standard according to occupants’ lighting preferences.
Depending on the application and on the lighting system design dimming can be
continuous from full power to off or low level, or discrete levels can be provided.
This system allows occupants to choose their preferred light levels, so individual
control is fundamental toward the efficacy of this strategy on total energy savings;
b) Occupancy sensing: widely implemented in different lighting systems, occupancy
sensing turns off lights when a zone is vacated. Different sensors are available in the
market, and recent developments have seen the usage of ultrasonic sensor constantly
detecting presence without the risk of switching off lights due to occupants lack of
movements;
c) Time switching: toggles or dims the lights according to a predefined schedule, and is
usually implemented on building energy management systems and lighting

45
automation panels. This control strategy is good for premises with fixed business
hours such as libraries, retail stores, museums, etc., but in this work thesis it could be
an acceptable solution that I will speak about in the next paragraph.
d) Load shedding: it’s a strategy to reduce consumption during peak loads, which is
usually implemented in short times of the days and so doesn’t have a substantial
influence on the overall energy consumption.
Fig.4.1, taken form a 2008 analysis about different lighting control strategies energy savings
potential and their market implementation, gives an overview for the different systems listed
above.
Fig.4.1 Lighting control strategies saving potential and market implementations
Seeing that the present work focused on a not very invasive change, we went to look at
different lighting control devices present in the electric marketing, and we decided to begin
with that based on time switching strategy; then, continuing with the other one, based on
occupancy sensing strategy.

46
4.2 Light control devices
4.2.1 Light intensity switches Noark Ex9LD
Noark Ex9LD is used for light switching according to actual daylight intensity (this device
also according to time of day), so the light fixtures are switched on only if necessary and this
can save money for consumed energy. Digital version can work with photoelectric and time
of day switch on 2 channels included into wiring diagram. This time switch can
automatically change between summer and winter time. It operates in weekly switching
program and can be connect to light control systems with other devices. As a matter of fact,
if one wants to achieve a more daylight in the corridor an external brightness sensor is
required.
Fig.4.2 Light intensity switch Noark Ex9LD
The main technical characteristics are
- Adjustable switching delay: 0 to 100 sec.
- Light adjustment range: 2-500 lux
- Up to 10 devices can be combined in one light control system with only one
brightness sensor
- Weekly program of integrated time switch

47
Below, we find the table with electrical parameters needed if, for a future installation, we
wanted to install the device.
Tab.4.1 Electrical parameters of Noark Ex9LD
4.2.2 Digital time switch (time and light control) Theben TR 644
This is another device that can be used to implement the time switching solution, and even
more, it has the possibility to set position data via coordinates or country/city for automatic
calculation of sunrise and sunset times for the whole year. In addition, it simulates various
astronomical options (e.g. evening ON – morning OFF or evening OFF – morning ON).

48
Fig.4.4 Digital time switch (time and light control) Theben TR 644
Datasheet report that it can work with different lamp types but, in the present work thesis, it
works only for half of installed luminaires, and hence two devices were necessary.
Fig.4.5 Technical data Theben TR 644
49
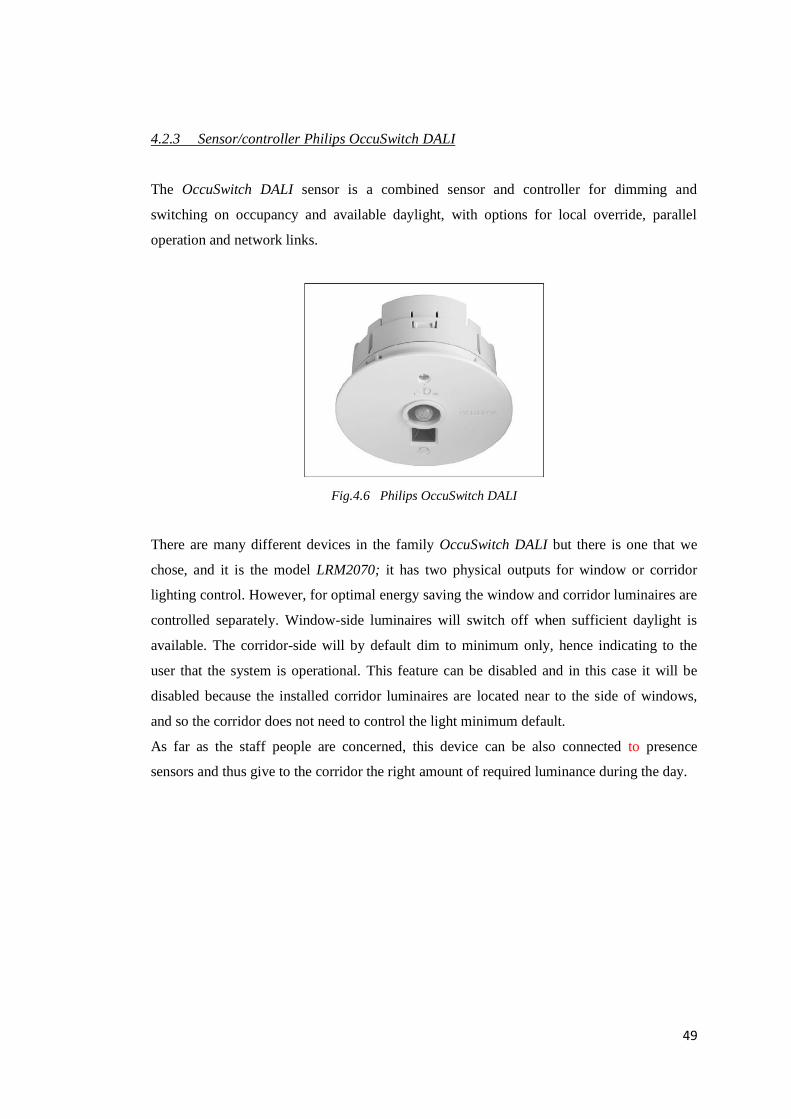
4.2.3 Sensor/controller Philips OccuSwitch DALI
The OccuSwitch DALI sensor is a combined sensor and controller for dimming and
switching on occupancy and available daylight, with options for local override, parallel
operation and network links.
Fig.4.6 Philips OccuSwitch DALI
There are many different devices in the family OccuSwitch DALI but there is one that we
chose, and it is the model LRM2070; it has two physical outputs for window or corridor
lighting control. However, for optimal energy saving the window and corridor luminaires are
controlled separately. Window-side luminaires will switch off when sufficient daylight is
available. The corridor-side will by default dim to minimum only, hence indicating to the
user that the system is operational. This feature can be disabled and in this case it will be
disabled because the installed corridor luminaires are located near to the side of windows,
and so the corridor does not need to control the light minimum default.
As far as the staff people are concerned, this device can be also connected to presence
sensors and thus give to the corridor the right amount of required luminance during the day.

50
Fig.4.7 Technical data of OccuSwitch DALI

51
4.3 Conclusions
The present work showed how energy saving can be obtained through simple steps of
lighting analysis and by paying more attention to the original building designs. Hence,
through these easy steps, we could apply the European standards (EN 12464-1) and the local
Spanish standards (TBC) for realize a good energy saving for the school.
Nonetheless, the work thesis was carried out with very attention at each step that we faced
because it was important for achieving good results.
In addition, the high percentages of lighting energy saving, obtained in the chapter 3, showed
how the inclusion of some lighting control devices have saved a substantial quantity of
money. For example, with a part of this saved money, you could just invest to buy these own
devices and start with a real lighting energy saving.
Finally, we, of course, have achieved our work thesis objectives:
- Have maintained the visual comfort in the right periods (seasons) of the year
- Have obtained a good saving lighting energy with correct criteria
- Have ensured a good daylight harvesting through existed building layout
- Have introduced only a few changes in the electrical control system of existed
luminaires.

52

53
BIBLIOGRAPHY
“Guidebook on energy efficient electric lighting for building”, L.Halonen, E.Tetri &
P.Bhusal, Aalto University, Espoo 2010.
Available from http://www.ecbcs.org/annexes/annex45.htm
“Technical Building Code – 3rd
part: Efficient energy of lighting installations”, Government
of Spain, april 2009.
Available from http://www.codigotecnico.org
“EN 12464-1: Light and Lighting – Lighting of work places – Part 1: Indoor work places”,
European Standard, november 2002.
“La Energía en España 2011”, Ministerio de Industria, Energía y Turismo, 2011
Available from www.minetur.es
European Commission, “Energy Efficiency Plan 2011”, Communication from the
Commission to the European Parliament, the Council, the European economic and social
Committee and the Committee of the Regions, march 2011.
Jasmina Radosavljević, Amelija Đorđević, “Defining of the intensity of solar radiation on
horizontal and oblique surfaces on Earth”, Working and Living Environmental Protection,
vol. 2, pp. 77-86, 2001.
“Interior Lighting Design – A student’s Guide”, K.Kelly, K.O’Connell, M.A. B.Sc.(Eng)
C.Eng. MCIBSE. MIEI, 1994.
Available from http://eleceng.dit.ie
R.Perez, R.Seals, J.Michalsky, “Modeling Skylight Angular Lumincance Distribution from
Routine Irradiance Measurements”, Journal of the Illuminating Engineering Society, winter
1993.
D.Manuel Martin Monroy, “Comportamento Térmico de cerramientos soleados”, Tesis
doctoral, Las Palmas de Gran Canaria, pp. 101-111, november 1995.
“OccuSwitch DALI sensor/controller Datasheet”, Philips Industries
Available from http://www.philips.co.uk, 2013
“Noark Ex9LD Technical Data”, Noark Electric Europe
Available from http://www.noark-electric.eu/, 2013