esd.36j system & project management - … path method/pert critical path 0 c,20 20 20 e,20 f,40...
TRANSCRIPT

ESD.36J System & Project Management
Dynamics of Project Performance+
-
Strategic Issues in Project Preparation and Planning
SD Class Five (10/7/03)
Copyright © 2003 James M. Lyneis

+
- Topics
�Homework Review and Module One Wrapup
�Project Management – A “Strategic” View
�Managing Project Dynamics -Project Preparation and Planning
Copyright © 2003 10/7/03 - ESD.36J SPM James M. Lyneis 2

+
- Topics
�Homework Review and Module One Wrapup
�Project Management – A “Strategic” View
�Managing Project Dynamics -Project Preparation and Planning
Copyright © 2003 10/7/03 - ESD.36J SPM James M. Lyneis 3

+
-Homework Assignments
� HW1: Network Planning Techniques � HW2: Task based DSM � HW3: Design a Project Organization � HW4: SD – verify Brook’s law � HW5: Case study comparison � HW6: SD – project adapation
Discuss MasterSolution
Copyright © 2003 10/7/03 - ESD.36J SPM James M. Lyneis 4

+
-HW1 Solution
UAV Project
Reducing Critical Path [Kerzner]: • Transferring resources to critical paths • Elimination of some parts of the project • Addition of more resources • Substitution of less time-consuming tasks • Parallelization of activities • Shortening critical path activities • Shortening early activities • Shortening longest activities • Shortening easiest activities • Shortening activities least costly to speed up • Increasing the number of work hours per day
(EF) June 4, 2008 Copyright © 2003
10/7/03 - ESD.36J SPM James M. Lyneis 5

+
-HW1 Solution (cont.)
�
�
(EF) June 6, 2008
GFEengine Setting target dates for suppliers: � GFE Æ day 29 � Engine Æ day 44 (51)
Probability of finishing by day 100 � TE(m)=20, TV(m)=4 � TE(n)=25, TV(n)=25 � z=(100-110)/sqrt(29)=-1.86 � Probability 3.1%
Copyright © 2003 10/7/03 - ESD.36J SPM James M. Lyneis 6

+
-HW2 Solution
DSM
Items 1 2 3 4 5 6 7 8 9 10 11 12 13 1! Requirement definition
1 l
b 2! Engine specification 1 c 1 3! Vehicle layout 1 d 1 4! GFE interface 1 e 1 5! Fuselage design 1 1 1 f 1 6! Wing design 1 g 1 7! Avionics design 1 1 h 1 8! Empennage design 1 i 9! Engine delivery 1 j 10! Vehicle integration 1 1 1 k 11! GFE delivery 1 12! Ground testing 1 m 13! Flight testing 1 n
Artifact of sequencingDesign processFeedback additions
Copyright © 2003 10/7/03 - ESD.36J SPM James M. Lyneis 7

-10/7/03 8
+
-
© 2003
HW2 Solution (cont.) B C D E F G H I J K L M N
B C D E F G H I J K L M N
ESD.36J SPM Copyright James M. Lyneis

+
-HW2 Solution (cont.)
Airframe EquipmentDesign Installation
Items 1! Requirement definition
3! Vehicle layout
5! Fuselage design 8! Empennage design Unplanned 6! Wing design Iterations 4! GFE interface 7! Avionics design 2! Engine specification
9! Engine delivery 11! GFE delivery 10! Vehicle integration 12! Ground testing 13! Flight testing
1 2 3 4 5 6 7 8 9 11 11 12 13 b
1 d 1
1 f 1 1 1 1 i 1
1 g 1
1 e 1 1 h 1
1 c 1
1 j 1 l
1 1 1 1 k 1 1 1 m
1 1 1 n
Integration and Test
Planned Iterations
Copyright © 2003 10/7/03 - ESD.36J SPM James M. Lyneis 9

+
-
Wrapup Discussion for Module 1(Methods and Tools)
Copyright © 200310/7/03 - ESD.36J SPM James M. Lyneis 10

+
-Critical Path Method/PERT
critical path
0 C,20 20 20 E,20 F,40
40 40 80 Finish
S=0 A,0 0
Start
G,20 80
H,0 100 100 F=100
0 B,10 10 20 D,30 50
Copyright © 2003 10/7/03 - ESD.36J SPM James M. Lyneis 11

+
-What is CPM useful for?
Copyright © 2003 10/7/03 - ESD.36J SPM James M. Lyneis 12

123456789
101112131415161718192021222324252627282930313233343536373839404142434445464748495051525354555657585960
+
-Design Structure Matrix
1 2 3 4 5 6 7 8 9 10 11 12 13 14 15 16 17 18 19 20 21 22 23 24 25 26 27 28 29 30 31 32 33 34 35 36 37 38 39 40 41 42 43 44 45 46 47 48 49 50 51 52 53 54 55 56 57 58 59 60 Set customer target Estimate sales volumes Establish pricing directionSchedule project timelineDevelopment methodsMacro targets/constraintsFinancial analysisDevelop program mapCreate initial QFD matrixSet technical requirementsWrite customer specificationHigh-level modelingWrite target specificationDevelop test planDevelop validation planBuild base prototypeFunctional modelingDevelop product modules Lay out integrationIntegration modelingRandom testingDevelop test parametersFinalize schematicsValidation simulation Reliability modelingComplete product layoutContinuity verificationDesign rule checkDesign packageGenerate masksVerify masks in fabRun wafersSort wafersCreate test programsDebug productsPackage products Functionality testingSend samples to customersFeedback from customersVerify sample functionalityApprove packaged productsEnvironmental validation Complete product validationDevelop tech. publicationsDevelop service coursesDetermine marketing nameLicensing strategyCreate demonstrationConfirm quality goalsLife testingInfant mortality testingMfg. process stabilizationDevelop field support planThermal testingConfirm process standardsConfirm package standardsFinal certificationVolume productionPrepare distribution networkDeliver product to customers
10/7/03 - ESD.36J SPM 13
• x x • x • x x • x • x •
• x x • x
x x • •
x • x x • x x • x x x x x x • O O O O
x x x x • x x x x • x x
x x x x x • x x x x x •
x x • x x x • O O O O O O
x x x • O x x x • x x x x x x x • x
x x • x x x •
x x • x x O O O O O x x x x • x x
x • x x x • x x
x x • x x x •
x x x x x • O O O O x • x O x x x •
x • x O x •
x • x x x x x • O O O O
x x x • x x x •
x x x x • x •
x • x x •
x x x x • x x •
x x • x x x x • x
x • x x x x • x x x x •
x x x • x x x • x x x x x x • x
x x x • O O x x •
x x x • x • x x
x x x x x • x x •
x • x x x x •
x x x x •
x = Information Flows = Planned Iterations O = Unplanned Iterations • = Generational Learning
Concurrent Activity Blocks
Potential Iterations
Generational Learning
Sequential Activities
x x x x x x x
x x x x x
x x xx x
O O O O
x x x x x x x x
x x x xx x x x x x x x x x O O O O
x x x x x x x x x x x x
x x x x
x x x x x x x x x x xx x x
x x x xx x x
x x x x
O O O x x x
O O O
x x
x x x
x x x x
x x x x
x x x x x x x x x xx x
x x x x x x x x x x

+
-What is DSM useful for?
Copyright © 2003 10/7/03 - ESD.36J SPM James M. Lyneis 14

+
-System Dynamics
External factors; management responses; side effects
ity
ApparentProgress
Customer Changes Schedule
Acceleration
Work, Worksite Congestion,Coordination Problems,
Employee Skill
Fatigue,Burnout
Overtime
Hiring
ScopeGrowth
Undiscovered Rework
Known Rework
Work Really Done
Work To Be Done
Progress
Rework Discovery
People Productiv Quality
Out-of-Sequence
Morale Problems
Average
and Quality
Copyright © 200310/7/03 - ESD.36J SPM James M. Lyneis 15

+
-What is SD useful for?
Copyright © 2003 10/7/03 - ESD.36J SPM James M. Lyneis 16

+
-SPM Methods Overview
PERT DSM SD CPM
(+) strength
Detailed Planning Critical path identification
Captures iterations Meta-tasks Architecture-task mapping
Explores dynamic drivers Informs PM actions
(-) weakness
No iterations No connection to organization
Operational planning
individual task models impractical
Copyright © 2003 10/7/03 - ESD.36J SPM James M. Lyneis 17

Class Schedule
(refer to syllabus)
Module Business2
+
-
12/4 Presentations 212/2 Presentations 1
11/25 No Class
11/20 Success Factors
11/13 Concurrency11/11 Veterans Day
11/6 Project Adaptation11/4 Project Tracking
10/30 Risk Management10/28 Critical Path
10/23 Case 3: H/W&S/W10/21 Case 2: H/W
10/16 Case 1: S/W10/14 ICE Methods
10/9 PDPs10/7 Strategic Issues
10/2 Managing9/30 Project Simulation
9/25 Feedback & Rework
9/18 Project Organization9/16 Iterations DSM
9/11 Task-based DSM9/9 Network Techniques
11/27 Thanksgiving
11/18 Project Metrics
Dynamics
9/23 System Dynamics 1
Trip
Note two No Class 3-hour
classes in
December Copyright © 2003
10/7/03 - ESD.36J SPM James M. Lyneis 18

+
-
System Project Management ESD.36 Framework
Project Preparation Project
Planning
Project Adaptation
Project Monitoring
Enterprise has chosen what product or system to develop
Ref: J. Warmkessel
Copyright © 2003 10/7/03 - ESD.36J SPM James M. Lyneis 19

+
- Topics
�Homework Review and Module One Wrapup
�Project Management – A “Strategic” View
�Managing Project Dynamics -Project Preparation and Planning
Copyright © 2003 10/7/03 - ESD.36J SPM James M. Lyneis 20

+
-Framework
Project Preparation
Project Planning
Project Execution
Project Adaptation
Doing the right job
Doing the job right
Copyright © 2003 10/7/03 - ESD.36J SPM James M. Lyneis 21

+
-
What is “strategy” as it applies to an individual project (vs. corporate
strategy as it applies to projects and the project portfolio)?
Copyright © 2003 10/7/03 - ESD.36J SPM James M. Lyneis 22

+
-Corporate Strategy for the Project
� Determining the fit of the project to businessobjectives (the “mission” – doing the right job) � features / scope of end product � schedule milestones (time to market) � delivered quality (defects) � resources & budget (development cost) And the mix/timing of “projects” necessary to achieve
corporate strategy
Operationally, “projects” implement corporate strategy.
Copyright © 2003 10/7/03 - ESD.36J SPM James M. Lyneis 23

+
-Mission Dimensions
Priority & Specific Objectives
High, Stretch Low, Slack
Features / Scope
Defects/ Undiscovered Rework
Resources / Cost
Time-to-Market/ Schedule
Medium
Copyright © 200310/7/03 - ESD.36J SPM James M. Lyneis

+
-Strategic Project Management
� Understanding how project “design” decisionsaffect project performance …� Scope/schedule/ ... (i.e., mission)� Organization, process, ...� Buffers, phase overlap, ...� Staffing strategies, schedule slip, ...� ...
� … and how they affect other current projects(portfolio issues), and future projects.
Operationally, “day-to-day projectdecisions” implement project strategy.
Copyright © 2003 10/7/03 - ESD.36J SPM James M. Lyneis 25

+
-Process & Organization Issues
� Waterfall vs. spiral vs. ... � Autonomous team vs. functional (&
therefore multiple projects per person?) � Integrated product teams? � System vs. modules (?) � How much to subcontract, make vs. buy
Copyright © 2003 10/7/03 - ESD.36J SPM James M. Lyneis 26

+
-Staffing Issues
� How much to rely on overtime (vs. adding staff)?
� Should you pay extra for experience?
� Generalists vs. specialists?
� Co-location vs. geographically dispersed (vs. not getting enough people, local content, …?)
� How much training � How much is it worth to reduce attrition?
Copyright © 2003 10/7/03 - ESD.36J SPM James M. Lyneis 27

+
- Strategic vs Operational Decisions
Operational Strategic
Copyright © 200310/7/03 - ESD.36J SPM James M. Lyneis 28

+
-
Strategic “Project” Management Pertains to Both Preparation & Planning
© 2003
Project Preparation
Project Planning
Project Execution
Project Adaptation
Doing the right job
Doing the job right
Strategic Project Management
Copyright 10/7/03 - ESD.36J SPM James M. Lyneis 29

+
- Topics
�Homework Review and Module One Wrapup
�Project Management – A “Strategic” View
�Managing Project Dynamics -Project Preparation and Planning
Copyright © 2003 10/7/03 - ESD.36J SPM James M. Lyneis 30

+
-Typical project dynamics ...
Project Staffing
Typical Plan
... Result in schedule &/or budget overrun
TimeCopyright © 2003
10/7/03 - ESD.36J SPM James M. Lyneis 31

+
-Project dynamics from Homework 4:
Graph for Staff Level60
45
30
15
0
Plan
0 3 6 9 12 15 18 21 24 27 30 33 36 39 42 45 48 51 54 57 60 Time (Month)
Staff Level : Class4 Hire 100 People Staff Level : Class4 Hire 0 People Staff Level : Class4 People
Copyright © 2003 10/7/03 - ESD.36J SPM James M. Lyneis 32

+
-Strategic Project Management
� What can we do to avoid/minimize the dynamics ...
� … in project preparation (design) and project planning?
� … in project execution and adaptation (e.g., risk management and change management)?
Copyright © 2003 10/7/03 - ESD.36J SPM James M. Lyneis 33

+
-
© 2003
Work Quality to Date
Scheduled Completion
Time
Expected Completion
Time Availability
of Prerequisites
Progress
Pressure
Out-of-Sequence Work
Morale
Hours at Completion
Hours Expended
to Date
Skill & Experience
Hiring
EquivalentStaff on Project
StaffingRequested
TurnoverOrganizational
Changes
Staff
Quality
Added Work
Work
Overtime
Time Remaining
Be Done
How do the dynamics get started?
Copyright Perceived
Schedule
Expected Progress
Rework Discovery
Size
Productivity
Obsoleted
Work To
Undiscovered Rework
Known Rework
Work Really Done
10/7/03 - ESD.36J SPM James M. Lyneis 34

+
-How Does It Get Started?
� Inconsistent “mission” (scope/schedule/defects/budget)
� Late changes and other risks � “Quality” problems
These are characteristics of “complex” (vs. “simple”) projects
Copyright © 2003 10/7/03 - ESD.36J SPM James M. Lyneis 35

+
-
© 2003
Work Quality to Date
Scheduled Completion
Time
Expected Completion
Time Availability
of Prerequisites
Progress
Schedule Pressure
Out-of-SequenceWork
Morale
Hours at Completion
Hours Expended
to Date
Skill & Experience
Hiring
Equivalent Staff on Project
Staffing Requested
TurnoverOrganizational
Changes
Staff
Quality
Added Work
Work
Overtime
Time Remaining
Be Done
How does it get started?
Copyright Perceived
Expected Progress
Rework Discovery
Size
Productivity
Obsoleted
Work To
Undiscovered Rework
Known Rework
Work Really Done
10/7/03 - ESD.36J SPM James M. Lyneis 36

+
-How Does It Get Started?
� Inconsistent “mission” (scope/schedule/defects/budget)
� Late changes and other risks � “Quality” problems
These are characteristics of “complex” (vs. “simple”) projects
Copyright © 2003 10/7/03 - ESD.36J SPM James M. Lyneis 37

+
-Mission Dimensions
Priority & Specific Objectives
High, Stretch Low, Slack
Features / Scope
Defects/ Undiscovered Rework
Resources / Cost
Time-to-Market/ Schedule
Medium
What should the “objectives” be? How many can be “high” priority?
Copyright © 2003 10/7/03 - ESD.36J SPM James M. Lyneis

+
-Consistent Project Can Achieve the “Plan”
� Scope = 100 (tasks) � Scheduled Completion Date = 30
(month) (vs. 27 in Class4 model)� Delivered Quality > 99% � Staff = 4 (people) � Normal Quality = .95 (fraction) (vs. .85
in Class4 model)
Copyright © 2003 10/7/03 - ESD.36J SPM James M. Lyneis 39

+
-Staff & Progress
100 Task 6 People
75 Task 4.5 People
50 Task 3 People
25 Task 1.5 People
0 Task 0 People
0 3 6 9 12 15 18 21 24 27 30 33 36 39 42 45 48 51 54 57 60 Time (Month)
Work Done : Plan Task Staff Level : Plan People
Copyright © 2003 10/7/03 - ESD.36J SPM James M. Lyneis 40

+
-Productivity
1.2
1.1
1
0.9
0.8 0 3 6 9 12 15 18 21 24 27 30 33 36 39 42 45 48 51 54 57 60
Time (Month)
Productivity : Plan Task/(Month*Person) Effect of Experience on Productivity : Plan Task/(Month*Person) Effect of Schedule Pressure on Productivity : Plan Task/(Month*Person)
Copyright © 2003 10/7/03 - ESD.36J SPM James M. Lyneis 41

+
-Quality
1
0.95
0.9
0.85
0.8 0 3 6 9 12 15 18 21 24 27 30 33 36 39 42 45 48 51 54 57 60
Time (Month)
Quality : Plan Fraction Effect of Prior Work Quality on Quality : Plan Fraction Effect of Experience on Quality : Plan Fraction Effect of Schedule Pressure on Quality : Plan Fraction
Copyright © 2003 10/7/03 - ESD.36J SPM James M. Lyneis 42

+
-
Inconsistent Projects Can Initiate the “Dynamics”
� Plan Work 125 [Scope = 125 initial tasks (vs 100)]
� Plan Schedule 22 [Scheduled completion date = 22.5 (vs 30)]
� Plan Staff 3 [Staff = 3 people until past 50% complete (vs 4); this might also reflect resource constraints as well as poor or aggressive planning].
� Plan Quality 85 [Normal Quality = .85 (vs .95)]
Copyright © 2003 10/7/03 - ESD.36J SPM James M. Lyneis 43

+
-Graph for Staff Level
20
15
10
5
0
Plan
0 3 6 9 12 15 18 21 24 27 30 33 36 39 42 45 48 51 54 57 60 Time (Month)
Staff Level : Plan People Staff Level : Plan Work 125 People Staff Level : Plan Schedule 22 People Staff Level : Plan Staff 3 People Staff Level : Plan Quality 85 People
Copyright © 2003 10/7/03 - ESD.36J SPM James M. Lyneis 44

+ What makes it worse? - Time
Remaining
Skill & Experience
Staff
Morale Organizational Turnover HiringSize
Changes Overtime
Schedule StaffingScheduledCompletion
Out-of-Sequence
Pressure Equivalent Requested
Productivity Quality Staff on Time Project
Work Hours Expended Progress Expected to Date ExpectedWork Completion Availability Work To
Be Done Really Done Hours at Time of Prerequisites Added Completion
Work Obsoleted Known Undiscovered WorkWork Quality
to Date Rework Rework Rework
Discovery
Perceived Progress Copyright © 2003
10/7/03 - ESD.36J SPM James M. Lyneis 45

+
- Graph for Quality 1
0.75
0.5
0.25
0
Quality on Quality Feedback
What makes it worse?
Plan
0 3 6 9 12 15 18 21 24 27 30 33 36 39 42 45 48 51 54 57 60 Time (Month)
Quality : Class 5 Plan Fraction Quality : Class 5 Plan Scope 125 Fraction Quality : Class 5 Plan Schedule 22 Fraction Quality : Class 5 Plan Staff 3 Fraction Quality : Class 5 Plan Quality 85 Fraction
Copyright © 2003 10/7/03 - ESD.36J SPM James M. Lyneis 46

+
- Graph for Effect of Experience on Quality 1
0.9
0.8
0.7
0.6
Experience on Quality Feedback
What makes it worse? Plan
0 3 6 9 12 15 18 21 24 27 30 33 36 39 42 45 48 51 54 57 60 Time (Month)
Effect of Experience on Quality : Class 5 Plan Dimensionless Effect of Experience on Quality : Class 5 Plan Scope 125 Dimensionless Effect of Experience on Quality : Class 5 Plan Schedule 22 Dimensionless Effect of Experience on Quality : Class 5 Plan Staff 3 Dimensionless Effect of Experience on Quality : Class 5 Plan Quality 85 Dimensionless
Copyright © 2003 10/7/03 - ESD.36J SPM James M. Lyneis 47

+
-
Trying to achieve inconsistent objectives can lead to disaster
Test Finish Cost(person-mos)Plan 29.875 116.7
Increase Scope 33.125 211.3 (vs. 145 to 125 budget) Reduce 27.6 194.7 Schedule to 22.5
Reduce Initial 34 193.0Staff to 3
35.8 213.5Normal Q = .85
With end result worse (schedule/cost) than if project budgeted higher at start
Copyright © 2003 10/7/03 - ESD.36J SPM James M. Lyneis 48

+
-
What is implicit lower priority in above simulations (and Homework 4 model)?
� Adding staff, and therefore cost.
� Based on homework, can this ever work?
� How often do you believe those conditions exist?
Copyright © 2003 10/7/03 - ESD.36J SPM James M. Lyneis 49

+
-How Does It Get Started?
� Inconsistent “mission” (scope/schedule/defects/budget)
� Late changes and other risks � “Quality” problems
These are characteristics of “complex”(vs. “simple”) projects
Copyright © 2003 10/7/03 - ESD.36J SPM James M. Lyneis 50

+
-
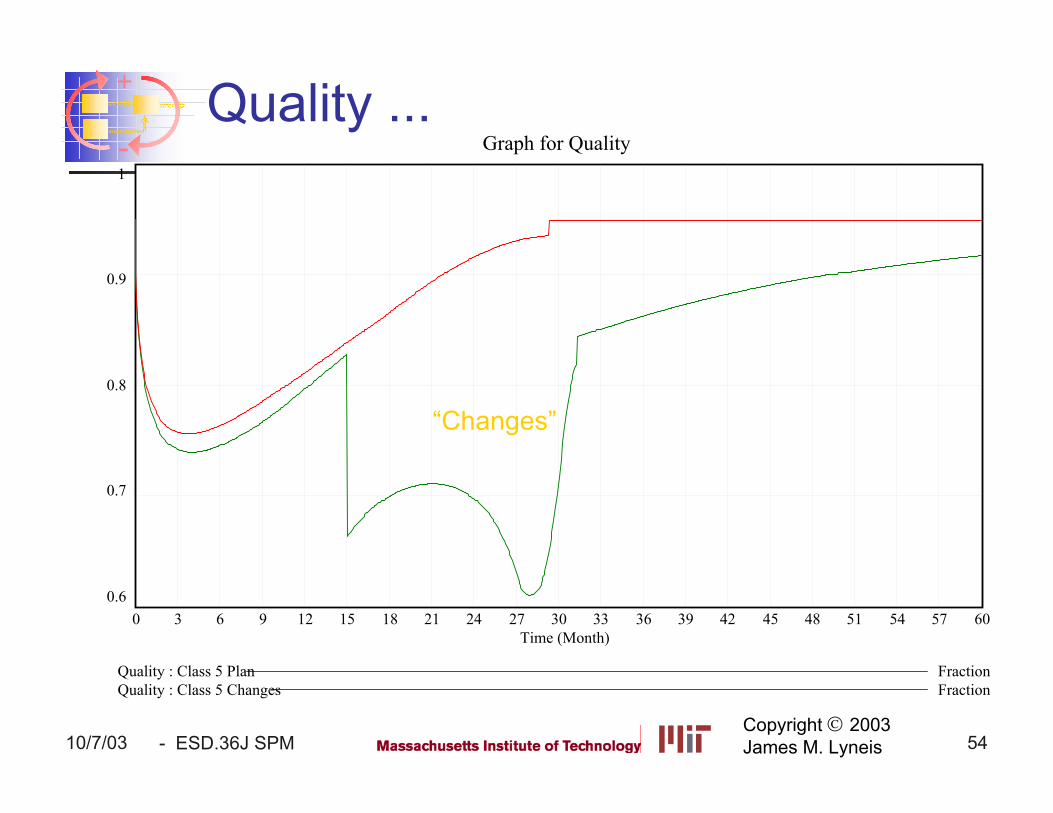
Late Project Changes Can Create the Dynamics As Well
� “Changes” � 20% of tasks done obsoleted at month 15 � Put into undiscovered rework (what needs
to be redone often not completely known when “change” is made).
Copyright © 2003 10/7/03 - ESD.36J SPM James M. Lyneis 51

+
-Graph for Work Done
100
75
50
25
0 0 3 6 9
Work Done ...
“Changes”
12 15 18 21 24 27 30 33 36 39 42 45 48 51 54 57 60 Time (Month)
Work Done : Class 5 Plan Task Work Done : Class 5 Changes Task
Copyright © 2003 10/7/03 - ESD.36J SPM James M. Lyneis 52

+
-Staffing ...
Graph for Staff Level20
15
10
5
0
“Changes”
0 3 6 9 12 15 18 21 24 27 30 33 36 39 42 45 48 51 54 57 60 Time (Month)
Staff Level : Class 5 Plan People Staff Level : Class 5 Changes People
Copyright © 2003 10/7/03 - ESD.36J SPM James M. Lyneis 53
Graph for Quality
+
-Quality ...
1
0.9
0.8
0.7
0.6
“Changes”
0 3 6 9 12 15 18 21 24 27 30 33 36 39 42 45 48 51 54 57 60 Time (Month)
Quality : Class 5 Plan Fraction Quality : Class 5 Changes Fraction
Copyright © 2003 10/7/03 - ESD.36J SPM James M. Lyneis 54

+
-How Does It Get Started?
� Inconsistent “mission” (scope/schedule/budget)
� Late changes and other risks � “Quality” problems
These are characteristics of “complex”(vs. “simple”) projects
Copyright © 2003 10/7/03 - ESD.36J SPM James M. Lyneis 55

+
-
What causes project “quality” problems?
� Remember, quality as used in the model is any work done incorrectly or incompletely, regardless of cause
Copyright © 2003 10/7/03 - ESD.36J SPM James M. Lyneis 56

+
-
What causes project “quality” problems?
� Endogenous feedback effects (manageable) � Exogenous factors
� Availability and quality of information from others(suppliers, other projects, platforms)
� Uncertain customer requirements � Uncertain technology, technology leap � Scope (esp. number of features and resultant
complexity) � Other -- type of people available, tools,
organization structure
Copyright © 2003 10/7/03 - ESD.36J SPM James M. Lyneis 57

+
-
What are differences between “changes” and “quality” problems?
� Changes represent truly unknowable,uncontrollable, exogenous impacts(though the fact that they often happenmight be planned for) � competitor introduces a new feature � ...
� “Quality” problems can be anticipatedand dealt with in the design andmanagement of the project � buffers, prototypes, process, ...
Copyright © 2003 10/7/03 - ESD.36J SPM James M. Lyneis 58

+
-How can we design a project that minimizes the chances of the dynamics getting started?
� Consistent mission?
� Reflects typical quality problems?
� Accounts for possible changes and risks?
Note: Source of problem affects solution
Copyright © 2003 10/7/03 - ESD.36J SPM James M. Lyneis 59

+
-
Strategic “Project” Management Pertains to Both Preparation & Planning
Project Preparation
Project Planning
Project Execution
Project Adaptation
Doing the right job
Doing the job right
Strategic Project Management
Copyright © 2003 10/7/03 - ESD.36J SPM James M. Lyneis 60

+
-Strategic Project Management
� Establishing project design“parameters” -� Consistent mission � Development process � Organization structure (?) � Staffing strategy � Phase overlap & concurrency � What to measure, monitor, and exert
pressure on� ...
Copyright © 2003 10/7/03 - ESD.36J SPM James M. Lyneis 61

+
-Strategic Project “Design”
� Given the mission objectives, what is theproject likely to cost and when will it finish(given prior experience)? What risks mightthe project face?
� How can we optimize the tradeoff amongscope/schedule/budget in meeting theproject’s mission? What will it really cost meto … finish earlier, add features, ….
� What changes in process, organization, …etc. might improve the tradeoff.
Copyright © 2003 10/7/03 - ESD.36J SPM James M. Lyneis 62

+
-
How many people feel that on the typical project in your organization, budget and schedule are …
� More than is needed __________
� Just right __________
� Tight, but manageable __________
� Insufficient enough that the vicious circles are significant __________
Copyright © 2003 10/7/03 - ESD.36J SPM James M. Lyneis 63

+
-Why Won’t We Develop a Realistic Plan?
Copyright © 2003 10/7/03 - ESD.36J SPM James M. Lyneis 64

+
-Lessons
� Getting a feasible project design is the first step to avoiding adverse project dynamics
� Prior projects are the best source of information with which to design a robust project
� There is an optimal tradeoff among scope, budget, schedule, and delivered defects
Copyright © 2003 10/7/03 - ESD.36J SPM James M. Lyneis 65

+
-
How can we design a project that minimizes the chances of the dynamics getting started?
� Consistent mission?
� Reflects typical quality problems?
� Accounts for possible changes and risks?
Note: Source of problem affects solution
Copyright © 2003 10/7/03 - ESD.36J SPM James M. Lyneis 66

+
-Strategic Project Management
� Establishing project design “parameters” -� Consistent mission
� Development process
� Organization structure (?)� Staffing strategy
Strategic � Phase overlap & concurrency Project
Planning?� What to measure, monitor, and exert pressure on
� ... Copyright © 2003 10/7/03 - ESD.36J SPM James M. Lyneis 67

+
- Selected Issues in Project Planning
� Selecting the process model � Defining teams and responsibilities � Activity planning and resource allocation � Scheduling � Determining what to measure, monitor,
exert pressure on (reward) � Identifying risks and mitigation plans
Copyright © 2003 10/7/03 - ESD.36J SPM James M. Lyneis 68

+
-Strategic Process & Organization Issues
� Waterfall vs. spiral vs. adaptive vs. …? � Autonomous (dedicated) integrated
product team vs. functional?
� System vs. modules? � How much phase overlap and
concurrency? � How much to subcontract, make vs.
buy? Copyright © 2003
10/7/03 - ESD.36J SPM James M. Lyneis 69

+
-Strategic Staffing Issues
� How much to rely on overtime (vs. adding staff)?
� Should you pay extra for experience?
� Generalists vs. specialists? � Co-location vs. geographically
dispersed? � How much training? � How much is it worth to reduce attrition?
Copyright © 2003 10/7/03 - ESD.36J SPM James M. Lyneis 70

+
-
How do we assess what is right for out project?
Copyright © 200310/7/03 - ESD.36J SPM James M. Lyneis 71

+
-
How do we assess what is right for our project?
System Dynamics Approach:� Model the project with current processes, policies, … � Specify the direct impacts of alternatives (steady
state vs. dynamic) on -� Scope � productivity � quality � rework discovery � strength of productivity and quality effects� ...[Secondary impacts assessed via simulation]
� Simulate and compare performance
Copyright © 2003 10/7/03 - ESD.36J SPM James M. Lyneis 72

+
-
Autonomous Integrated Teams vs. Functional: Autonomous Teams ...
Pros Cons
Copyright © 200310/7/03 - ESD.36J SPM James M. Lyneis 73

+
-
Autonomous Integrated Teams vs. Functional: Sample Test
� Integrated Teams: � Improve normal quality to 0.925 (from 0.85
because diverse members of team capture mistakes before they happen)
� Reduce Maximum rework discovery time to 4 months (from 12 months)
� Reduce Normal productivity to .9 (from 1 because multiple team member slow progress, more review, discussion, …)
Copyright © 2003 10/7/03 - ESD.36J SPM James M. Lyneis 74

+
-Graph for Staff Level
20
15
10
5
0
Plan
Functional
Product Team Integrated
0 3 6 9 12 15 18 21 24 27 30 33 36 39 42 45 48 51 54 57 60 Time (Month)
Staff Level : Class6 Plan People Staff Level : Class6 Waterfall People Staff Level : Class6 Integrated Teams People
Copyright © 2003 10/7/03 - ESD.36J SPM James M. Lyneis 75

+
-
Graph for Quality 1
0.75
0.5
0.25
0
Plan
Functional
Product Team Integrated
0 3 6 9 12 15 18 21 24 27 30 33 36 39 42 45 48 51 54 57 60 Time (Month)
Quality : Class6 Plan Fraction Quality : Class6 Waterfall Fraction Quality : Class6 Integrated Teams Fraction
Copyright © 2003 10/7/03 - ESD.36J SPM James M. Lyneis 76

+
-
Graph for Undiscovered Rework 40
30
20
10
0 0 3 6 9 12 15 18 21 24 27 30 33 36 39 42 45 48 51 54 57 60
Plan
Functional
Product Team Integrated
Time (Month)
Undiscovered Rework : Class6 Plan Task Undiscovered Rework : Class6 Waterfall Task Undiscovered Rework : Class6 Integrated Teams Task
Copyright © 2003 10/7/03 - ESD.36J SPM James M. Lyneis 77

+
-
Autonomous Integrated Teams vs. Functional
TestPlan
Functional
Integrated Product Team
Finish Cost(person-mos) 29.875 116.7
38.875 263.3
31.625 189.38
Copyright © 2003 10/7/03 - ESD.36J SPM James M. Lyneis 78

+
- Conclusions re. Integrated Teams
� An integrated product team or similar organization structure can improve performance if project conditions would otherwise cause significant undiscovered rework
� The benefits of these structures increase with the uncertainty (risk), and likely project overrun with traditional development approaches
� Cautions ... Copyright © 2003
10/7/03 - ESD.36J SPM James M. Lyneis 79

+
-Strategic Project Management
� Establishing project design “parameters” -� Consistent mission � Development process � Organization structure (?) � Staffing strategy � Phase overlap & concurrency � What to measure, monitor, and exert pressure on � ...
Next SD class we’ll deal with the other design issues
Copyright © 2003 10/7/03 - ESD.36J SPM James M. Lyneis 80