esdu-66030b-pressure losses in flowmetering devices
DESCRIPTION
PRESSURE LOSSES IN FLOWMETERING DEVICESTRANSCRIPT

ESD
U p
rodu
ct is
sue:
20
03
-03
. Fo
r cu
rren
t st
atus
, con
tact
ES
DU
. O
bser
ve C
opyr
ight
.
66030
PRESSURE LOSSES IN FLOWMETERING DEVICES1. NOTATION AND UNITS
Any coherent set of units may be used. Two such sets are indicated below.
SI British fps
internal cross-sectional area of meter entry m2 ft2
meter pressure-loss coefficient (see Equation (5.1))
nominal internal diameter of meter entry m ft
local acceleration due to gravity*
* For the purposes of this Item the difference between the local gravitational acceleration and the standard value is not significantand may be taken as 9.81 m/s2 or 32.2 ft/s2.
m/s2 ft/s2
flowmetering pressure difference † (see Figure 1)
† The British Standard, B.S. 1042 (Reference 2), defines a pressure difference, , across differential pressure devices. This ismeasured between standardised points on or close to the device and is used only for flowmetering purposes. It is not the sameas the pressure loss ( ) referred to in this Item. Figure 1 shows a typical example of the measurement of the pressure differ-ence, .
m ft
loss of head of flowing fluid due to meter (corresponding to pressure loss )
m ft
mass flow rate through meter kg/s lb/s
area ratio = (minimum cross-sectional area in meter)/(meter entry area)
static pressure (absolute) N/m2 pdl/ft2
pressure loss due to meter † (see Figure 1) N/m2 pdl/ft2
volume flow rate m3/s ft3/s
Reynolds number based on meter entry diameter‡
‡ For differential pressure devices, B.S. 1042 uses a Reynolds number based on the minimum internal diameter of the device.
mean velocity m/s ft/s
dynamic viscosity**
** The symbol is often used to denote dynamic viscosity.
N s/m2 pdl s/ft2
kinematic viscosity m2/s ft2/s
density kg/m3 lb/ft3
A
CK
D
g
g
h
h
∆ph
∆h∆p
M
m
p
∆p
Q M ρ⁄=
ReD V= D ν⁄
V Q A⁄=
µ
η
ν µ ρ⁄=
ρ
1
Issued October 1966 - 28 pagesThis page is Amendment A and B

ESD
U p
rodu
ct is
sue:
20
03
-03
. Fo
r cu
rren
t st
atus
, con
tact
ES
DU
. O
bser
ve C
opyr
ight
.
66030
Suffixesvalue at mid-range flow rate
gross value (see Figure 1)
net value (see Figure 1)
Conversion factors:
Pressure: 1 pdl/ft2 lbf/in2 = 1.488 N/m2
Flow rate: 1 UKgal/min = 1.201 USgal/min ft3/s m3/s
Kinematic viscosity: 1 cSt m2/s ft2/s
Dynamic viscosity: 1 cP N s/m2 pdl s/ft2
Density: 1 lb/ft3 kg/m3
a
G
N
215.8 6–×10=
2.676 3–×10= 75.77 6–×10=
1 6–×10= 10.76 6–×10=
1 3–×10= 671.97 6–×10=
16.02=
2
ESD
U p
rodu
ct is
sue:
20
03
-03
. Fo
r cu
rren
t st
atus
, con
tact
ES
DU
. O
bser
ve C
opyr
ight
.
66030
2. INTRODUCTIONThis Item gives approximate pressure loss information for a wide range of flowmeters operating underturbulent flow conditions. It is assumed that any flow disturbing elements in the pipe line (e.g. valves,bends, area changes) are sufficiently far from the meter to have no appreciable effect on its pressure loss.The data are based on information supplied by manufacturers of flowmeters and on the British Standard,B.S. 1042, Part 1, 1964 on flow measurement.
The information is presented in the form of a non-dimensional pressure loss coefficient plotted againstnominal meter size or, for differential pressure devices, against meter area ratio. For differential pressuredevices the data given here are accurate to within a few per cent but for inferential and displacement metersit is possible to give only approximate data. There are two principal reasons for this difference. The firstarises because there is no standardisation of inferential and displacement meters, and there is, in general,a lack of geometrical similarity between meters of different sizes and from different manufacturers. Thesecond reason arises from fluid dynamic considerations. Figure 1 shows how the presence of a meter mayconsiderably affect the axial pressure distribution in a pipe line. Close to the meter variations around theperimeter of the pipe may also occur. The data given here for differential pressure devices are based onmeasurements at standardised positions which are in regions of fully-developed flow. For inferential anddisplacement meters no standard procedures for pressure loss measurement exist and variations in thepositioning of the pressure tappings are a probable source of scatter of the data for these meters.
It is emphasised that the question of metering accuracy is quite different from the question of the accuracyof the pressure loss data quoted in this Item. The accuracy of metering is not considered here.
3

ESD
U p
rodu
ct is
sue:
20
03
-03
. Fo
r cu
rren
t st
atus
, con
tact
ES
DU
. O
bser
ve C
opyr
ight
.
66030
3. CALCULATION OF PRESSURE LOSSFigures 2, 4 and 6 present values of the pressure loss coefficient, , for a number of flowmeters. Figures5 and 7 allow the effect of variation in Reynolds number to be taken into account where necessary. Table8.1 indicates the appropriate figures to be used for each meter.
When has been found the pressure loss is given by
. (3.1)
The corresponding head loss, ( ), in terms of fluid flowing is given by
. (3.2)
If SI units are used, the pressure loss is given directly in N/m2 and the head loss in metres of fluid flowing.When foot-pound-second units are used, is given in pdl/ft2 and in feet. may be converted tolbf/in2 by using the conversion factor from Section 1. The head loss may be expressed in terms of head ofwater by multiplying the value obtained from Equation (3.2) by the specific gravity of the fluid flowing.
For examples of these calculations see Section 7.
CK
CK ∆p
p∆ CK ½ρV 2×=
∆h ∆p ρg⁄=
h∆ CKV 2
2g------×=
∆p ∆h ∆p
4
ESD
U p
rodu
ct is
sue:
20
03
-03
. Fo
r cu
rren
t st
atus
, con
tact
ES
DU
. O
bser
ve C
opyr
ight
.
66030
4. METER CLASSIFICATIONThis section gives the main groups into which flowmeters may be classified. Table 8.1 describes variousindividual types of meter within each main group.
4.1 Volumetric Flowmeters
4.1.1 Differential pressure devices
Devices of the orifice plate, venturi tube and nozzle type are among the most widely used of flowmeters.They are normally manufactured to standard specifications, of which British Standard 1042, Part 1, 1964is most common in UK practice. Some examples of these meters are given in Table 8.1 (Section 1.1) andsome pressure loss coefficient data are given in Figures 2 and 3. See also Item Nos 80039 and 82009 formore detailed information on pressure losses through orifice plates and tubes.
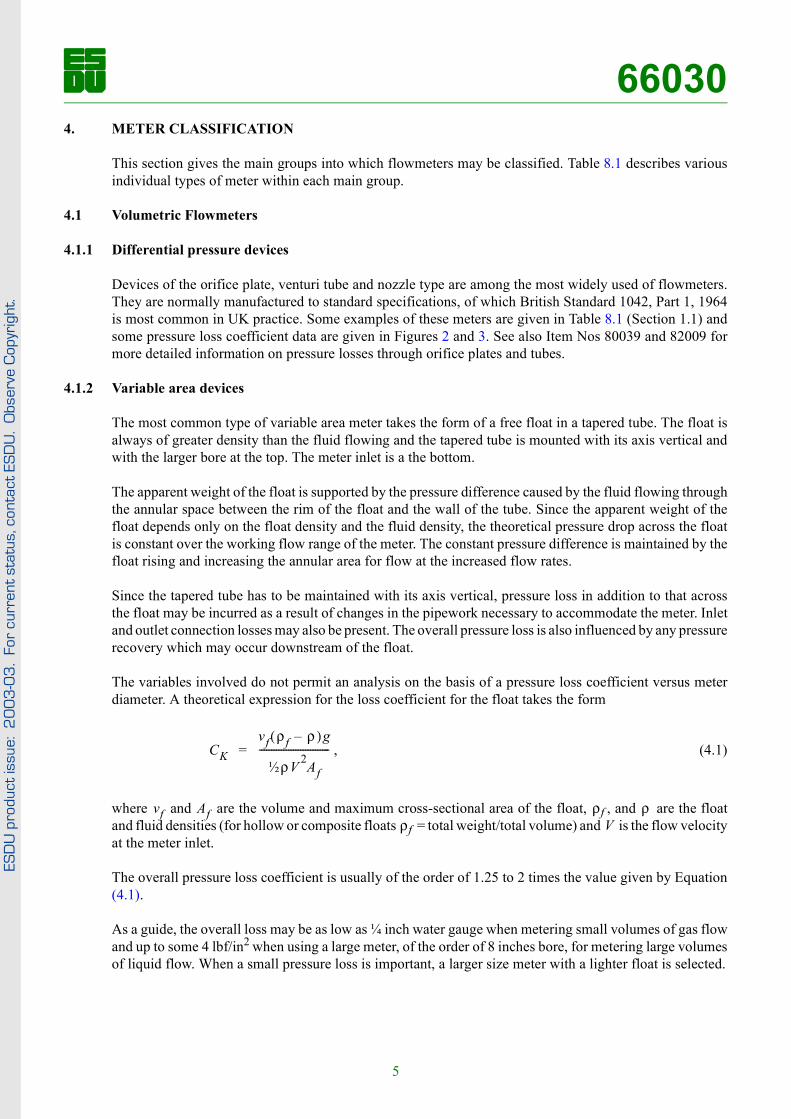
4.1.2 Variable area devices
The most common type of variable area meter takes the form of a free float in a tapered tube. The float isalways of greater density than the fluid flowing and the tapered tube is mounted with its axis vertical andwith the larger bore at the top. The meter inlet is a the bottom.
The apparent weight of the float is supported by the pressure difference caused by the fluid flowing throughthe annular space between the rim of the float and the wall of the tube. Since the apparent weight of thefloat depends only on the float density and the fluid density, the theoretical pressure drop across the floatis constant over the working flow range of the meter. The constant pressure difference is maintained by thefloat rising and increasing the annular area for flow at the increased flow rates.
Since the tapered tube has to be maintained with its axis vertical, pressure loss in addition to that acrossthe float may be incurred as a result of changes in the pipework necessary to accommodate the meter. Inletand outlet connection losses may also be present. The overall pressure loss is also influenced by any pressurerecovery which may occur downstream of the float.
The variables involved do not permit an analysis on the basis of a pressure loss coefficient versus meterdiameter. A theoretical expression for the loss coefficient for the float takes the form
, (4.1)
where and are the volume and maximum cross-sectional area of the float, , and are the floatand fluid densities (for hollow or composite floats = total weight/total volume) and is the flow velocityat the meter inlet.
The overall pressure loss coefficient is usually of the order of 1.25 to 2 times the value given by Equation(4.1).
As a guide, the overall loss may be as low as ¼ inch water gauge when metering small volumes of gas flowand up to some 4 lbf/in2 when using a large meter, of the order of 8 inches bore, for metering large volumesof liquid flow. When a small pressure loss is important, a larger size meter with a lighter float is selected.
CKvf ρf ρ–( )g
½ρV 2Af
-----------------------------=
vf Af ρf ρρf V
5

ESD
U p
rodu
ct is
sue:
20
03
-03
. Fo
r cu
rren
t st
atus
, con
tact
ES
DU
. O
bser
ve C
opyr
ight
.
66030
The majority of tapered tube and float meters used in industry use a glass tube, but metal tapered tubes arealso widely used. Other forms of industrial significance are those employing a guided disc in a metal taperedtube, a hinged gate, or a variable orifice arrangement.Some types of variable area meter are shown in Table 8.1 (Section 1.2).
4.1.3 Inferential meters
This type of meter infers flow rate from the measurements of another parameter of the flow. This iscommonly the velocity imparted by the fluid to a movable element within the meter.
Individual types of inferential flowmeter are shown in Table 8.1 (Section 1.3) and pressure loss coefficientdata are provided on Figure 4.
4.1.4 Displacement meters
This type of meter divides the flow into a series of "unit volumes" and counts the number of these passingthrough the meter.
Two subdivisions of displacement meters may be distinguished.
(a) Meters in which the fluid flows through valved ports into the measuring chamber, usuallycharacterised by sharp changes in flow direction and consequently high pressure loss (e.g. pistonin cylinder meters).
(b) Meters in which the measuring chamber is formed smoothly and continuously by moving elements(e.g. meshing rotor meters).
Individual types of displacement meter are shown in Table 8.1 (Section 1.4) and pressure loss coefficientdata on Figure 6.
4.2 Mass Flowmeters
The mass flow rate of a fluid may be metered by measuring the angular momentum imparted to the fluidby some form of element rotated at constant speed. The angular momentum transferred to the fluid in unittime is then proportional to the mass flow rate. Meters working on this and similar principles are referredto as being of the true mass flow type.
In the inferential forms of mass flowmeter, a mass flow reading may be obtained by calibrating one of theforegoing volumetric meters for a particular fluid under specified conditions. In some cases automaticcorrection for temperature and pressure variations may be available.
In the case of the tapered tube variable area meter, if the float density is made equal to twice the averagedensity of the metered fluid (which must be a liquid), a close approximation to a mass flow reading isobtained. For example, a 10 per cent variation of the liquid density from its average value produces only a0.5 per cent error in mass flow reading.
6
ESD
U p
rodu
ct is
sue:
20
03
-03
. Fo
r cu
rren
t st
atus
, con
tact
ES
DU
. O
bser
ve C
opyr
ight
.
66030
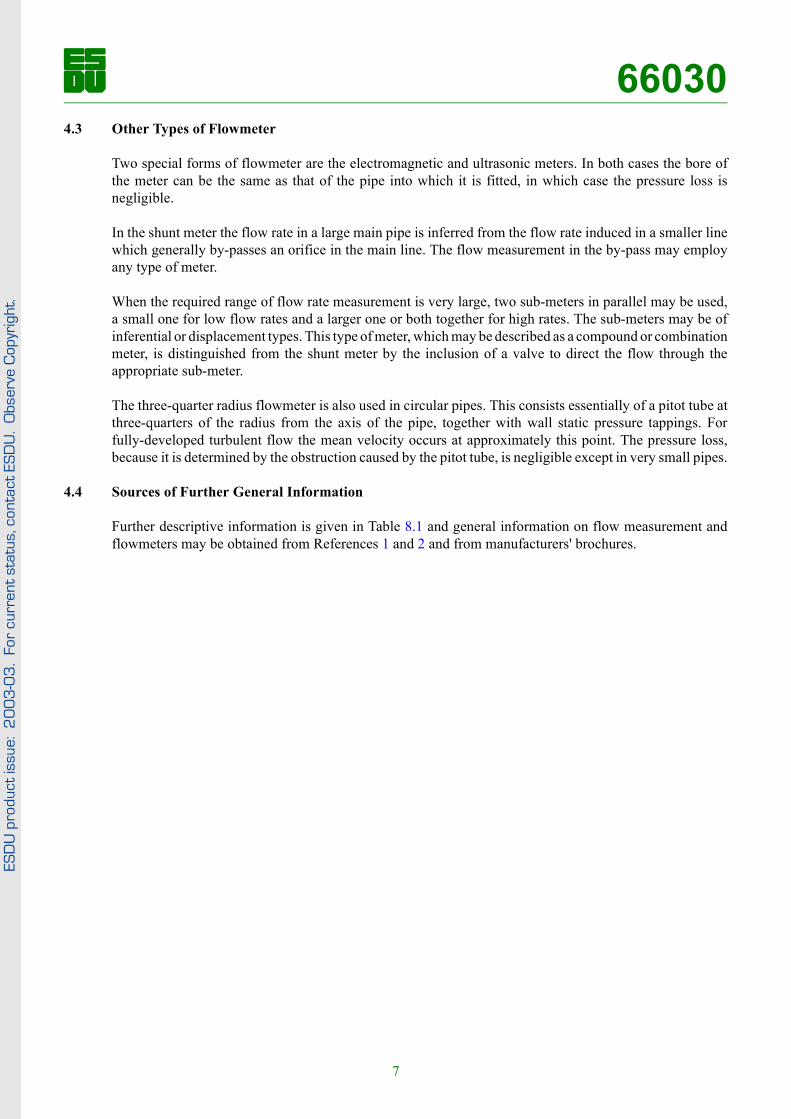
4.3 Other Types of FlowmeterTwo special forms of flowmeter are the electromagnetic and ultrasonic meters. In both cases the bore ofthe meter can be the same as that of the pipe into which it is fitted, in which case the pressure loss isnegligible.
In the shunt meter the flow rate in a large main pipe is inferred from the flow rate induced in a smaller linewhich generally by-passes an orifice in the main line. The flow measurement in the by-pass may employany type of meter.
When the required range of flow rate measurement is very large, two sub-meters in parallel may be used,a small one for low flow rates and a larger one or both together for high rates. The sub-meters may be ofinferential or displacement types. This type of meter, which may be described as a compound or combinationmeter, is distinguished from the shunt meter by the inclusion of a valve to direct the flow through theappropriate sub-meter.
The three-quarter radius flowmeter is also used in circular pipes. This consists essentially of a pitot tube atthree-quarters of the radius from the axis of the pipe, together with wall static pressure tappings. Forfully-developed turbulent flow the mean velocity occurs at approximately this point. The pressure loss,because it is determined by the obstruction caused by the pitot tube, is negligible except in very small pipes.
4.4 Sources of Further General Information
Further descriptive information is given in Table 8.1 and general information on flow measurement andflowmeters may be obtained from References 1 and 2 and from manufacturers' brochures.
7

ESD
U p
rodu
ct is
sue:
20
03
-03
. Fo
r cu
rren
t st
atus
, con
tact
ES
DU
. O
bser
ve C
opyr
ight
.
66030
5. PRESSURE LOSS CHARACTERISTICSFigure 1 defines the pressure losses due to the presence of a flowmeter in a pipe line. Cases with and withoutrecovery of part of the loss are shown. The pressure loss coefficient, , is defined by
. (5.1)
For completeness, Figure 1 shows the difference between the gross and net pressure loss values. In thisItem the data on Figures 2 and 3 for differential pressure devices are based on net values. The data forinferential and displacement meters, on Figures 4 and 6, are based nominally on gross pressure loss values,but within the accuracy of the data the difference between the gross and net values is not significant.
Table 8.1 lists various types of flowmetering devices. The main groupings correspond with those of Section4. The first column indicates the figures and curves from which and may be found, if data areavailable in that form. A diagrammatic representation of each type is given and the flow path, which exertsa considerable influence on the pressure loss, is indicated. If data are required for a meter which is notlisted, a reasonable approximation may be made by using the data given for the listed meter having themost similar flow path. The third column of the table gives general information on application andperformance characteristics of the meters.
Figure 2 shows the variation of pressure loss coefficient with area ratio, , for differential pressure devices.These meters can be made geometrically similar for a range of entry diameters and, provided thatfully-developed turbulent flow exists at the meter entry, the pressure loss coefficient will be very nearlyindependent of entry diameter.
Figure 3 presents the pressure loss for differential pressure devices as a percentage of the flowmeteringpressure difference, the positions at which this pressure difference is measured being specified* in B.S.1042 (see Figure 1).
Although the data for orifice plates and nozzles appear on separate curves on Figures 2 and 3 it is possible,if appropriate values of the area ratio can be chosen for each, to obtain the same pressure loss coefficientfor both types of meter when metering the same rate of flow of the same fluid at the same flowmeteringpressure difference in the same sized pipe.
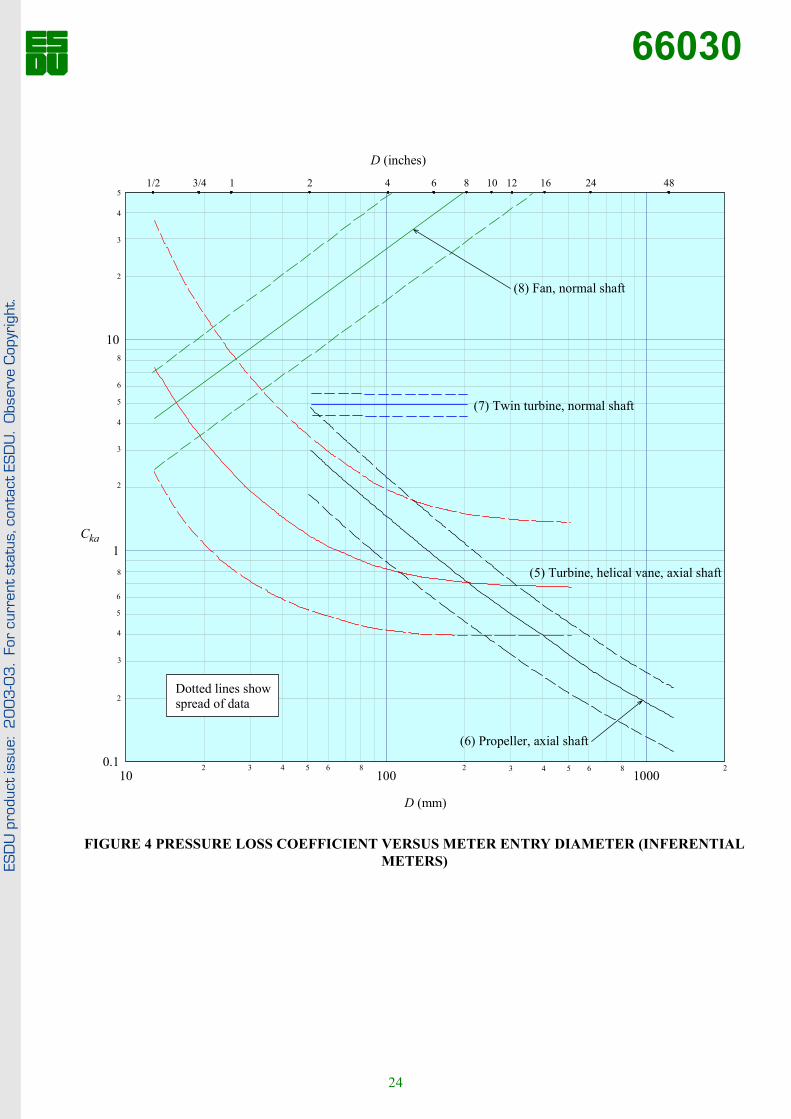
Figures 4 and 6 show the variation of pressure loss coefficient with meter entry diameter for inferential anddisplacement meters, under conditions of turbulent flow. In accordance with normal British usage thenominal meter diameter is given in inches on Figures 4 and 6, but when calculating Reynolds numberconsistent units must be used. If the meters within any group were geometrically similar, the effect of entrydiameter would be small and could be wholly accounted for in the Reynolds number. The variation of shown in the figures arises mainly from the fact that, in practice, the size of other meter components is notuniquely related to the entry diameter.The Reynolds number at mid-range flow rate, , is taken as adatum as this avoids the possibility of unrepresentative values of being included for extreme high orlow flow rates. In many cases the variation of with Reynolds number is small and the values at mid-rangeReynolds number may be applied over a range , provided that the flow remains
* The British Standard, B.S. 1042 (Reference 2), defines a pressure difference, , across differential pressure devices. This is measuredbetween standardised points on or close to the device and is used only for flowmetering purposes. It is not the same as the pressure loss( ) referred to in this Item. Figure 1 shows a typical example of the measurement of the pressure difference, .
CK
CKp∆
½ρV 2---------------=
CK ReDa
m
h
∆p h
CK
ReDaCK
CK1 3 ReD ReDa⁄<⁄ 2<
8

ESD
U p
rodu
ct is
sue:
20
03
-03
. Fo
r cu
rren
t st
atus
, con
tact
ES
DU
. O
bser
ve C
opyr
ight
.
66030
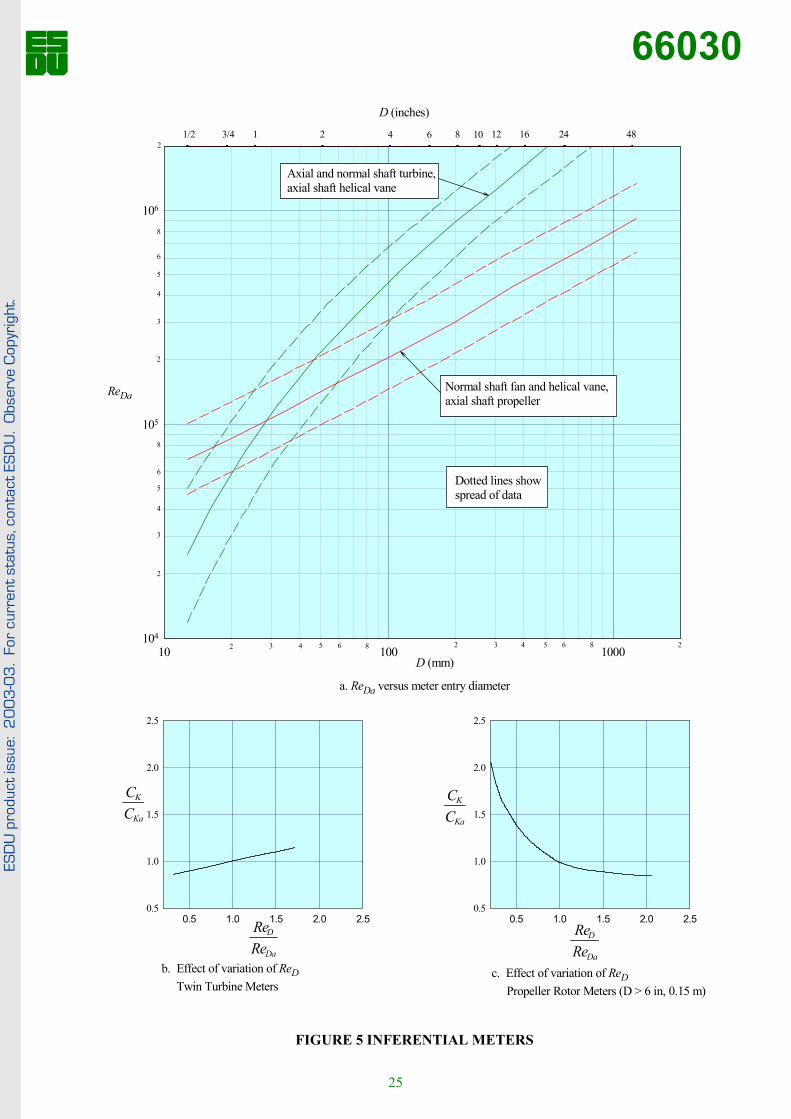
turbulent (i.e. approximately). For meters for which the variation of with is large(these are noted in Table 8.1), the effect may be allowed for by the use of the approximate curves in Figures5 and 7.NOTE: The curves given in Figures 4 to 7 indicate approximate average values only. The scatterbands shown cover most of the data available. For more precise information refer to a manufacturerof the meter of interest.
ReD 4 103×> CK ReD
9

ESD
U p
rodu
ct is
sue:
20
03
-03
. Fo
r cu
rren
t st
atus
, con
tact
ES
DU
. O
bser
ve C
opyr
ight
.
66030
6. REFERENCES1. LINFORD, A. Flow measurement and meters, 2nd Edition. E. and F. Spon Ltd, London,1961.
2. Methods for the measurement of fluid flow in pipes, Part 1. Orificeplates, nozzles and venturi tubes. B.S. 1042, Part 1. British StandardsInstitution, London, 1964.
10
ESD
U p
rodu
ct is
sue:
20
03
-03
. Fo
r cu
rren
t st
atus
, con
tact
ES
DU
. O
bser
ve C
opyr
ight
.
66030
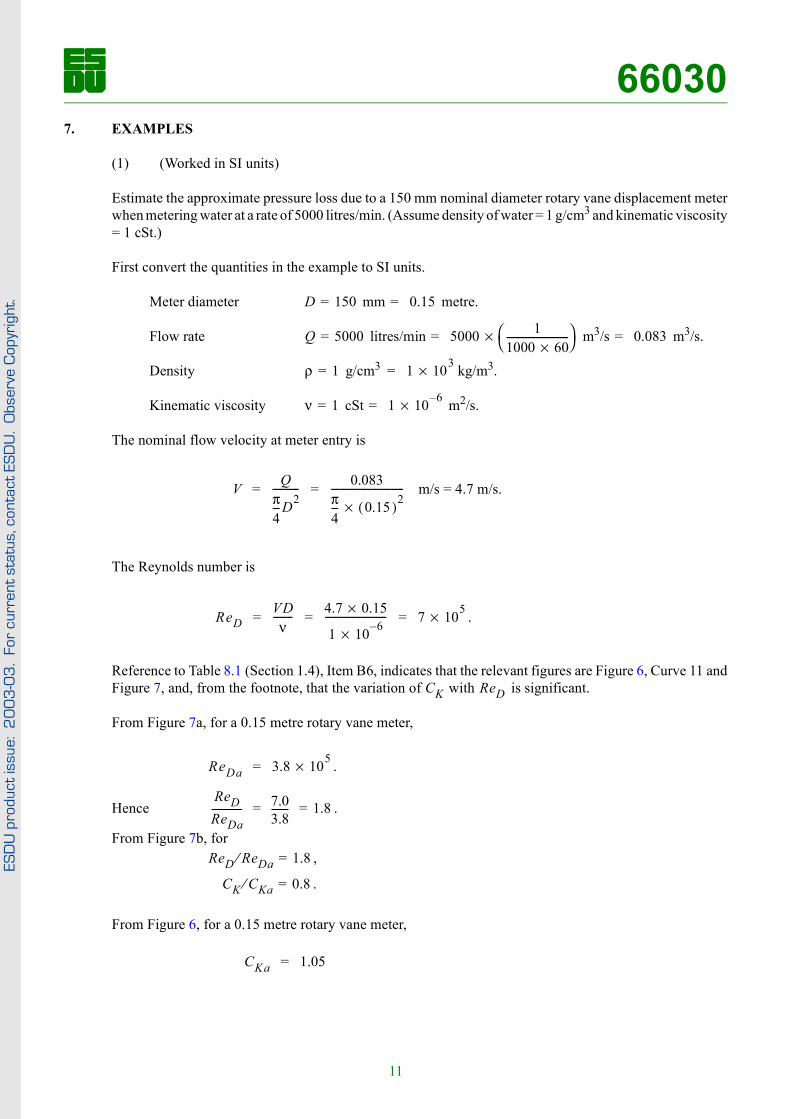
7. EXAMPLES(1) (Worked in SI units)
Estimate the approximate pressure loss due to a 150 mm nominal diameter rotary vane displacement meterwhen metering water at a rate of 5000 litres/min. (Assume density of water = 1 g/cm3 and kinematic viscosity= 1 cSt.)
First convert the quantities in the example to SI units.
Meter diameter mm metre.
Flow rate litres/min m3/s m3/s.
Density g/cm3 kg/m3.
Kinematic viscosity cSt m2/s.
The nominal flow velocity at meter entry is
m/s = 4.7 m/s.
The Reynolds number is
.
Reference to Table 8.1 (Section 1.4), Item B6, indicates that the relevant figures are Figure 6, Curve 11 andFigure 7, and, from the footnote, that the variation of with is significant.
From Figure 7a, for a 0.15 metre rotary vane meter,
.
Hence .
From Figure 7b, for,
.
From Figure 6, for a 0.15 metre rotary vane meter,
D 150= 0.15=
Q 5000= 5000 11000 60×-------------------------
×= 0.083=
ρ 1= 1 103×=
ν 1= 1 10 6–×=
V Qπ4---D2----------- 0.083
π4--- 0.15( )2×------------------------------= =
ReDVDν
-------- 4.7 0.15×
1 10 6–×------------------------- 7 105×= = =
CK ReD
ReDa 3.8 105×=
ReDReDa------------ 7.0
3.8------- 1.8= =
ReD ReDa⁄ 1.8=
CK CKa⁄ 0.8=
CKa 1.05=
11
ESD
U p
rodu
ct is
sue:
20
03
-03
. Fo
r cu
rren
t st
atus
, con
tact
ES
DU
. O
bser
ve C
opyr
ight
.
66030
(using the mean line), and thus.
The pressure loss is given by
N/m2
N/m2.
Thus the pressure loss due to the meter will be approximately 9300 N/m2.
(2) (Worked in British foot-pound-second units)
Estimate the probable head loss for a one inch rotary piston meter, metering kerosine at a flow rate of 1000UKgal/h. (Assume specific gravity of kerosine = 0.8 and the dynamic viscosity = 1.64 cP.) What is themaximum head loss for this meter at this flow rate likely to be?
First convert the quantities in the example to coherent foot-pound-second units.
Meter diameter inch ft ft.
Flow rate UKgal/h ft3/s ft3/s.
Assuming a density of 62.4 lb/ft3 for water, the density of kerosine is
lb/ft3.
Its dynamic viscosity is
cP pdl s/ft2 pdl s/ft2.
The nominal flow velocity at meter entry is
ft/s.
The Reynolds number is given by
.
CK 1.05 0.8 0.84=×=
p∆ ½ρV2CK=
½ 1 103×( )× 4.7( )×=2
0.84×9280=
D 1= = 112------ 0.083=
Q 1000= 100060
------------ 2.676 10 3–××= 0.045=
ρ 0.8 62.4× 49.9= =
µ 1.64= 1.64 671.97 10 6–××= 1.10 10 3–×=
V Qπ4---D2----------- 0.045
π4--- 0.083( )2------------------------- 8.3= = =
ReDρVD
µ------------ 49.9 8.3 0.083××
1.10 10 3–×----------------------------------------------- 3.1 104×= = =
12

ESD
U p
rodu
ct is
sue:
20
03
-03
. Fo
r cu
rren
t st
atus
, con
tact
ES
DU
. O
bser
ve C
opyr
ight
.
66030
Reference to Table 8.1 (Section 1.4), Item A1, indicates that the relevant figures are Figure 6, Curve 9 andFigure 7. Since the variation of with Reynolds number is not mentioned specifically it may be assumednegligible. It is necessary to check that the conditions and are satisfied,since the data only apply under these conditions.From Figure 7, ,
so that .
As and the data in this Item may be applied.
From Figure 6, for this meter, using the mean line. The head loss in feet of kerosine is given by
ft of kerosine.
Expressing this loss in feet of water,
head loss ft of water.
The likely maximum head loss under the specified conditions corresponds to the upper limit of the band, for which .
Therefore, the probable maximum head loss = 15.4 ft of water.
CKReD 4 103×> 1 3 ReD ReDa⁄<⁄ 2<
ReDa 4.5 104×=
ReDReDa------------- 3.1
4.5------- 0.69= =
ReD 4 103×> ReD ReDa⁄ 1 3⁄>
CK 9=
h∆ CK V2
2g------ 9 8.32×
2 32.2×--------------------- 9.6= = =
9.6 0.8× 7.7==
CKCK 18=
189
------ 7.7×=
13
ESD
U p
rodu
ct is
sue:
20
03
-03
. Fo
r cu
rren
t st
atus
, con
tact
ES
DU
. O
bser
ve C
opyr
ight
.
66030
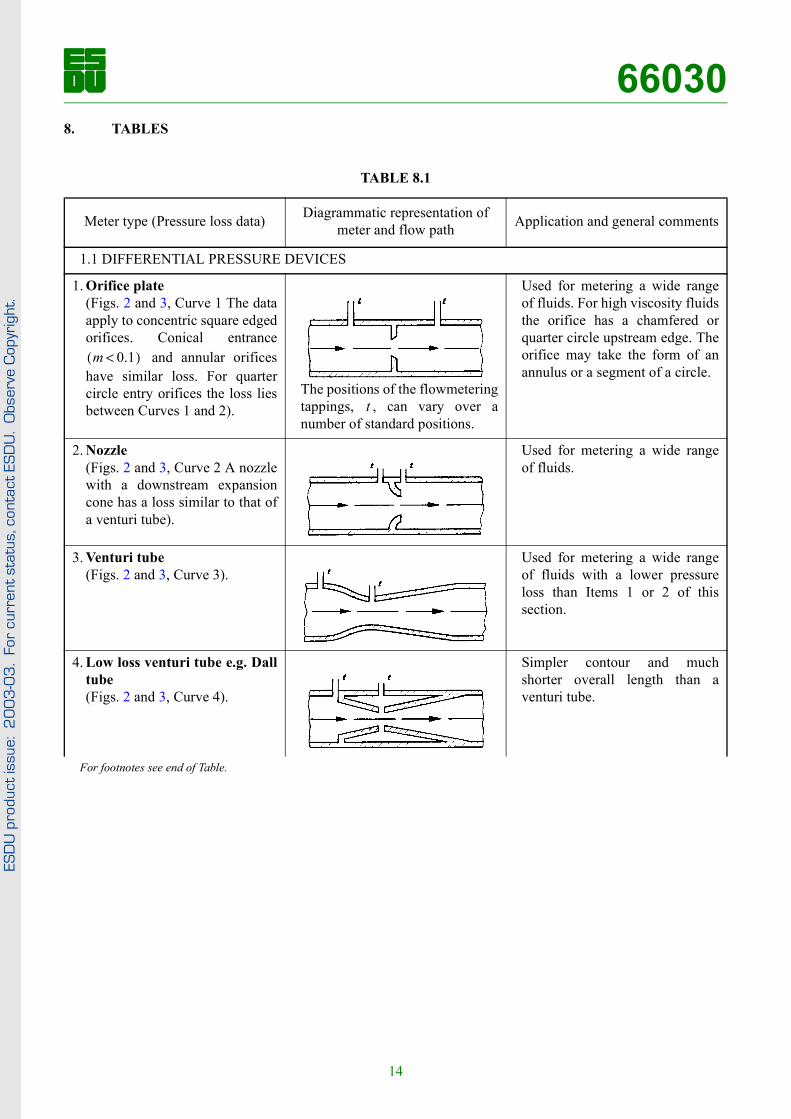
8. TABLESTABLE 8.1
Meter type (Pressure loss data) Diagrammatic representation of meter and flow path Application and general comments
1.1 DIFFERENTIAL PRESSURE DEVICES
1. Orifice plate(Figs. 2 and 3, Curve 1 The dataapply to concentric square edgedorifices. Conical entrance
and annular orificeshave similar loss. For quartercircle entry orifices the loss liesbetween Curves 1 and 2).
The positions of the flowmeteringtappings, , can vary over anumber of standard positions.
Used for metering a wide rangeof fluids. For high viscosity fluidsthe orifice has a chamfered orquarter circle upstream edge. Theorifice may take the form of anannulus or a segment of a circle.
2. Nozzle(Figs. 2 and 3, Curve 2 A nozzlewith a downstream expansioncone has a loss similar to that ofa venturi tube).
Used for metering a wide rangeof fluids.
3. Venturi tube(Figs. 2 and 3, Curve 3).
Used for metering a wide rangeof fluids with a lower pressureloss than Items 1 or 2 of thissection.
4. Low loss venturi tube e.g. Dalltube(Figs. 2 and 3, Curve 4).
Simpler contour and muchshorter overall length than aventuri tube.
For footnotes see end of Table.
m 0.1<( )
t
14
ESD
U p
rodu
ct is
sue:
20
03
-03
. Fo
r cu
rren
t st
atus
, con
tact
ES
DU
. O
bser
ve C
opyr
ight
.
66030
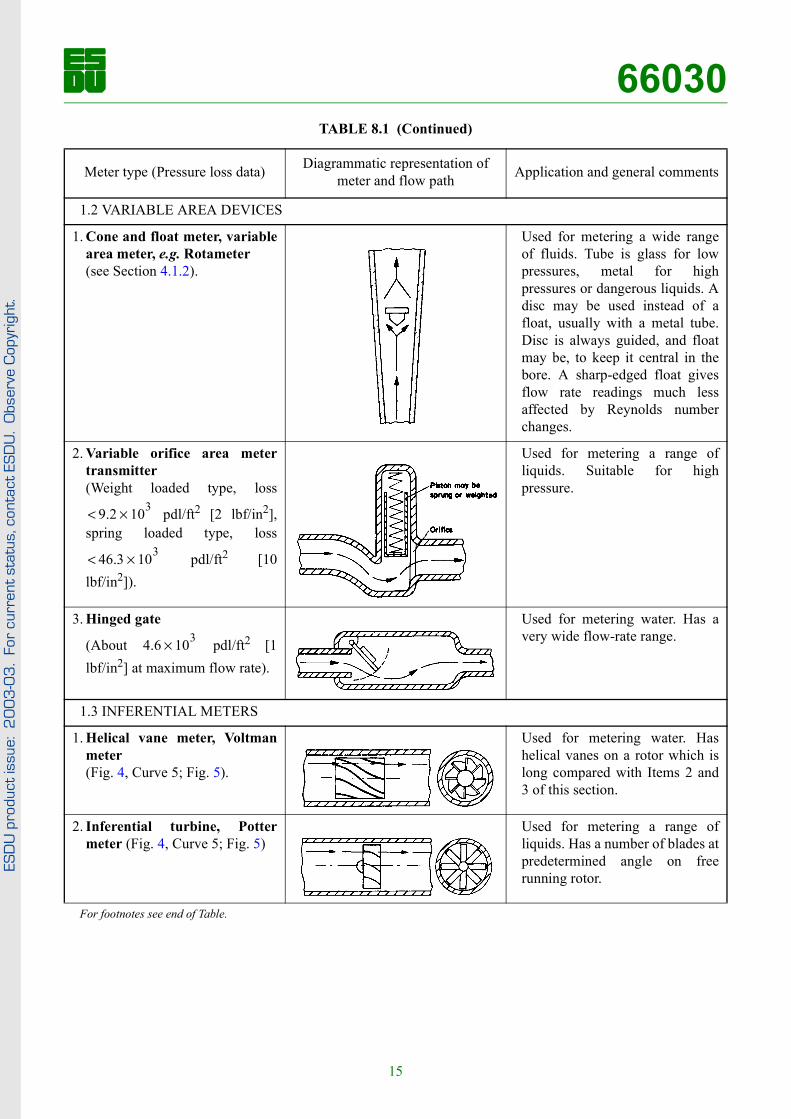
1.2 VARIABLE AREA DEVICES
1. Cone and float meter, variablearea meter, e.g. Rotameter(see Section 4.1.2).
Used for metering a wide rangeof fluids. Tube is glass for lowpressures, metal for highpressures or dangerous liquids. Adisc may be used instead of afloat, usually with a metal tube.Disc is always guided, and floatmay be, to keep it central in thebore. A sharp-edged float givesflow rate readings much lessaffected by Reynolds numberchanges.
2. Variable orifice area metertransmitter (Weight loaded type, loss
pdl/ft2 [2 lbf/in2],spring loaded type, loss
pdl/ft2 [10lbf/in2]).
Used for metering a range ofliquids. Suitable for highpressure.
3. Hinged gate
(About pdl/ft2 [1lbf/in2] at maximum flow rate).
Used for metering water. Has avery wide flow-rate range.
1.3 INFERENTIAL METERS
1. Helical vane meter, Voltmanmeter(Fig. 4, Curve 5; Fig. 5).
Used for metering water. Hashelical vanes on a rotor which islong compared with Items 2 and3 of this section.
2. Inferential turbine, Pottermeter (Fig. 4, Curve 5; Fig. 5)
Used for metering a range ofliquids. Has a number of blades atpredetermined angle on freerunning rotor.
TABLE 8.1 (Continued)
Meter type (Pressure loss data) Diagrammatic representation of meter and flow path Application and general comments
For footnotes see end of Table.
9.2 103×<
46.3 103×<
4.6 103×
15

ESD
U p
rodu
ct is
sue:
20
03
-03
. Fo
r cu
rren
t st
atus
, con
tact
ES
DU
. O
bser
ve C
opyr
ight
.
66030
3. Inferential propeller (Fig. 4, Curve 6; Fig. 5*).
Used for metering water. Has fewblades which are of coarse pitch.
4. Twin turbine meter(Fig. 4, Curve 7; Fig. 5†).
Used for metering water.Turbines are of opposite hand sothat end thrust is balanced.
5. Multijet fan wheel, single jetvane wheel, single jet fanwheel (Fig. 4, Curve 8; Fig. 5).
Used for metering water. Modelswith a single jet at entry and exitare available but the rotor is lesswell balanced in such types.
6. Vertical axis helical vanemeter (Similar to twin turbinemeter, Fig. 4, Curve 7; Fig. 5).
Used for metering water.
1.4 DISPLACEMENT METERS
A1Rotary piston meter,semi-rotary circular pistonmeter(Fig. 6, Curve 9; Fig. 7).
Used for metering a range ofliquids.
TABLE 8.1 (Continued)
Meter type (Pressure loss data) Diagrammatic representation of meter and flow path Application and general comments
For footnotes see end of Table.
16

ESD
U p
rodu
ct is
sue:
20
03
-03
. Fo
r cu
rren
t st
atus
, con
tact
ES
DU
. O
bser
ve C
opyr
ight
.
66030
A2Nutating piston meter,nutating disc meter(Fig. 6, Curve 9; Fig. 7.
Used for metering water, lowviscosity oils and chemicalproducts.
A3Piston type displacementmeter (commonly employingfour or five pistons), dry typegas meter(Fig .6, Curve 9; Fig. 7).
The pistons are usuallyinterconnected and each controlsthe valves on another cylinder.Gas meters normally use flexiblebellows instead of pistons andcylinders.
4-piston types are used formetering low viscosity liquids,5-piston types almost exclusivelyfor petrol. Volume delivered isvaried by varying the stroke ofthe piston. Dry gas meters areused for industrial and domesticgas supply metering.
B4Gear type displacementmeter(Fig.6, Curve 10; Fig. 7‡).
Used for bulk measurement ofgas flow.
B5Helix meter, birotor meter(Fig. 6, Curve 10; Fig. 7‡).
Used for bulk measurement ofpetroleum products and water.Helix meter may have two orthree rotors.
B6Vane type displacementmeter, rotary bladebulkmeter(Fig. 6, Curve 11; Fig. 7‡).
Used for bulk measurements ofpetroleum products.
TABLE 8.1 (Continued)
Meter type (Pressure loss data) Diagrammatic representation of meter and flow path Application and general comments
For footnotes see end of Table.
17

ESD
U p
rodu
ct is
sue:
20
03
-03
. Fo
r cu
rren
t st
atus
, con
tact
ES
DU
. O
bser
ve C
opyr
ight
.
66030
B7Wet type gas meter(About 93 pdl/ft2 [0.02 lbf/in2,0.5 in H20] at maximum flowrate)‡.
Used for laboratory measurementof gas flow. Sealing liquid isusually water.
2. MASS FLOWMETERS
1. True mass flowmeter, gyro-integrating mass flowmeter(Fig. 4, Curve 5; Fig. 5).
Used for metering a wide rangeof fluids, notably aircraft fuels.
2. Drag disc flowmeter (Depends on degree of blockagecaused by disc, usually
pdl/ft2 [0.5lbf/in2]).
Instrument reading approximatesto mass flow rate. Used foraircraft fuel supply metering.
3. Displacement mass flowmeter(Similar to correspondingvolumetric flowmeter).
Displacement meter with flowtype density compensation.
Indicates total flow but not flowrate. Used for aircraft fuel supplymetering.
4. Inferential mass flowmeter (Similar to correspondingvolumetric flowmeter).
Cone and float type flowmeterwith sharp-edged float of densitytwice that of the metered fluid.
Used for metering a range ofliquids. Compensates for up to 10per cent deviation from meandensity.
5. Turbine mass flowmeter (Similar to correspondingvolumetric flowmeter).
Turbine flowmeter with float typedensity compensation.
Used for industrial gas and liquidmetering.
3. OTHER TYPES OF FLOWMETER
1. Magnetic flowmeter,electromagnetic flowmeter (Loss can be made virtuallyzero).
Used for metering electricallyconducting fluids. The electrodesdetect the e.m.f. due to the flowof fluid normal to the magneticfield.
TABLE 8.1 (Continued)
Meter type (Pressure loss data) Diagrammatic representation of meter and flow path Application and general comments
For footnotes see end of Table.
2.3 103×<
18

ESD
U p
rodu
ct is
sue:
20
03
-03
. Fo
r cu
rren
t st
atus
, con
tact
ES
DU
. O
bser
ve C
opyr
ight
.
66030
2. Ultrasonic flowmeteringmethod(Loss can be made virtuallyzero).
Will meter a very wide range ofliquids. Pulses of sound areemitted with and against the flow.The velocity of flow is inferredfrom the phase difference of thesound pulses received.
3. Combination meter,compound meter (Loss depends on meteringcondition but is higher than foreither constituent meter due tothe valve and combiningpipework).
Used for water metering over avery wide flow range. The mainline flowmeter is commonly ofthe inferential type, the by-passmeter may be of the inferential ordisplacement type.
4. Shunt meter, by-pass meter (Loss is somewhat greater thanthe sum of the orifice loss andthe by-pass meter loss due to thedisturbance caused by thecombining pipework).
Commonly used for meteringwater, steam, air or gas. Usefulfor very high flow rates or wheremain pipe is inclined and by-passmeter is required to be horizontal.
* For propeller meters with entry diameter > 6 inches, varies significantly with .† For twin turbine meters, varies significantly with .‡ For type ‘B’ meters (B4 to B7 inclusive), varies significantly with .
TABLE 8.1 (Continued)
Meter type (Pressure loss data) Diagrammatic representation of meter and flow path Application and general comments
For footnotes see end of Table.
CK ReD
CK ReD
CK ReD
19
ESD
U p
rodu
ct is
sue:
20
03
-03
. Fo
r cu
rren
t st
atus
, con
tact
ES
DU
. O
bser
ve C
opyr
ight
.
66030
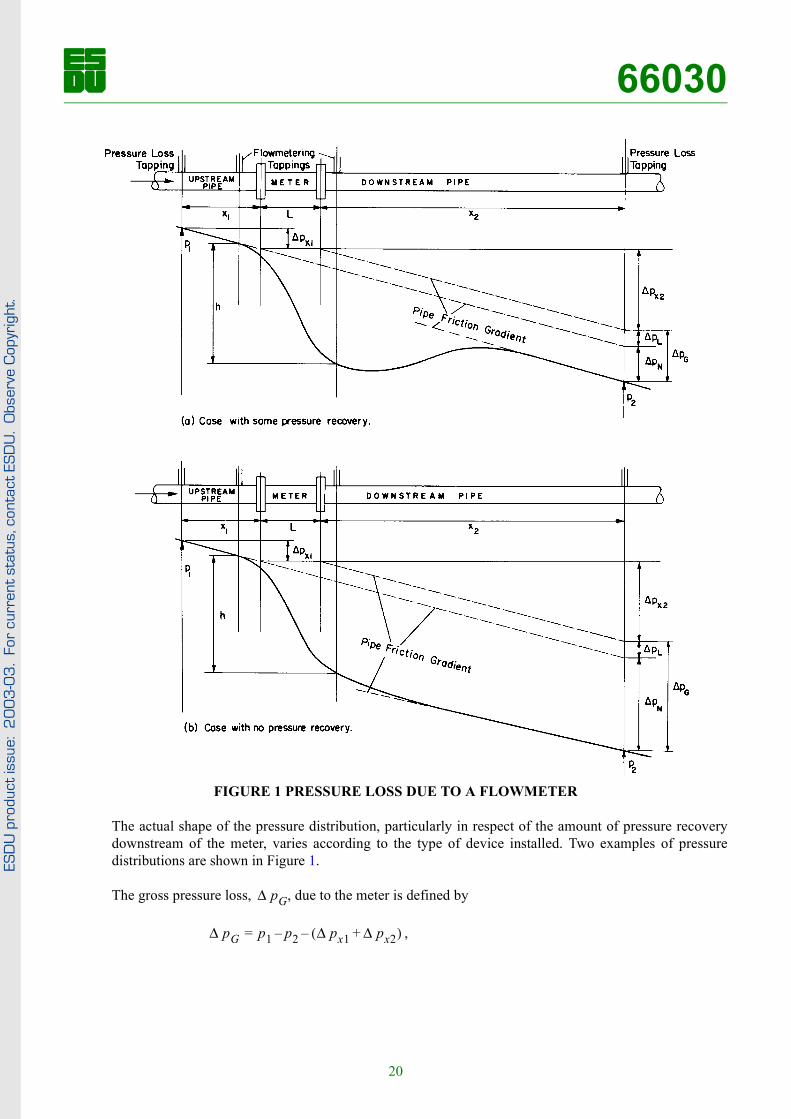
FIGURE 1 PRESSURE LOSS DUE TO A FLOWMETER
The actual shape of the pressure distribution, particularly in respect of the amount of pressure recoverydownstream of the meter, varies according to the type of device installed. Two examples of pressuredistributions are shown in Figure 1.
The gross pressure loss, , due to the meter is defined by
,
pG∆
pG∆ p1 p2– px1 px2∆+∆( )–=
20

ESD
U p
rodu
ct is
sue:
20
03
-03
. Fo
r cu
rren
t st
atus
, con
tact
ES
DU
. O
bser
ve C
opyr
ight
.
66030
and the net pressure loss, , by.
Here , and are the pressure losses due to friction for fully-developed flow in lengths ofplain pipe equal to , and .
pN∆
pN∆ pG pL∆–∆=
px1∆ px2∆ pL∆x1 x2 L
21

ESD
U p
rodu
ct is
sue:
20
03
-03
. Fo
r cu
rren
t st
atus
, con
tact
ES
DU
. O
bser
ve C
opyr
ight
.
66030
FIGURE 2 PRESSURE LOSS COEFFICIENT VERSUS AREA RATIO (DIFFERENTIAL PRESSURE DEVICES)
0.0 0.1 0.2 0.3 0.4 0.5 0.6 0.7
CK
2
3
4
5
6
7
89
2
3
4
5
6
789
2
3
4
5
6
7
89
2
3
4
5
6
7
89
10-1
100
101
102
103
(1) Orifice plates
(2) Nozzles
14-15B taper
5-7B taper
} (3) Venturi tubes and venturi nozzles(4) Dall tube
22

ESD
U p
rodu
ct is
sue:
20
03
-03
. Fo
r cu
rren
t st
atus
, con
tact
ES
DU
. O
bser
ve C
opyr
ight
.
66030
FIGURE 3 PRESSURE LOSS AS A PROPORTION OF FLOWMETERING PRESSURE DIFFERENCE VERSUS AREA RATIO (DIFFERENTIAL PRESSURE DEVICES)
0.0 0.1 0.2 0.3 0.4 0.5 0.6 0.7
∆h / h
0.0
0.1
0.2
0.3
0.4
0.5
0.6
0.7
0.8
0.9
1.0
(1) Orifice plates
(2) Nozzles
14-15B taper
5-7B taper
}(3) Venturi tubes and venturi nozzles(4) Dall tube
23
ESD
U p
rodu
ct is
sue:
20
03
-03
. Fo
r cu
rren
t st
atus
, con
tact
ES
DU
. O
bser
ve C
opyr
ight
.
66030
FIGURE 4 PRESSURE LOSS COEFFICIENT VERSUS METER ENTRY DIAMETER (INFERENTIAL METERS)
D (mm)
10 100 1000
Cka
0.1
1
10
2
3
4
8
5
6
2
3
4
8
5
6
2
3
4
5
3 4 5 62 8 3 4 5 62 8 2
Dotted lines showspread of data
(8) Fan, normal shaft
(7) Twin turbine, normal shaft
(5) Turbine, helical vane, axial shaft
(6) Propeller, axial shaft
1/2 1 2 4 6 8 10 12 163/4 24 48
D (inches)
24
ESD
U p
rodu
ct is
sue:
20
03
-03
. Fo
r cu
rren
t st
atus
, con
tact
ES
DU
. O
bser
ve C
opyr
ight
.
66030
FIGURE 5 INFERENTIAL METERS
D (mm)10 100 1000
ReDa
104
105
106
2
3
4
8
5
6
2
3
4
8
5
6
2
3 4 5 62 8 3 4 5 62 8 2
Dotted lines showspread of data
Axial and normal shaft turbine,axial shaft helical vane
Normal shaft fan and helical vane,axial shaft propeller
a. ReDa versus meter entry diameter
b. Effect of variation of ReD Twin Turbine Meters
0.5 1.0 1.5 2.0 2.50.5
1.0
1.5
2.0
2.5
CC
K
Ka
ReRe
D
Da
c. Effect of variation of ReD Propeller Rotor Meters (D > 6 in, 0.15 m)
0.5 1.0 1.5 2.0 2.50.5
1.0
1.5
2.0
2.5
CC
K
Ka
ReRe
D
Da
1/2 1 2 4 6 8 10 12 163/4 24 48
D (inches)
25

ESD
U p
rodu
ct is
sue:
20
03
-03
. Fo
r cu
rren
t st
atus
, con
tact
ES
DU
. O
bser
ve C
opyr
ight
.
66030
FIGURE 6 PRESSURE LOSS COEFFICIENT VERSUS METER ENTRY DIAMETER (DISPLACEMENT METERS)
D (mm)
10 100 1000
CKa
10-1
100
101
2
3
4
8
5
6
2
3
4
8
5
6
2
3 4 5 62 8 3 4 5 62 8 2
Dotted lines showspread of data
(9) Type A
(10) Type B Meshing rotor type
3
4
8
5
6
(11) Type B Vane type
1/2 1 2 4 6 8 10 12 163/4 24 48
D (inches)
26

ESD
U p
rodu
ct is
sue:
20
03
-03
. Fo
r cu
rren
t st
atus
, con
tact
ES
DU
. O
bser
ve C
opyr
ight
.
66030
FIGURE 7 DISPLACEMENT METERS
D (mm)
10 100 1000
ReDa
104
105
106
2
3
4
8
5
6
2
3
4
8
5
6
2
3 4 5 62 8 3 4 5 62 8 2
Dotted lines showspread of data
Type B
Type A
a. ReDa versus meter entry diameter
b. Effect of variation of ReD Rotary Vane Meters
0.5 1.0 1.5 2.0 2.50.5
1.0
1.5
2.0
2.5
CC
K
Ka
ReRe
D
Da
c. Effect of variation of ReD Meshing Rotor Meters
0.5 1.0 1.5 2.0 2.50.5
1.0
1.5
2.0
2.5
CC
K
Ka
ReRe
D
Da
1/2 1 2 4 6 8 12 163/4 24 48
D (inches)
27

ESD
U p
rodu
ct is
sue:
20
03
-03
. Fo
r cu
rren
t st
atus
, con
tact
ES
DU
. O
bser
ve C
opyr
ight
.
66030
THE DEVELOPMENT OF THIS DATA ITEMThe work of the Engineering Sciences Data Unit on this series is monitored and guided by TechnicalCommittees of the Institution of Mechanical Engineers. The Committee responsible for this particularMemorandum was the Fluid Mechanics and Thermodynamics Committee, which has the followingconstitution:
ChairmanProf. A.J. Ede – University of Aston in Birmingham
Vice-ChairmanMr E.C. Firman – Central Electricity Research Laboratories
MembersDr A.D. Carmichael – Imperial College of Science and TechnologyMr A.G. Chapman – Associated Electrical IndustriesMr M.D.C. Doyle – University of LiverpoolMr A. Linford – The British Hydromechanics Research AssociationDr D.L. Linning – United Kingdom Atomic Energy AuthorityMr G.J.F. Reid – British Petroleum Co. LtdMiss B. Shilling – Royal Aircraft Establishment.
The members of the staff of the Engineering Sciences Data Unit concerned were:
Mr A.J. Ward Smith – Head of Fluid Mechanics and Thermodynamics GroupMr B.C. Freeman – Fluid Mechanics and Thermodynamics Group.
28