esea directors institute 2014esea directors institute 2014 civil rights data collectioncivil rights...
TRANSCRIPT

ESEA Directors Institute 2014
Civil Rights Data CollectionThursday, October 9, 2014

2
Civil Rights Data Collection and OCR District and School Search Tool

3
The U.S. Department of Education (ED) conducts the Civil Rights Data Collection (CRDC), formerly the Elementary and Secondary School Survey (E&S Survey), to collect data on key education and civil rights issues in our nation's public schools. The CRDC collects a variety of information including, student enrollment and educational programs and services, disaggregated by race/ethnicity, sex, limited English proficiency and disability. The CRDC is an important aspect of the overall strategy for administering and enforcing the civil rights statutes for which it is responsible.
Civil Rights Data Collection (CRDC)

4
OCR has received Office of Management and Budget (OMB) approval to require every public school and school district in the country to respond to the 2013-14 CRDC. It includes most of the data items collected by the 2011-12 CRDC and a small number of new data items.
Required Participation

5

6
Data Snapshot: Early Childhood Education
Public preschool access not yet a reality for much of the nation• About 40% of school districts do not offer preschool programs.
Part-day preschool is offered more often than full-day• 57% of school districts that operate public preschool programs offer
only part-day preschool.
Limited universal access to preschool• Just over half of the school districts that operate public preschool
programs explicitly make such programs available to all students within the district.
Kindergarten retention disparities• Native-Hawaiian, other Pacific Islander, American Indian, and Native-
Alaskan kindergarten students are held back a year at nearly twice the rate of white kindergarten students.
• Boys represent 61% of kindergarteners retained.

7
Data Snapshot: College and Career Readiness
Limited access to high-level math and science courses• Nationwide, only 50% of high schools offer calculus and only
63% offer physics.
Significant lack of access to other core courses• Nationwide, between 10-25% of high schools do not offer more
than one of the core courses in the typical sequence of high school math and science education — such as Algebra I and II, geometry, biology, and chemistry.
8
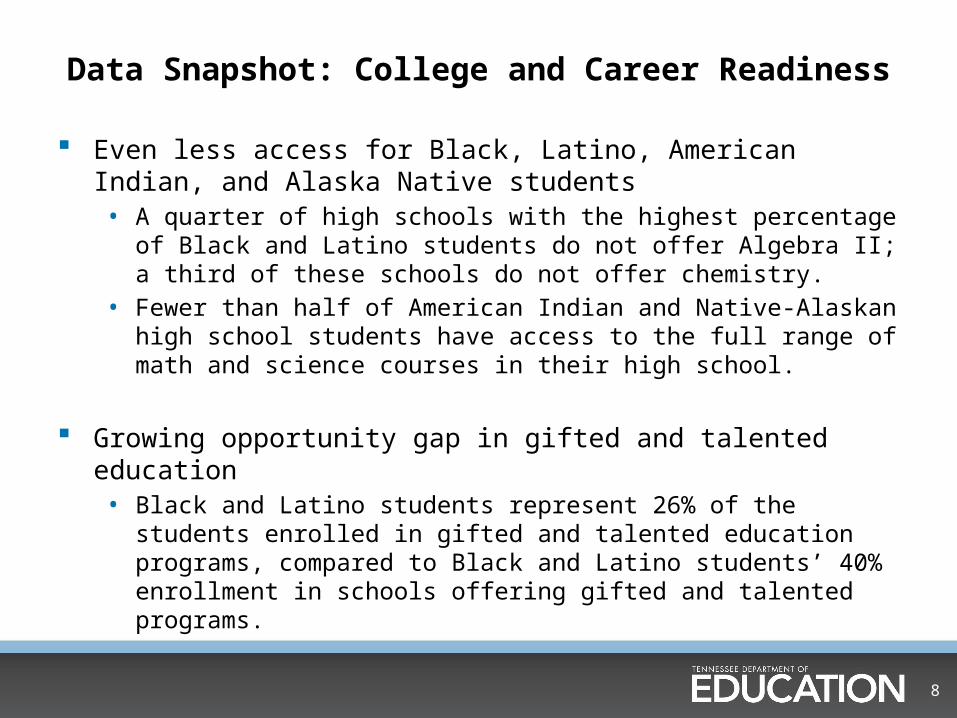
Even less access for Black, Latino, American Indian, and Alaska Native students• A quarter of high schools with the highest percentage of Black
and Latino students do not offer Algebra II; a third of these schools do not offer chemistry.
• Fewer than half of American Indian and Native-Alaskan high school students have access to the full range of math and science courses in their high school.
Growing opportunity gap in gifted and talented education• Black and Latino students represent 26% of the students
enrolled in gifted and talented education programs, compared to Black and Latino students’ 40% enrollment in schools offering gifted and talented programs.
Data Snapshot: College and Career Readiness

9
Data Snapshot: School Discipline
Disproportionately high suspension/expulsion rates for students of color• Black students are suspended and expelled at a rate three times
greater than white students. • On average, 5% of white students are suspended, compared to 16%
of Black students. • American Indian and Native-Alaskan students are also
disproportionately suspended and expelled, representing less than 1% of the student population but 2% of out-of-school suspensions and 3% of expulsions.
Disproportionate suspensions of girls of color• While boys receive more than two out of three suspensions, Black
girls are suspended at higher rates (12%) than girls of any other race or ethnicity and most boys.
• American Indian and Native-Alaskan girls (7%) are suspended at higher rates than white boys (6%) or girls (2%).

10
Suspension of students with disabilities and English learners• Students with disabilities are more than twice as likely to
receive an out-of-school suspension (13%) than students without disabilities (6%).
• English learners do not receive out-of-school suspensions at disproportionately high rates (7% suspension rate, compared to 10% of student enrollment).
Data Snapshot: School Discipline
11
Data Snapshot: Teacher Equity
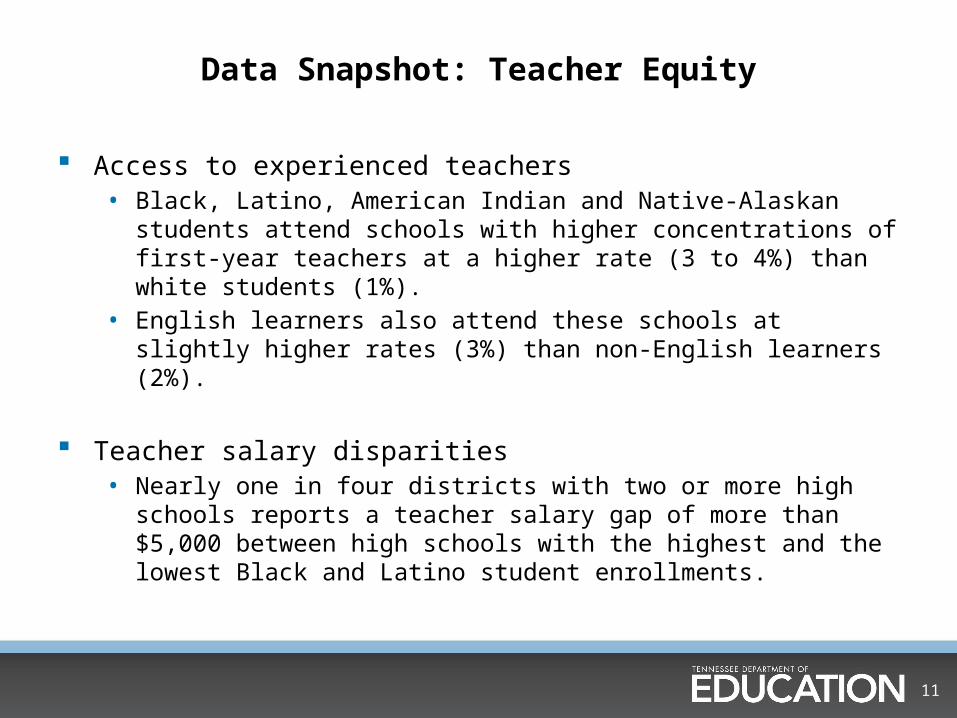
Access to experienced teachers• Black, Latino, American Indian and Native-Alaskan students
attend schools with higher concentrations of first-year teachers at a higher rate (3 to 4%) than white students (1%).
• English learners also attend these schools at slightly higher rates (3%) than non-English learners (2%).
Teacher salary disparities• Nearly one in four districts with two or more high schools
reports a teacher salary gap of more than $5,000 between high schools with the highest and the lowest Black and Latino student enrollments.

12
Access to certified teachers• Nearly half a million students nationwide attend schools where
60% or fewer of teachers meet all state certification and licensure requirements.
• Nearly 7% of the nation’s Black students – totaling over half a million students – attend schools where 80% or fewer of teachers meet these requirements; Black students are more than four times as likely, and Latino students twice as likely, as white students to attend these schools.
Access to school counselors• Nationwide, one in five high schools lacks a school counselor
Data Snapshot: Teacher Equity

13
In 2012, 21% of school-aged children were living in poverty (23k or less for a family of 4).• Black – 39%• Latino 33%• Indian/Native American – 36%
Gaps are shrinking for some groups but remain large for ELL and SWD.• ELL gaps in both reading and math have remained constant over the
past 15 years.• SWD gaps have actually increased over the past 5 years
CRDC includes data from every public school, including preschool, alternative schools, career and tech schools, and charters.
Achievement and Opportunity Gaps

14
District and School Data
LEA/School Characteristics and Membership
Staffing and Finance
Pathways to College and Career Readiness
College and Career Readiness
Discipline, Restraints/Seclusion, Harassment/Bullying
15
Custom Charts and Detailed Data Fields• Years available 2000, 2004, 2006, 2009, 2011
State and National Estimations
Additional Resources
FAQs/User Guide
Office for Civil Rights (OCR)
Additional Search Options

16
Civil Rights Data Collection
School and District Searchhttp://ocrdata.ed.gov/
Available survey year data 2009 and 2011


18
FRAUD, WASTE or ABUSE
Citizens and agencies are encouraged to report fraud, waste or abuse in State and Local government.
NOTICE: This agency is a recipient of taxpayer funding. If you observe an agency director or employee engaging in any activity which you consider to be illegal, improper or wasteful, please call the state Comptroller’s toll-free
Hotline:
1-800-232-5454
Notifications can also be submitted electronically at:
http://www.comptroller.tn.gov/hotline
