esg bond market · 3b, 3c) affordable basic infrastructure (3.6) pollution prevention and control...
TRANSCRIPT

This document is intended for institutional investors and is not subject to all of the independence and disclosure standards applicable to debt research reports prepared for retail investors. This report may not be independent of BBVA or its affiliates’ proprietary trading interests. BBVA or its affiliates trade in the securities in this report for their own account(s) and on a discretionary basis on behalf of certain clients. Such trading interests may be contrary to the recommendation(s) offered in this report.
PLEASE SEE IMPORTANT DISCLOSURES ON THE LAST SIX PAGES OF THIS REPORT.
ESG Bond Market Key topics and trends for 2019 and beyond – getting the harmony right
Michael Gaynor – [email protected] – +44 (0) 207 648 7555 Financials, Covered Bonds & ESG Bonds
Agustín Martín – [email protected] – +44 (0) 207 397 6087 Head of European Credit Research, Public Sector & Covered Bonds
London, 23 July 2019 (12:00 CET)
ESG Bond Market / 2
PLEASE SEE IMPORTANT DISCLOSURES ON THE LAST SIX PAGES OF THIS REPORT.
Index
01 Introducing the ESG bond market: Defining ESG Asset class evolution Green bond principles UN SDGs
02 Market overview and dynamics: Primary market, profile of issuers and issuances Secondary market, enhanced performance from green?
04 Key topics and developments in ESG bond market: Greenium Transition bonds Millennial impact PG&E Case Study
03 Policy and regulatory developments in the EU green bond market: EU Taxonomy Green Bond Standard Benchmarking and Disclosure regulations
ESG Bond Market / 3
PLEASE SEE IMPORTANT DISCLOSURES ON THE LAST SIX PAGES OF THIS REPORT.
01 Introducing the ESG bond market
ESG Bond Market / 4
PLEASE SEE IMPORTANT DISCLOSURES ON THE LAST SIX PAGES OF THIS REPORT.
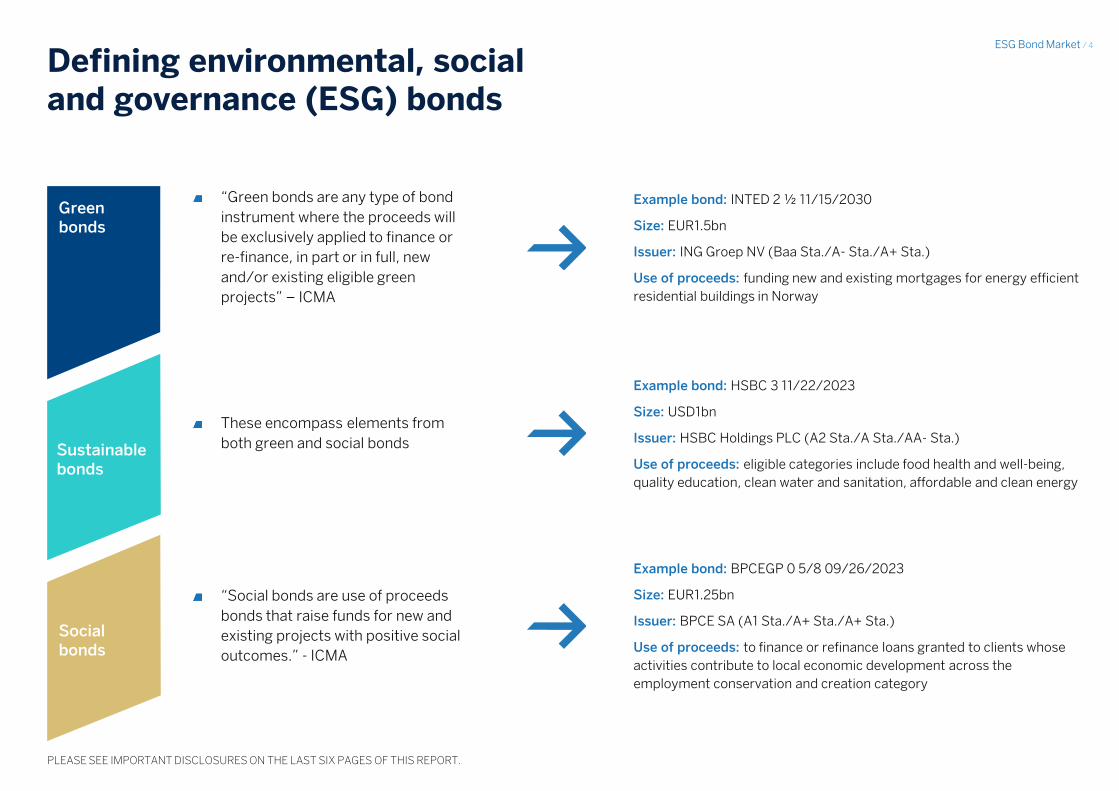
Defining environmental, social and governance (ESG) bonds
Green bonds
Social bonds
“Green bonds are any type of bond
instrument where the proceeds will
be exclusively applied to finance or
re-finance, in part or in full, new
and/or existing eligible green
projects” – ICMA
Example bond: INTED 2 ½ 11/15/2030
Size: EUR1.5bn
Issuer: ING Groep NV (Baa Sta./A- Sta./A+ Sta.)
Use of proceeds: funding new and existing mortgages for energy efficient
residential buildings in Norway
These encompass elements from
both green and social bonds
Example bond: HSBC 3 11/22/2023
Size: USD1bn
Issuer: HSBC Holdings PLC (A2 Sta./A Sta./AA- Sta.)
Use of proceeds: eligible categories include food health and well-being,
quality education, clean water and sanitation, affordable and clean energy
“Social bonds are use of proceeds
bonds that raise funds for new and
existing projects with positive social
outcomes.” - ICMA
Example bond: BPCEGP 0 5/8 09/26/2023
Size: EUR1.25bn
Issuer: BPCE SA (A1 Sta./A+ Sta./A+ Sta.)
Use of proceeds: to finance or refinance loans granted to clients whose
activities contribute to local economic development across the
employment conservation and creation category
Sustainable bonds

ESG Bond Market / 5
PLEASE SEE IMPORTANT DISCLOSURES ON THE LAST SIX PAGES OF THIS REPORT.
Development of the asset class
2007 Primary issuance
2008-12 Market discovery
2013-14 Catalyst for private issuances
2015-17 Growth of the market
2018- Complexity and standardisation
Investor and issuer interest was piqued thanks to the Paris Climate Agreement, with sovereign commitments and corporate pledges to this market. Phenomena including natural disasters related to an unusually intense hurricane season also kept the media focus on the issue of climate change.
Knowing what a green product looks like means that investors can scale their interest, which, in turn, encourages issuers to target these investors, as can be seen in heightened investor diversification.
This set the scene for record growth in 2014-17 in line with our expectations of USD150-180bn.
Moving past what a green product looks like, the market moved on to actually defining what green is.
This requires a reference to science-based taxonomies such as the EU Taxonomy and increasing specialisation in order to avoid green-washing or misdirected green capital.
Divergent global standards either converge to make a scalable global product or remain regionalised with divergent investor-driven liquidity and interest.
The market reaches its next ‘inflexion point’ whereby tightened green standards either consolidate credibility in the product or lead to cost spirals and a reduced incentive to issue.
Such a fine line probably requires both a bottom-up approach from the market (like ICMA) and a top-down regulatory standard in order to ensure compliance with what could simply be voluntary criteria, which if not adhered to, could remove credibility from the market, owing to disengagement with the product and reneging on commitments.
The European Investment Bank (EIB) releases its Climate Awareness Bond as a test issuance.
This provided a playbook to be demonstrated to other issuers.
Supranationals continue to issue green bonds, although neither the definition nor naming conventions are fixed.
This is part of their capital market development programme.
Outside the supranational sector, there are no takers for the market because it is not clear how private issuers gain from such issuance.
This occurred in green bonds with the release of the green bond principles (GBP), which allowed issuers to define the features of a green bond, with a particular focus on transparency (use of proceeds and reporting) and governance (management of proceeds and impact assessment).
ESG Bond Market / 6
PLEASE SEE IMPORTANT DISCLOSURES ON THE LAST SIX PAGES OF THIS REPORT.
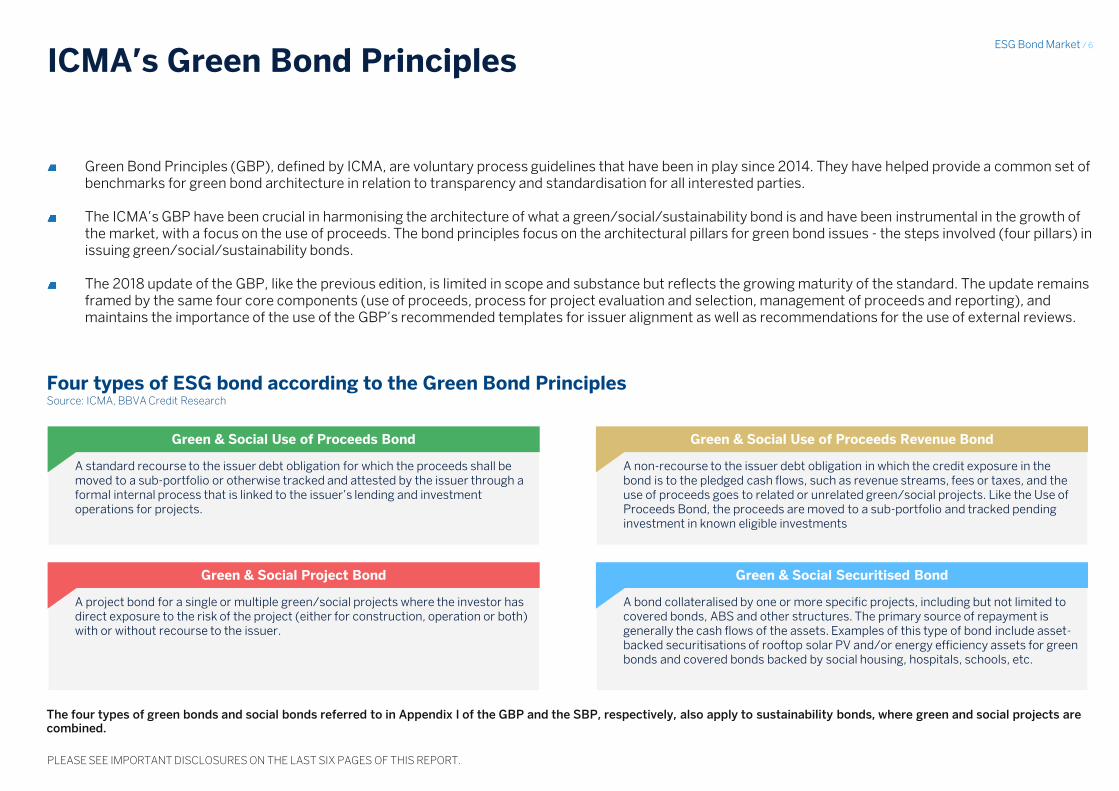
ICMA’s Green Bond Principles
Green Bond Principles (GBP), defined by ICMA, are voluntary process guidelines that have been in play since 2014. They have helped provide a common set of benchmarks for green bond architecture in relation to transparency and standardisation for all interested parties. The ICMA’s GBP have been crucial in harmonising the architecture of what a green/social/sustainability bond is and have been instrumental in the growth of the market, with a focus on the use of proceeds. The bond principles focus on the architectural pillars for green bond issues - the steps involved (four pillars) in issuing green/social/sustainability bonds. The 2018 update of the GBP, like the previous edition, is limited in scope and substance but reflects the growing maturity of the standard. The update remains framed by the same four core components (use of proceeds, process for project evaluation and selection, management of proceeds and reporting), and maintains the importance of the use of the GBP’s recommended templates for issuer alignment as well as recommendations for the use of external reviews.
Four types of ESG bond according to the Green Bond Principles Source: ICMA, BBVA Credit Research
The four types of green bonds and social bonds referred to in Appendix I of the GBP and the SBP, respectively, also apply to sustainability bonds, where green and social projects are combined.
A standard recourse to the issuer debt obligation for which the proceeds shall be moved to a sub-portfolio or otherwise tracked and attested by the issuer through a formal internal process that is linked to the issuer’s lending and investment operations for projects.
A project bond for a single or multiple green/social projects where the investor has direct exposure to the risk of the project (either for construction, operation or both) with or without recourse to the issuer.
Green & Social Project Bond
Green & Social Use of Proceeds Bond
A bond collateralised by one or more specific projects, including but not limited to covered bonds, ABS and other structures. The primary source of repayment is generally the cash flows of the assets. Examples of this type of bond include asset-backed securitisations of rooftop solar PV and/or energy efficiency assets for green bonds and covered bonds backed by social housing, hospitals, schools, etc.
Green & Social Securitised Bond
A non-recourse to the issuer debt obligation in which the credit exposure in the bond is to the pledged cash flows, such as revenue streams, fees or taxes, and the use of proceeds goes to related or unrelated green/social projects. Like the Use of Proceeds Bond, the proceeds are moved to a sub-portfolio and tracked pending investment in known eligible investments
Green & Social Use of Proceeds Revenue Bond
ESG Bond Market / 7
PLEASE SEE IMPORTANT DISCLOSURES ON THE LAST SIX PAGES OF THIS REPORT.
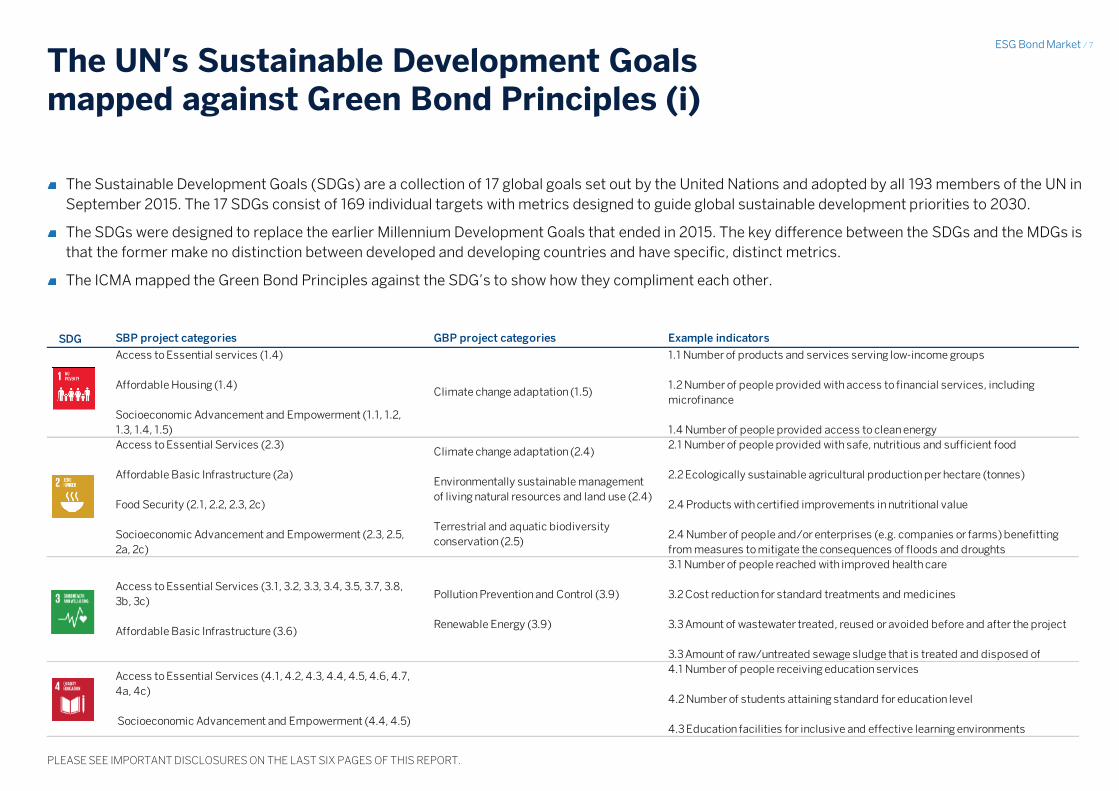
The UN’s Sustainable Development Goals mapped against Green Bond Principles (i)
The Sustainable Development Goals (SDGs) are a collection of 17 global goals set out by the United Nations and adopted by all 193 members of the UN in
September 2015. The 17 SDGs consist of 169 individual targets with metrics designed to guide global sustainable development priorities to 2030.
The SDGs were designed to replace the earlier Millennium Development Goals that ended in 2015. The key difference between the SDGs and the MDGs is
that the former make no distinction between developed and developing countries and have specific, distinct metrics.
The ICMA mapped the Green Bond Principles against the SDG’s to show how they compliment each other.
Source: MG_Green bonds 2019_graficos y tablas Hoja: Slide 4 y 5 Cell: B2
SDG SBP project categories GBP project categories Example indicators
Access to Essential services (1.4)
Affordable Housing (1.4)
Socioeconomic Advancement and Empowerment (1.1, 1.2,
1.3, 1.4, 1.5)
Climate change adaptation (1.5)
1.1 Number of products and services serving low-income groups
1.2 Number of people provided with access to financial services, including
microfinance
1.4 Number of people provided access to clean energy
Access to Essential Services (2.3)
Affordable Basic Infrastructure (2a)
Food Security (2.1, 2.2, 2.3, 2c)
Socioeconomic Advancement and Empowerment (2.3, 2.5,
2a, 2c)
Climate change adaptation (2.4)
Environmentally sustainable management
of living natural resources and land use (2.4)
Terrestrial and aquatic biodiversity
conservation (2.5)
2.1 Number of people provided with safe, nutritious and sufficient food
2.2 Ecologically sustainable agricultural production per hectare (tonnes)
2.4 Products with certified improvements in nutritional value
2.4 Number of people and/or enterprises (e.g. companies or farms) benefitting
from measures to mitigate the consequences of floods and droughts
Access to Essential Services (3.1, 3.2, 3.3, 3.4, 3.5, 3.7, 3.8,
3b, 3c)
Affordable Basic Infrastructure (3.6)
Pollution Prevention and Control (3.9)
Renewable Energy (3.9)
3.1 Number of people reached with improved health care
3.2 Cost reduction for standard treatments and medicines
3.3 Amount of wastewater treated, reused or avoided before and after the project
3.3 Amount of raw/untreated sewage sludge that is treated and disposed of
Access to Essential Services (4.1, 4.2, 4.3, 4.4, 4.5, 4.6, 4.7,
4a, 4c)
Socioeconomic Advancement and Empowerment (4.4, 4.5)
4.1 Number of people receiving education services
4.2 Number of students attaining standard for education level
4.3 Education facilities for inclusive and effective learning environments

ESG Bond Market / 8
PLEASE SEE IMPORTANT DISCLOSURES ON THE LAST SIX PAGES OF THIS REPORT.
Source: MG_Green bonds 2019_graficos y tablas Hoja: Slide 4 y 5 Cell: G9
Source: MG_Green bonds 2019_graficos y tablas Hoja: Slide 4 y 5 Cell: G15
The UN’s Sustainable Development Goals mapped against Green Bond Principles (ii)
SDG SBP project categories GBP project categories Example indicators
Access to Essential Services (5.4)
Socioeconomic Advancement and Empowerment (5.1, 5.4,
5.5, 5b)
5.1 Number of equal paying jobs created for women and other under-represented
gender groups
5b. Number of women using technology products
Affordable Basic
Infrastructure (6.1, 6.2, 6.3, 6.4, 6b)
Sustainable Water and Waste Water
Management (6.1, 6.2, 6.3, 6.4, 6.5, 6a, 6b)
Terrestrial and Aquatic Biodiversity
Conservation (6.6)
6.1 Number of people provided with safe and affordable drinking water
6.2 Number of people provided with adequate and equitable sanitation
6.3 Volume of water saved
6.4 Volume of wastewater treated for reuse
6.6 Area covered by sustainable land and water resources management practices
Affordable Basic Infrastructure (7.1, 7b)
Energy Efficiency (7.3, 7a)
Renewable Energy (7.2, 7a)
7.1 Renewable energy produced
7.2 Avoided greenhouse gas emissions (tonnes CO2 eq)
7.3 Number of people with access to clean energy services
Access to Essential Services (8.3, 8.6, 8.10)
Employment Generation (8.2, 8.3, 8.5, 8.6, 8.9)
Socioeconomic Advancement and Empowerment (8.3, 8.5,
8.6, 8.7, 8.8)
Eco-efficient and/or Circular Economy
Adapted Products, Production Technologies
and Processes (8.4)
Energy Efficiency (8.4)
Renewable Energy (8.2)
8.1 Number of loans, deposits or insurance products in line with SDGs or number
of people provided these
8.2 Number of jobs created
8.3 Number of jobs retained
Access to Essential Services (9.3, 9c)
Affordable Basic Infrastructure (9.1, 9a, 9c)
Employment Generation (9.2)
Energy Efficiency (9.4)
Renewable Energy (9.1)
9.1 Length of sustainable road construction with equitable access
9.2 Length of rail construction
9.3 Number of first-time internet connections
9.4 R&D expenditure in line with SDGs as % of sales
Access to Essential Services (10c)
Socioeconomic Advancement and Empowerment (10.1, 10.2,
10.3, 10.7)
10.1 Number of jobs created in low-income areas, among disadvantaged groups
and other target populations
10.2 Number of local SME suppliers and smallholder farmers in supply chain
ESG Bond Market / 9
PLEASE SEE IMPORTANT DISCLOSURES ON THE LAST SIX PAGES OF THIS REPORT.
Source: MG_Green bonds 2019_graficos y tablas Hoja: Slide 4 y 5 Cell: G9
Source: MG_Green bonds 2019_graficos y tablas Hoja: Slide 4 y 5 Cell: G15
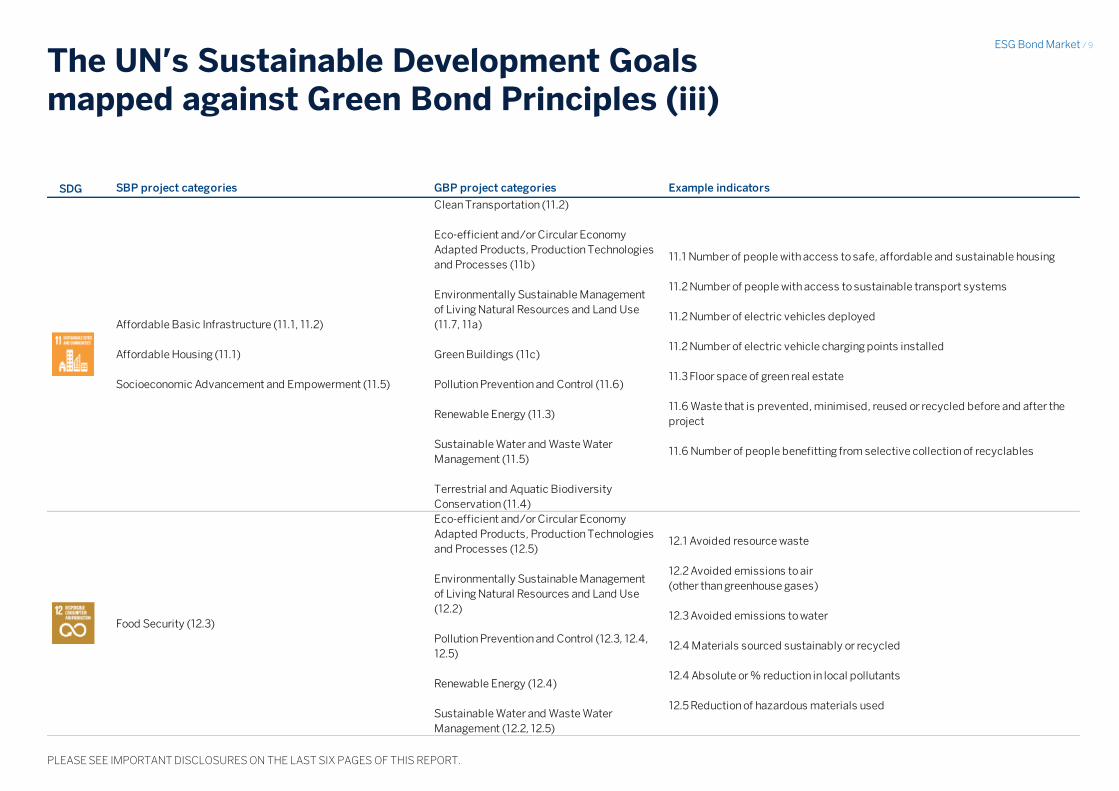
The UN’s Sustainable Development Goals mapped against Green Bond Principles (iii)
SDG SBP project categories GBP project categories Example indicators
Affordable Basic Infrastructure (11.1, 11.2)
Affordable Housing (11.1)
Socioeconomic Advancement and Empowerment (11.5)
Clean Transportation (11.2)
Eco-efficient and/or Circular Economy
Adapted Products, Production Technologies
and Processes (11b)
Environmentally Sustainable Management
of Living Natural Resources and Land Use
(11.7, 11a)
Green Buildings (11c)
Pollution Prevention and Control (11.6)
Renewable Energy (11.3)
Sustainable Water and Waste Water
Management (11.5)
Terrestrial and Aquatic Biodiversity
Conservation (11.4)
11.1 Number of people with access to safe, affordable and sustainable housing
11.2 Number of people with access to sustainable transport systems
11.2 Number of electric vehicles deployed
11.2 Number of electric vehicle charging points installed
11.3 Floor space of green real estate
11.6 Waste that is prevented, minimised, reused or recycled before and after the
project
11.6 Number of people benefitting from selective collection of recyclables
Food Security (12.3)
Eco-efficient and/or Circular Economy
Adapted Products, Production Technologies
and Processes (12.5)
Environmentally Sustainable Management
of Living Natural Resources and Land Use
(12.2)
Pollution Prevention and Control (12.3, 12.4,
12.5)
Renewable Energy (12.4)
Sustainable Water and Waste Water
Management (12.2, 12.5)
12.1 Avoided resource waste
12.2 Avoided emissions to air
(other than greenhouse gases)
12.3 Avoided emissions to water
12.4 Materials sourced sustainably or recycled
12.4 Absolute or % reduction in local pollutants
12.5 Reduction of hazardous materials used

ESG Bond Market / 10
PLEASE SEE IMPORTANT DISCLOSURES ON THE LAST SIX PAGES OF THIS REPORT.
Source: MG_Green bonds 2019_graficos y tablas Hoja: Slide 4 y 5 Cell: G9
Source: MG_Green bonds 2019_graficos y tablas Hoja: Slide 4 y 5 Cell: G15
The UN’s Sustainable Development Goals mapped against Green Bond Principles (iv)
SDG SBP project categories GBP project categories Example indicators
Climate Change Adaptation (13.1, 13.2, 13.3,
13b)
Climate Change Mitigation (13.1, 13.3)
Renewable Energy (13.1)
13.1 Water storage capacity
13.1 Reduction in weather-related disruption (days p.a.). and/or risk frequency
(%)
13.2 Flood-resilient floor space
13.3 High-risk assets with climate insurance cover
Socioeconomic Advancement and Empowerment (14b)
Environmentally Sustainable Management
of Living Natural Resources and Land Use
(14.4, 14.6, 14a, 14b)
Terrestrial and Aquatic Biodiversity
Conservation (14.1, 14.2, 14.3, 14.5, 14.6,
14a)
14.1 Avoided or reduced marine and fresh water pollution
(ecotoxicity, eutrophication)
14.2 Biodiversity loss avoided or reduced (# of species)
Environmentally Sustainable Management
of Living Natural Resources and Land Use
(15.7, 15.8, 15a, 15c)
Terrestrial and Aquatic Biodiversity
Conservation (15.1, 15.2, 15.3, 15.4, 15.5, 15b)
15.1 Avoidance or reduction of land pollution (ecotoxicity, acidification,
salinization, transformation)
15.2 Avoidance or reduction of biodiversity loss (# of species)
15.3 Certified afforested or reforested land
15.3 Area covered by sustainable land and water resources management practices
ESG Bond Market / 11
PLEASE SEE IMPORTANT DISCLOSURES ON THE LAST SIX PAGES OF THIS REPORT.
02 Market overview and dynamics

ESG Bond Market / 12
PLEASE SEE IMPORTANT DISCLOSURES ON THE LAST SIX PAGES OF THIS REPORT.
ESG bond market highlights
USD584bn
The current size of the green,
social and sustainable bond
market is USD584bn, or
c.0.5% of total global
outstanding bonds (as of 30
June 2019).
The percentage of green, social
and sustainable bond issuance
versus total bond issuance has
continued to increase to an
average of 2.6% in 2018 vs.
2% in 2017, despite the
reduction in issuance of ESG
bonds in 2018.
USD168bn USD220bn USD45bn
2018 saw USD168bn of
issuance of green, social and
sustainable bonds, a reduction
of USD5bn (2.7%) from 2017
peak issuance of USD173bn.
This decrease is generally in line
with global bond issuance
dynamics, as market
conditions deteriorated,
especially in the countries that
dominate green bond issuance.
Nonetheless, the market
continued to mature, with a
more diverse basket of
issuers coming to the market
and increased issuance of
social and sustainable-
labelled bonds.
We expect that 2019 issuance
of ESG bonds will reach
USD220bn.
The market should continue to
diversify as more first-time
issuers come to the market and
explore the use of social and
sustainable-labelled bonds as
well as green bonds; however,
green-labelled bonds will
continue to dominate issuance.
European utilities will continue
to dominate European
corporate issuance, as seen this
year with Telefonica’s (Baa3
Sta./BBB Sta./BBB Sta.)
inaugural EUR1bn green bond
issued on 28 January 2019.
The contribution from new
sovereign issuers will be key in
the continued development of
the asset class with c.USD45bn
issued as of June 2019.
The Netherlands issued its
c.EUR6bn debut green bond in
May 2019, one of the highlight
issuances of the year so far.
The Swedish Debt Office plans
to carry out a trial green bond
issuance at some point in 2020.
Following the release of the EU
Taxonomy, representatives
from both Portugal and Italy
announced that they are
considering issuing green
bonds in the future.
We saw a further maturing of the ESG bond market in 2018, despite reduced issuance volumes. The size of the ESG bond market is now equivalent to 0.5% of total global outstanding bonds, but it is increasing as the market grows.
ESG Bond Market / 13
PLEASE SEE IMPORTANT DISCLOSURES ON THE LAST SIX PAGES OF THIS REPORT.
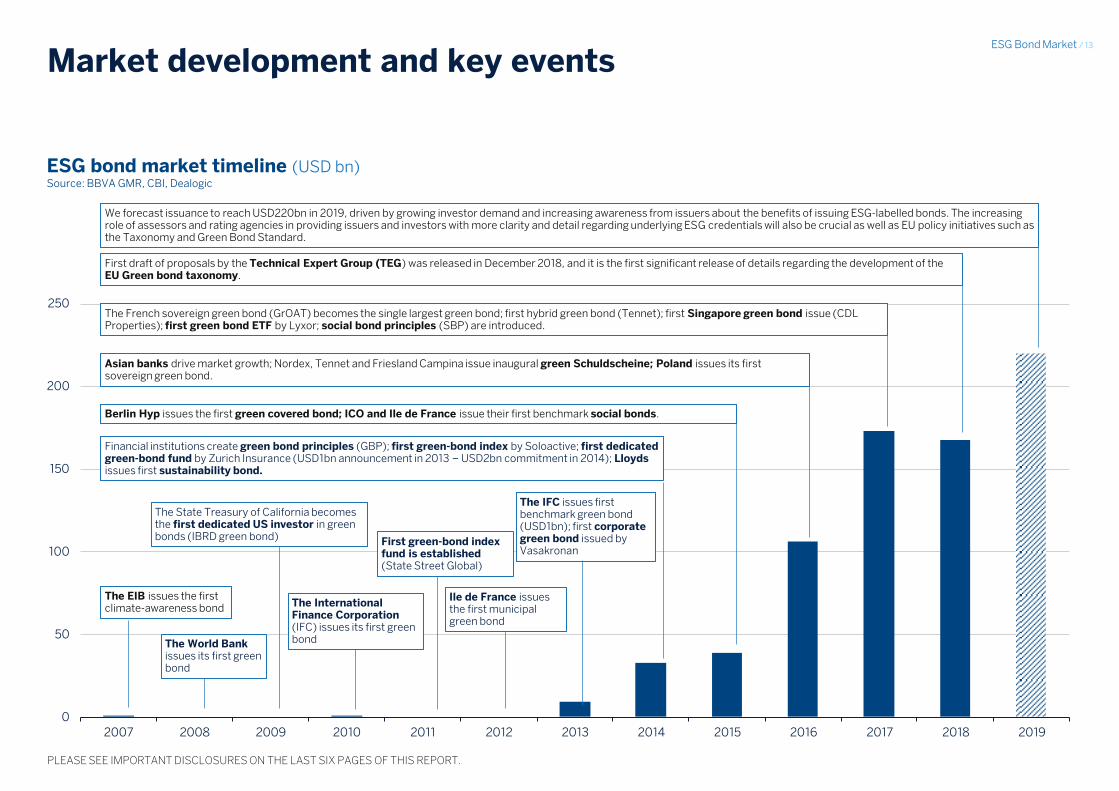
Market development and key events
Source: MG_Green bonds 2019_graficos y tablas Hoja: Slide 7
ESG bond market timeline (USD bn) Source: BBVA GMR, CBI, Dealogic
0
50
100
150
200
250
2007 2008 2009 2010 2011 2012 2013 2014 2015 2016 2017 2018 2019
The World Bank issues its first green bond
The EIB issues the first climate-awareness bond
The State Treasury of California becomes the first dedicated US investor in green bonds (IBRD green bond)
The International Finance Corporation (IFC) issues its first green bond
First green-bond index fund is established (State Street Global)
Ile de France issues the first municipal green bond
The IFC issues first benchmark green bond (USD1bn); first corporate green bond issued by Vasakronan
Financial institutions create green bond principles (GBP); first green-bond index by Soloactive; first dedicated green-bond fund by Zurich Insurance (USD1bn announcement in 2013 – USD2bn commitment in 2014); Lloyds issues first sustainability bond.
Berlin Hyp issues the first green covered bond; ICO and Ile de France issue their first benchmark social bonds.
Asian banks drive market growth; Nordex, Tennet and Friesland Campina issue inaugural green Schuldscheine; Poland issues its first sovereign green bond.
The French sovereign green bond (GrOAT) becomes the single largest green bond; first hybrid green bond (Tennet); first Singapore green bond issue (CDL Properties); first green bond ETF by Lyxor; social bond principles (SBP) are introduced.
We forecast issuance to reach USD220bn in 2019, driven by growing investor demand and increasing awareness from issuers about the benefits of issuing ESG-labelled bonds. The increasing role of assessors and rating agencies in providing issuers and investors with more clarity and detail regarding underlying ESG credentials will also be crucial as well as EU policy initiatives such as the Taxonomy and Green Bond Standard.
First draft of proposals by the Technical Expert Group (TEG) was released in December 2018, and it is the first significant release of details regarding the development of the EU Green bond taxonomy.
ESG Bond Market / 14
PLEASE SEE IMPORTANT DISCLOSURES ON THE LAST SIX PAGES OF THIS REPORT.
Market growth - issuance levels (i)
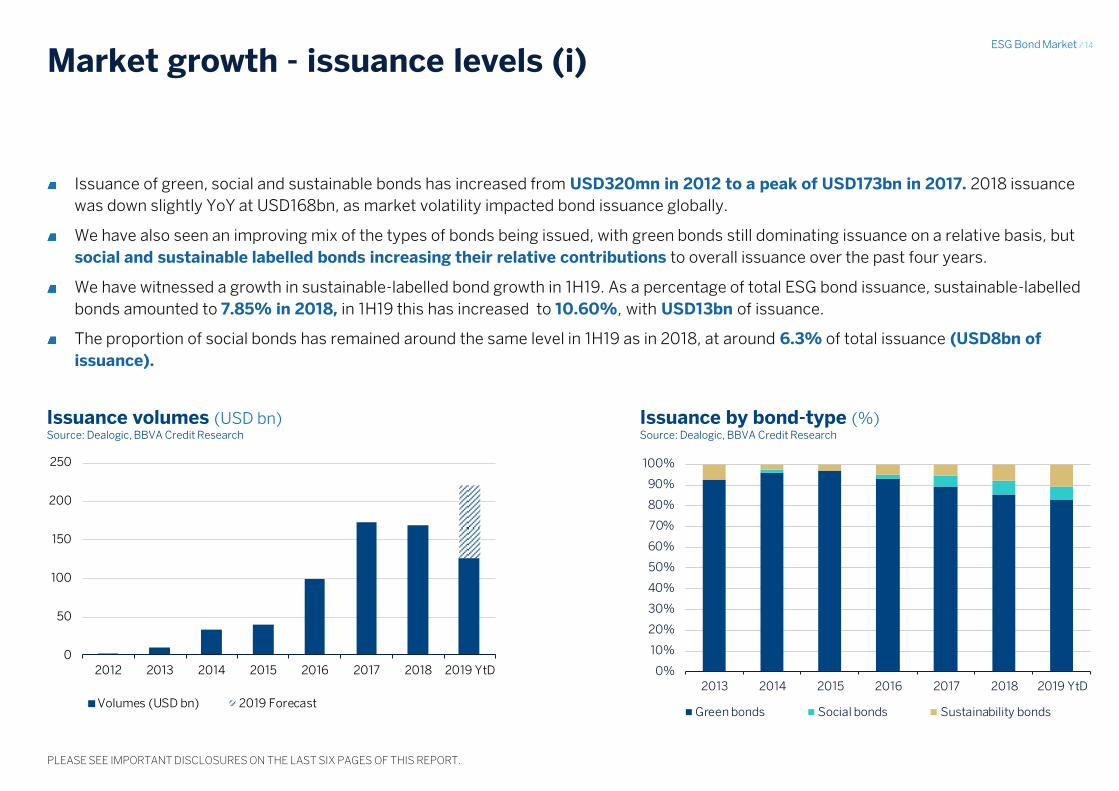
Issuance of green, social and sustainable bonds has increased from USD320mn in 2012 to a peak of USD173bn in 2017. 2018 issuance
was down slightly YoY at USD168bn, as market volatility impacted bond issuance globally.
We have also seen an improving mix of the types of bonds being issued, with green bonds still dominating issuance on a relative basis, but
social and sustainable labelled bonds increasing their relative contributions to overall issuance over the past four years.
We have witnessed a growth in sustainable-labelled bond growth in 1H19. As a percentage of total ESG bond issuance, sustainable-labelled
bonds amounted to 7.85% in 2018, in 1H19 this has increased to 10.60%, with USD13bn of issuance.
The proportion of social bonds has remained around the same level in 1H19 as in 2018, at around 6.3% of total issuance (USD8bn of
issuance).
Issuance volumes (USD bn) Source: Dealogic, BBVA Credit Research
Issuance by bond-type (%) Source: Dealogic, BBVA Credit Research
0
50
100
150
200
250
2012 2013 2014 2015 2016 2017 2018 2019 YtD
Volumes (USD bn) 2019 Forecast
0%
10%
20%
30%
40%
50%
60%
70%
80%
90%
100%
2013 2014 2015 2016 2017 2018 2019 YtD
Green bonds Social bonds Sustainability bonds
ESG Bond Market / 15
PLEASE SEE IMPORTANT DISCLOSURES ON THE LAST SIX PAGES OF THIS REPORT.
Issuance volumes (USD bn) Source: Dealogic, BBVA Credit Research
Market growth - issuance levels (ii)
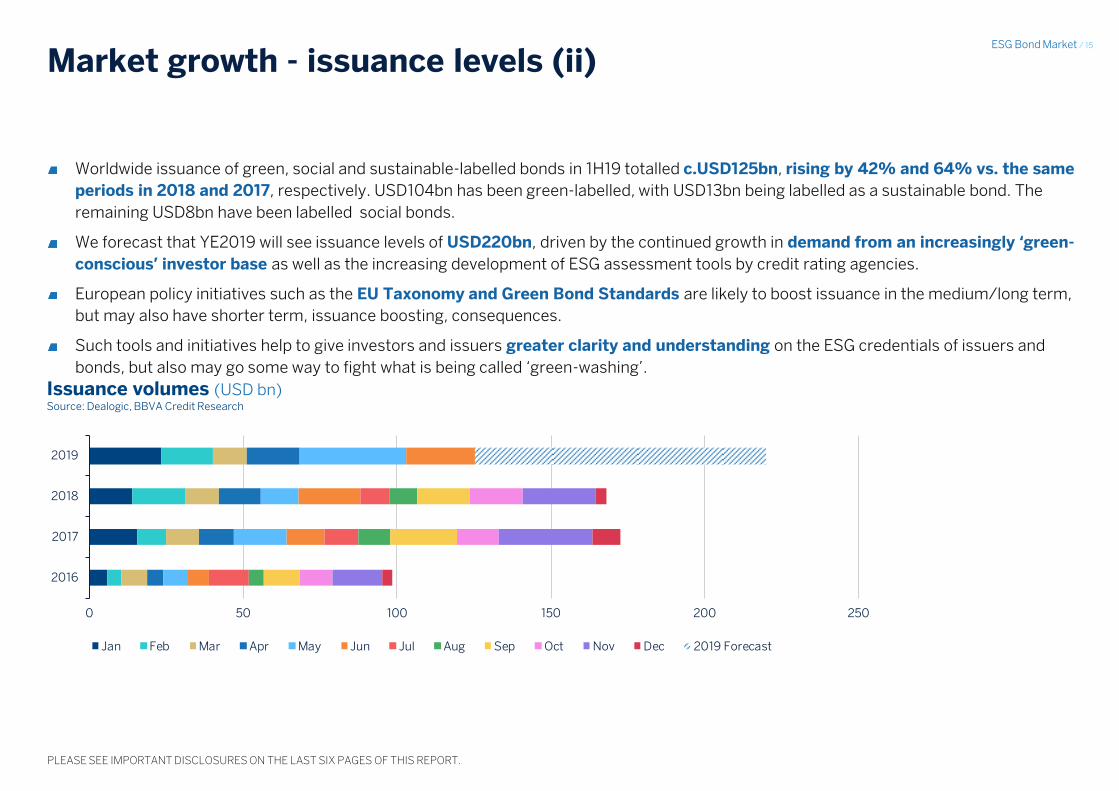
Worldwide issuance of green, social and sustainable-labelled bonds in 1H19 totalled c.USD125bn, rising by 42% and 64% vs. the same
periods in 2018 and 2017, respectively. USD104bn has been green-labelled, with USD13bn being labelled as a sustainable bond. The
remaining USD8bn have been labelled social bonds.
We forecast that YE2019 will see issuance levels of USD220bn, driven by the continued growth in demand from an increasingly ‘green-
conscious’ investor base as well as the increasing development of ESG assessment tools by credit rating agencies.
European policy initiatives such as the EU Taxonomy and Green Bond Standards are likely to boost issuance in the medium/long term,
but may also have shorter term, issuance boosting, consequences.
Such tools and initiatives help to give investors and issuers greater clarity and understanding on the ESG credentials of issuers and
bonds, but also may go some way to fight what is being called ‘green-washing’.
0 50 100 150 200 250
2016
2017
2018
2019
Jan Feb Mar Apr May Jun Jul Aug Sep Oct Nov Dec 2019 Forecast

ESG Bond Market / 16
PLEASE SEE IMPORTANT DISCLOSURES ON THE LAST SIX PAGES OF THIS REPORT.
2019 issuance consistently above monthly averages
Monthly issuance vs. three-year average (USD bn) Source: Dealogic, BBVA Credit Research
Issuance throughout 2019 of green, social and sustainable bonds has consistently exceeded the average of the previous three years.
January saw issuance of USD23.2bn, almost 100% over the three year average of USD11.8, whilst February was 62% above (despite a 2%
YoY decline in issuance volumes). March was somewhat more subdued at 10% above the three-year average with USD11.1bn in the month.
This is traditionally one of the slowest months for issuance of ESG bonds.
April kicked the ESG market back to life with issuance that was 91% above the monthly average at USD18.9bn, whilst May saw a record-high
USD35bn of issuance, 175% above the three-year average.
Source: ESG_DATABASE_NEW Hoja: Monthly Cell: L50
0
5
10
15
20
25
30
35
40
Jan Feb Mar Apr May Jun Jul Aug Sep Oct Nov Dec
2016 2017 2018 2019 Average 2016-18
ESG Bond Market / 17
PLEASE SEE IMPORTANT DISCLOSURES ON THE LAST SIX PAGES OF THIS REPORT.
Geographical distribution of issuance is changing
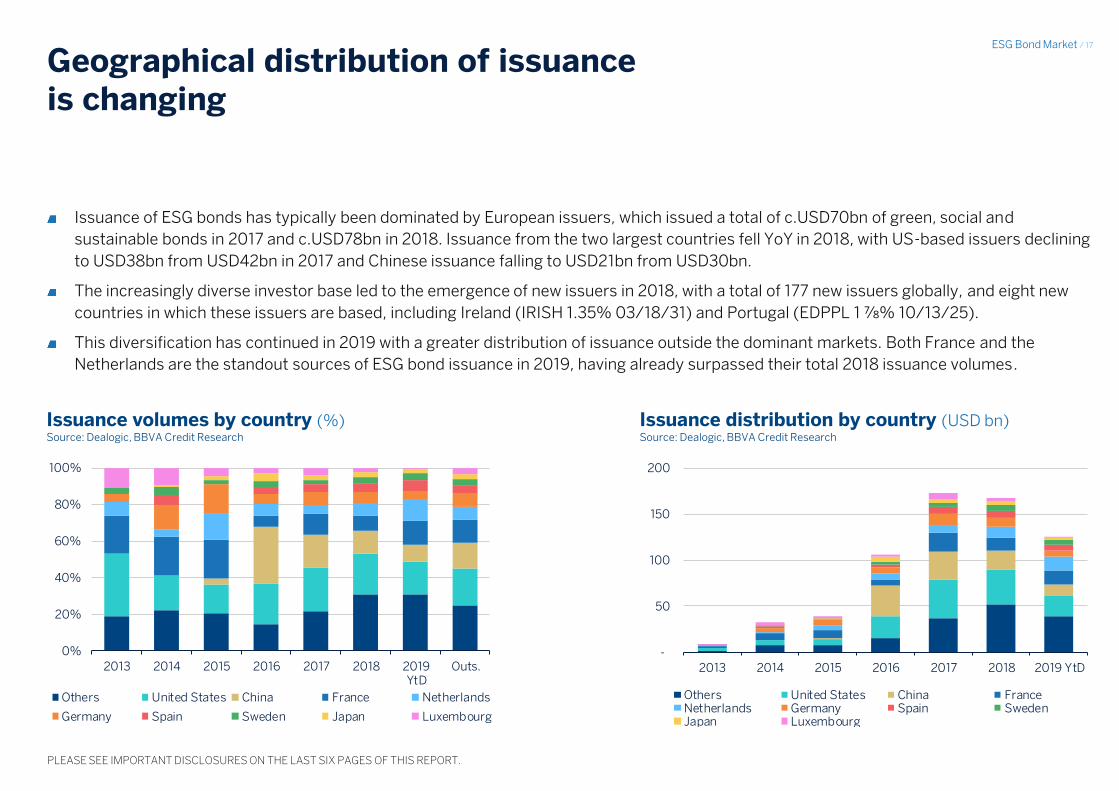
Issuance of ESG bonds has typically been dominated by European issuers, which issued a total of c.USD70bn of green, social and
sustainable bonds in 2017 and c.USD78bn in 2018. Issuance from the two largest countries fell YoY in 2018, with US-based issuers declining
to USD38bn from USD42bn in 2017 and Chinese issuance falling to USD21bn from USD30bn.
The increasingly diverse investor base led to the emergence of new issuers in 2018, with a total of 177 new issuers globally, and eight new
countries in which these issuers are based, including Ireland (IRISH 1.35% 03/18/31) and Portugal (EDPPL 1 ⅞% 10/13/25).
This diversification has continued in 2019 with a greater distribution of issuance outside the dominant markets. Both France and the
Netherlands are the standout sources of ESG bond issuance in 2019, having already surpassed their total 2018 issuance volumes.
Issuance volumes by country (%) Source: Dealogic, BBVA Credit Research
Issuance distribution by country (USD bn) Source: Dealogic, BBVA Credit Research
0%
20%
40%
60%
80%
100%
2013 2014 2015 2016 2017 2018 2019YtD
Outs.
Others United States China France Netherlands
Germany Spain Sweden Japan Luxembourg
-
50
100
150
200
2013 2014 2015 2016 2017 2018 2019 YtD
Others United States China FranceNetherlands Germany Spain SwedenJapan Luxembourg
ESG Bond Market / 18
PLEASE SEE IMPORTANT DISCLOSURES ON THE LAST SIX PAGES OF THIS REPORT.
Share of ESG issuance has been increasing
Percentage of ESG bonds vs. total global bond issuance Source: Dealogic, BBVA Credit Research
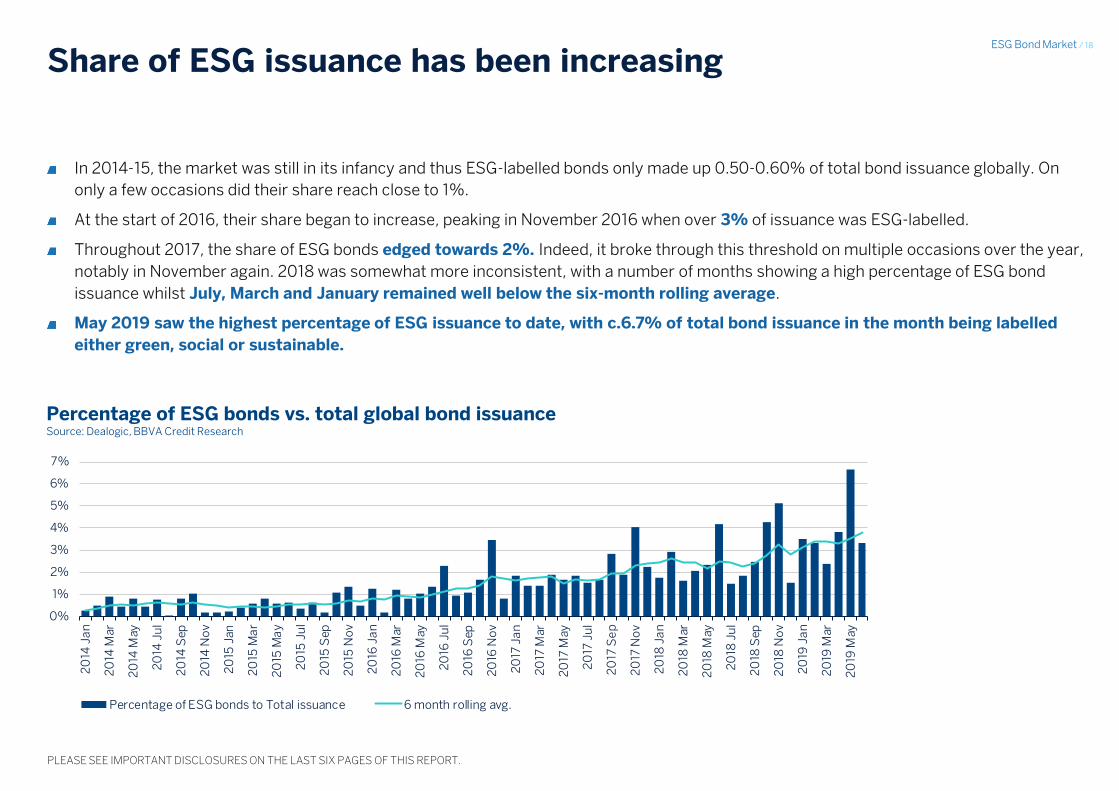
In 2014-15, the market was still in its infancy and thus ESG-labelled bonds only made up 0.50-0.60% of total bond issuance globally. On
only a few occasions did their share reach close to 1%.
At the start of 2016, their share began to increase, peaking in November 2016 when over 3% of issuance was ESG-labelled.
Throughout 2017, the share of ESG bonds edged towards 2%. Indeed, it broke through this threshold on multiple occasions over the year,
notably in November again. 2018 was somewhat more inconsistent, with a number of months showing a high percentage of ESG bond
issuance whilst July, March and January remained well below the six-month rolling average.
May 2019 saw the highest percentage of ESG issuance to date, with c.6.7% of total bond issuance in the month being labelled
either green, social or sustainable.
Source: ESG bonds vs total issuance Hoja: Grafico Cell: I9
0%
1%
2%
3%
4%
5%
6%
7%
20
14 J
an
20
14 M
ar
20
14 M
ay
20
14 J
ul
20
14 S
ep
20
14 N
ov
20
15 J
an
20
15 M
ar
20
15 M
ay
20
15 J
ul
20
15 S
ep
20
15 N
ov
20
16 J
an
20
16 M
ar
20
16 M
ay
20
16 J
ul
20
16 S
ep
20
16 N
ov
20
17 J
an
20
17 M
ar
20
17 M
ay
20
17 J
ul
20
17 S
ep
20
17 N
ov
20
18 J
an
20
18 M
ar
20
18 M
ay
20
18 J
ul
20
18 S
ep
20
18 N
ov
20
19 J
an
20
19 M
ar
20
19 M
ay
Percentage of ESG bonds to Total issuance 6 month rolling avg.

ESG Bond Market / 19
PLEASE SEE IMPORTANT DISCLOSURES ON THE LAST SIX PAGES OF THIS REPORT.
Repeat issuers to contribute more in 2019
Breakdown of first-time issuers’ contribution to issuance Note: i) Figures do not include issuance from Fannie Mae, ii) T-1, T-2 and T-3+ indicate first time issuers from one year, two years and three-plus years prior to the year indicated in the graph. For example, T-2 in 2018 indicates first time issuers from 2016, T-2 in 2019, is first time issuers from 2017 etc. Source: Dealogic, BBVA Credit Research
The value of total issuance attributed to first-time issuers in 2018 was 11% less than the contribution from first-time issuers in 2017, as
repeat issuers returned to the market, contributing larger issuance volumes on average. This was despite the fact that the number of first-
time issuers actually rose in 2018, along with the percentage of first-time issuers vs. repeat issuers.
Issuers whose first issue was in 2017 contributed 10% of total issuance value in 2018, a reduction of c.1% YoY, whereas first-time issuers
from 2015 or before (i.e. longer-term market participants) contributed 23%, vs. 14% in 2017.
In 2019 YtD, repeat issuers have accounted for 54% of the total value of issuance, with the remaining 46% from first-time issuers .
We expect repeat issuers to continue to increase their contributions as they develop their green bond frameworks and organically grow the
amount of green-, social- and sustainable-labelled instruments. However, given that the market is still developing and growing, we still
expect the contribution of first-time issuers to remain significant.
46% 52%63%
52%68% 74%
58%69% 67%
14%12%
14%
14%
8%8%
15%
12% 10%15% 10%
6%10%
5%8%
11%5%
4%25% 26%
17% 23% 18%10%
17% 14% 19%
0%
10%
20%
30%
40%
50%
60%
70%
80%
90%
100%
2019YtD
2018 2017 2019YtD
2018 2017 2019YtD
2018 2017
Value of issuance No. of bonds No. of issuers
T T-1 T-2 T-3+

ESG Bond Market / 20
PLEASE SEE IMPORTANT DISCLOSURES ON THE LAST SIX PAGES OF THIS REPORT.
More diverse issuer profiles to continue in 2019
Prior to 2016, there was very little issuance from financial institutions compared to SSAs and corporates. 2016 saw not just a large jump in
global issuance volumes of green, social and sustainable bonds, but also a large increase in the contribution from financial institutions to
issuance volumes.
2018 saw a slight rebalancing of volumes issued by different sectors. Whilst non-financial corporates still accounted for 40% of first-time
green bond issuers, financial institutions entered the ESG market in greater numbers (38% of all new issuers).
The end of the CSPP is likely to bring about a noticeable decrease in issuance by non-financial corporates in Europe. The consequences
for ESG issuance are varied. We expect a larger proportion of issuance to be green/socially-labelled as issuers try to mitigate reduced
investor demand by marketing to a broader, more diverse investor base. We also expect increased issuance from non-traditional ESG
issuers.
Green bond issuer by type (% of total issuance volume) Source: Dealogic, BBVA Credit Research
New issuers by sector (% of new issuers) Source: Dealogic, BBVA Credit Research
Source: ESG_DATABASE_NEW Hoja: NewIssuers Cell: P6
2016 2017 2018 2019 YtD
Corporates 48% 48% 40% 58%
Financial Institutions 31% 28% 38% 33%
Sovereigns / Agencies 16% 16% 18% 7%
Asset-backed Securites 6% 8% 4% 2%
0%
20%
40%
60%
80%
100%
2013 2014 2015 2016 2017 2018 2019YtD
Outs.
Sovereign, Supranational and Agency Financial institutions Group
Corporate Asset/Mortgaged Backed

ESG Bond Market / 21
PLEASE SEE IMPORTANT DISCLOSURES ON THE LAST SIX PAGES OF THIS REPORT.
The European Investment Bank is still the largest issuer of ESG bonds
Outstanding ESG bond volumes by issuer (USD bn) Source: Bloomberg, BBVA Credit Research
Largest ESG bond issuers 2018-2019 YtD (USD bn) Source: Bloomberg, BBVA Credit Research
The European Investment Bank continues to be the largest issuer of ESG-labelled
bonds, having issued the first instrument of its kind in 2007. In recent years, the
bank has issued USD2-5bn of ESG labelled instruments per year for a total of
c.USD26.6bn as of June 2019.
2018 saw Belgium and Ireland among the ten largest issuers of the year with
USD7.1bn and USD3.5bn of ESG bond issuance, respectively.
The largest issuer so far this year is the Netherlands government with EUR6bn
issuance, whilst Engie also appears in the top issuers with EUR2.5bn of green
bonds issued YtD.
Source: bbg_largest_esg_issuers Hoja: Matrix Cell: n27
Source: bbg_largest_esg_issuers Hoja: Matrix Cell: I16
Source: bbg_largest_esg_issuers Hoja: Matrix Cell: R16
26.6
20.9 20.5
15.5 12.5
10.6 9.8 8.0 7.2 6.4
Eu
rop
ea
n I
nv
est
me
nt
Ba
nk
Kre
dit
an
sta
lt f
ue
rW
ied
era
ufb
au
Fre
nc
h R
ep
ub
licG
ov
ern
me
nt
Bo
nd
OA
T
Ind
ust
ria
l Ba
nk
Co
Ltd
Ne
de
rla
nd
seW
ate
rsc
ha
ps
ba
nk
NV
En
gie
SA
Ibe
rdro
la
Te
nn
eT
Ho
ldin
g B
V
Sta
te o
f N
ort
h R
hin
e-
We
stp
ha
lia
Ba
nk
of
Co
mm
un
ica
tio
ns
Co
Ltd
.
9.6
7.1
4.0
3.5
3.2
3.1
3.0
2.5
2.3
2.3
6.7
4.0
3.6
2.8
2.5
2.5
2.3
2.2
2.2
1.7
Industrial Bank Co Ltd
Kingdom of Belgium Government Bond
European Investment Bank
Ireland Government Bond
Nederlandse Waterschapsbank NV
IBRD
ING Groep NV
State of North Rhine-Westphalia Germany
Industrial & Commercial Bank of China Ltd
Bank of America Corp
Netherlands Government Bond
Kreditanstalt fuer Wiederaufbau
Societe Du Grand Paris EPIC
Engie SA
State of North Rhine-Westphalia Germany
Asian Infrastructure Investment Bank/The
Nederlandse Waterschapsbank NV
Republic of Poland Government InternationalBond
Industrial & Commercial Bank of China Ltd
Autonomous Community of Madrid
20
182
019
ESG Bond Market / 22
PLEASE SEE IMPORTANT DISCLOSURES ON THE LAST SIX PAGES OF THIS REPORT.
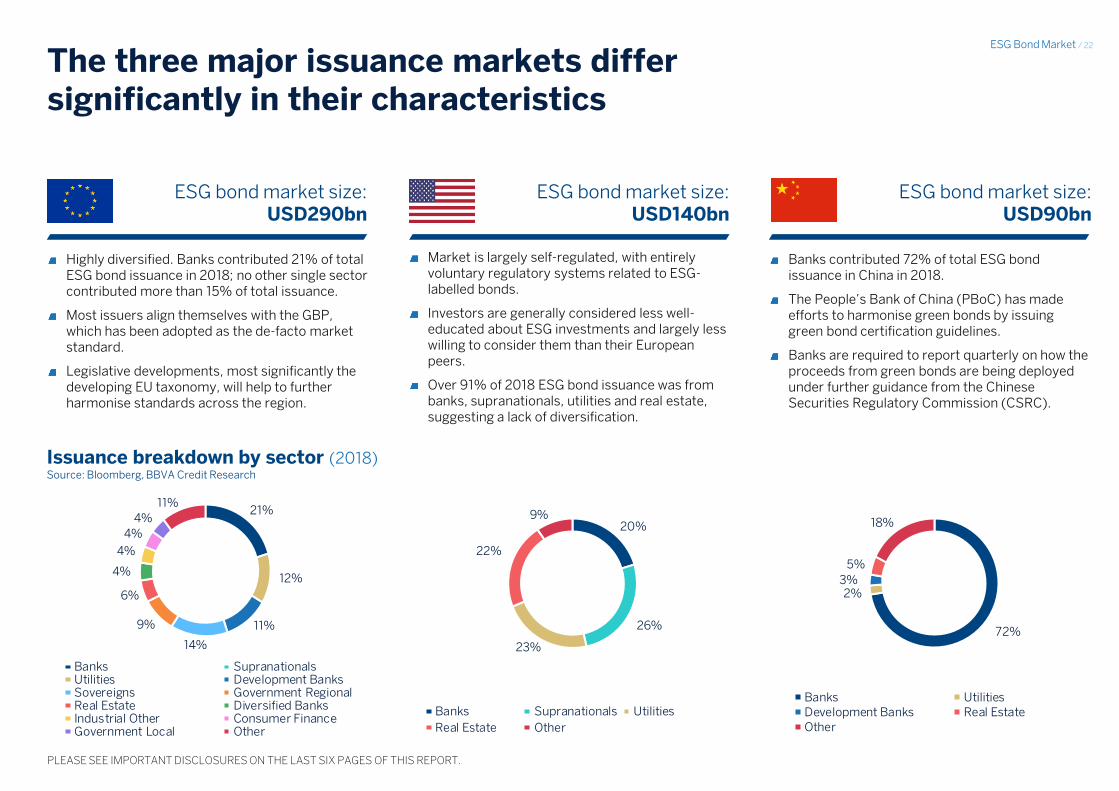
The three major issuance markets differ significantly in their characteristics
Source: Sector Breakdown by region 2018 Hoja: MATRIX Cell: C113
Source: Sector Breakdown by region 2018 Hoja: MATRIX Cell: C66
Source: Sector Breakdown by region 2018 Hoja: MATRIX Cell: C93
ESG bond market size: USD290bn
ESG bond market size: USD140bn
ESG bond market size: USD90bn
Highly diversified. Banks contributed 21% of total ESG bond issuance in 2018; no other single sector contributed more than 15% of total issuance.
Most issuers align themselves with the GBP, which has been adopted as the de-facto market standard.
Legislative developments, most significantly the developing EU taxonomy, will help to further harmonise standards across the region.
Market is largely self-regulated, with entirely voluntary regulatory systems related to ESG-labelled bonds.
Investors are generally considered less well-educated about ESG investments and largely less willing to consider them than their European peers.
Over 91% of 2018 ESG bond issuance was from banks, supranationals, utilities and real estate, suggesting a lack of diversification.
Banks contributed 72% of total ESG bond issuance in China in 2018.
The People’s Bank of China (PBoC) has made efforts to harmonise green bonds by issuing green bond certification guidelines.
Banks are required to report quarterly on how the proceeds from green bonds are being deployed under further guidance from the Chinese Securities Regulatory Commission (CSRC).
Issuance breakdown by sector (2018) Source: Bloomberg, BBVA Credit Research
21%
12%
11%
14%
9%
6%
4%
4%
4%
4%
11%
Banks SupranationalsUtilities Development BanksSovereigns Government RegionalReal Estate Diversified BanksIndustrial Other Consumer FinanceGovernment Local Other
20%
26%
23%
22%
9%
Banks Supranationals Utilities
Real Estate Other
72%
2%3%
5%
18%
Banks UtilitiesDevelopment Banks Real EstateOther

ESG Bond Market / 23
PLEASE SEE IMPORTANT DISCLOSURES ON THE LAST SIX PAGES OF THIS REPORT.
Sovereign issuers to continue to meet climate objectives by issuing green bonds
2018 again saw increased green bond issuance from
sovereigns, including debut issuances from Belgium, Ireland
and Lithuania. Issuance in 2018 from sovereigns amounted to
c.USD16.2bn, an increase of almost 75% over 2017’s USD9.3bn
figure.
2019 has so far raised the bar once again for sovereign issuers,
especially due to the emergence of new players. Sovereign
issuance has already reached over USD18bn, c.12% higher than
the full-year total for 2018.
This was bolstered by the EUR6bn inaugural issuance by the
Netherlands, as well as inaugural issuances from Hong Kong,
South Korea and Chile.
We expect more sovereigns to issue green/social/sustainable
bonds over the near/medium term.
Sovereign issuers are increasingly turning to green bonds to
achieve their sustainable-development strategies, as the ability
to appeal to a broader, more diverse range of investors is likely
to increase demand, particularly in EMs, and potentially lead to
pricing advantages.
Sovereign issuance is playing a key role in the continued
development of the green, social and sustainable bond
universe as it brings increased attention and legitimacy to the
market. This is especially important in the early years of the
development of the asset class.
Sovereign issuance of green, social and sustainable bonds Note: Bold indicates debut issuance. Source: Dealogic, Bloomberg, BBVA Credit Research
Excel: sovereign issuers Hoja: Sheet 2
Issuer Curr.
Amount Issued
(USD mn) Issue Date Maturity Date
Poland EUR 794 13-Dec-16 20-Dec-21
France EUR 7,513 24-Jan-17 25-Jun-39
France EUR 1,650 01-Jun-17 25-Jun-39
Fiji FJD 20 01-Nov-17 01-Nov-22
Fiji FJD 80 01-Nov-17 01-Nov-30
France EUR 1 07-Dec-17 25-Jun-39
Nigeria NGN 30 20-Dec-17 22-Dec-22
Poland EUR 1,239 31-Jan-18 07-Aug-26
Belgium EUR 5,532 26-Feb-18 22-Apr-33
France EUR 1,346 05-Apr-18 25-Jun-39
Lithuania EUR 24 30-Apr-18 03-May-28
France EUR 4,670 26-Jun-18 25-Jun-39
Ireland EUR 3,444 10-Oct-18 18-Mar-31
France EUR 1,894 07-Feb-19 25-Jun-39
Poland EUR 1,707 28-Feb-19 07-Mar-29
Poland EUR 569 28-Feb-19 08-Mar-49
Belgium EUR 1,441 18-Mar-19 22-Apr-33
France EUR 2,128 02-May-19 25-Jun-39
Netherlands EUR 6,681 21-May-19 15-Jan-40
Hong Kong USD 1,000 21-May-19 28-May-24
South Korea USD 500 12-Jun-19 19-Jun-24
Chile USD 1,418 17-Jun-19 25-Jan-50
Chile EUR 981 25-Jun-19 02-Jul-31
Total 44,663
ESG Bond Market / 24
PLEASE SEE IMPORTANT DISCLOSURES ON THE LAST SIX PAGES OF THIS REPORT.
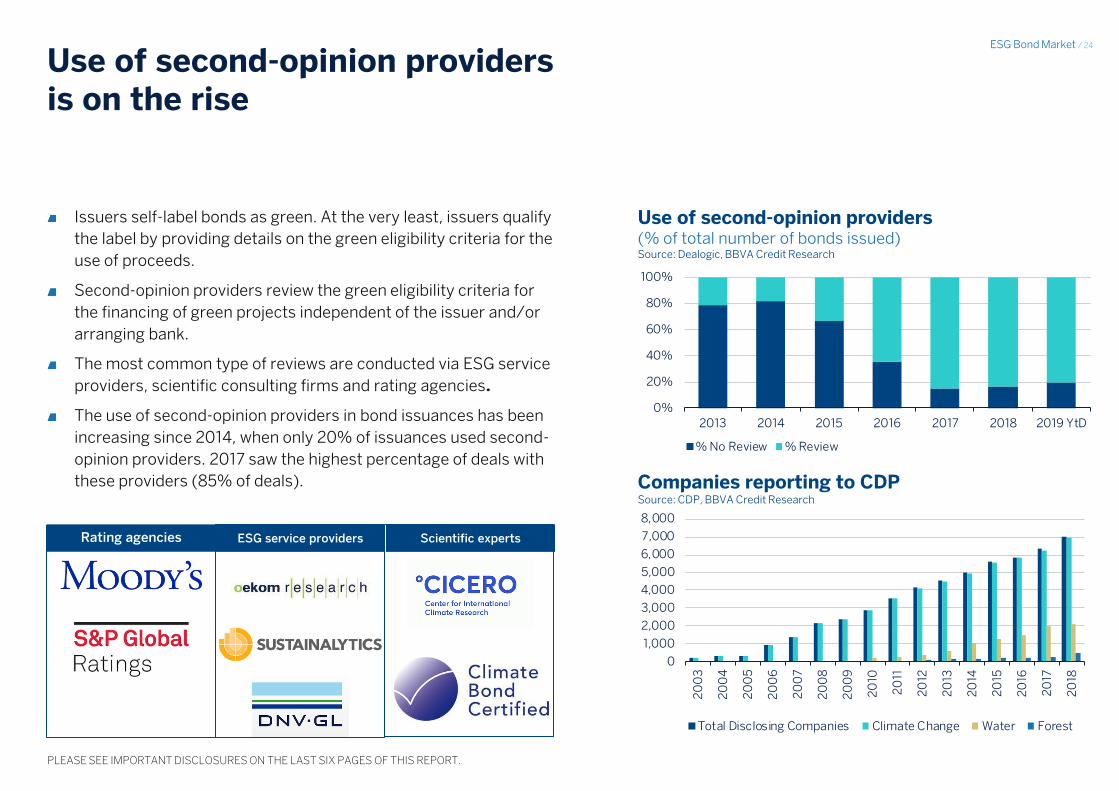
Use of second-opinion providers is on the rise
Use of second-opinion providers (% of total number of bonds issued) Source: Dealogic, BBVA Credit Research
Issuers self-label bonds as green. At the very least, issuers qualify
the label by providing details on the green eligibility criteria for the
use of proceeds.
Second-opinion providers review the green eligibility criteria for
the financing of green projects independent of the issuer and/or
arranging bank.
The most common type of reviews are conducted via ESG service
providers, scientific consulting firms and rating agencies.
The use of second-opinion providers in bond issuances has been
increasing since 2014, when only 20% of issuances used second-
opinion providers. 2017 saw the highest percentage of deals with
these providers (85% of deals).
Rating agencies ESG service providers Scientific experts
Companies reporting to CDP Source: CDP, BBVA Credit Research
Source: MG_Green bonds 2019_graficos y tablas Hoja: Slide 10 Cell: V5
0
1,000
2,000
3,000
4,000
5,000
6,000
7,000
8,000
20
03
20
04
20
05
20
06
20
07
20
08
20
09
20
10
20
11
20
12
20
13
20
14
20
15
20
16
20
17
20
18
Total Disclosing Companies Climate Change Water Forest
0%
20%
40%
60%
80%
100%
2013 2014 2015 2016 2017 2018 2019 YtD
% No Review % Review
ESG Bond Market / 25
PLEASE SEE IMPORTANT DISCLOSURES ON THE LAST SIX PAGES OF THIS REPORT.
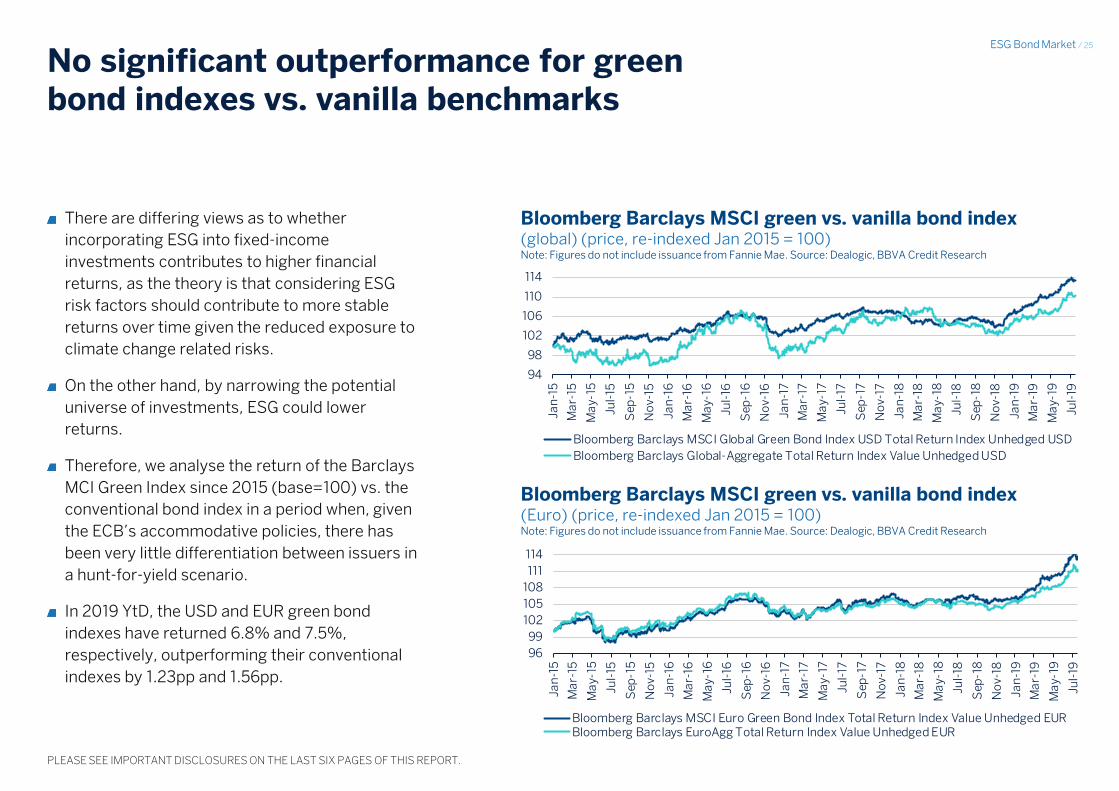
No significant outperformance for green bond indexes vs. vanilla benchmarks
Bloomberg Barclays MSCI green vs. vanilla bond index (global) (price, re-indexed Jan 2015 = 100) Note: Figures do not include issuance from Fannie Mae. Source: Dealogic, BBVA Credit Research
Bloomberg Barclays MSCI green vs. vanilla bond index (Euro) (price, re-indexed Jan 2015 = 100) Note: Figures do not include issuance from Fannie Mae. Source: Dealogic, BBVA Credit Research
There are differing views as to whether
incorporating ESG into fixed-income
investments contributes to higher financial
returns, as the theory is that considering ESG
risk factors should contribute to more stable
returns over time given the reduced exposure to
climate change related risks.
On the other hand, by narrowing the potential
universe of investments, ESG could lower
returns.
Therefore, we analyse the return of the Barclays
MCI Green Index since 2015 (base=100) vs. the
conventional bond index in a period when, given
the ECB’s accommodative policies, there has
been very little differentiation between issuers in
a hunt-for-yield scenario.
In 2019 YtD, the USD and EUR green bond
indexes have returned 6.8% and 7.5%,
respectively, outperforming their conventional
indexes by 1.23pp and 1.56pp.
Source: Green bond vs vanilla Hoja: Sheet 1 Cell: x8
Source: Green bond vs vanilla Hoja: Sheet 1 Cell: L2
94
98
102
106
110
114
Jan
-15
Ma
r-15
Ma
y-1
5
Jul-
15
Se
p-1
5
No
v-15
Jan
-16
Ma
r-16
Ma
y-16
Ju
l-16
Se
p-1
6
No
v-1
6
Jan
-17
Ma
r-17
Ma
y-1
7
Jul-
17
Se
p-1
7
No
v-17
Jan
-18
Ma
r-18
Ma
y-1
8
Jul-
18
Sep
-18
No
v-18
Jan
-19
Ma
r-19
Ma
y-19
Jul-
19
Bloomberg Barclays MSCI Global Green Bond Index USD Total Return Index Unhedged USD
Bloomberg Barclays Global-Aggregate Total Return Index Value Unhedged USD
96
99
102
105
108
111
114Ja
n-1
5
Ma
r-15
Ma
y-1
5
Jul-
15
Sep
-15
No
v-15
Ja
n-1
6
Ma
r-16
Ma
y-16
Jul-
16
Sep
-16
No
v-1
6
Jan
-17
Ma
r-17
Ma
y-1
7
Jul-
17
Sep
-17
No
v-17
Ja
n-1
8
Ma
r-18
Ma
y-18
Ju
l-18
Se
p-1
8
No
v-18
Jan
-19
Ma
r-19
Ma
y-19
Jul-
19
Bloomberg Barclays MSCI Euro Green Bond Index Total Return Index Value Unhedged EURBloomberg Barclays EuroAgg Total Return Index Value Unhedged EUR
ESG Bond Market / 26
PLEASE SEE IMPORTANT DISCLOSURES ON THE LAST SIX PAGES OF THIS REPORT.
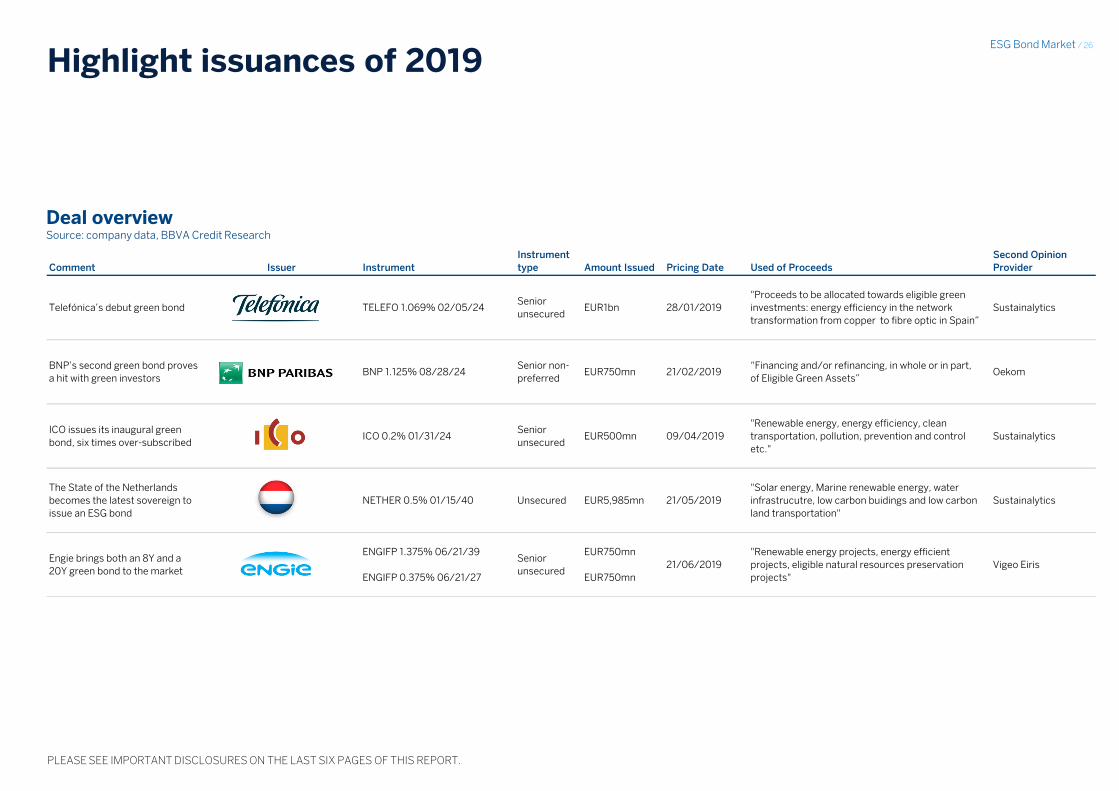
Highlight issuances of 2019
Deal overview Source: company data, BBVA Credit Research
Excel: highlighted deals Hoja: Sheet 1 Cell: B4
Comment Issuer Instrument
Instrument
type Amount Issued Pricing Date Used of Proceeds
Second Opinion
Provider
Telefónica’s debut green bond TELEFO 1.069% 02/05/24Senior
unsecuredEUR1bn 28/01/2019
"Proceeds to be allocated towards eligible green
investments: energy efficiency in the network
transformation from copper to fibre optic in Spain”
Sustainalytics
BNP’s second green bond proves
a hit with green investorsBNP 1.125% 08/28/24
Senior non-
preferredEUR750mn 21/02/2019
“Financing and/or refinancing, in whole or in part,
of Eligible Green Assets”Oekom
ICO issues its inaugural green
bond, six times over-subscribedICO 0.2% 01/31/24
Senior
unsecuredEUR500mn 09/04/2019
"Renewable energy, energy efficiency, clean
transportation, pollution, prevention and control
etc."
Sustainalytics
The State of the Netherlands
becomes the latest sovereign to
issue an ESG bond
NETHER 0.5% 01/15/40 Unsecured EUR5,985mn 21/05/2019
"Solar energy, Marine renewable energy, water
infrastrucutre, low carbon buidings and low carbon
land transportation"
Sustainalytics
Engie brings both an 8Y and a
20Y green bond to the market
ENGIFP 1.375% 06/21/39
ENGIFP 0.375% 06/21/27
Senior
unsecured
EUR750mn
EUR750mn
21/06/2019
"Renewable energy projects, energy efficient
projects, eligible natural resources preservation
projects"
Vigeo Eiris

ESG Bond Market / 27
PLEASE SEE IMPORTANT DISCLOSURES ON THE LAST SIX PAGES OF THIS REPORT.
Key themes for 2019 (i)
We expect the number of sovereign
issuers to increase in the coming
years as governments seek to raise
capital for climate mitigation and
adaptation activities.
A number of sovereigns have already
issued in 2019, most notably the
Netherlands with a c.EUR6bn
issuance in May. They were joined by
Chile, South Korea and Hong Kong as
inaugural sovereign issuers of ESG
bonds.
Theme 1
New sovereign issuers to emerge in the ESG universe
We expect that as awareness and
understanding of ESG investing
deepens on the part of issuers and
investors, both supply and demand
of a more diverse range of
instruments will lead to further
balancing of green-, social- and
sustainable-labelled instruments.
We expect a larger percentage of
issuance to be green-/socially-
labelled as issuers try to mitigate
lower investor demand by marketing
to a broader, more diverse investor
base. We also expect increased
issuance from non-traditional ESG
issuers. A prime example is Spanish
engineering conglomerate ACS
Group’s subsidiary ACS Servicios
Comunicaciones y Energía, which
brought a EUR750mn green bond to
market in April 2018.
Theme 2
Increased issuance of social- and sustainable-labelled bonds
Theme 3
European non-financial corporates to become more green

ESG Bond Market / 28
PLEASE SEE IMPORTANT DISCLOSURES ON THE LAST SIX PAGES OF THIS REPORT.
Key themes for 2019 (ii)
Continuing efforts by credit rating
agencies to give investors and
issuers greater clarity and insights
into the impact of green, social and
sustainable bonds will serve to
increase their attractiveness.
This will work in conjunction with the
continued emergence of socially and
environmentally conscious investors
that have driven much of the demand
for ESG-compliant investments in
recent years.
Theme 4
Credit rating agencies’ tools to increase awareness
The EU’s development of a
taxonomy for sustainable
investments will help to create
greater understanding on the part of
issuers and investors regarding the
ESG credentials of their instruments
and contribute to the EU’s wider
sustainable-finance action plan.
In December 2018, the energy-
efficient mortgage (EEM) initiative
unveiled its definition of an energy-
efficient mortgage. EEMs are
intended to finance the purchase,
construction and/or renovation of
both residential and commercial
buildings, given some conditions.
One outcome of the EeMAP’s push
should be a greater number of more
easily identifiable energy-efficient
mortgages that can constitute
collateral for green covered
bonds/securitisations.
Theme 5
EU taxonomy to harmonise the EU market
Theme 6
Green secured issuance to increase

ESG Bond Market / 29
PLEASE SEE IMPORTANT DISCLOSURES ON THE LAST SIX PAGES OF THIS REPORT.
03 Policy and regulatory developments
in the EU green bond market

ESG Bond Market / 30
PLEASE SEE IMPORTANT DISCLOSURES ON THE LAST SIX PAGES OF THIS REPORT.
Market harmonisation is an essential issue to tackle – the EC is leading the way
Work by the European Commission’s High-Level Expert Group on Sustainable Finance (HLEG), established in 2016, has been crucial to
setting standards and guidelines for how European issuance of green, social and sustainable bonds can be further harmonised as
well as to “steer the flow of capital towards sustainable investments; identify steps that financial institutions and supervisors should
take to protect the financial system from sustainability risks; and deploy these policies on a pan-European scale” (source: Final Report
2018 by the High-Level Expert Group on Sustainable Finance).
In a January 2018 report, the HLEG identified a number of items that the group considers top priorities, including:
• Establishing an EU sustainable taxonomy.
• Clarifying investor duties to put a greater focus on ESG factors in investment decision-making.
• Upgrading disclosures to make sustainable opportunities and risks more transparent.
• Developing official European sustainability standards for some financial assets, starting with green bonds.
• Establishing ‘Sustainable Infrastructure Europe’ to deploy development capacity in EU member states for infrastructure necessary
for a more sustainable economy.
• Integrating sustainability within the governance of financial institutions as well as in financial supervision.
The creation of a subsequent Technical Expert Group (TEG) allowed for the development of a green bond taxonomy in order to further
harmonise ‘green’ reporting and disclosures by identifying activities and assets that are eligible as ‘green’ and establish metrics and
thresholds against which their ‘green-ness’ can be judged.
The deepening involvement of bodies like the EC is crucial for the continued expansion of this asset class, because it increases exposure
and legitimacy for potential market participants and ensures that the standards and underlying guidelines are maintained. This
benefits issuers and investors as well as the causes for which the bonds are being issued, and thus the environment and society as a whole.
ESG Bond Market / 31
PLEASE SEE IMPORTANT DISCLOSURES ON THE LAST SIX PAGES OF THIS REPORT.
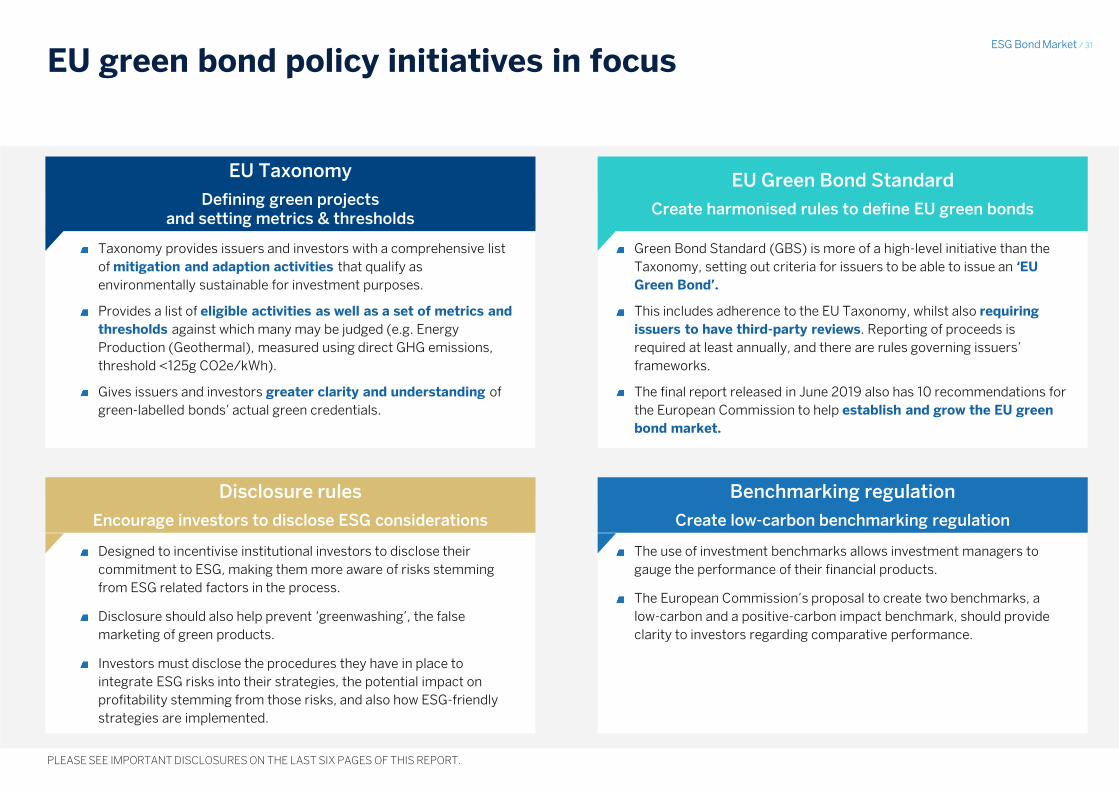
EU green bond policy initiatives in focus
Taxonomy provides issuers and investors with a comprehensive list
of mitigation and adaption activities that qualify as
environmentally sustainable for investment purposes.
Provides a list of eligible activities as well as a set of metrics and
thresholds against which many may be judged (e.g. Energy
Production (Geothermal), measured using direct GHG emissions,
threshold <125g CO2e/kWh).
Gives issuers and investors greater clarity and understanding of
green-labelled bonds’ actual green credentials.
EU Taxonomy
Defining green projects and setting metrics & thresholds
EU Green Bond Standard
Create harmonised rules to define EU green bonds
Green Bond Standard (GBS) is more of a high-level initiative than the
Taxonomy, setting out criteria for issuers to be able to issue an ‘EU
Green Bond’.
This includes adherence to the EU Taxonomy, whilst also requiring
issuers to have third-party reviews. Reporting of proceeds is
required at least annually, and there are rules governing issuers’
frameworks.
The final report released in June 2019 also has 10 recommendations for
the European Commission to help establish and grow the EU green
bond market.
Disclosure rules
Encourage investors to disclose ESG considerations
Benchmarking regulation
Create low-carbon benchmarking regulation
Designed to incentivise institutional investors to disclose their
commitment to ESG, making them more aware of risks stemming
from ESG related factors in the process.
Disclosure should also help prevent ‘greenwashing’, the false
marketing of green products.
Investors must disclose the procedures they have in place to
integrate ESG risks into their strategies, the potential impact on
profitability stemming from those risks, and also how ESG-friendly
strategies are implemented.
The use of investment benchmarks allows investment managers to
gauge the performance of their financial products.
The European Commission’s proposal to create two benchmarks, a
low-carbon and a positive-carbon impact benchmark, should provide
clarity to investors regarding comparative performance.
ESG Bond Market / 32
PLEASE SEE IMPORTANT DISCLOSURES ON THE LAST SIX PAGES OF THIS REPORT.
2018 2019 2020-
EU
Ta
xo
no
my
E
U G
ree
n B
on
d
Sta
nd
ard
D
isc
los
ure
s
Lo
w-c
arb
on
B
en
ch
ma
rkin
g
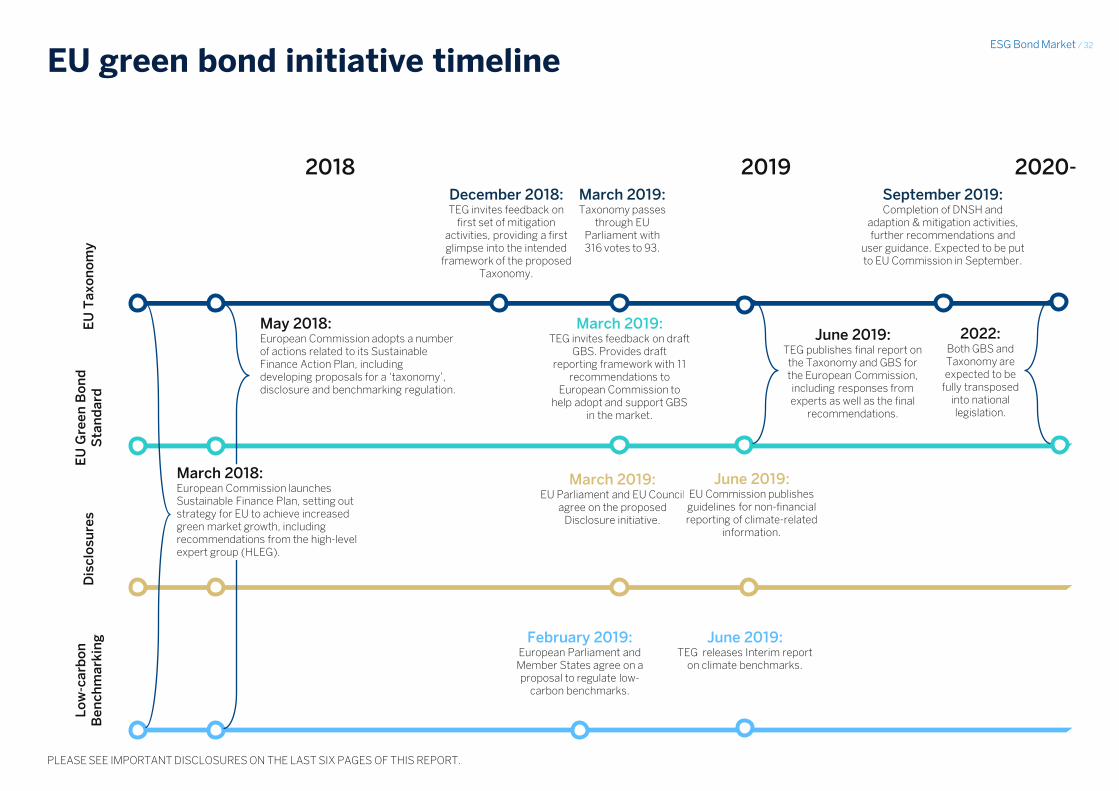
EU green bond initiative timeline
May 2018: European Commission adopts a number of actions related to its Sustainable Finance Action Plan, including developing proposals for a ‘taxonomy’, disclosure and benchmarking regulation.
March 2018: European Commission launches Sustainable Finance Plan, setting out strategy for EU to achieve increased green market growth, including recommendations from the high-level expert group (HLEG).
December 2018: TEG invites feedback on
first set of mitigation activities, providing a first glimpse into the intended
framework of the proposed Taxonomy.
March 2019: Taxonomy passes
through EU Parliament with 316 votes to 93.
September 2019: Completion of DNSH and
adaption & mitigation activities, further recommendations and
user guidance. Expected to be put to EU Commission in September.
2022: Both GBS and Taxonomy are expected to be
fully transposed into national legislation.
March 2019: TEG invites feedback on draft
GBS. Provides draft reporting framework with 11
recommendations to European Commission to
help adopt and support GBS in the market.
June 2019: TEG publishes final report on
the Taxonomy and GBS for the European Commission, including responses from experts as well as the final
recommendations.
March 2019: EU Parliament and EU Council
agree on the proposed Disclosure initiative.
February 2019: European Parliament and Member States agree on a proposal to regulate low-
carbon benchmarks.
June 2019: TEG releases Interim report
on climate benchmarks.
June 2019: EU Commission publishes guidelines for non-financial reporting of climate-related
information.

ESG Bond Market / 33
PLEASE SEE IMPORTANT DISCLOSURES ON THE LAST SIX PAGES OF THIS REPORT.
EU taxonomy: defining what is green
The EU’s Technical Expert Group on Sustainable
Finance (TEG) released its final report on the EU
Taxonomy on 18 June 2019.
The final report details the motivation,
methodology and expected impact of the
Taxonomy – providing ESG bond market
participants with a comprehensive classification of
76 economic activities from seven industry sectors
including agriculture, manufacturing and
transportation.
The current Taxonomy looks at both climate
mitigation and climate adaption activities, whilst
future iterations will aim to tackle a further four
environmental objectives: i) sustainable use and
protection of marines resources; ii) transition to a
circular economy, waste prevention and recycling;
iii) pollution prevention and control; and iv)
protection of healthy ecosystems.
When compared to similar publicly available
taxonomies (namely the Climate Bond Initiative
Taxonomy, and the People’s Bank of China (PBoC)
Green Bond Endorsed Project Catalogue), the EU
taxonomy provides a tangible step-up in terms of
depth and clarity of assessment.
ESG Bond Market / 34
PLEASE SEE IMPORTANT DISCLOSURES ON THE LAST SIX PAGES OF THIS REPORT.
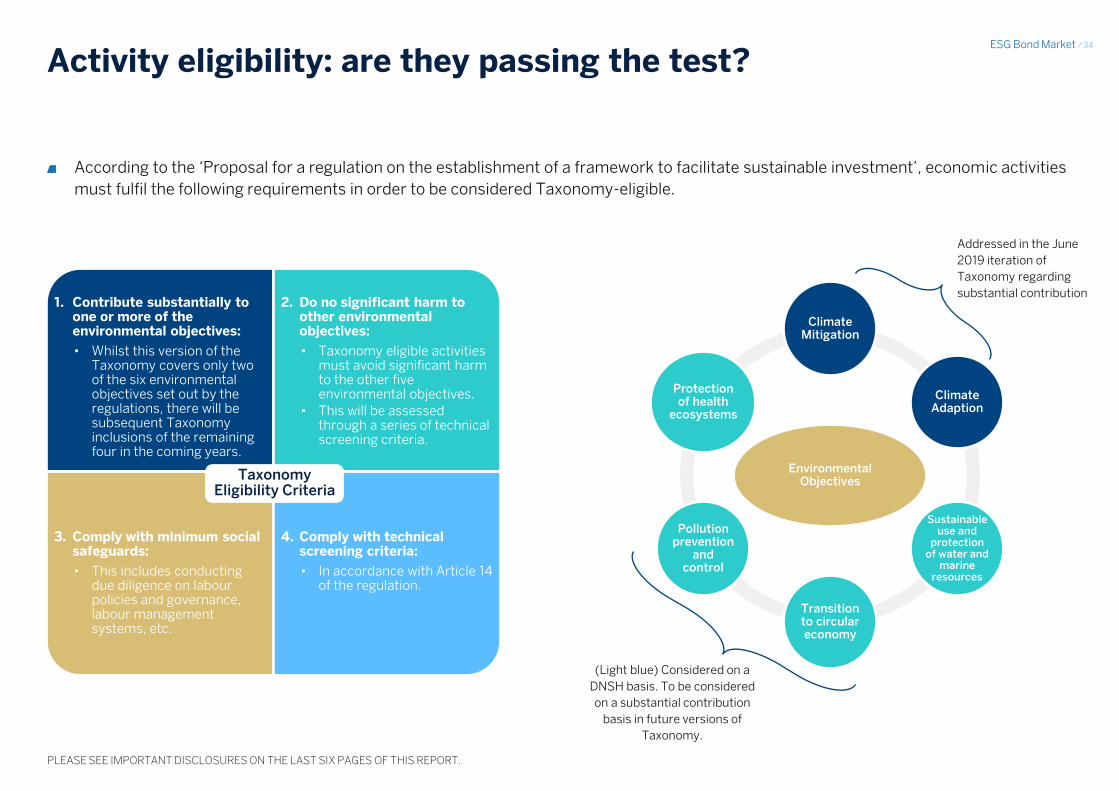
Activity eligibility: are they passing the test?
According to the ‘Proposal for a regulation on the establishment of a framework to facilitate sustainable investment’, economic activities
must fulfil the following requirements in order to be considered Taxonomy-eligible.
1. Contribute substantially to one or more of the environmental objectives:
• Whilst this version of the Taxonomy covers only two of the six environmental objectives set out by the regulations, there will be subsequent Taxonomy inclusions of the remaining four in the coming years.
2. Do no significant harm to other environmental objectives:
• Taxonomy eligible activities must avoid significant harm to the other five environmental objectives.
• This will be assessed through a series of technical screening criteria.
3. Comply with minimum social safeguards:
• This includes conducting due diligence on labour policies and governance, labour management systems, etc.
4. Comply with technical screening criteria:
• In accordance with Article 14 of the regulation.
Taxonomy Eligibility Criteria
Environmental Objectives
Climate Mitigation
Climate Adaption
Sustainable use and
protection of water and
marine resources
Transition to circular economy
Pollution prevention
and control
Protection of health
ecosystems
Addressed in the June
2019 iteration of
Taxonomy regarding
substantial contribution
(Light blue) Considered on a
DNSH basis. To be considered
on a substantial contribution
basis in future versions of
Taxonomy.
ESG Bond Market / 35
PLEASE SEE IMPORTANT DISCLOSURES ON THE LAST SIX PAGES OF THIS REPORT.
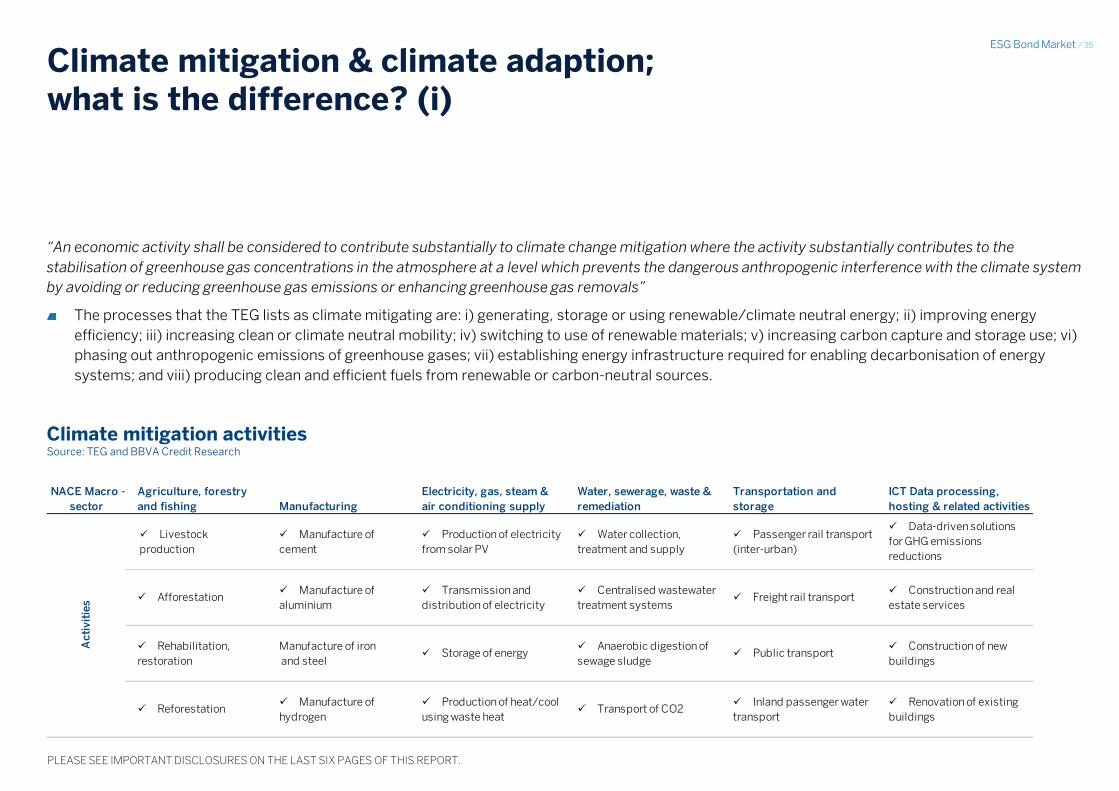
Climate mitigation & climate adaption; what is the difference? (i)
“An economic activity shall be considered to contribute substantially to climate change mitigation where the activity substantially contributes to the
stabilisation of greenhouse gas concentrations in the atmosphere at a level which prevents the dangerous anthropogenic interference with the climate system
by avoiding or reducing greenhouse gas emissions or enhancing greenhouse gas removals”
The processes that the TEG lists as climate mitigating are: i) generating, storage or using renewable/climate neutral energy; ii) improving energy
efficiency; iii) increasing clean or climate neutral mobility; iv) switching to use of renewable materials; v) increasing carbon capture and storage use; vi)
phasing out anthropogenic emissions of greenhouse gases; vii) establishing energy infrastructure required for enabling decarbonisation of energy
systems; and viii) producing clean and efficient fuels from renewable or carbon-neutral sources.
Excel: mitigation and adaption tables Hoja: Mitigation Table_revCB
NACE Macro -
sector
Agriculture, forestry
and fishing Manufacturing
Electricity, gas, steam &
air conditioning supply
Water, sewerage, waste &
remediation
Transportation and
storage
ICT Data processing,
hosting & related activities
Livestock
production
Manufacture of
cement
Production of electricity
from solar PV
Water collection,
treatment and supply
Passenger rail transport
(inter-urban)
Data-driven solutions
for GHG emissions
reductions
AfforestationManufacture of
aluminium
Transmission and
distribution of electricity
Centralised wastewater
treatment systemsFreight rail transport
Construction and real
estate services
Rehabilitation,
restoration
Manufacture of iron
and steelStorage of energy
Anaerobic digestion of
sewage sludgePublic transport
Construction of new
buildings
ReforestationManufacture of
hydrogen
Production of heat/cool
using waste heatTransport of CO2
Inland passenger water
transport
Renovation of existing
buildings
Ac
tiv
itie
s
Climate mitigation activities Source: TEG and BBVA Credit Research
ESG Bond Market / 36
PLEASE SEE IMPORTANT DISCLOSURES ON THE LAST SIX PAGES OF THIS REPORT.
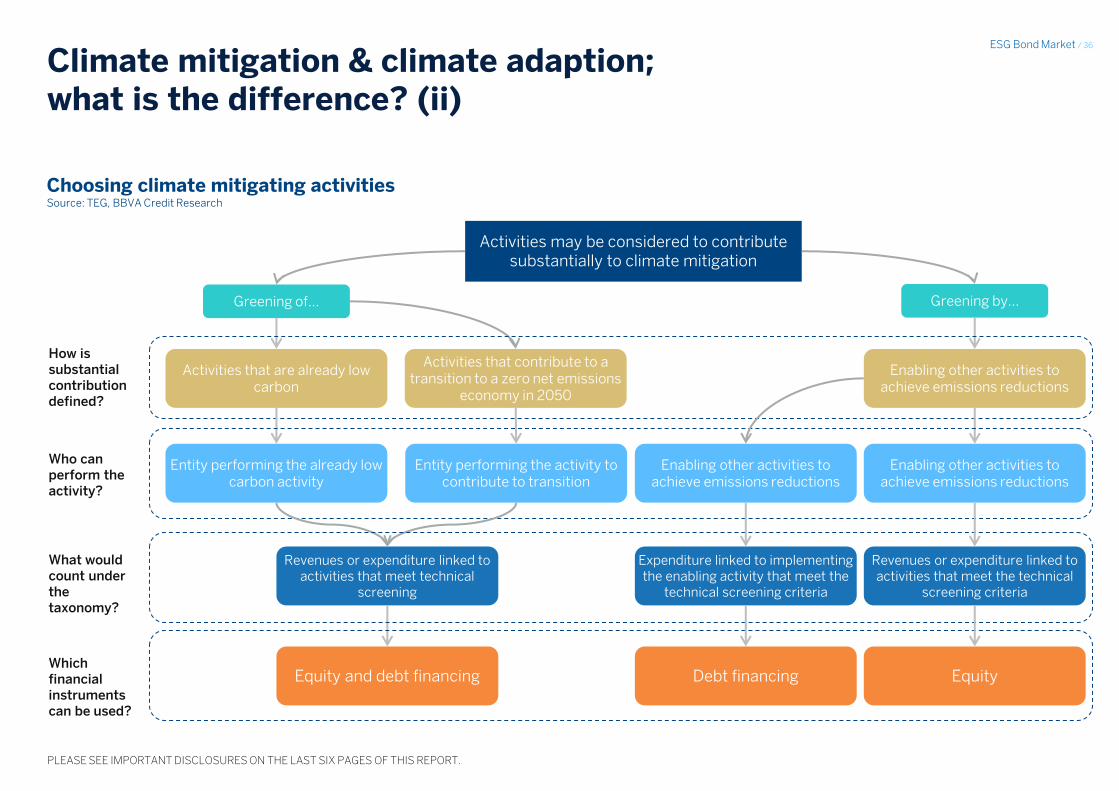
Climate mitigation & climate adaption; what is the difference? (ii)
Enabling other activities to achieve emissions reductions
Greening by…
Activities may be considered to contribute substantially to climate mitigation
Greening of…
Enabling other activities to achieve emissions reductions
Activities that contribute to a transition to a zero net emissions
economy in 2050
Activities that are already low carbon
Enabling other activities to achieve emissions reductions
Entity performing the activity to contribute to transition
Entity performing the already low carbon activity
Revenues or expenditure linked to activities that meet technical
screening
Equity and debt financing
Expenditure linked to implementing the enabling activity that meet the
technical screening criteria
Revenues or expenditure linked to activities that meet the technical
screening criteria
Debt financing Equity
Choosing climate mitigating activities Source: TEG, BBVA Credit Research
How is substantial contribution defined?
Who can perform the activity?
What would count under the taxonomy?
Which financial instruments can be used?

ESG Bond Market / 37
PLEASE SEE IMPORTANT DISCLOSURES ON THE LAST SIX PAGES OF THIS REPORT.
An example of climate mitigation; transmission and distribution of energy
Notes: * this is a small selection of metrics and thresholds. The full selection can be found in the technical report.
Excel: mitigation and adaption tables Hoja: Mitigation Example_revCB
Description of activityConstruction and operation of transmission lines/distribution systems that transport the electricity on the high-voltage interconnected system
with a view to its delivery to final customers/distrbutors.
Principle
• Support the integration of renewable energy into the power grid.
• Lead to significant GHG emissions reductions, from fuel switching or merit order optimisation, as a direct result of the investment.
• Decreases direct emissions from T&D infrastructure.
Examples of metrics &
thresholds*
The following T&D grid infrastructure-related activities are eligible, irrespective of whether the system is on a pathway to full decarbonisation:
• Direct connection of low carbon electricity generation below the threshold of 100 gCO2e/kWh declining to 0g CO2e/kWh in 2050 measured on
an LCE basis.
• EV charging stations and electric infrastructure for public transport.
Rationale
Increasing access to electricity throughout Europe will support its decarbonisation by enabling more consumers to transition from carbon-
intensive energy supply, while increasing the utilisation of renewable energy.
As Europe continues to fulfil its decarbonisation objectives, there will be fewer and fewer investments in transmission and distribution which are
not climate aligned. Under this logic, we propose that virtually all investments in electricity transmission and distribution infrastructure should be
considered climate-aligned under the EU Taxonomy.
This includes investments to electric grid infrastructure which improve the overall systems architecture. Naturally, there are a variety of
exceptions to this rule and this is reflected within the criteria.
Transmission and distribution of energy
Climate mitigation example: transmissions and distribution of energy Source: TEG and BBVA Credit Research

ESG Bond Market / 38
PLEASE SEE IMPORTANT DISCLOSURES ON THE LAST SIX PAGES OF THIS REPORT.
Climate mitigation & climate adaption; what is the difference? (iii)
“An economic activity shall be considered to contribute substantially to climate change adaptation where that activity contributes substantially to reducing the
negative effects of the current and expected future climate or preventing an increase or shifting of negative effects of climate change”
Activities can make a substantial contribution to adaption objectives if:
1. All material physical climate risks identified for the economic activity are reduced to the extent possible and on a best effort basis; and/or
2. It reduces material physical climate risk in other economic activity
Economic activities can contribute to adaption objectives in two different ways:
1. Adaptation of an economic activity: an economic activity is made more climate resilient by integrating measures to reduce all material physical
climate risks to the extent possible and on a best-effort basis.
2. Adaptation by an economic activity: an economic activity contributes to adaptation of other economic activities to physical climate risks and must
also be resilient to physical climate risks itself.
Excel: mitigation and adaption tables Hoja: Adaption table_revCB
NACE Macro -
sector
Agriculture, forestry and
fishing
Electricity, gas, steam & air
conditioning supply
Water, sewerage, waste
& remediation ICT
Finance and Insurance /
Professional, scientific and technical activities
Growing of non-
perennial crops
Production of electricty from
hydropower Non-Life insurance
Silviculture and other
forestry activities Transmission lines
Research and development (natural
sciences and engineering)
Engineering activities and related technical
consultancy.
Climate change adaption activities
Activities
Provision of speclialised
telecommunications applications
for weather monitoring and
forecast.
Sewage
Climate adaption activities Source: TEG and BBVA Credit Research
ESG Bond Market / 39
PLEASE SEE IMPORTANT DISCLOSURES ON THE LAST SIX PAGES OF THIS REPORT.
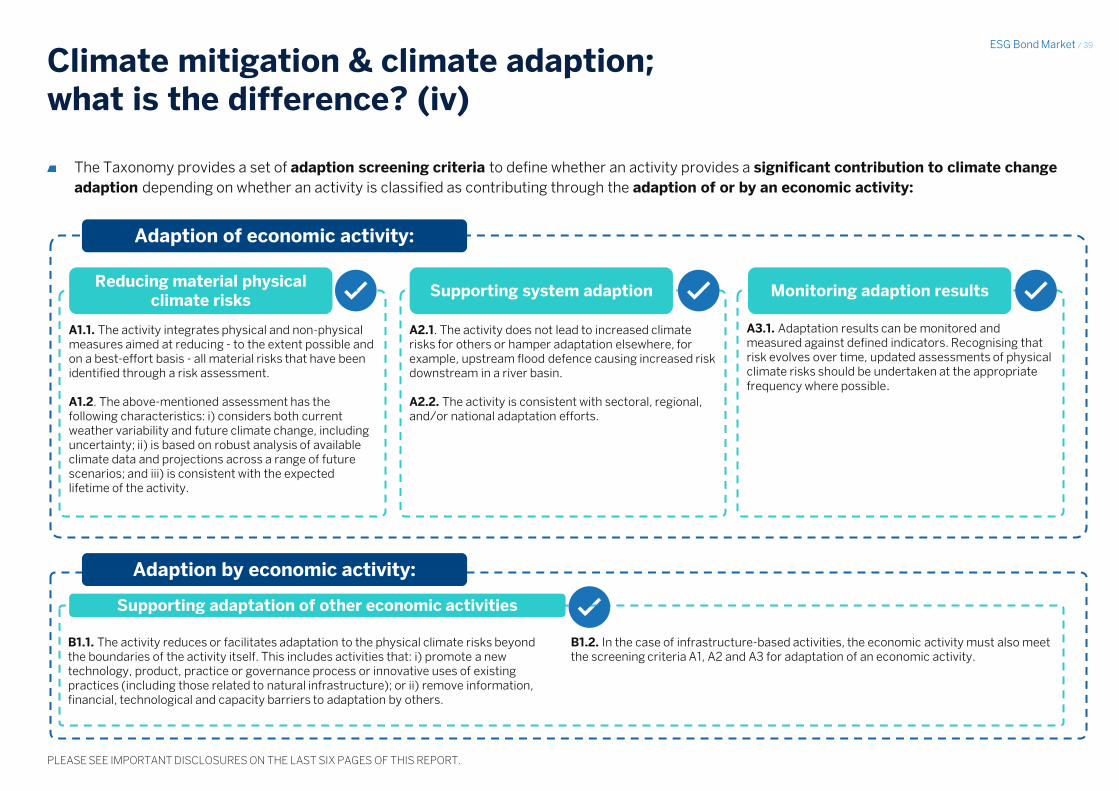
A1.1. The activity integrates physical and non-physical measures aimed at reducing - to the extent possible and on a best-effort basis - all material risks that have been identified through a risk assessment. A1.2. The above-mentioned assessment has the following characteristics: i) considers both current weather variability and future climate change, including uncertainty; ii) is based on robust analysis of available climate data and projections across a range of future scenarios; and iii) is consistent with the expected lifetime of the activity.
A3.1. Adaptation results can be monitored and measured against defined indicators. Recognising that risk evolves over time, updated assessments of physical climate risks should be undertaken at the appropriate frequency where possible.
A2.1. The activity does not lead to increased climate risks for others or hamper adaptation elsewhere, for example, upstream flood defence causing increased risk downstream in a river basin. A2.2. The activity is consistent with sectoral, regional, and/or national adaptation efforts.
Climate mitigation & climate adaption; what is the difference? (iv)
The Taxonomy provides a set of adaption screening criteria to define whether an activity provides a significant contribution to climate change
adaption depending on whether an activity is classified as contributing through the adaption of or by an economic activity:
Adaption of economic activity:
Reducing material physical climate risks
Supporting system adaption Monitoring adaption results
B1.1. The activity reduces or facilitates adaptation to the physical climate risks beyond the boundaries of the activity itself. This includes activities that: i) promote a new technology, product, practice or governance process or innovative uses of existing practices (including those related to natural infrastructure); or ii) remove information, financial, technological and capacity barriers to adaptation by others.
B1.2. In the case of infrastructure-based activities, the economic activity must also meet the screening criteria A1, A2 and A3 for adaptation of an economic activity.
Adaption by economic activity:
Supporting adaptation of other economic activities
ESG Bond Market / 40
PLEASE SEE IMPORTANT DISCLOSURES ON THE LAST SIX PAGES OF THIS REPORT.
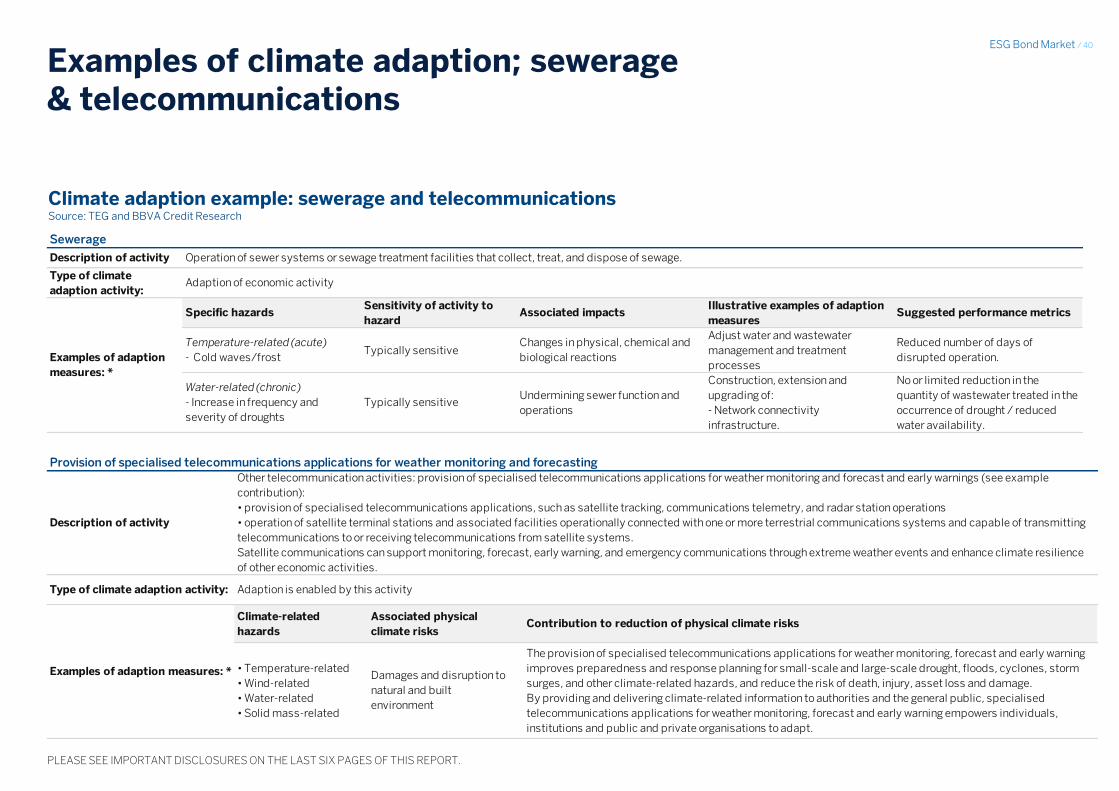
Examples of climate adaption; sewerage & telecommunications
Excel: mitigation and adaption tables Hoja: Adaption example_revCB
Description of activity
Type of climate
adaption activity:
Specific hazardsSensitivity of activity to
hazardAssociated impacts
Illustrative examples of adaption
measuresSuggested performance metrics
Temperature-related (acute)
- Cold waves/frostTypically sensitive
Changes in physical, chemical and
biological reactions
Adjust water and wastewater
management and treatment
processes
Reduced number of days of
disrupted operation.
Water-related (chronic)
- Increase in frequency and
severity of droughts
Typically sensitiveUndermining sewer function and
operations
Construction, extension and
upgrading of:
- Network connectivity
infrastructure.
No or limited reduction in the
quantity of wastewater treated in the
occurrence of drought / reduced
water availability.
Operation of sewer systems or sewage treatment facilities that collect, treat, and dispose of sewage.
Adaption of economic activity
Examples of adaption
measures: *
Sewerage
Description of activity
Type of climate adaption activity:
Climate-related
hazards
Associated physical
climate risksContribution to reduction of physical climate risks
• Temperature-related
• Wind-related
• Water-related
• Solid mass-related
Damages and disruption to
natural and built
environment
The provision of specialised telecommunications applications for weather monitoring, forecast and early warning
improves preparedness and response planning for small-scale and large-scale drought, floods, cyclones, storm
surges, and other climate-related hazards, and reduce the risk of death, injury, asset loss and damage.
By providing and delivering climate-related information to authorities and the general public, specialised
telecommunications applications for weather monitoring, forecast and early warning empowers individuals,
institutions and public and private organisations to adapt.
Adaption is enabled by this activity
Examples of adaption measures: *
Other telecommunication activities: provision of specialised telecommunications applications for weather monitoring and forecast and early warnings (see example
contribution):
• provision of specialised telecommunications applications, such as satellite tracking, communications telemetry, and radar station operations
• operation of satellite terminal stations and associated facilities operationally connected with one or more terrestrial communications systems and capable of transmitting
telecommunications to or receiving telecommunications from satellite systems.
Satellite communications can support monitoring, forecast, early warning, and emergency communications through extreme weather events and enhance climate resilience
of other economic activities.
Provision of specialised telecommunications applications for weather monitoring and forecasting
Climate adaption example: sewerage and telecommunications Source: TEG and BBVA Credit Research
ESG Bond Market / 41
PLEASE SEE IMPORTANT DISCLOSURES ON THE LAST SIX PAGES OF THIS REPORT.
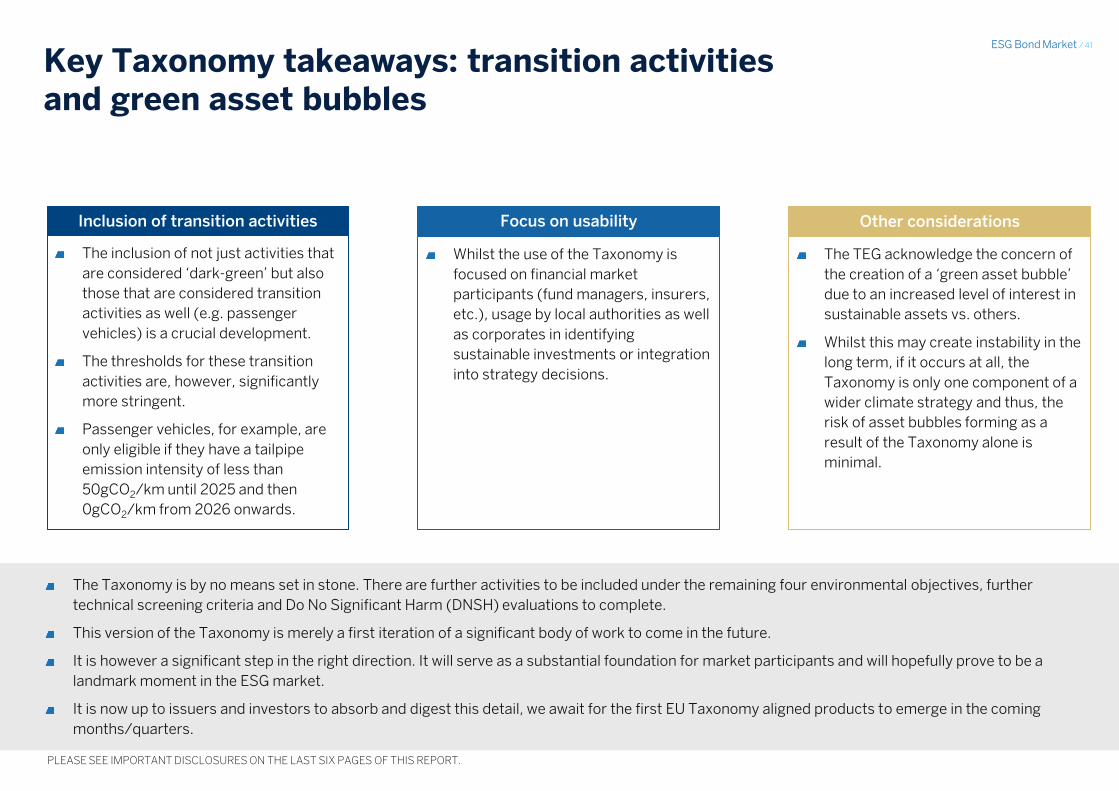
Key Taxonomy takeaways: transition activities and green asset bubbles
Inclusion of transition activities
The inclusion of not just activities that
are considered ‘dark-green’ but also
those that are considered transition
activities as well (e.g. passenger
vehicles) is a crucial development.
The thresholds for these transition
activities are, however, significantly
more stringent.
Passenger vehicles, for example, are
only eligible if they have a tailpipe
emission intensity of less than
50gCO2/km until 2025 and then
0gCO2/km from 2026 onwards.
Focus on usability
Whilst the use of the Taxonomy is
focused on financial market
participants (fund managers, insurers,
etc.), usage by local authorities as well
as corporates in identifying
sustainable investments or integration
into strategy decisions.
Other considerations
The TEG acknowledge the concern of
the creation of a ‘green asset bubble’
due to an increased level of interest in
sustainable assets vs. others.
Whilst this may create instability in the
long term, if it occurs at all, the
Taxonomy is only one component of a
wider climate strategy and thus, the
risk of asset bubbles forming as a
result of the Taxonomy alone is
minimal.
The Taxonomy is by no means set in stone. There are further activities to be included under the remaining four environmental objectives, further
technical screening criteria and Do No Significant Harm (DNSH) evaluations to complete.
This version of the Taxonomy is merely a first iteration of a significant body of work to come in the future.
It is however a significant step in the right direction. It will serve as a substantial foundation for market participants and will hopefully prove to be a
landmark moment in the ESG market.
It is now up to issuers and investors to absorb and digest this detail, we await for the first EU Taxonomy aligned products to emerge in the coming
months/quarters.
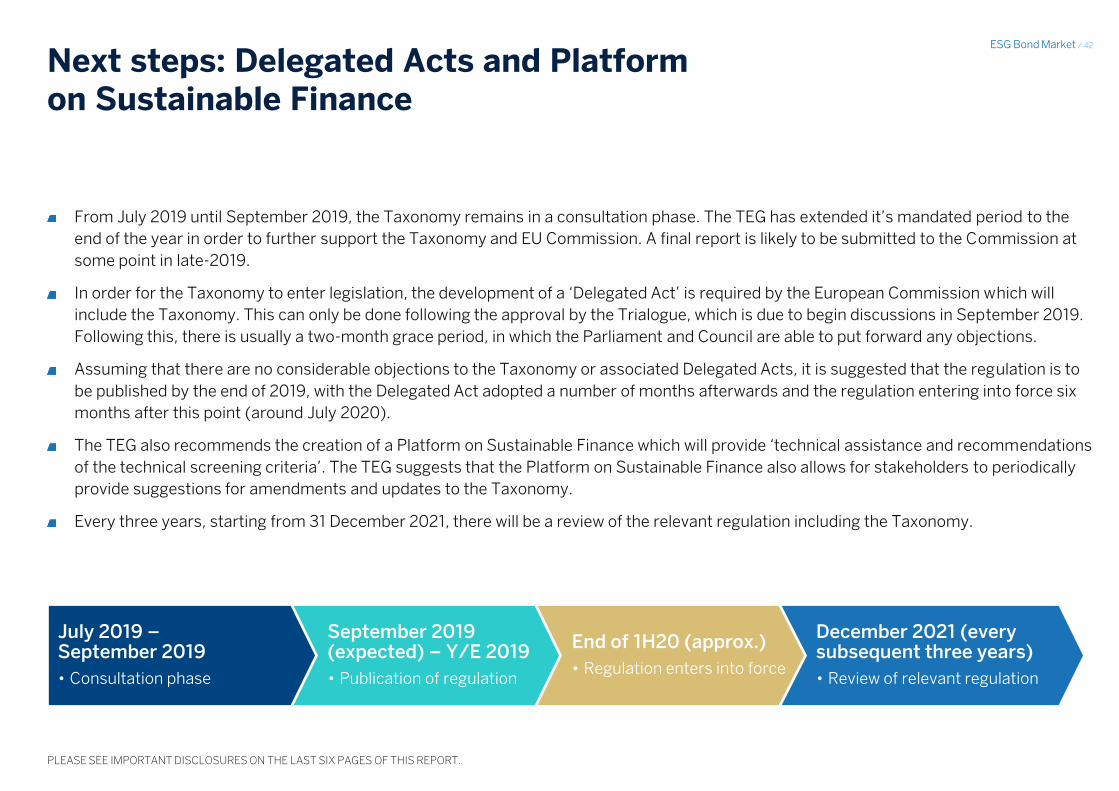
ESG Bond Market / 42
PLEASE SEE IMPORTANT DISCLOSURES ON THE LAST SIX PAGES OF THIS REPORT.
Next steps: Delegated Acts and Platform on Sustainable Finance
From July 2019 until September 2019, the Taxonomy remains in a consultation phase. The TEG has extended it’s mandated period to the
end of the year in order to further support the Taxonomy and EU Commission. A final report is likely to be submitted to the Commission at
some point in late-2019.
In order for the Taxonomy to enter legislation, the development of a ‘Delegated Act’ is required by the European Commission which will
include the Taxonomy. This can only be done following the approval by the Trialogue, which is due to begin discussions in September 2019.
Following this, there is usually a two-month grace period, in which the Parliament and Council are able to put forward any objections.
Assuming that there are no considerable objections to the Taxonomy or associated Delegated Acts, it is suggested that the regulation is to
be published by the end of 2019, with the Delegated Act adopted a number of months afterwards and the regulation entering into force six
months after this point (around July 2020).
The TEG also recommends the creation of a Platform on Sustainable Finance which will provide ‘technical assistance and recommendations
of the technical screening criteria’. The TEG suggests that the Platform on Sustainable Finance also allows for stakeholders to periodically
provide suggestions for amendments and updates to the Taxonomy.
Every three years, starting from 31 December 2021, there will be a review of the relevant regulation including the Taxonomy.
July 2019 – September 2019
• Consultation phase
September 2019 (expected) – Y/E 2019
• Publication of regulation
End of 1H20 (approx.)
• Regulation enters into force
December 2021 (every subsequent three years)
• Review of relevant regulation

ESG Bond Market / 43
PLEASE SEE IMPORTANT DISCLOSURES ON THE LAST SIX PAGES OF THIS REPORT.
EU GBS: setting the standard
In June 2019, the TEG published the final report of the EU GBS, which included the motivation and goals of the EU GBS and to what extent it may
be able to support and foster further growth in the c.USD250bn European (USD538bn global) green, social and sustainable bond market.
The purpose of the GBS is to lay out exactly what can be classified as an ‘EU green bond’, building on the ICMAs green bond principles to try
to further the endeavour to harmonise the standards and principles of not just the European, but also the global green bond market. In
order to be labelled an ‘EU green bond’, issuers must ensure that all of the following requirements are met:
“The issuer’s green bond framework shall confirm the alignment of the EU green bond with the EU GBS”
“The proceeds, or an amount equal to such proceeds, shall be exclusively used to finance or refinance in part or in full new and/or existing green
projects”
“The alignment of the bond with the EU GBS shall have been verified by an accredited external reviewer”
The GBS is built upon four principles:
EU GBS should be a voluntary standard
Issuers have the choice of issuing in alignment with the EU
GBS. If they do choose to do so, alignment is to be verified
by an accredited external reviewer.
01
The EU GBS should be both a European and
International Standard
Scope of the EU GBS is not limited to geography or form of
instrument.
03
The EU GBS should be built on market best practices
Current market practice is based upon transparency and
standards of reporting.
02
The EU GBS should be open to existing green bond
transactions and to all types of issuers
The standard should not discriminate between issuers,
allowing new and existing issuers of green bonds to align
their issuance frameworks to the standard.
04

ESG Bond Market / 44
PLEASE SEE IMPORTANT DISCLOSURES ON THE LAST SIX PAGES OF THIS REPORT.
EU GBS: what do you recommend?
The TEG initially provided eleven recommendations for the EU Commission in their March 2019 invitation for feedback. These have been revised to ten
recommendations in the final report:
These recommendations are designed to address what the TEG consider to be the main barriers for growth for the ESG bond market in
Europe: 1) Lack of Green projects, 2) Issuers concerns over reputational risks and green definitions, 3) Absence of clear economic benefit
for issuers, 4) Complex and potentially costly procedures for reporting and external review, 5) Labour intensive reporting procedures, 6)
Uncertainty on the type of assets and expenses that can be financed.
Ten recommendations for EU Commission by the TEG
Create a voluntary green bond standard
The EU-GBS should comprise four core components: (1)
alignment of Green Projects with the EU Taxonomy, (2)
Green Bond framework, (3) reporting and (4) verification by
accredited verifiers.
Encourage the set-up of a voluntary interim registration
process for Verifiers of EU Green Bonds for an estimated
transition period of up to three years.
Investors, in particular institutional investors, are encouraged
to use the requirements of the EU-GBS when designing their
green fixed-income investment strategies and to communicate
their preference and expectations actively to green bond
issuers as well as to underwriters.
The TEG welcomes the recent political compromise on the
sustainability-related disclosures regulation and recommends
that the European Commission adopts an ambitious disclosures
regime on green bond holdings for institutional investors.
Consider promoting greening the financial system by
expressing and implementing a preference for EU Green
Bonds.
Consider developing financial incentives to support the EU
Green Bond Market alignment with the EU-GBS.
The TEG encourages all types of bond issuers to issue their
future green bonds in conformity with the requirements of
the EU-GBS.
Promote adoption of the EU-GBS through the EU Ecolabel for
financial products.
Monitor impact on the alignment of financial flows with the
EU Taxonomy’s Environmental Objectives and consider
further supporting action including possible legislation after
an estimated period of up to three years.

ESG Bond Market / 45
PLEASE SEE IMPORTANT DISCLOSURES ON THE LAST SIX PAGES OF THIS REPORT.
EU GBS: four key components
Green Projects
Linking the Taxonomy with the Green Bond Standard
Green Bond Frameworks
Formalising the role and usage of issuers Green Bond Frameworks (GBF)
Reporting
Clarifying the requirements of reporting guidelines
Verification
Use of accredited external reviewers is mandatory under EU GBS
The definition of Green Projects is explicitly linked to the EU Taxonomy.
Green Projects can include green assets and expenditures that
‘contribute to improving and maintaining the value of such green
assets’.
This may include: physical/financial assets (i.e. loans or share of
working capital), capex/selected opex (i.e. maintenance costs to
increase lifetime of green assets) and sovereign expenditures for green
public investments.
Opex is not normally eligible, but exceptional cases may be considered.
The use of green bond frameworks by issuers of green bonds under the
green bond standards must include the following:
• Environmental objectives of the EU Green Bond, how issuers’
strategy aligns and rationale for issuing the bond.
• Process for determining alignment with EU Taxonomy.
• Description of green projects to be financed.
• Details of the link between the investment in green projects and
green bond.
• Methodology and assumptions of impact metrics.
• Description of reporting.
Many of the concerns of the emerging investor base have been the
quality and consistency of impact reporting following the issuance of a
green bond.
The GBS addresses this by laying out what is required of issuers.
Two types of reporting are required under the GBS: i) allocation
reporting (i.e. how much capital is being allocated to Green Projects);
and ii) impact reporting (description of environmental impacts of the
projects being financed).
This can be done on a project-by-project basis or on a portfolio basis.
External verifiers (e.g. Sustainalytics, Vigeo etc.) play a vital role in the
green bond market.
The usage of these verifiers in mandatory under the GBS.
Verifiers must be accredited through the recommended ESMA-led
centralised accreditation regime.
The verification of estimated impact reports is not mandatory, however.
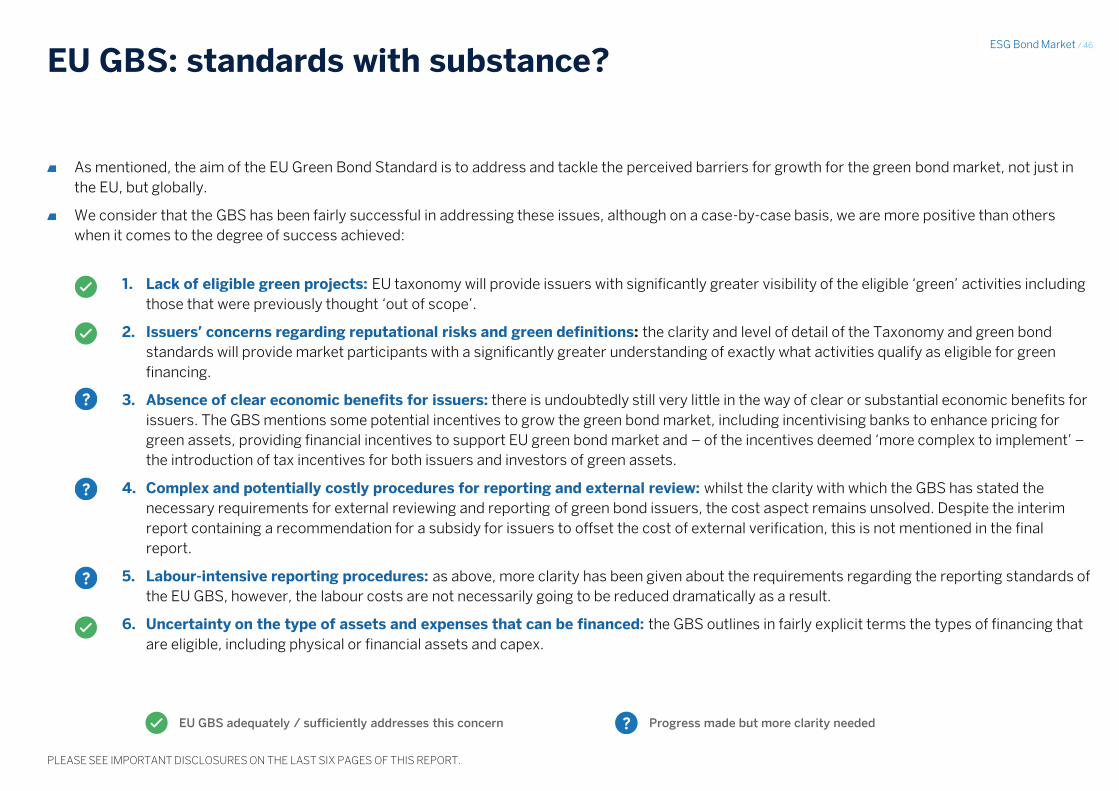
ESG Bond Market / 46
PLEASE SEE IMPORTANT DISCLOSURES ON THE LAST SIX PAGES OF THIS REPORT.
EU GBS: standards with substance?
As mentioned, the aim of the EU Green Bond Standard is to address and tackle the perceived barriers for growth for the green bond market, not just in
the EU, but globally.
We consider that the GBS has been fairly successful in addressing these issues, although on a case-by-case basis, we are more positive than others
when it comes to the degree of success achieved:
1. Lack of eligible green projects: EU taxonomy will provide issuers with significantly greater visibility of the eligible ‘green’ activities including
those that were previously thought ‘out of scope’.
2. Issuers’ concerns regarding reputational risks and green definitions: the clarity and level of detail of the Taxonomy and green bond
standards will provide market participants with a significantly greater understanding of exactly what activities qualify as eligible for green
financing.
3. Absence of clear economic benefits for issuers: there is undoubtedly still very little in the way of clear or substantial economic benefits for
issuers. The GBS mentions some potential incentives to grow the green bond market, including incentivising banks to enhance pricing for
green assets, providing financial incentives to support EU green bond market and – of the incentives deemed ‘more complex to implement’ –
the introduction of tax incentives for both issuers and investors of green assets.
4. Complex and potentially costly procedures for reporting and external review: whilst the clarity with which the GBS has stated the
necessary requirements for external reviewing and reporting of green bond issuers, the cost aspect remains unsolved. Despite the interim
report containing a recommendation for a subsidy for issuers to offset the cost of external verification, this is not mentioned in the final
report.
5. Labour-intensive reporting procedures: as above, more clarity has been given about the requirements regarding the reporting standards of
the EU GBS, however, the labour costs are not necessarily going to be reduced dramatically as a result.
6. Uncertainty on the type of assets and expenses that can be financed: the GBS outlines in fairly explicit terms the types of financing that
are eligible, including physical or financial assets and capex.
EU GBS adequately / sufficiently addresses this concern Progress made but more clarity needed
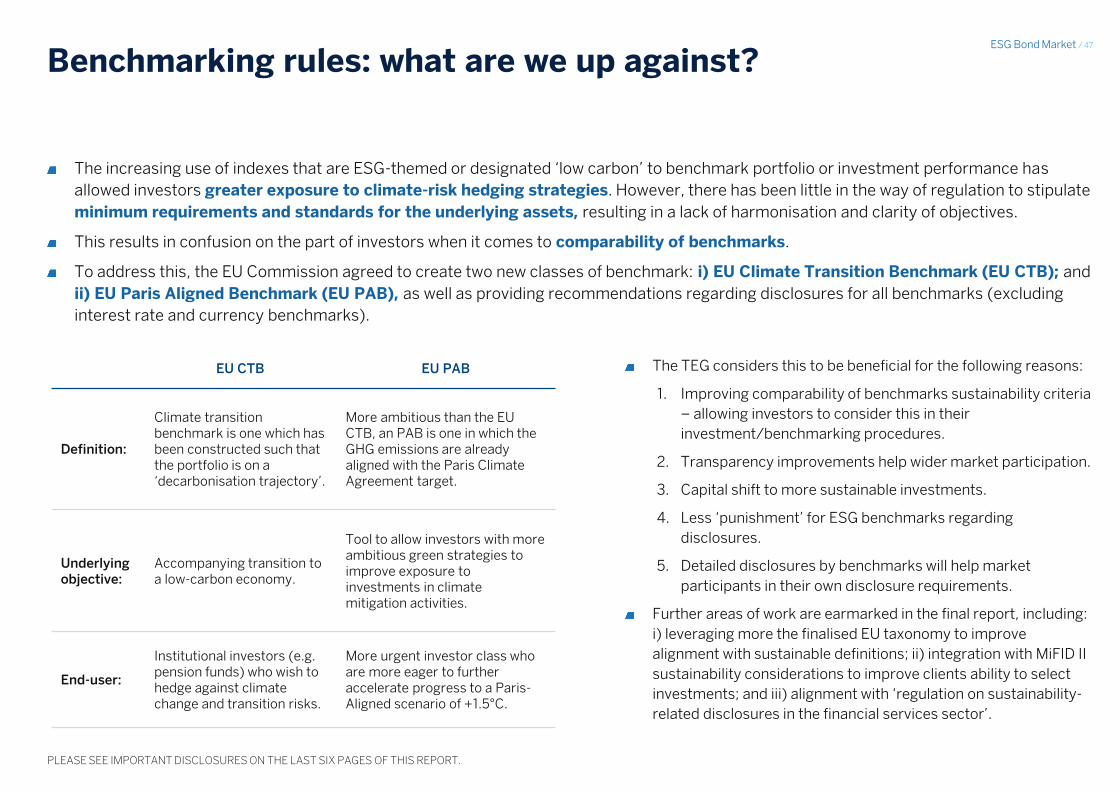
ESG Bond Market / 47
PLEASE SEE IMPORTANT DISCLOSURES ON THE LAST SIX PAGES OF THIS REPORT.
Benchmarking rules: what are we up against?
The increasing use of indexes that are ESG-themed or designated ‘low carbon’ to benchmark portfolio or investment performance has
allowed investors greater exposure to climate-risk hedging strategies. However, there has been little in the way of regulation to stipulate
minimum requirements and standards for the underlying assets, resulting in a lack of harmonisation and clarity of objectives.
This results in confusion on the part of investors when it comes to comparability of benchmarks.
To address this, the EU Commission agreed to create two new classes of benchmark: i) EU Climate Transition Benchmark (EU CTB); and
ii) EU Paris Aligned Benchmark (EU PAB), as well as providing recommendations regarding disclosures for all benchmarks (excluding
interest rate and currency benchmarks).
EU CTB EU PAB
Definition:
Climate transition benchmark is one which has been constructed such that the portfolio is on a ‘decarbonisation trajectory’.
More ambitious than the EU CTB, an PAB is one in which the GHG emissions are already aligned with the Paris Climate Agreement target.
Underlying objective:
Accompanying transition to a low-carbon economy.
Tool to allow investors with more ambitious green strategies to improve exposure to investments in climate mitigation activities.
End-user:
Institutional investors (e.g. pension funds) who wish to hedge against climate change and transition risks.
More urgent investor class who are more eager to further accelerate progress to a Paris-Aligned scenario of +1.5°C.
The TEG considers this to be beneficial for the following reasons:
1. Improving comparability of benchmarks sustainability criteria
– allowing investors to consider this in their
investment/benchmarking procedures.
2. Transparency improvements help wider market participation.
3. Capital shift to more sustainable investments.
4. Less ‘punishment’ for ESG benchmarks regarding
disclosures.
5. Detailed disclosures by benchmarks will help market
participants in their own disclosure requirements.
Further areas of work are earmarked in the final report, including:
i) leveraging more the finalised EU taxonomy to improve
alignment with sustainable definitions; ii) integration with MiFID II
sustainability considerations to improve clients ability to select
investments; and iii) alignment with ‘regulation on sustainability-
related disclosures in the financial services sector’.

ESG Bond Market / 48
PLEASE SEE IMPORTANT DISCLOSURES ON THE LAST SIX PAGES OF THIS REPORT.
Fixed income (corporate) benchmark disclosure requirements Source: TEG, BBVA Credit Research
Benchmarking rules: disclosures for credit benchmarks
ESG themes Disclosures Rationale for inclusion Supporting standards and specifications
- Average ESG rating of bond issuers (relative to
securities covered by ESG research)
- Overall ESG ratings of top ten index constituents
by weighting in index
- Total weighting of index constituents not meeting
the principles of the UN Global Compact (conduct-
related controversy screen)
- Average Environmental rating of index (E
component of ESG rating) (relative to securities
covered by ESG research)
- List of high emitting sectors
- High emitting sector exposure (% of total
weighting)
- GHG accounting standard used (GHG Protocol or
ISO)
- Carbon intensity- GHG data source and % of reported versus
estimated emissions
- Portfolio exposure to green economy as
measured by % of green revenues
- EU Taxonomy (to determine portfolio exposure to
green economy)
- % of green bonds in portfolio- Green bond standard used (eg ICMA or EU Green
Bond Standard)
- Average Social rating of index (S component of
ESG rating) (relative to securities covered by ESG
research)
- Total weighting of index constituents in
controversial weapon and tobacco sectors
Governance
- Governance rating of index (G component of ESG
rating) (relative to securities covered by ESG
research)
- Governance considerations in fixed income are
applied in a different way than in equities.
- ESG rating methodology used
- UN Global Compact Principles
- Sector exposures provides visibility on climate-
related transition and technology risks and
opportunities captured by the benchmark portfolio.
-Total GHG emissions associated with the index
portfolio are commonly used by investors for their
own reporting purposes.
- Definition of controversial weapons used- Negative screening for controversial weapons is
commonly applied by investors.
Environmental
Social
Overall ESG
- Provide investors with further information about
portfolio exposure to risks and opportunities not yet
fully reflected in the market valuation.
-Controversy screening based on UN Global Compact
is commonly applied in ESG ratings industry.
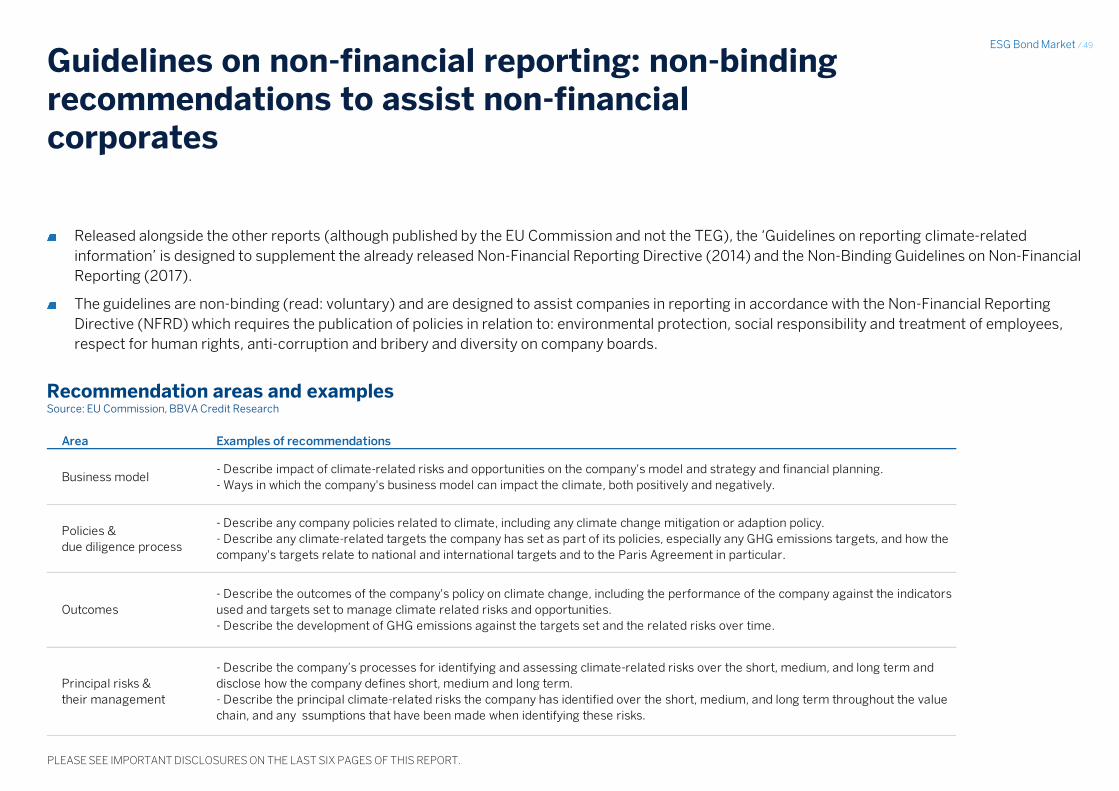
ESG Bond Market / 49
PLEASE SEE IMPORTANT DISCLOSURES ON THE LAST SIX PAGES OF THIS REPORT.
Guidelines on non-financial reporting: non-binding recommendations to assist non-financial corporates
Released alongside the other reports (although published by the EU Commission and not the TEG), the ‘Guidelines on reporting climate-related
information’ is designed to supplement the already released Non-Financial Reporting Directive (2014) and the Non-Binding Guidelines on Non-Financial
Reporting (2017).
The guidelines are non-binding (read: voluntary) and are designed to assist companies in reporting in accordance with the Non-Financial Reporting
Directive (NFRD) which requires the publication of policies in relation to: environmental protection, social responsibility and treatment of employees,
respect for human rights, anti-corruption and bribery and diversity on company boards.
Recommendation areas and examples Source: EU Commission, BBVA Credit Research
Excel: tables disclosures Hoja: sheet 1_revCB
Area Examples of recommendations
Business model- Describe impact of climate-related risks and opportunities on the company's model and strategy and financial planning.
- Ways in which the company's business model can impact the climate, both positively and negatively.
Policies &
due diligence process
- Describe any company policies related to climate, including any climate change mitigation or adaption policy.
- Describe any climate-related targets the company has set as part of its policies, especially any GHG emissions targets, and how the
company's targets relate to national and international targets and to the Paris Agreement in particular.
Outcomes
- Describe the outcomes of the company's policy on climate change, including the performance of the company against the indicators
used and targets set to manage climate related risks and opportunities.
- Describe the development of GHG emissions against the targets set and the related risks over time.
Principal risks &
their management
- Describe the company’s processes for identifying and assessing climate-related risks over the short, medium, and long term and
disclose how the company defines short, medium and long term.
- Describe the principal climate-related risks the company has identified over the short, medium, and long term throughout the value
chain, and any ssumptions that have been made when identifying these risks.

ESG Bond Market / 50
PLEASE SEE IMPORTANT DISCLOSURES ON THE LAST SIX PAGES OF THIS REPORT.
Scoping in on emissions: a word on GHG emissions reporting
Under the ‘Principal Risks and their Management’ section, the suggested KPIs to measure Greenhouse Gas (GHG) emissions are broken
down into four indicators: 1) direct GHG emissions (Scope 1), 2) indirect GHG emissions from the generation of acquired and consumed
electricity, steam, heat, or cooling (Scope 2) 3) all other indirect GHG emissions that occur in the value chain of the reporting company
(Scope 3), 4) GHG absolute emissions target.
Traditionally Scope 1 & 2 emissions data has been significantly easier to measure and quantify than Scope 3 emissions because it
encapsulates emissions from the entire supply chain (both up-and down-stream activities).
Scope 3 emissions are also likely to be significantly larger than Scope 1 and 2 emissions, hence, the EU Commission suggest that
companies should focus on their Scope 3 GHG emissions, including their counterparty Scope 3 emissions.
Excel: tables disclosures Hoja: sheet 2_revCB
Scope Description Rationale
Scope 1 Direct GHG emissions from sources owned or controlled by the companyThis KPI ensures companies are accurately measuring their carbon footprints
from direct emissions.
Scope 2Indirect GHG emissions from the generation of acquired and consumed electricity,
steam, heat, or cooling (collectively referred to as “electricity”)
This KPI ensure companies are measuring emissions from purchased or acquired
electricity, steam, heat, and cooling.
Scope 3All indirect GHG emissions (not included in scope 2) that occur in the value chain
of the reporting company, including both upstream and downstream emissions
For most companies, the majority of emissions occur indirectly from value-chain
activities.
This KPI helps to gauge the thoroughness of companies’ accounting processes
and to understand how companies are analysing their emissions footprints.
Emissions reporting scopes Source: EU Commission, BBVA Credit Research
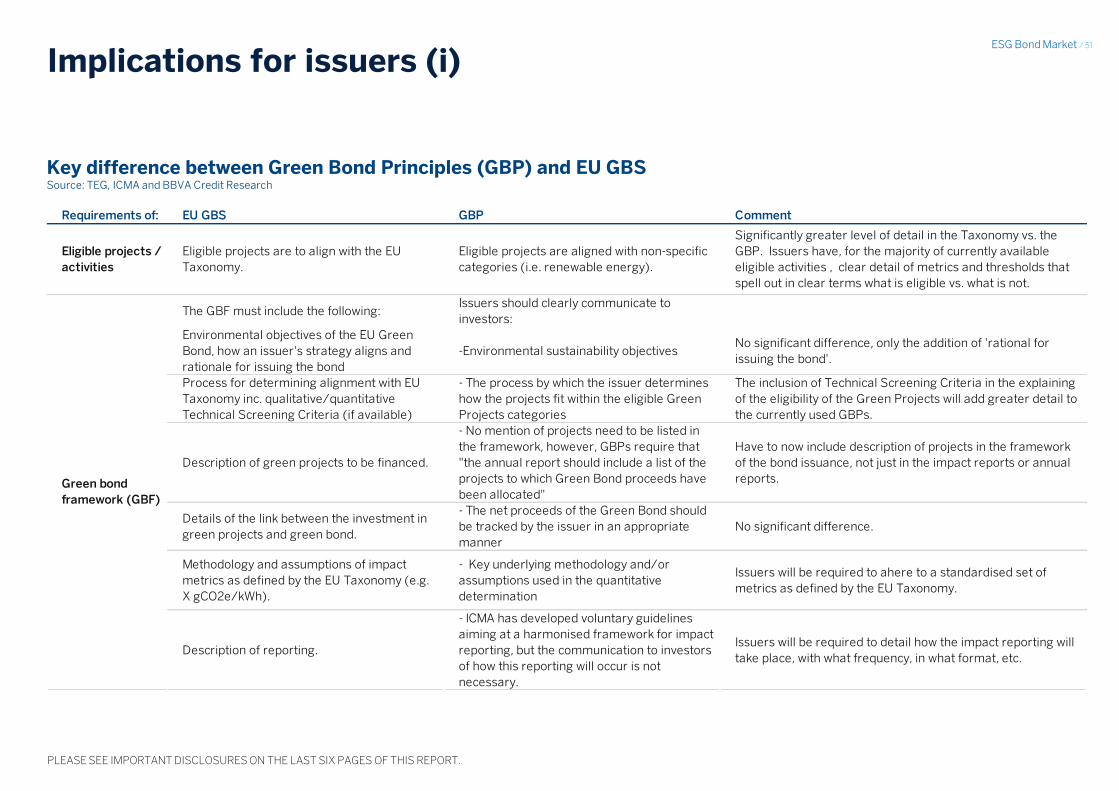
ESG Bond Market / 51
PLEASE SEE IMPORTANT DISCLOSURES ON THE LAST SIX PAGES OF THIS REPORT.
Implications for issuers (i)
Excel: issuer implications Hoja: sheet 2_revCB
Requirements of: EU GBS GBP Comment
Eligible projects /
activities
Eligible projects are to align with the EU
Taxonomy.
Eligible projects are aligned with non-specific
categories (i.e. renewable energy).
Significantly greater level of detail in the Taxonomy vs. the
GBP. Issuers have, for the majority of currently available
eligible activities , clear detail of metrics and thresholds that
spell out in clear terms what is eligible vs. what is not.
The GBF must include the following: Issuers should clearly communicate to
investors:
Environmental objectives of the EU Green
Bond, how an issuer's strategy aligns and
rationale for issuing the bond
-Environmental sustainability objectivesNo significant difference, only the addition of 'rational for
issuing the bond'.
Process for determining alignment with EU
Taxonomy inc. qualitative/quantitative
Technical Screening Criteria (if available)
- The process by which the issuer determines
how the projects fit within the eligible Green
Projects categories
The inclusion of Technical Screening Criteria in the explaining
of the eligibility of the Green Projects will add greater detail to
the currently used GBPs.
Description of green projects to be financed.
- No mention of projects need to be listed in
the framework, however, GBPs require that
"the annual report should include a list of the
projects to which Green Bond proceeds have
been allocated"
Have to now include description of projects in the framework
of the bond issuance, not just in the impact reports or annual
reports.
Details of the link between the investment in
green projects and green bond.
- The net proceeds of the Green Bond should
be tracked by the issuer in an appropriate
manner
No significant difference.
Methodology and assumptions of impact
metrics as defined by the EU Taxonomy (e.g.
X gCO2e/kWh).
- Key underlying methodology and/or
assumptions used in the quantitative
determination
Issuers will be required to ahere to a standardised set of
metrics as defined by the EU Taxonomy.
Description of reporting.
- ICMA has developed voluntary guidelines
aiming at a harmonised framework for impact
reporting, but the communication to investors
of how this reporting will occur is not
necessary.
Issuers will be required to detail how the impact reporting will
take place, with what frequency, in what format, etc.
Green bond
framework (GBF)
Key difference between Green Bond Principles (GBP) and EU GBS Source: TEG, ICMA and BBVA Credit Research

ESG Bond Market / 52
PLEASE SEE IMPORTANT DISCLOSURES ON THE LAST SIX PAGES OF THIS REPORT.
Implications for issuers (ii)
Excel: issuer implications Hoja: sheet 2_revCB
EU GBS GBP Comment
Detail
Allocation report:
- Statement of alignment with GBS
- Breakdown of allocated amounts to Green
projects at least on a sector level
- Regional distribution of Green Projects
Impact reporting:
- Description of Green Project
- Environment Objective of Green Projects
- Breakdown of Green Projects by nature of what
is being financed (assets, capital, capex, etc.)
- Impact metrics, and methodology &
assumptions used to calculate impact.
"The annual report should include a list of the
projects to which Green Bond proceeds have
been allocated, as well as a brief description of
the projects and the amounts allocated, and
their expected impact"
More granularity / guidance on exactly what is
to be reported here. Inclusion of location and
metrics/methodology the key differentiator.
FrequencyBoth impact and allocation reports to be made at
least annually until full allocation.
Issuers should make, and keep, readily
available up to date information on the use of
proceeds to be renewed annually until full
allocation, and on a timely basis in case of
material developments.
Very little difference.
VerificationVerification by a formally accredited external
reviewer is mandatory.
"It is recommended that in connection with the
issuance of a Green Bond or a programme,
issuers appoint (an) external review
provider(s) to confirm the alignment of their
bond or bond programme with the four core
components of the GBP"
Verification is now mandatory and external
reviewers (e.g. Sustainalytics, Vigeo etc.) are
required to go through an accreditation
process. This could potentially cause an
increase in the price of second-party opinions.
Reporting
Requirements of:
Key difference between Green Bond Principles (GBP) and EU GBS Source: TEG, ICMA and BBVA Credit Research
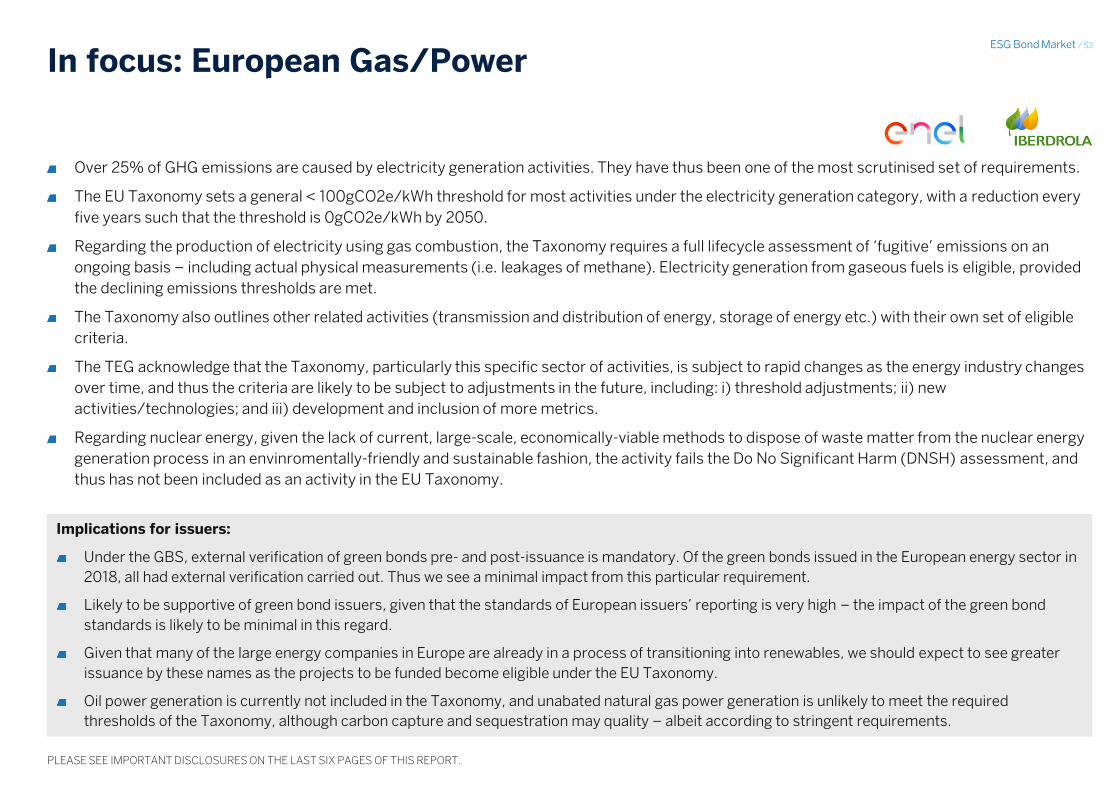
ESG Bond Market / 53
PLEASE SEE IMPORTANT DISCLOSURES ON THE LAST SIX PAGES OF THIS REPORT.
In focus: European Gas/Power
Over 25% of GHG emissions are caused by electricity generation activities. They have thus been one of the most scrutinised set of requirements.
The EU Taxonomy sets a general < 100gCO2e/kWh threshold for most activities under the electricity generation category, with a reduction every
five years such that the threshold is 0gCO2e/kWh by 2050.
Regarding the production of electricity using gas combustion, the Taxonomy requires a full lifecycle assessment of ‘fugitive’ emissions on an
ongoing basis – including actual physical measurements (i.e. leakages of methane). Electricity generation from gaseous fuels is eligible, provided
the declining emissions thresholds are met.
The Taxonomy also outlines other related activities (transmission and distribution of energy, storage of energy etc.) with their own set of eligible
criteria.
The TEG acknowledge that the Taxonomy, particularly this specific sector of activities, is subject to rapid changes as the energy industry changes
over time, and thus the criteria are likely to be subject to adjustments in the future, including: i) threshold adjustments; ii) new
activities/technologies; and iii) development and inclusion of more metrics.
Regarding nuclear energy, given the lack of current, large-scale, economically-viable methods to dispose of waste matter from the nuclear energy
generation process in an envinromentally-friendly and sustainable fashion, the activity fails the Do No Significant Harm (DNSH) assessment, and
thus has not been included as an activity in the EU Taxonomy.
Implications for issuers:
Under the GBS, external verification of green bonds pre- and post-issuance is mandatory. Of the green bonds issued in the European energy sector in
2018, all had external verification carried out. Thus we see a minimal impact from this particular requirement.
Likely to be supportive of green bond issuers, given that the standards of European issuers’ reporting is very high – the impact of the green bond
standards is likely to be minimal in this regard.
Given that many of the large energy companies in Europe are already in a process of transitioning into renewables, we should expect to see greater
issuance by these names as the projects to be funded become eligible under the EU Taxonomy.
Oil power generation is currently not included in the Taxonomy, and unabated natural gas power generation is unlikely to meet the required
thresholds of the Taxonomy, although carbon capture and sequestration may quality – albeit according to stringent requirements.
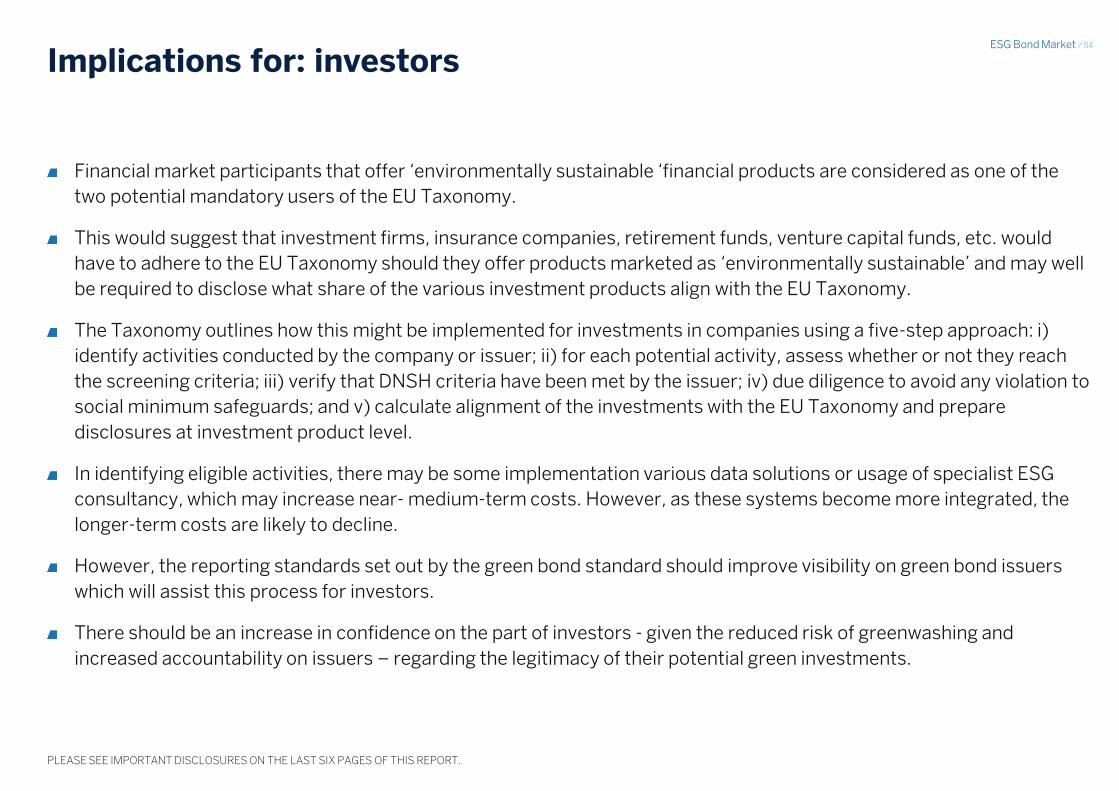
ESG Bond Market / 54
PLEASE SEE IMPORTANT DISCLOSURES ON THE LAST SIX PAGES OF THIS REPORT.
Implications for: investors
Financial market participants that offer ‘environmentally sustainable ‘financial products are considered as one of the
two potential mandatory users of the EU Taxonomy.
This would suggest that investment firms, insurance companies, retirement funds, venture capital funds, etc. would
have to adhere to the EU Taxonomy should they offer products marketed as ‘environmentally sustainable’ and may well
be required to disclose what share of the various investment products align with the EU Taxonomy.
The Taxonomy outlines how this might be implemented for investments in companies using a five-step approach: i)
identify activities conducted by the company or issuer; ii) for each potential activity, assess whether or not they reach
the screening criteria; iii) verify that DNSH criteria have been met by the issuer; iv) due diligence to avoid any violation to
social minimum safeguards; and v) calculate alignment of the investments with the EU Taxonomy and prepare
disclosures at investment product level.
In identifying eligible activities, there may be some implementation various data solutions or usage of specialist ESG
consultancy, which may increase near- medium-term costs. However, as these systems become more integrated, the
longer-term costs are likely to decline.
However, the reporting standards set out by the green bond standard should improve visibility on green bond issuers
which will assist this process for investors.
There should be an increase in confidence on the part of investors - given the reduced risk of greenwashing and
increased accountability on issuers – regarding the legitimacy of their potential green investments.
ESG Bond Market / 55
PLEASE SEE IMPORTANT DISCLOSURES ON THE LAST SIX PAGES OF THIS REPORT.
04 Key topics and developments
in ESG bond market
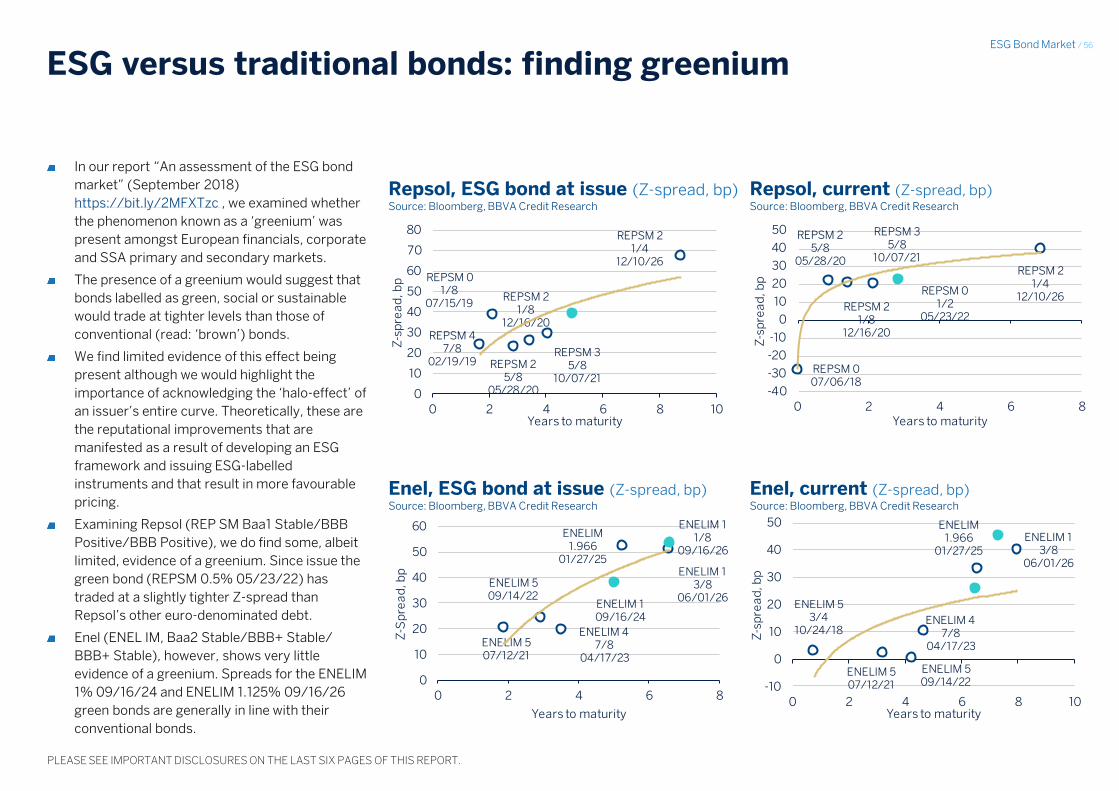
ESG Bond Market / 56
PLEASE SEE IMPORTANT DISCLOSURES ON THE LAST SIX PAGES OF THIS REPORT.
ESG versus traditional bonds: finding greenium
In our report “An assessment of the ESG bond
market” (September 2018)
https://bit.ly/2MFXTzc , we examined whether
the phenomenon known as a ‘greenium’ was
present amongst European financials, corporate
and SSA primary and secondary markets.
The presence of a greenium would suggest that
bonds labelled as green, social or sustainable
would trade at tighter levels than those of
conventional (read: ‘brown’) bonds.
We find limited evidence of this effect being
present although we would highlight the
importance of acknowledging the ‘halo-effect’ of
an issuer’s entire curve. Theoretically, these are
the reputational improvements that are
manifested as a result of developing an ESG
framework and issuing ESG-labelled
instruments and that result in more favourable
pricing.
Examining Repsol (REP SM Baa1 Stable/BBB
Positive/BBB Positive), we do find some, albeit
limited, evidence of a greenium. Since issue the
green bond (REPSM 0.5% 05/23/22) has
traded at a slightly tighter Z-spread than
Repsol’s other euro-denominated debt.
Enel (ENEL IM, Baa2 Stable/BBB+ Stable/
BBB+ Stable), however, shows very little
evidence of a greenium. Spreads for the ENELIM
1% 09/16/24 and ENELIM 1.125% 09/16/26
green bonds are generally in line with their
conventional bonds.
Repsol, ESG bond at issue (Z-spread, bp) Source: Bloomberg, BBVA Credit Research
Repsol, current (Z-spread, bp) Source: Bloomberg, BBVA Credit Research
Enel, current (Z-spread, bp) Source: Bloomberg, BBVA Credit Research
Enel, ESG bond at issue (Z-spread, bp) Source: Bloomberg, BBVA Credit Research
REPSM 3 5/8
10/07/21
REPSM 2 5/8
05/28/20
REPSM 2 1/8
12/16/20
REPSM 2 1/4
12/10/26
REPSM 0 07/06/18
REPSM 0 1/2
05/23/22
-40
-30
-20
-10
0
10
20
30
40
50
0 2 4 6 8
Z-s
pre
ad
, b
p
Years to maturity
REPSM 3 5/8
10/07/21
REPSM 2 5/8
05/28/20
REPSM 2 1/8
12/16/20
REPSM 2 1/4
12/10/26
REPSM 4 7/8
02/19/19
REPSM 0 1/8
07/15/19
0
10
20
30
40
50
60
70
80
0 2 4 6 8 10Z
-sp
rea
d, b
p
Years to maturity
ENELIM 1 3/8
06/01/26
ENELIM 1.966
01/27/25
ENELIM 5 09/14/22
ENELIM 4 7/8
04/17/23
ENELIM 5 07/12/21
ENELIM 1 1/8
09/16/26
ENELIM 1 09/16/24
0
10
20
30
40
50
60
0 2 4 6 8
Z-S
pre
ad
, b
p
Years to maturity
ENELIM 1 3/8
06/01/26
ENELIM 1.966
01/27/25
ENELIM 5 09/14/22
ENELIM 4 7/8
04/17/23
ENELIM 5 3/4
10/24/18
ENELIM 5 07/12/21-10
0
10
20
30
40
50
0 2 4 6 8 10
Z-s
pre
ad
, bp
Years to maturity
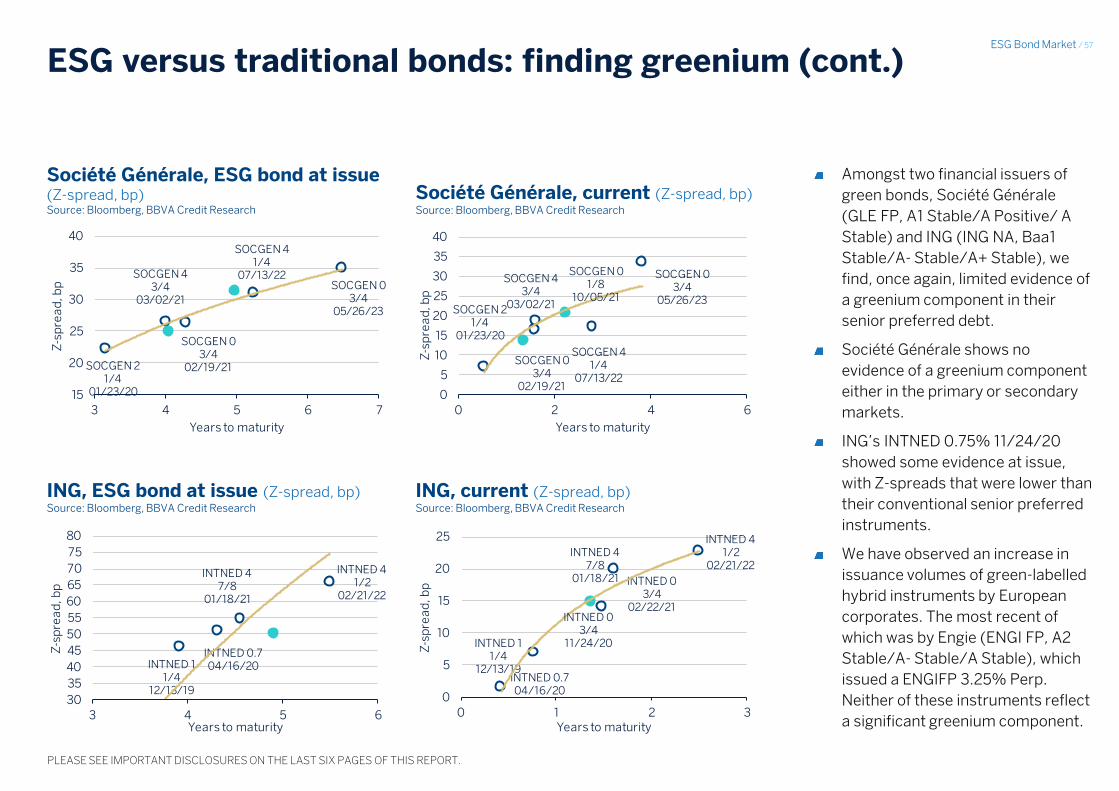
ESG Bond Market / 57
PLEASE SEE IMPORTANT DISCLOSURES ON THE LAST SIX PAGES OF THIS REPORT.
ESG versus traditional bonds: finding greenium (cont.)
Société Générale, ESG bond at issue (Z-spread, bp) Source: Bloomberg, BBVA Credit Research
Société Générale, current (Z-spread, bp) Source: Bloomberg, BBVA Credit Research
ING, current (Z-spread, bp) Source: Bloomberg, BBVA Credit Research
ING, ESG bond at issue (Z-spread, bp) Source: Bloomberg, BBVA Credit Research
Amongst two financial issuers of
green bonds, Société Générale
(GLE FP, A1 Stable/A Positive/ A
Stable) and ING (ING NA, Baa1
Stable/A- Stable/A+ Stable), we
find, once again, limited evidence of
a greenium component in their
senior preferred debt.
Société Générale shows no
evidence of a greenium component
either in the primary or secondary
markets.
ING’s INTNED 0.75% 11/24/20
showed some evidence at issue,
with Z-spreads that were lower than
their conventional senior preferred
instruments.
We have observed an increase in
issuance volumes of green-labelled
hybrid instruments by European
corporates. The most recent of
which was by Engie (ENGI FP, A2
Stable/A- Stable/A Stable), which
issued a ENGIFP 3.25% Perp.
Neither of these instruments reflect
a significant greenium component.
SOCGEN 0 3/4
05/26/23
SOCGEN 4 1/4
07/13/22
SOCGEN 4 3/4
03/02/21
SOCGEN 0 3/4
02/19/21
SOCGEN 2 1/4
01/23/20
SOCGEN 0 1/8
10/05/21
0
5
10
15
20
25
30
35
40
0 2 4 6Z
-sp
rea
d, b
pYears to maturity
SOCGEN 0 3/4
05/26/23
SOCGEN 4 1/4
07/13/22SOCGEN 4 3/4
03/02/21
SOCGEN 0 3/4
02/19/21SOCGEN 2 1/4
01/23/2015
20
25
30
35
40
3 4 5 6 7
Z-s
pre
ad
, b
p
Years to maturity
INTNED 4 1/2
02/21/22
INTNED 4 7/8
01/18/21
INTNED 0.7 04/16/20INTNED 1
1/4 12/13/19
30
35
40
45
50
55
60
65
70
75
80
3 4 5 6
Z-s
pre
ad
, bp
Years to maturity
INTNED 4 1/2
02/21/22
INTNED 0 3/4
02/22/21
INTNED 4 7/8
01/18/21
INTNED 0.7 04/16/20
INTNED 1 1/4
12/13/19
INTNED 0 3/4
11/24/20
0
5
10
15
20
25
0 1 2 3
Z-s
pre
ad
, bp
Years to maturity

ESG Bond Market / 58
PLEASE SEE IMPORTANT DISCLOSURES ON THE LAST SIX PAGES OF THIS REPORT.
ESG versus traditional bonds – KFW, a glimmer of hope for greenium?
Kreditanstalt Fuer Wiederaufbau (KFW) is a
significant issuer of green bonds, with the
second-largest outstanding volume of
green bonds (c. EUR20.9bn as of 30 June
2019).
The Euro-denominated green bonds
(shown in the charts to the left) show some
signs of greenium, having been priced
through the curve at issuance (for the most
recent issue in May 2019), but also showing
some similar tightness compared to non-
green bonds in the secondary market.
It is important to consider a number of
factors when observing this phenomenon,
however. The clearest is the discrepancy
between the size of the green bonds vs. the
average size of the issuers’ non-green
bonds.
On average, the non-green bonds shown
here are c.EUR5bn-EUR6bn in size,
however, the green bonds range from
EUR1bn-EUR3bn.
Hence, we are unable to provide a
quantitative contribution of the green
component of KFW’s bonds (if at all).
KFW, current (Z-spread, bp) Source: Bloomberg, BBVA Credit Research
KFW, ESG bond at issue (Z-spread, bp) Source: Bloomberg, BBVA Credit Research
KFW, Greenium performance (Z-spread, bp) Source: Bloomberg, BBVA Credit Research
KFW 0.01 05/05/27
-30
-28
-26
-24
-22
-20
-18
-16
-14
-12
-10
0 5 10 15
Z-s
pre
ad
, b
p
Years to maturity
KFW 0 1/4 06/30/25
KFW 0.01 05/05/27
KFW 0 1/2 09/28/26
KFW 0.05 05/30/24
KFW 0 1/8 10/27/20-30
-28
-26
-24
-22
-20
-18
-16
-14
-12
-10
0 5 10 15
Z-s
pre
ad
, bp
Years to maturity
-10
-8
-6
-4
-2
0
-40
-35
-30
-25
-20
-15
-10
-5
0
Jul-17 Sep-17 Nov-17 Jan-18 Mar-18 May-18 Jul-18 Sep-18 Nov-18 Jan-19 Mar-19 May-19 Jul-19
Dif
f, b
p
AS
W,
bp
Greenium 1 (rhs) Grenium 2 (rhs) KFW 0 1/4 06/30/25
KFW 0 1/8 10/04/24 KFW 0 1/8 01/15/24

ESG Bond Market / 59
PLEASE SEE IMPORTANT DISCLOSURES ON THE LAST SIX PAGES OF THIS REPORT.
Mapping ESG scoring to credit market dynamics: issuance
ESG bond issuance by quartile (USD mn) Source: Bloomberg, BBVA Credit Research
In recent months, we have seen an increase in the number of providers and rating agencies announcing the implementation of individual ESG scoring
methodologies. In this regard and for the purposes of this report, we have used the methodology developed by RobecoSAM. This is one of the most
established ESG scoring methodologies, and the one currently used by the Dow Jones Sustainability Indexes.
We examined how the issuance of green, social and sustainable bonds varies across issuers with different Total Sustainability scores within each
sector/industry.
We found that on average, the companies with the highest Total Sustainability scores (the top 25% in each sector) issue more than the lower ranks,
particularly the second and third quartiles. However, the lowest quartile (those in the bottom 25% of each sector) contains a number of Chinese issuers,
as well as Apple Inc., which has issued a total of USD13bn of ESG bonds to date. This skews the overall result somewhat, as the lowest quartile has a total
of USD31bn and a mean of USD1bn - the second-highest amount among the quartiles.
The vast majority of companies in the RobecoSAM CSA universe have yet to issue green, social or sustainable bonds. However, we suggest that those
with high rankings within their industry will be more likely to tap the market in the near future as it becomes more advanced. Such companies include
KPN (KPN NA, Baa3 Stable/BBB- Positive/BBB Stable), Red Eléctrica (REE SM, A- Stable/A Stable), and Enagás (ENG SM, Baa1 Stable/ A- Negative/A-
Stable).
Source: MG_Green bonds 2019_graficos y tablas Hoja: Slide 13
-
200
400
600
800
1,000
1,200
1,400
1,600
0
100
200
300
400
500
600
700
<25% 25-49% 50-75% >75%
Median issuance volume (USD mn) (LHS) Mean volume of ESG issuance (USD mn) (RHS)
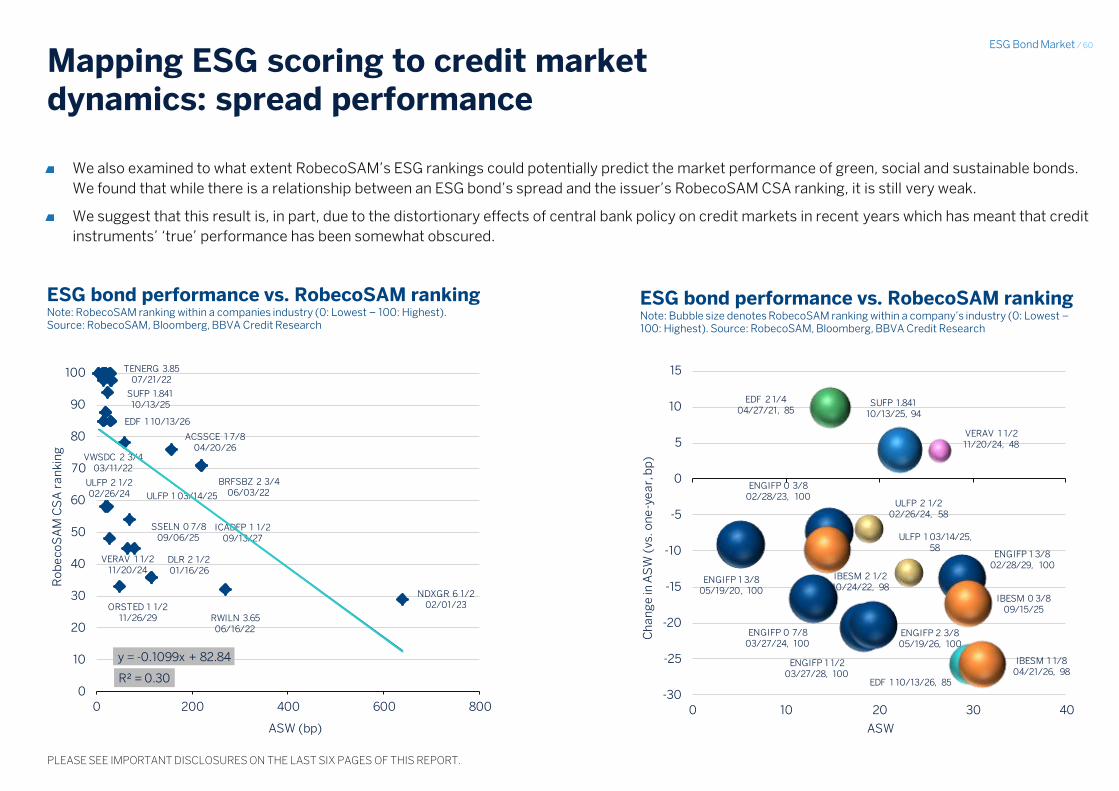
ESG Bond Market / 60
PLEASE SEE IMPORTANT DISCLOSURES ON THE LAST SIX PAGES OF THIS REPORT.
Mapping ESG scoring to credit market dynamics: spread performance
ESG bond performance vs. RobecoSAM ranking Note: RobecoSAM ranking within a companies industry (0: Lowest – 100: Highest). Source: RobecoSAM, Bloomberg, BBVA Credit Research
We also examined to what extent RobecoSAM’s ESG rankings could potentially predict the market performance of green, social and sustainable bonds.
We found that while there is a relationship between an ESG bond’s spread and the issuer’s RobecoSAM CSA ranking, it is still very weak.
We suggest that this result is, in part, due to the distortionary effects of central bank policy on credit markets in recent years which has meant that credit
instruments’ ‘true’ performance has been somewhat obscured.
ESG bond performance vs. RobecoSAM ranking Note: Bubble size denotes RobecoSAM ranking within a company’s industry (0: Lowest – 100: Highest). Source: RobecoSAM, Bloomberg, BBVA Credit Research
ACSSCE 1 7/8 04/20/26
BRFSBZ 2 3/4 06/03/22
DLR 2 1/2 01/16/26
EDF 1 10/13/26
ICADFP 1 1/2 09/13/27
NDXGR 6 1/2 02/01/23ORSTED 1 1/2
11/26/29 RWILN 3.65 06/16/22
SUFP 1.841 10/13/25
SSELN 0 7/8 09/06/25
TENERG 3.85 07/21/22
ULFP 2 1/2 02/26/24 ULFP 1 03/14/25
VERAV 1 1/2 11/20/24
VWSDC 2 3/4 03/11/22
R² = 0.30
y = -0.1099x + 82.84
0
10
20
30
40
50
60
70
80
90
100
0 200 400 600 800
Ro
be
coS
AM
CS
A r
an
kin
g
ASW (bp)
EDF 1 10/13/26, 85
ENGIFP 0 7/8 03/27/24, 100
ENGIFP 2 3/8 05/19/26, 100
ENGIFP 1 3/8 05/19/20, 100
ENGIFP 1 3/8 02/28/29, 100
EDF 2 1/4 04/27/21, 85
ENGIFP 0 3/8 02/28/23, 100
ENGIFP 1 1/2 03/27/28, 100
IBESM 1 1/8 04/21/26, 98
IBESM 0 3/8 09/15/25
IBESM 2 1/2 10/24/22, 98
SUFP 1.841 10/13/25, 94
ULFP 2 1/2 02/26/24, 58
ULFP 1 03/14/25, 58
VERAV 1 1/2 11/20/24, 48
-30
-25
-20
-15
-10
-5
0
5
10
15
0 10 20 30 40
Ch
an
ge
in A
SW
(vs
. on
e-y
ea
r, b
p)
ASW
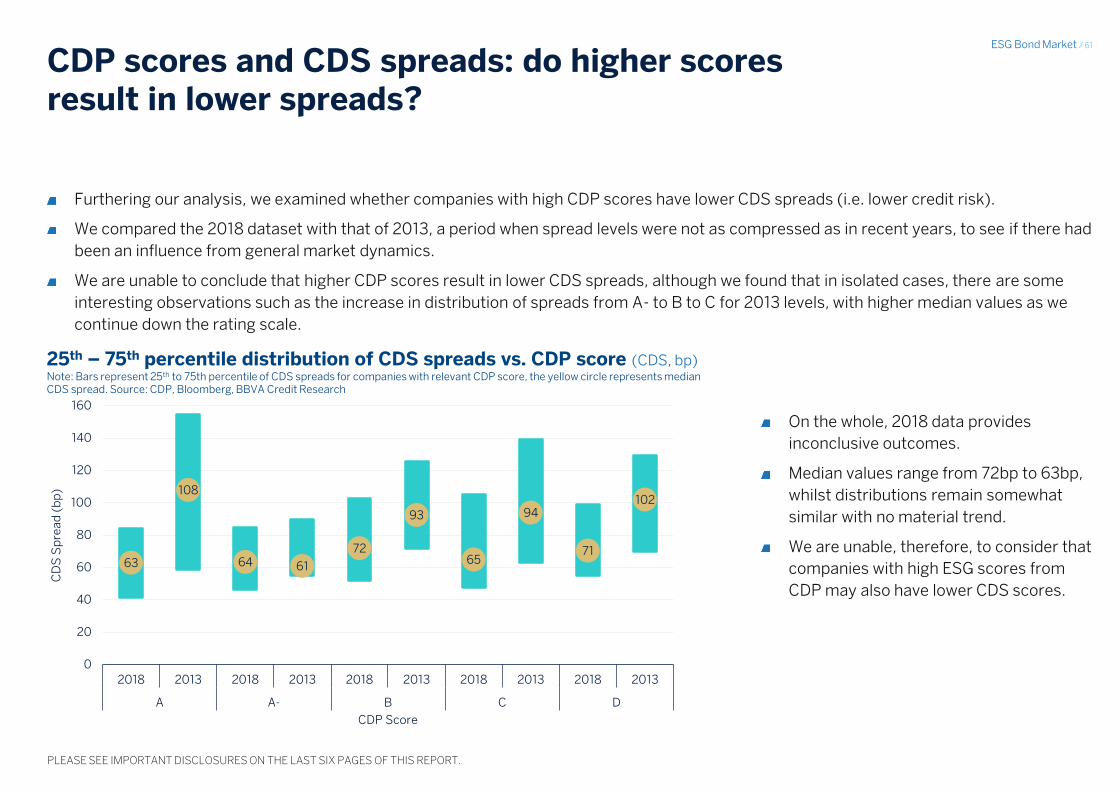
ESG Bond Market / 61
PLEASE SEE IMPORTANT DISCLOSURES ON THE LAST SIX PAGES OF THIS REPORT.
63
108
64 61
72
93
65
94
71
102
0
20
40
60
80
100
120
140
160
2018 2013 2018 2013 2018 2013 2018 2013 2018 2013
A A- B C D
CD
S S
pre
ad
(b
p)
CDP Score
CDP scores and CDS spreads: do higher scores result in lower spreads?
Furthering our analysis, we examined whether companies with high CDP scores have lower CDS spreads (i.e. lower credit risk).
We compared the 2018 dataset with that of 2013, a period when spread levels were not as compressed as in recent years, to see if there had
been an influence from general market dynamics.
We are unable to conclude that higher CDP scores result in lower CDS spreads, although we found that in isolated cases, there are some
interesting observations such as the increase in distribution of spreads from A- to B to C for 2013 levels, with higher median values as we
continue down the rating scale.
25th – 75th percentile distribution of CDS spreads vs. CDP score (CDS, bp) Note: Bars represent 25th to 75th percentile of CDS spreads for companies with relevant CDP score, the yellow circle represents median CDS spread. Source: CDP, Bloomberg, BBVA Credit Research
On the whole, 2018 data provides
inconclusive outcomes.
Median values range from 72bp to 63bp,
whilst distributions remain somewhat
similar with no material trend.
We are unable, therefore, to consider that
companies with high ESG scores from
CDP may also have lower CDS scores.

ESG Bond Market / 62
PLEASE SEE IMPORTANT DISCLOSURES ON THE LAST SIX PAGES OF THIS REPORT.
ESG data still gives investors mixed signals
Comparing the rankings of the RobecoSAM and those from non-profit data provider CDP, we can see how despite the progress that has
been made in recent years to improve the granularity and depth of ESG-related data reporting, there are still some significant discrepancies
with regards to consistency.
Having converted the rankings of RobecoSAM European Corporates into eight ‘ratings’, we compared these ratings to the overall score
computed by CDP. We found that c.50% of the scores of RobecoSAM fell outside of ±1 notch of the CDP rating, with c.4% lying equal to or
above ± 5 notches.
Whilst this means that the remaining 50% lay within ±1 notch of the RobecoSAM scores, we are still not convinced of the comparability
across ESG data providers, given the differences in methodologies.
RobecoSAM ranking vs. CDP scores (number of companies) Source: CDP, RobecoSAM and BBVA Credit Research
0
20
40
60
80
100
120
-6 -5 -4 -3 -2 -1 0 1 2 3 4 5 6
Nu
mb
er
of
com
pa
nie
s
Notch difference

ESG Bond Market / 63
PLEASE SEE IMPORTANT DISCLOSURES ON THE LAST SIX PAGES OF THIS REPORT.
Additionality: what’s all the fuss about?
There is an argument that the financing that is provided as a result of issuing a green bond would have been made regardless of it being
labelled and structured as ‘green’ or ‘sustainable’, that is, that there is no additional benefit to issuing a green-labelled bond than a
traditional one.
In our view this is a short-sighted perspective.
Additionality from green bond issuance The resulting improvements in the issuer’s
transparency (i.e. required reporting
standards under the EU GBS may provide
investors with intricate details of corporate
strategy that has typically been reserved for
equity investors) are crucially important as
firms become more accountable and
investors more involved in ‘greening’
corporate strategy
Increase transparency of issuers
As a result of a successful green bond
issuance, competitors within the same
industry may well be encouraged to do the
same, especially if there are clear economic
benefits to doing so.
Green bond issuance also furthers
discussion amongst market participants and
results in further market evolution
Increasing market participation
There is also an effect of increasing the
incentives of the issuer to further align
themselves with sustainable practices. The
green bond should not be seen in isolation as
a signal to the market of an issuer’s
commitment to the sustainable investment,
but as part of a wider corporate effort to
embrace sustainability at an organisational
and strategic level.
Alignment to sustainability goals
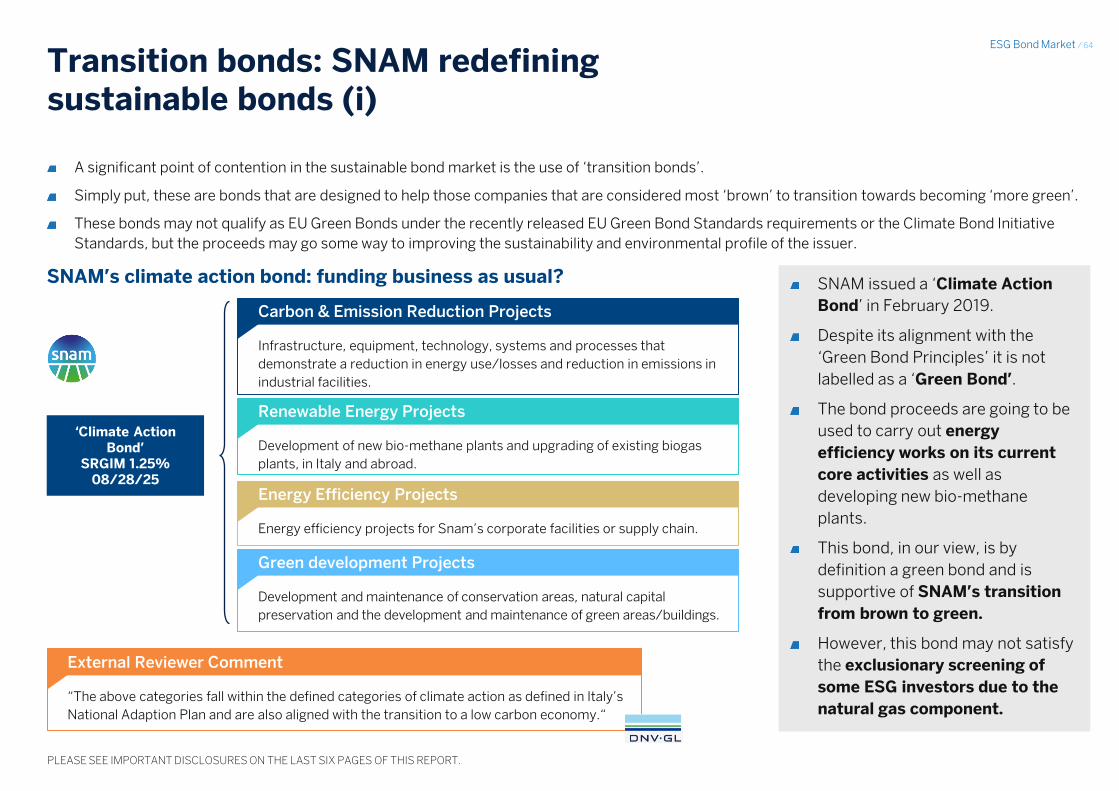
ESG Bond Market / 64
PLEASE SEE IMPORTANT DISCLOSURES ON THE LAST SIX PAGES OF THIS REPORT.
SNAM issued a ‘Climate Action
Bond’ in February 2019.
Despite its alignment with the
‘Green Bond Principles’ it is not
labelled as a ‘Green Bond’.
The bond proceeds are going to be
used to carry out energy
efficiency works on its current
core activities as well as
developing new bio-methane
plants.
This bond, in our view, is by
definition a green bond and is
supportive of SNAM’s transition
from brown to green.
However, this bond may not satisfy
the exclusionary screening of
some ESG investors due to the
natural gas component.
‘Climate Action Bond’
SRGIM 1.25% 08/28/25
Transition bonds: SNAM redefining sustainable bonds (i)
A significant point of contention in the sustainable bond market is the use of ‘transition bonds’.
Simply put, these are bonds that are designed to help those companies that are considered most ‘brown’ to transition towards becoming ‘more green’.
These bonds may not qualify as EU Green Bonds under the recently released EU Green Bond Standards requirements or the Climate Bond Initiative
Standards, but the proceeds may go some way to improving the sustainability and environmental profile of the issuer.
SNAM’s climate action bond: funding business as usual?
Infrastructure, equipment, technology, systems and processes that
demonstrate a reduction in energy use/losses and reduction in emissions in
industrial facilities.
Carbon & Emission Reduction Projects
Development of new bio-methane plants and upgrading of existing biogas
plants, in Italy and abroad.
Renewable Energy Projects
Energy efficiency projects for Snam’s corporate facilities or supply chain.
Energy Efficiency Projects
Development and maintenance of conservation areas, natural capital
preservation and the development and maintenance of green areas/buildings.
Green development Projects
“The above categories fall within the defined categories of climate action as defined in Italy’s
National Adaption Plan and are also aligned with the transition to a low carbon economy.“
External Reviewer Comment
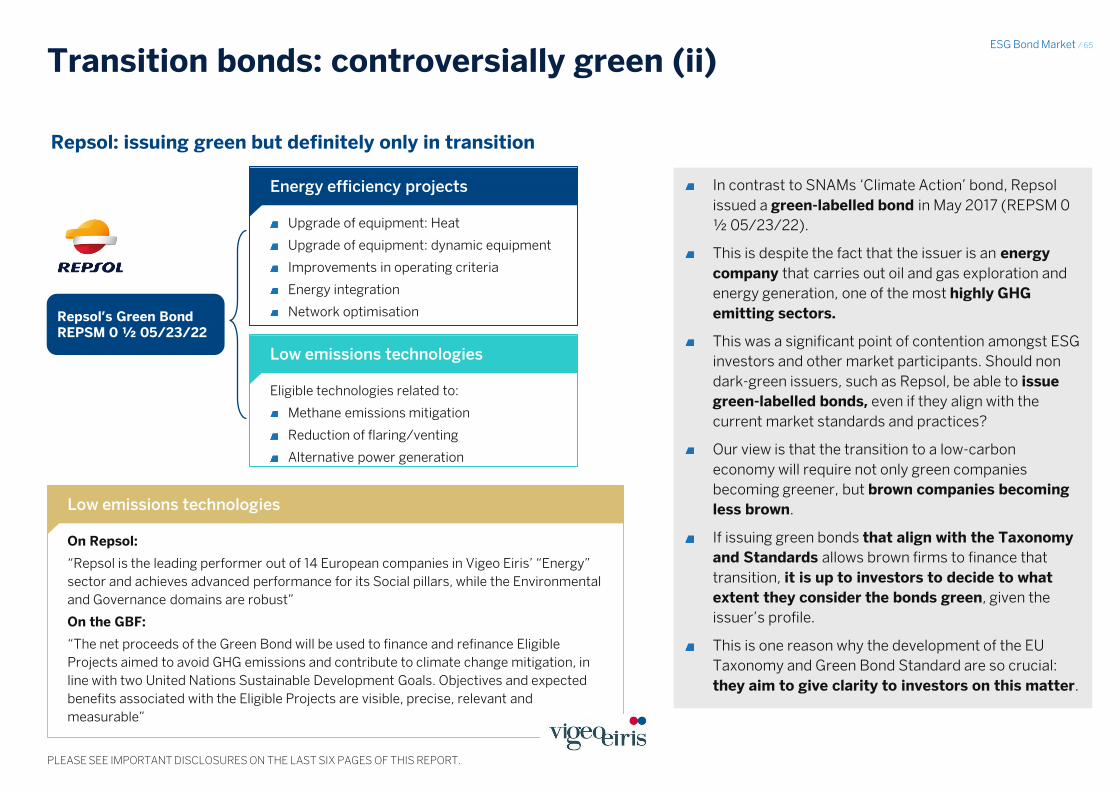
ESG Bond Market / 65
PLEASE SEE IMPORTANT DISCLOSURES ON THE LAST SIX PAGES OF THIS REPORT.
Transition bonds: controversially green (ii)
Repsol: issuing green but definitely only in transition
Repsol’s Green Bond REPSM 0 ½ 05/23/22
External Reviewer Comment
In contrast to SNAMs ‘Climate Action’ bond, Repsol
issued a green-labelled bond in May 2017 (REPSM 0
½ 05/23/22).
This is despite the fact that the issuer is an energy
company that carries out oil and gas exploration and
energy generation, one of the most highly GHG
emitting sectors.
This was a significant point of contention amongst ESG
investors and other market participants. Should non
dark-green issuers, such as Repsol, be able to issue
green-labelled bonds, even if they align with the
current market standards and practices?
Our view is that the transition to a low-carbon
economy will require not only green companies
becoming greener, but brown companies becoming
less brown.
If issuing green bonds that align with the Taxonomy
and Standards allows brown firms to finance that
transition, it is up to investors to decide to what
extent they consider the bonds green, given the
issuer’s profile.
This is one reason why the development of the EU
Taxonomy and Green Bond Standard are so crucial:
they aim to give clarity to investors on this matter.
Upgrade of equipment: Heat
Upgrade of equipment: dynamic equipment
Improvements in operating criteria
Energy integration
Network optimisation
Energy efficiency projects
Eligible technologies related to:
Methane emissions mitigation
Reduction of flaring/venting
Alternative power generation
Low emissions technologies
On Repsol:
“Repsol is the leading performer out of 14 European companies in Vigeo Eiris’ “Energy”
sector and achieves advanced performance for its Social pillars, while the Environmental
and Governance domains are robust”
On the GBF:
“The net proceeds of the Green Bond will be used to finance and refinance Eligible
Projects aimed to avoid GHG emissions and contribute to climate change mitigation, in
line with two United Nations Sustainable Development Goals. Objectives and expected
benefits associated with the Eligible Projects are visible, precise, relevant and
measurable”
Low emissions technologies
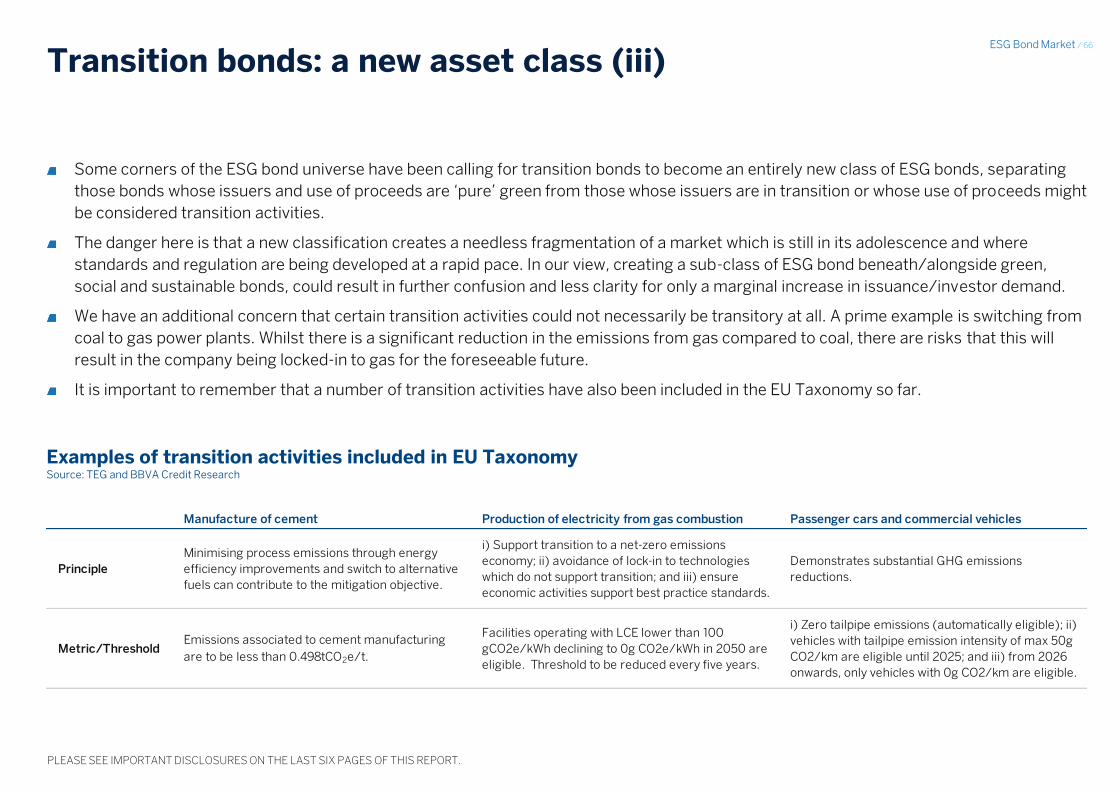
ESG Bond Market / 66
PLEASE SEE IMPORTANT DISCLOSURES ON THE LAST SIX PAGES OF THIS REPORT.
Transition bonds: a new asset class (iii)
Some corners of the ESG bond universe have been calling for transition bonds to become an entirely new class of ESG bonds, separating
those bonds whose issuers and use of proceeds are ‘pure’ green from those whose issuers are in transition or whose use of proceeds might
be considered transition activities.
The danger here is that a new classification creates a needless fragmentation of a market which is still in its adolescence and where
standards and regulation are being developed at a rapid pace. In our view, creating a sub-class of ESG bond beneath/alongside green,
social and sustainable bonds, could result in further confusion and less clarity for only a marginal increase in issuance/investor demand.
We have an additional concern that certain transition activities could not necessarily be transitory at all. A prime example is switching from
coal to gas power plants. Whilst there is a significant reduction in the emissions from gas compared to coal, there are risks that this will
result in the company being locked-in to gas for the foreseeable future.
It is important to remember that a number of transition activities have also been included in the EU Taxonomy so far.
Examples of transition activities included in EU Taxonomy Source: TEG and BBVA Credit Research
Manufacture of cement Production of electricity from gas combustion Passenger cars and commercial vehicles
Principle
Minimising process emissions through energy
efficiency improvements and switch to alternative
fuels can contribute to the mitigation objective.
i) Support transition to a net-zero emissions
economy; ii) avoidance of lock-in to technologies
which do not support transition; and iii) ensure
economic activities support best practice standards.
Demonstrates substantial GHG emissions
reductions.
Metric/ThresholdEmissions associated to cement manufacturing
are to be less than 0.498tCO2e/t.
Facilities operating with LCE lower than 100
gCO2e/kWh declining to 0g CO2e/kWh in 2050 are
eligible. Threshold to be reduced every five years.
i) Zero tailpipe emissions (automatically eligible); ii)
vehicles with tailpipe emission intensity of max 50g
CO2/km are eligible until 2025; and iii) from 2026
onwards, only vehicles with 0g CO2/km are eligible.
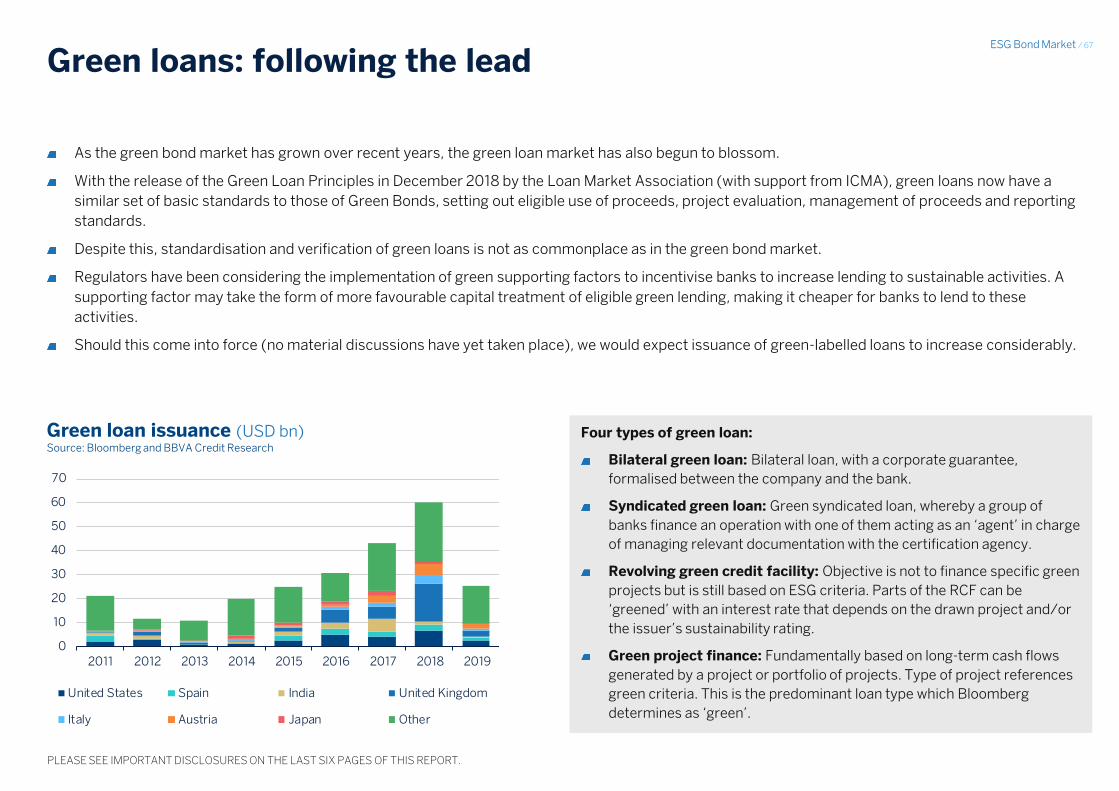
ESG Bond Market / 67
PLEASE SEE IMPORTANT DISCLOSURES ON THE LAST SIX PAGES OF THIS REPORT.
Green loans: following the lead
As the green bond market has grown over recent years, the green loan market has also begun to blossom.
With the release of the Green Loan Principles in December 2018 by the Loan Market Association (with support from ICMA), green loans now have a
similar set of basic standards to those of Green Bonds, setting out eligible use of proceeds, project evaluation, management of proceeds and reporting
standards.
Despite this, standardisation and verification of green loans is not as commonplace as in the green bond market.
Regulators have been considering the implementation of green supporting factors to incentivise banks to increase lending to sustainable activities. A
supporting factor may take the form of more favourable capital treatment of eligible green lending, making it cheaper for banks to lend to these
activities.
Should this come into force (no material discussions have yet taken place), we would expect issuance of green-labelled loans to increase considerably.
Green loan issuance (USD bn) Source: Bloomberg and BBVA Credit Research
Four types of green loan:
Bilateral green loan: Bilateral loan, with a corporate guarantee,
formalised between the company and the bank.
Syndicated green loan: Green syndicated loan, whereby a group of
banks finance an operation with one of them acting as an ‘agent’ in charge
of managing relevant documentation with the certification agency.
Revolving green credit facility: Objective is not to finance specific green
projects but is still based on ESG criteria. Parts of the RCF can be
‘greened’ with an interest rate that depends on the drawn project and/or
the issuer’s sustainability rating.
Green project finance: Fundamentally based on long-term cash flows
generated by a project or portfolio of projects. Type of project references
green criteria. This is the predominant loan type which Bloomberg
determines as ‘green’.
0
10
20
30
40
50
60
70
2011 2012 2013 2014 2015 2016 2017 2018 2019
United States Spain India United Kingdom
Italy Austria Japan Other
ESG Bond Market / 68
PLEASE SEE IMPORTANT DISCLOSURES ON THE LAST SIX PAGES OF THIS REPORT.
ESG-linked loans: paving the way for green-contingent bonds?
April 201 7 saw the first ESG-linked corporate loan, to Dutch health corporate Phillips from ING (EUR1bn). This was particularly
innovative given that the rate paid on the loan is variable depending on the sustainability rating provided by Sustainalytics.
German engineering firm Durr issued the first Schuldschein instrument which has its coupon linked to a sustainability rating,
based on emissions of greenhouse gases and other sustainability metrics.
This has fuelled discussions as to the viability of ESG performance-linked bonds (i.e. bonds whose coupon is linked to issuers
ESG performance).
Bonds coupons could theoretically not just be linked to environmental performance, but also to social metrics. They could be
linked to specific metrics (i.e. CO2 emissions reduction) or to an ESG score moderated by an external third party (such as
Sustainalytics, Vigeo Eiris etc. ).
This would take the focus towards, for example, the emissions reductions efforts of the issuing companies, rather than the
reductions achieved by specific projects funding by use of proceeds green bonds.
There are a number of potential drawbacks from both the issuer and investor side however.
Firstly, the ability to successfully measure emissions reductions is currently still a point of contention. Scope 3 emissions
data is very hard to capture accurately across the entire supply chain for large companies, and is heavy reliant on external
parties.
Some investors are unable to invest in ‘contingent ‘ bonds (i.e. those bonds whose coupon is contingent on a pre-specified
trigger), and thus may well be excluded from participating in these deals (like those who are unable to buy ‘conditional
pass through’ covered bonds), despite potentially being ‘dark-green ‘investors.
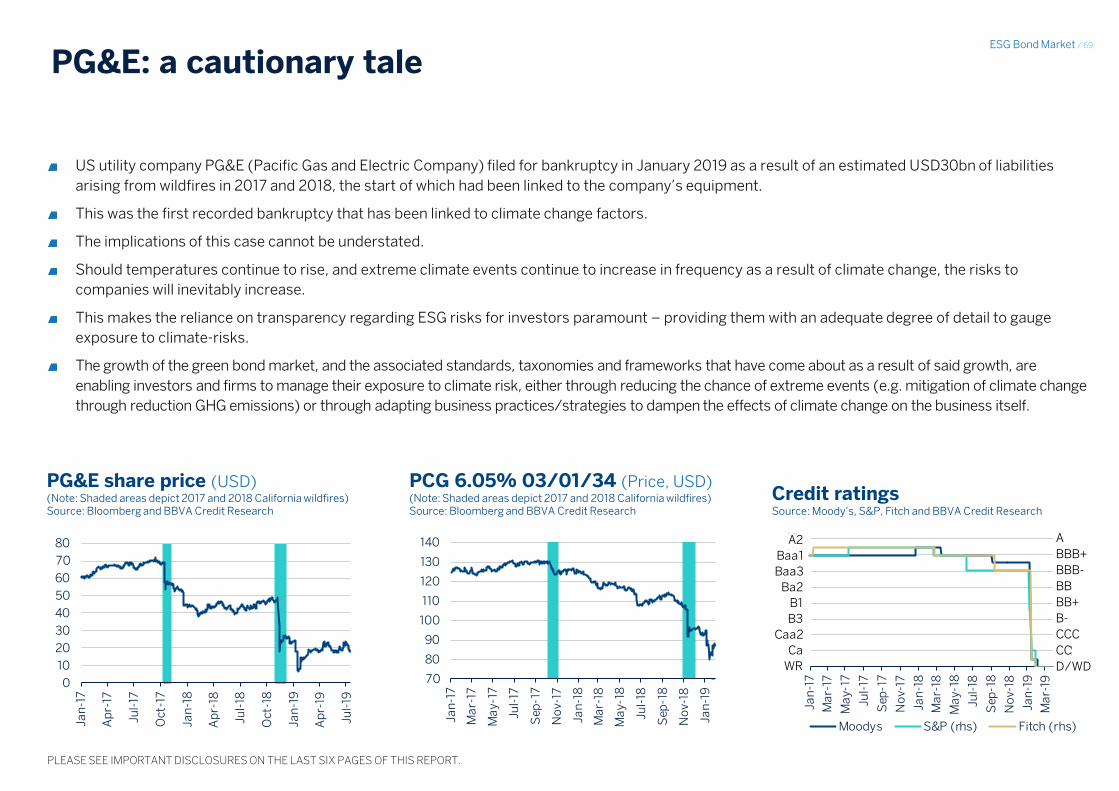
ESG Bond Market / 69
PLEASE SEE IMPORTANT DISCLOSURES ON THE LAST SIX PAGES OF THIS REPORT.
PG&E: a cautionary tale
US utility company PG&E (Pacific Gas and Electric Company) filed for bankruptcy in January 2019 as a result of an estimated USD30bn of liabilities
arising from wildfires in 2017 and 2018, the start of which had been linked to the company’s equipment.
This was the first recorded bankruptcy that has been linked to climate change factors.
The implications of this case cannot be understated.
Should temperatures continue to rise, and extreme climate events continue to increase in frequency as a result of climate change, the risks to
companies will inevitably increase.
This makes the reliance on transparency regarding ESG risks for investors paramount – providing them with an adequate degree of detail to gauge
exposure to climate-risks.
The growth of the green bond market, and the associated standards, taxonomies and frameworks that have come about as a result of said growth, are
enabling investors and firms to manage their exposure to climate risk, either through reducing the chance of extreme events (e.g. mitigation of climate change
through reduction GHG emissions) or through adapting business practices/strategies to dampen the effects of climate change on the business itself.
PG&E share price (USD) (Note: Shaded areas depict 2017 and 2018 California wildfires) Source: Bloomberg and BBVA Credit Research
PCG 6.05% 03/01/34 (Price, USD) (Note: Shaded areas depict 2017 and 2018 California wildfires) Source: Bloomberg and BBVA Credit Research
Credit ratings Source: Moody’s, S&P, Fitch and BBVA Credit Research
0
10
20
30
40
50
60
70
80
Jan
-17
Ap
r-17
Jul-
17
Oc
t-17
Jan
-18
Ap
r-18
Jul-
18
Oc
t-18
Jan
-19
Ap
r-19
Jul-
19
70
80
90
100
110
120
130
140
Jan
-17
Ma
r-17
Ma
y-1
7
Jul-
17
Se
p-1
7
No
v-1
7
Jan
-18
Ma
r-18
Ma
y-1
8
Jul-
18
Sep
-18
No
v-18
Jan
-19
0
2
4
6
8
10
12
14
16
0
2
4
6
8
10
12
14
16
Jan
-17
Ma
r-17
Ma
y-17
Jul-
17
Se
p-1
7
No
v-1
7
Jan
-18
Ma
r-18
Ma
y-1
8
Jul-
18
Se
p-1
8
No
v-1
8
Jan
-19
Ma
r-19
Moodys S&P (rhs) Fitch (rhs)
A2
Baa1
Baa3
Ba2
B1
B3
Caa2
Ca
WR
A
BBB+
BBB-
BB
BB+
B-
CCC
CC
D/WD
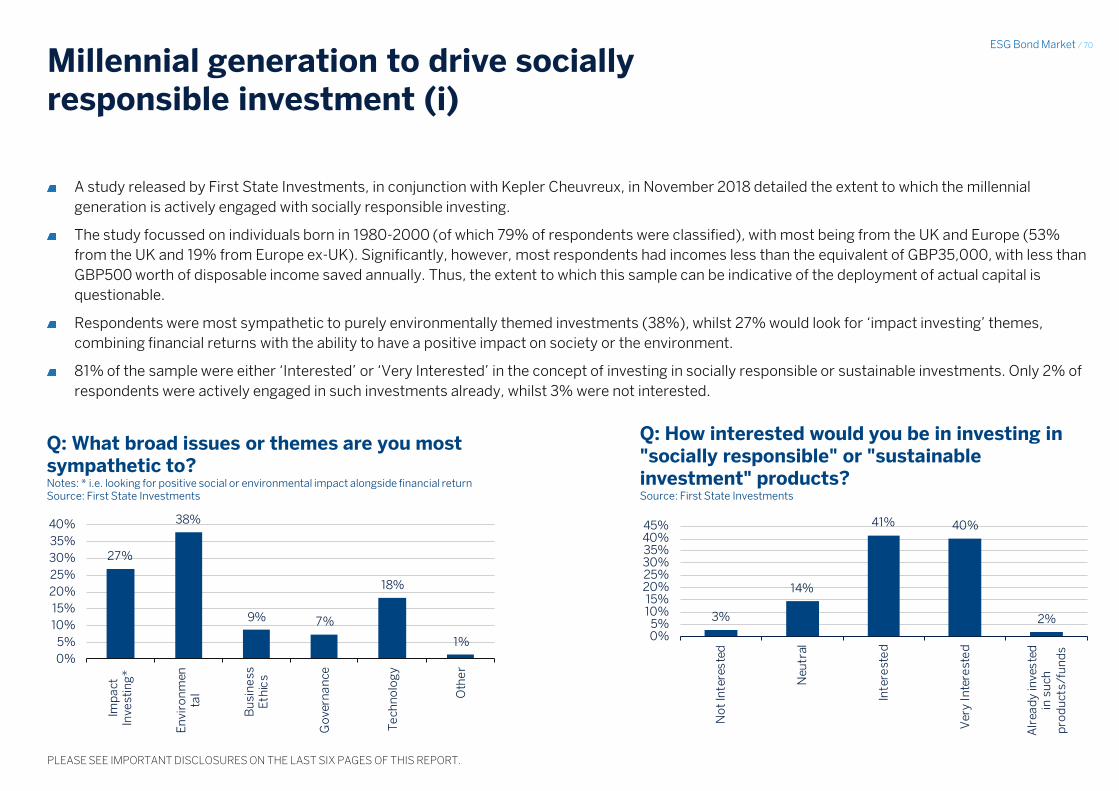
ESG Bond Market / 70
PLEASE SEE IMPORTANT DISCLOSURES ON THE LAST SIX PAGES OF THIS REPORT.
Millennial generation to drive socially responsible investment (i)
A study released by First State Investments, in conjunction with Kepler Cheuvreux, in November 2018 detailed the extent to which the millennial
generation is actively engaged with socially responsible investing.
The study focussed on individuals born in 1980-2000 (of which 79% of respondents were classified), with most being from the UK and Europe (53%
from the UK and 19% from Europe ex-UK). Significantly, however, most respondents had incomes less than the equivalent of GBP35,000, with less than
GBP500 worth of disposable income saved annually. Thus, the extent to which this sample can be indicative of the deployment of actual capital is
questionable.
Respondents were most sympathetic to purely environmentally themed investments (38%), whilst 27% would look for ‘impact investing’ themes,
combining financial returns with the ability to have a positive impact on society or the environment.
81% of the sample were either ‘Interested’ or ‘Very Interested’ in the concept of investing in socially responsible or sustainable investments. Only 2% of
respondents were actively engaged in such investments already, whilst 3% were not interested.
Q: How interested would you be in investing in "socially responsible" or "sustainable investment" products? Source: First State Investments
Q: What broad issues or themes are you most sympathetic to? Notes: * i.e. looking for positive social or environmental impact alongside financial return Source: First State Investments
Source: Millenials and Responsible Investment Data Hoja: Data Cell: G9
Source: Millenials and Responsible Investment Data Hoja: Data Cell: F32
27%
38%
9% 7%
18%
1%
0%
5%
10%
15%
20%
25%
30%
35%
40%
Imp
act
Inve
stin
g*
En
vir
on
me
nta
l
Bu
sin
ess
Eth
ics
Go
vern
an
ce
Te
chn
olo
gy
Oth
er
3%
14%
41% 40%
2%
0%5%
10%15%
20%25%30%35%40%45%
No
t In
tere
ste
d
Neu
tral
Inte
rest
ed
Ver
y In
tere
ste
d
Alr
ead
y in
ves
ted
in s
uch
pro
du
cts/
fun
ds
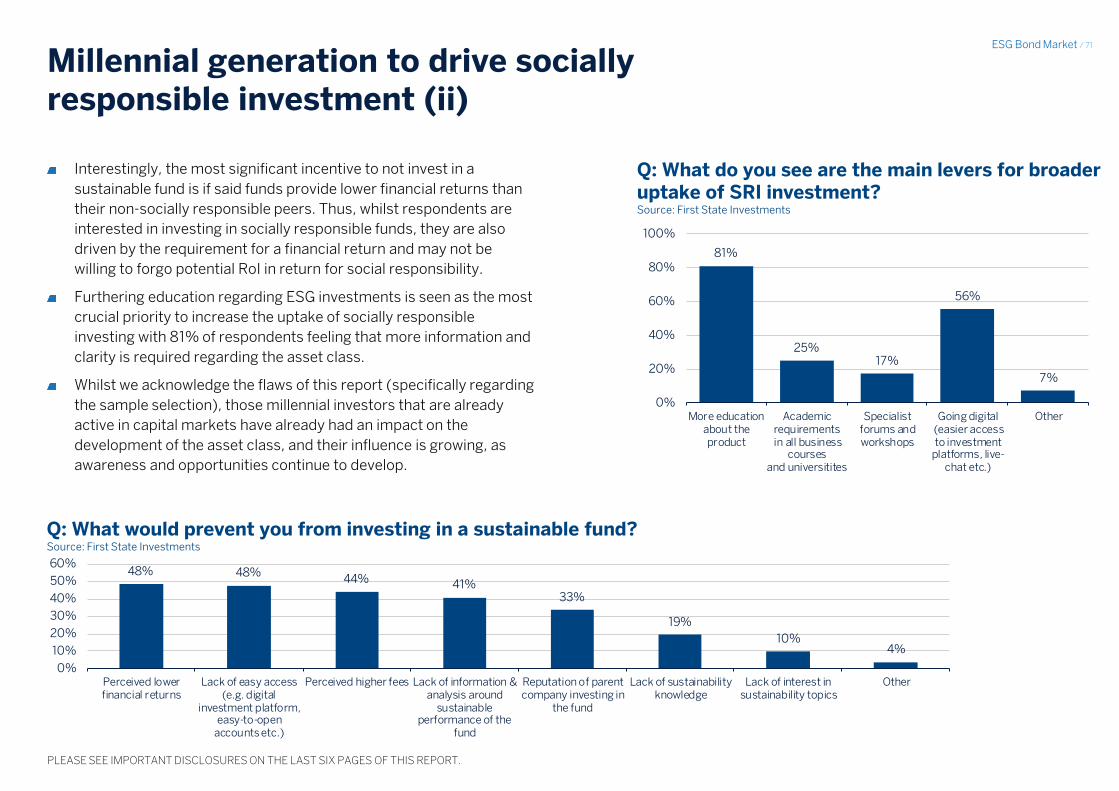
ESG Bond Market / 71
PLEASE SEE IMPORTANT DISCLOSURES ON THE LAST SIX PAGES OF THIS REPORT.
Millennial generation to drive socially responsible investment (ii)
Q: What would prevent you from investing in a sustainable fund? Source: First State Investments
Q: What do you see are the main levers for broader uptake of SRI investment? Source: First State Investments
Interestingly, the most significant incentive to not invest in a
sustainable fund is if said funds provide lower financial returns than
their non-socially responsible peers. Thus, whilst respondents are
interested in investing in socially responsible funds, they are also
driven by the requirement for a financial return and may not be
willing to forgo potential RoI in return for social responsibility.
Furthering education regarding ESG investments is seen as the most
crucial priority to increase the uptake of socially responsible
investing with 81% of respondents feeling that more information and
clarity is required regarding the asset class.
Whilst we acknowledge the flaws of this report (specifically regarding
the sample selection), those millennial investors that are already
active in capital markets have already had an impact on the
development of the asset class, and their influence is growing, as
awareness and opportunities continue to develop.
Source: Millenials and Responsible Investment Data Hoja: Data Cell: G22
Source: Millenials and Responsible Investment Data Hoja: Data Cell: E50
81%
25%17%
56%
7%
0%
20%
40%
60%
80%
100%
More educationabout theproduct
Academicrequirements in all business
coursesand universitites
Specialistforums andworkshops
Going digital(easier accessto investment
platforms, live-chat etc.)
Other
48% 48%44% 41%
33%
19%
10%4%
0%
10%
20%
30%
40%
50%
60%
Perceived lowerfinancial returns
Lack of easy access(e.g. digital
investment platform,easy-to-open
accounts etc.)
Perceived higher fees Lack of information &analysis around
sustainableperformance of the
fund
Reputation of parentcompany investing in
the fund
Lack of sustainabilityknowledge
Lack of interest insustainability topics
Other
ESG Bond Market / 72
PLEASE SEE IMPORTANT DISCLOSURES ON THE LAST SIX PAGES OF THIS REPORT.
05 Appendix
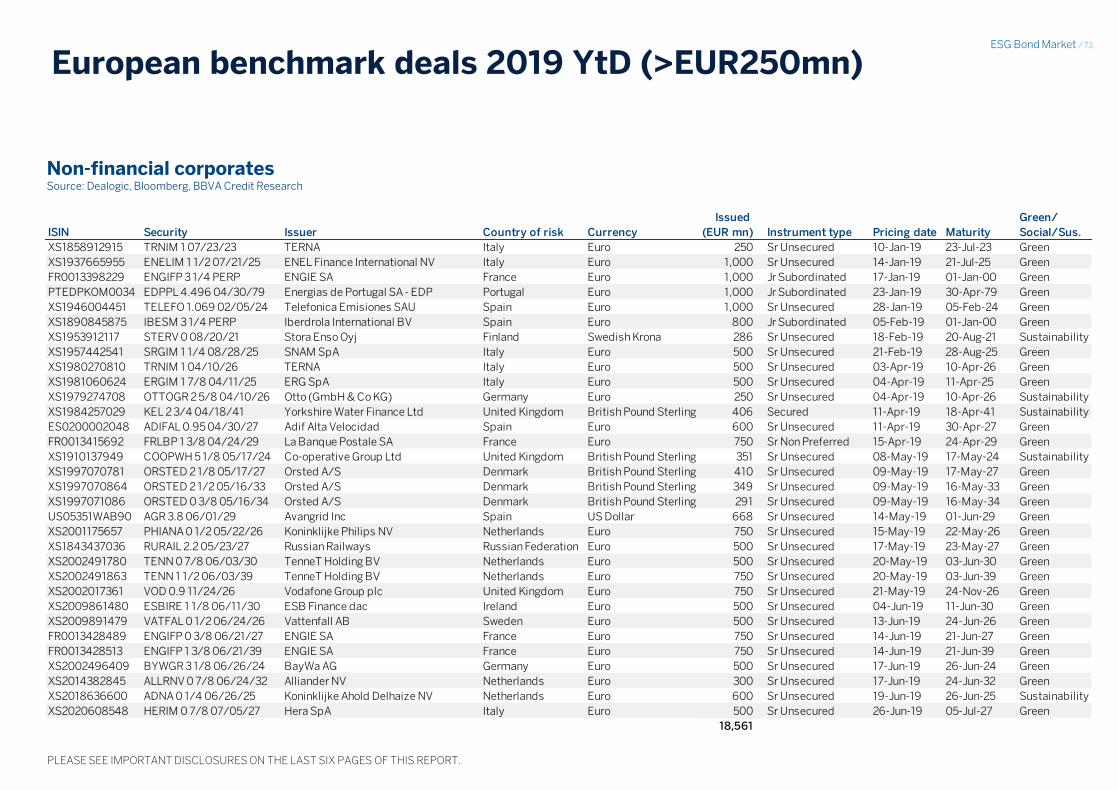
ESG Bond Market / 73
PLEASE SEE IMPORTANT DISCLOSURES ON THE LAST SIX PAGES OF THIS REPORT.
European benchmark deals 2019 YtD (>EUR250mn)
Non-financial corporates Source: Dealogic, Bloomberg, BBVA Credit Research
ISIN Security Issuer Country of risk Currency
Issued
(EUR mn) Instrument type Pricing date Maturity
Green/
Social/Sus.
XS1858912915 TRNIM 1 07/23/23 TERNA Italy Euro 250 Sr Unsecured 10-Jan-19 23-Jul-23 Green
XS1937665955 ENELIM 1 1/2 07/21/25 ENEL Finance International NV Italy Euro 1,000 Sr Unsecured 14-Jan-19 21-Jul-25 Green
FR0013398229 ENGIFP 3 1/4 PERP ENGIE SA France Euro 1,000 Jr Subordinated 17-Jan-19 01-Jan-00 Green
PTEDPKOM0034 EDPPL 4.496 04/30/79 Energias de Portugal SA - EDP Portugal Euro 1,000 Jr Subordinated 23-Jan-19 30-Apr-79 Green
XS1946004451 TELEFO 1.069 02/05/24 Telefonica Emisiones SAU Spain Euro 1,000 Sr Unsecured 28-Jan-19 05-Feb-24 Green
XS1890845875 IBESM 3 1/4 PERP Iberdrola International BV Spain Euro 800 Jr Subordinated 05-Feb-19 01-Jan-00 Green
XS1953912117 STERV 0 08/20/21 Stora Enso Oyj Finland Swedish Krona 286 Sr Unsecured 18-Feb-19 20-Aug-21 Sustainability
XS1957442541 SRGIM 1 1/4 08/28/25 SNAM SpA Italy Euro 500 Sr Unsecured 21-Feb-19 28-Aug-25 Green
XS1980270810 TRNIM 1 04/10/26 TERNA Italy Euro 500 Sr Unsecured 03-Apr-19 10-Apr-26 Green
XS1981060624 ERGIM 1 7/8 04/11/25 ERG SpA Italy Euro 500 Sr Unsecured 04-Apr-19 11-Apr-25 Green
XS1979274708 OTTOGR 2 5/8 04/10/26 Otto (GmbH & Co KG) Germany Euro 250 Sr Unsecured 04-Apr-19 10-Apr-26 Sustainability
XS1984257029 KEL 2 3/4 04/18/41 Yorkshire Water Finance Ltd United Kingdom British Pound Sterling 406 Secured 11-Apr-19 18-Apr-41 Sustainability
ES0200002048 ADIFAL 0.95 04/30/27 Adif Alta Velocidad Spain Euro 600 Sr Unsecured 11-Apr-19 30-Apr-27 Green
FR0013415692 FRLBP 1 3/8 04/24/29 La Banque Postale SA France Euro 750 Sr Non Preferred 15-Apr-19 24-Apr-29 Green
XS1910137949 COOPWH 5 1/8 05/17/24 Co-operative Group Ltd United Kingdom British Pound Sterling 351 Sr Unsecured 08-May-19 17-May-24 Sustainability
XS1997070781 ORSTED 2 1/8 05/17/27 Orsted A/S Denmark British Pound Sterling 410 Sr Unsecured 09-May-19 17-May-27 Green
XS1997070864 ORSTED 2 1/2 05/16/33 Orsted A/S Denmark British Pound Sterling 349 Sr Unsecured 09-May-19 16-May-33 Green
XS1997071086 ORSTED 0 3/8 05/16/34 Orsted A/S Denmark British Pound Sterling 291 Sr Unsecured 09-May-19 16-May-34 Green
US05351WAB90 AGR 3.8 06/01/29 Avangrid Inc Spain US Dollar 668 Sr Unsecured 14-May-19 01-Jun-29 Green
XS2001175657 PHIANA 0 1/2 05/22/26 Koninklijke Philips NV Netherlands Euro 750 Sr Unsecured 15-May-19 22-May-26 Green
XS1843437036 RURAIL 2.2 05/23/27 Russian Railways Russian Federation Euro 500 Sr Unsecured 17-May-19 23-May-27 Green
XS2002491780 TENN 0 7/8 06/03/30 TenneT Holding BV Netherlands Euro 500 Sr Unsecured 20-May-19 03-Jun-30 Green
XS2002491863 TENN 1 1/2 06/03/39 TenneT Holding BV Netherlands Euro 750 Sr Unsecured 20-May-19 03-Jun-39 Green
XS2002017361 VOD 0.9 11/24/26 Vodafone Group plc United Kingdom Euro 750 Sr Unsecured 21-May-19 24-Nov-26 Green
XS2009861480 ESBIRE 1 1/8 06/11/30 ESB Finance dac Ireland Euro 500 Sr Unsecured 04-Jun-19 11-Jun-30 Green
XS2009891479 VATFAL 0 1/2 06/24/26 Vattenfall AB Sweden Euro 500 Sr Unsecured 13-Jun-19 24-Jun-26 Green
FR0013428489 ENGIFP 0 3/8 06/21/27 ENGIE SA France Euro 750 Sr Unsecured 14-Jun-19 21-Jun-27 Green
FR0013428513 ENGIFP 1 3/8 06/21/39 ENGIE SA France Euro 750 Sr Unsecured 14-Jun-19 21-Jun-39 Green
XS2002496409 BYWGR 3 1/8 06/26/24 BayWa AG Germany Euro 500 Sr Unsecured 17-Jun-19 26-Jun-24 Green
XS2014382845 ALLRNV 0 7/8 06/24/32 Alliander NV Netherlands Euro 300 Sr Unsecured 17-Jun-19 24-Jun-32 Green
XS2018636600 ADNA 0 1/4 06/26/25 Koninklijke Ahold Delhaize NV Netherlands Euro 600 Sr Unsecured 19-Jun-19 26-Jun-25 Sustainability
XS2020608548 HERIM 0 7/8 07/05/27 Hera SpA Italy Euro 500 Sr Unsecured 26-Jun-19 05-Jul-27 Green
18,561
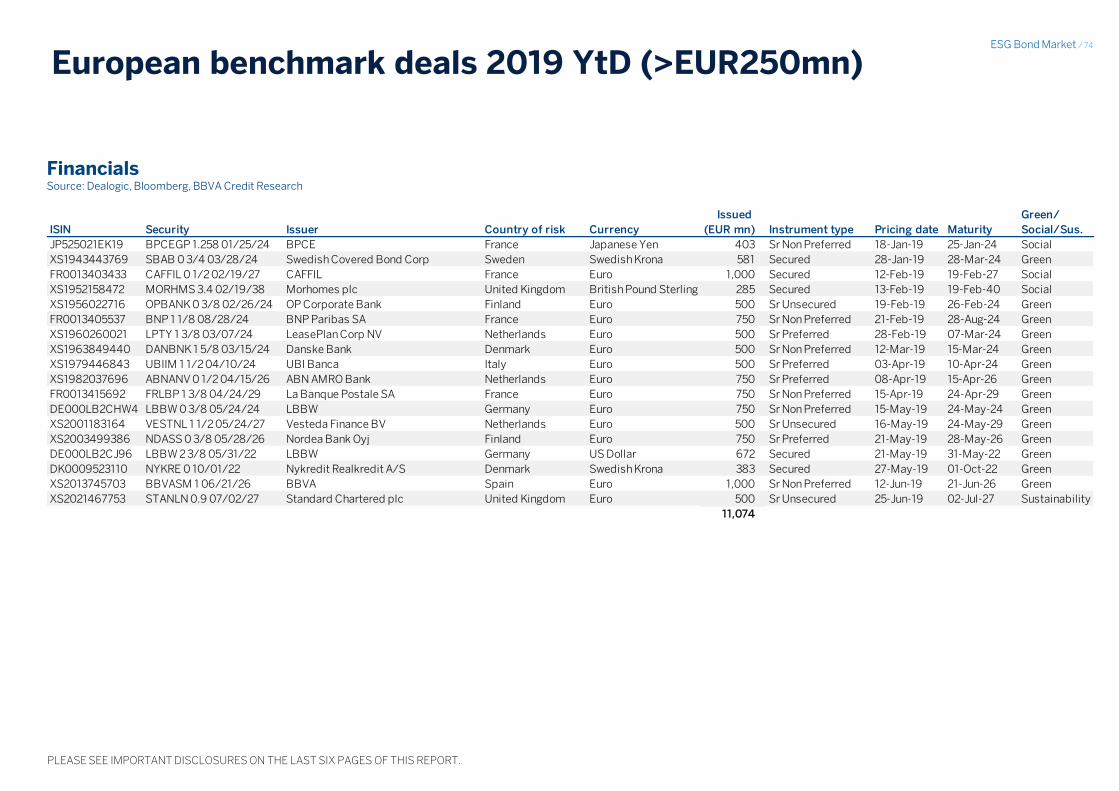
ESG Bond Market / 74
PLEASE SEE IMPORTANT DISCLOSURES ON THE LAST SIX PAGES OF THIS REPORT.
European benchmark deals 2019 YtD (>EUR250mn)
Financials Source: Dealogic, Bloomberg, BBVA Credit Research
ISIN Security Issuer Country of risk Currency
Issued
(EUR mn) Instrument type Pricing date Maturity
Green/
Social/Sus.
JP525021EK19 BPCEGP 1.258 01/25/24 BPCE France Japanese Yen 403 Sr Non Preferred 18-Jan-19 25-Jan-24 Social
XS1943443769 SBAB 0 3/4 03/28/24 Swedish Covered Bond Corp Sweden Swedish Krona 581 Secured 28-Jan-19 28-Mar-24 Green
FR0013403433 CAFFIL 0 1/2 02/19/27 CAFFIL France Euro 1,000 Secured 12-Feb-19 19-Feb-27 Social
XS1952158472 MORHMS 3.4 02/19/38 Morhomes plc United Kingdom British Pound Sterling 285 Secured 13-Feb-19 19-Feb-40 Social
XS1956022716 OPBANK 0 3/8 02/26/24 OP Corporate Bank Finland Euro 500 Sr Unsecured 19-Feb-19 26-Feb-24 Green
FR0013405537 BNP 1 1/8 08/28/24 BNP Paribas SA France Euro 750 Sr Non Preferred 21-Feb-19 28-Aug-24 Green
XS1960260021 LPTY 1 3/8 03/07/24 LeasePlan Corp NV Netherlands Euro 500 Sr Preferred 28-Feb-19 07-Mar-24 Green
XS1963849440 DANBNK 1 5/8 03/15/24 Danske Bank Denmark Euro 500 Sr Non Preferred 12-Mar-19 15-Mar-24 Green
XS1979446843 UBIIM 1 1/2 04/10/24 UBI Banca Italy Euro 500 Sr Preferred 03-Apr-19 10-Apr-24 Green
XS1982037696 ABNANV 0 1/2 04/15/26 ABN AMRO Bank Netherlands Euro 750 Sr Preferred 08-Apr-19 15-Apr-26 Green
FR0013415692 FRLBP 1 3/8 04/24/29 La Banque Postale SA France Euro 750 Sr Non Preferred 15-Apr-19 24-Apr-29 Green
DE000LB2CHW4 LBBW 0 3/8 05/24/24 LBBW Germany Euro 750 Sr Non Preferred 15-May-19 24-May-24 Green
XS2001183164 VESTNL 1 1/2 05/24/27 Vesteda Finance BV Netherlands Euro 500 Sr Unsecured 16-May-19 24-May-29 Green
XS2003499386 NDASS 0 3/8 05/28/26 Nordea Bank Oyj Finland Euro 750 Sr Preferred 21-May-19 28-May-26 Green
DE000LB2CJ96 LBBW 2 3/8 05/31/22 LBBW Germany US Dollar 672 Secured 21-May-19 31-May-22 Green
DK0009523110 NYKRE 0 10/01/22 Nykredit Realkredit A/S Denmark Swedish Krona 383 Secured 27-May-19 01-Oct-22 Green
XS2013745703 BBVASM 1 06/21/26 BBVA Spain Euro 1,000 Sr Non Preferred 12-Jun-19 21-Jun-26 Green
XS2021467753 STANLN 0.9 07/02/27 Standard Chartered plc United Kingdom Euro 500 Sr Unsecured 25-Jun-19 02-Jul-27 Sustainability
11,074
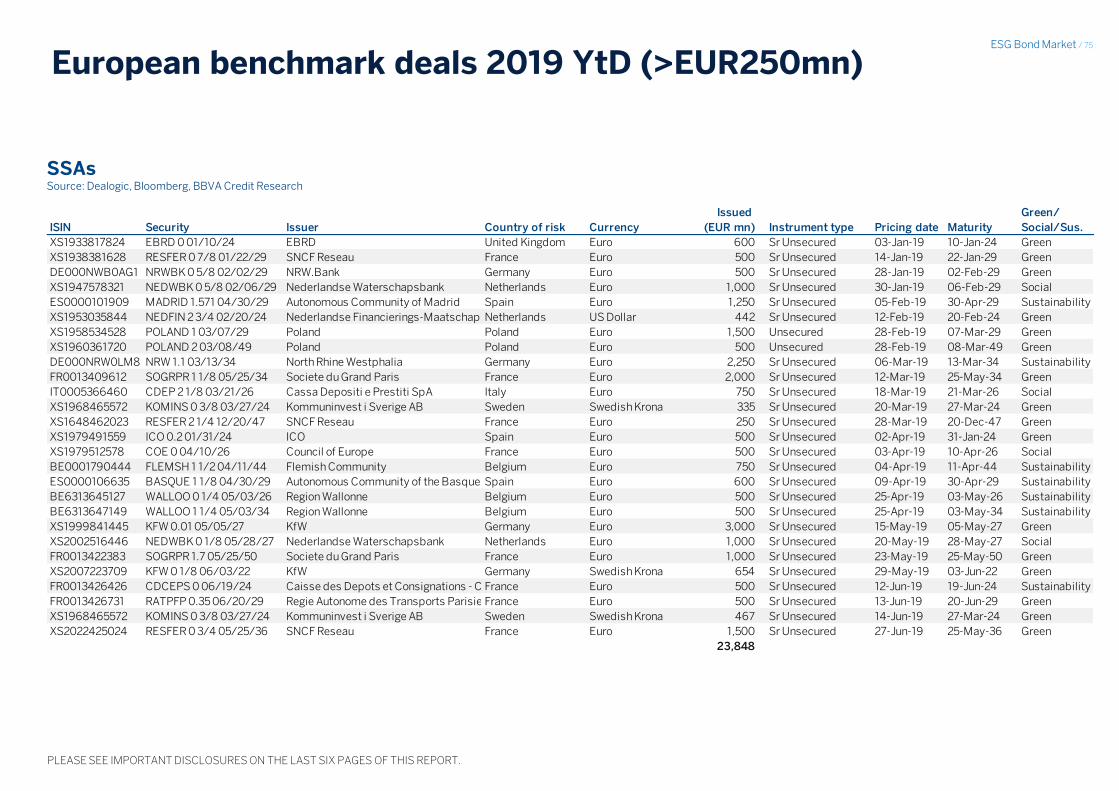
ESG Bond Market / 75
PLEASE SEE IMPORTANT DISCLOSURES ON THE LAST SIX PAGES OF THIS REPORT.
European benchmark deals 2019 YtD (>EUR250mn)
SSAs Source: Dealogic, Bloomberg, BBVA Credit Research
ISIN Security Issuer Country of risk Currency
Issued
(EUR mn) Instrument type Pricing date Maturity
Green/
Social/Sus.
XS1933817824 EBRD 0 01/10/24 EBRD United Kingdom Euro 600 Sr Unsecured 03-Jan-19 10-Jan-24 Green
XS1938381628 RESFER 0 7/8 01/22/29 SNCF Reseau France Euro 500 Sr Unsecured 14-Jan-19 22-Jan-29 Green
DE000NWB0AG1 NRWBK 0 5/8 02/02/29 NRW.Bank Germany Euro 500 Sr Unsecured 28-Jan-19 02-Feb-29 Green
XS1947578321 NEDWBK 0 5/8 02/06/29 Nederlandse Waterschapsbank Netherlands Euro 1,000 Sr Unsecured 30-Jan-19 06-Feb-29 Social
ES0000101909 MADRID 1.571 04/30/29 Autonomous Community of Madrid Spain Euro 1,250 Sr Unsecured 05-Feb-19 30-Apr-29 Sustainability
XS1953035844 NEDFIN 2 3/4 02/20/24 Nederlandse Financierings-Maatschappij voor Ontwikkelingslanden NV - FMONetherlands US Dollar 442 Sr Unsecured 12-Feb-19 20-Feb-24 Green
XS1958534528 POLAND 1 03/07/29 Poland Poland Euro 1,500 Unsecured 28-Feb-19 07-Mar-29 Green
XS1960361720 POLAND 2 03/08/49 Poland Poland Euro 500 Unsecured 28-Feb-19 08-Mar-49 Green
DE000NRW0LM8 NRW 1.1 03/13/34 North Rhine Westphalia Germany Euro 2,250 Sr Unsecured 06-Mar-19 13-Mar-34 Sustainability
FR0013409612 SOGRPR 1 1/8 05/25/34 Societe du Grand Paris France Euro 2,000 Sr Unsecured 12-Mar-19 25-May-34 Green
IT0005366460 CDEP 2 1/8 03/21/26 Cassa Depositi e Prestiti SpA Italy Euro 750 Sr Unsecured 18-Mar-19 21-Mar-26 Social
XS1968465572 KOMINS 0 3/8 03/27/24 Kommuninvest i Sverige AB Sweden Swedish Krona 335 Sr Unsecured 20-Mar-19 27-Mar-24 Green
XS1648462023 RESFER 2 1/4 12/20/47 SNCF Reseau France Euro 250 Sr Unsecured 28-Mar-19 20-Dec-47 Green
XS1979491559 ICO 0.2 01/31/24 ICO Spain Euro 500 Sr Unsecured 02-Apr-19 31-Jan-24 Green
XS1979512578 COE 0 04/10/26 Council of Europe France Euro 500 Sr Unsecured 03-Apr-19 10-Apr-26 Social
BE0001790444 FLEMSH 1 1/2 04/11/44 Flemish Community Belgium Euro 750 Sr Unsecured 04-Apr-19 11-Apr-44 Sustainability
ES0000106635 BASQUE 1 1/8 04/30/29 Autonomous Community of the Basque CountrySpain Euro 600 Sr Unsecured 09-Apr-19 30-Apr-29 Sustainability
BE6313645127 WALLOO 0 1/4 05/03/26 Region Wallonne Belgium Euro 500 Sr Unsecured 25-Apr-19 03-May-26 Sustainability
BE6313647149 WALLOO 1 1/4 05/03/34 Region Wallonne Belgium Euro 500 Sr Unsecured 25-Apr-19 03-May-34 Sustainability
XS1999841445 KFW 0.01 05/05/27 KfW Germany Euro 3,000 Sr Unsecured 15-May-19 05-May-27 Green
XS2002516446 NEDWBK 0 1/8 05/28/27 Nederlandse Waterschapsbank Netherlands Euro 1,000 Sr Unsecured 20-May-19 28-May-27 Social
FR0013422383 SOGRPR 1.7 05/25/50 Societe du Grand Paris France Euro 1,000 Sr Unsecured 23-May-19 25-May-50 Green
XS2007223709 KFW 0 1/8 06/03/22 KfW Germany Swedish Krona 654 Sr Unsecured 29-May-19 03-Jun-22 Green
FR0013426426 CDCEPS 0 06/19/24 Caisse des Depots et Consignations - CDCFrance Euro 500 Sr Unsecured 12-Jun-19 19-Jun-24 Sustainability
FR0013426731 RATPFP 0.35 06/20/29 Regie Autonome des Transports Parisiens - RATPFrance Euro 500 Sr Unsecured 13-Jun-19 20-Jun-29 Green
XS1968465572 KOMINS 0 3/8 03/27/24 Kommuninvest i Sverige AB Sweden Swedish Krona 467 Sr Unsecured 14-Jun-19 27-Mar-24 Green
XS2022425024 RESFER 0 3/4 05/25/36 SNCF Reseau France Euro 1,500 Sr Unsecured 27-Jun-19 25-May-36 Green
23,848
ESG Bond Market / 76
PLEASE SEE IMPORTANT DISCLOSURES ON THE LAST SIX PAGES OF THIS REPORT.
Contacts
Head of European Fixed Income
Javier Serna [email protected] +44 207 648 7581
European Credit
Head of European Credit Research, Public Sector & Covered Bonds Agustín Martín [email protected] +44 207 397 6087
Financials, Covered Bonds & ESG Bonds Michael Gaynor [email protected] +44 207 648 7555
Corporates Ana Greco [email protected] +44 207 648 7669 Álvaro Andreu [email protected] +44 207 397 6082 Robin Usson [email protected] +44 207 397 6035
European Macro & Sovereign Bonds
Head of Macro & Sovereign Bonds Europe Pablo Zaragoza [email protected] +34 91 374 3864
Sovereign Bonds Juan Viguera [email protected] +34 91 374 6174
Macro Miguel San Martín [email protected] +34 91 45 53493
Financials David Golin [email protected] +44 207 648 7501

ESG Bond Market / 77
Important Disclosures
The BBVA Group companies that have participated in preparing or contributed information, opinions, estimates, forecasts or recommendations to this report are identified by the location(s) of the author(s) listed on the first page as follows: 1) Madrid, London or Europe = Banco Bilbao Vizcaya Argentaria, S.A., including its E.U. branches (hereinafter called ‘BBVA’); 2) Mexico City = BBVA Bancomer, S.A. Institución de Banca Múltiple, Grupo Financiero BBVA Bancomer (hereinafter called ‘BBVA Bancomer’); 3) New York = BBVA Securities, Inc. (hereinafter called "BBVA Securities"); 4.) New York Branch = BBVA, New York branch; 5.) Lima = BBVA Continental; 6.) Bogota = BBVA Colombia S.A.; 7.) Santiago = BBVA Chile S.A.; 8.) Hong Kong = BBVA, Hong Kong branch.
For recipients in the European Union, this document is distributed by BBVA, a bank supervised by the Bank of Spain and by Spain’s Stock Exchange Commission (CNMV), and registered with the Bank of Spain with number 0182.
All Credit Analysts are subject to following BBVA’s Corporate Procedures for “Financial Research Activity and the Regime Applicable to Research Analysts.” Material information about proprietary models used in ratings of securities in this report is available from the Head of Credit Research. Ratings on credits are updated as analyst(s) views on the outlook for the business of their corporate issuers, market conditions, and/or their outlook for the issuers’ credits change in a meaningful way. BBVA has established reasonable physical and informational barriers, along with compliance reviews and policies, to minimize potential conflicts of interest in preparing reports on corporate credits. Investment research issued by BBVA has been prepared in accordance with delegated regulations and directives of the EU.
We have three ratings for corporate issuers based on our assessed changes in their credit quality over the upcoming six month period: i.) Positive – we expect the credit quality of the issuer to improve; ii.) Neutral – we expect the credit quality of the issuer to remain the same; and iii.) Negative – we expect the credit quality of the issuer to decline. Factors that might impact our ratings for issuers include financial position, cash flows, operating issues and financing needs which may impact an issuer’s ability to service its debts, macroeconomic trends and outlook for interest rates, and the potential for a change in rating by credit rating agencies.
Additionally, we have three ratings for bonds based on our current expectations of relative returns over a six month period: i.) Buy – we expect the bond to outperform its peer group, sector or relevant benchmark; ii.) Hold - we expect the bond to perform in-line with its peer group, sector or relevant benchmark; and iii.) Sell - we expect the bond to underperform its peer group, sector or relevant benchmark. Factors which may influence our ratings for bonds include: current market prices and conditions, outlook for interest rates, and any other factors that are considered in our ratings for corporate issuers.
As of today, for the whole universe of companies which BBVA has under coverage there are 32.0% Positive ratings, 49.2% Neutral ratings and 18.9% Negative ratings. BBVA or any of its affiliates has rendered Investment Banking services or participated as manager and/or co-manager in public offerings in 30.8% of the Positive ratings, 23.3% of the Neutral ratings, and 21.7% of the Negative ratings.
Over the past twelve months, for the whole universe of companies which BBVA has under coverage, there has been a month-end average of 33.7% Positive ratings, 48.9% Neutral ratings and 17.4% Negative ratings. BBVA or any of its affiliates has rendered Investment Banking services or participated as manager and/or co-manager in public offerings for a month-end average of 37.4% of the Positive ratings, 38.3% of the Neutral ratings, and 28.3% of the Negative ratings.
BBVA or any of its affiliates owned a net short position exceeding 0.5% of the total issued share capital of the following companies that may be covered in this report: N/A.
BBVA or any of its affiliates owned a net long position exceeding 0.5% of the total issued share capital of the following companies that may be covered in this report: Adecco SA, Banco Santander Sa, Huazhu Group LTD, Mercado De Valores De Buenos Aires, S.A., Nabors Industries (US Equity), Promotora Y Operadora De Infraestructura SA de CV, Swiss RE AG.
BBVA or any of its affiliates beneficially owned at least 1 % of the common equity securities of the following companies that may be covered in this report: Altri Sgps Sa, Banco De Sabadell, S.A., Banco Del Bajío, S.A., Banco Mercantil Del Norte, S.A, Banco Nacional De Comercio Exterior S.N.C. , Banco Nacional De Obras Y Servicios Publicos, Banco Provincial SA - Banco Universal, Bayerische Motoren Werke Ag, BBVA Banco Continental SA, BBVA Banco Frances SA, BBVA Colombia SA, BBVA Leasing México, S.A. DE C.V., Bimbo, Bolsa De Valores De Lima SA, Bolsa Mexicana de Valores, Bunge Ltd Finance Corp, Cemex, Crestwood Mid Partners LP (CMLP 5 5/8 05/01/27 Corp), DOGUS GE GAYRIMENKUL Yatirim Ortakligi AS, Hyundai Motor Company, Luz del Sur, Metrovacesa SA, Telefonica Sa, Telepizza, TEVA Pharmaceutical Industries LTD, Tubos Reunidos Sa, Tucson Electric Power Co, Turkiye Garanti Bankasi AS, Turkiye Is Bankasi-C.
The following companies hold more than a 5% of the total issued share capital of BBVA: BLACKROCK INC.
In the past twelve months, BBVA or one or more of its affiliates has had, or currently has, as corporate and investment banking clients the following companies that may be covered in this report: Abengoa Sa- B Shares, Abertis Infraestructuras Sa, Acciona Sa, Acs Actividades Cons Y Serv, Actinvr, Aena Sa, Albacora Sa, Almirall Sa, Alsea, Altri Sgps Sa, Anglo American Plc, Arca Continental SAB de CV, Asur, AT&T INC, Autoroutes Paris Rhin Rhone, AXTEL, S.A.B. de C.V., Banco Actinver, S.A. Institución De Banca Múltiple, Grupo Financiero Actinver, División Fiduciaria, FID. 3405, Banco Compartamos, S.A., Banco Inbursa, S.A., Grupo Financiero Inbursa, Banco Invex, S.A., Banco Nacional De Comercio Exterior S.N.C. , Banco Nacional De México, S.A, Banco Nacional De Obras Y Servicios Publicos, Banco Ve Por Más, S.A. I.B.M., Bankia Sa, Bayerische Motoren Werke Ag, BBVA Leasing México, S.A. de C.V., Bimbo, Bio Pappel, S.A.B. de C.V., BNP Paribas Personal Finance, S.A. de C.V. Sofom, E.R., Bolsas Y Mercados Espanoles, British American Tobacco Plc, Carrefour Sa, Cellnex Telecom Sau, Cementos Portlandvalderrivas, Cetelem, S.A. de C.V. Sofom, E.R., Cibanco,S.A. , Cie Automotive Sa, Comisión Federal De Electricidad, Concentradora Fibra Danhos S, Construcc Y Aux De Ferrocarr, Convertidora Industrial, S.A.B. de C.V., Corporacion Financiera Alba, Corporación Interamericana De Inversiones, Bid Invest, Daimler México, S.A. de C.V., Deutsche Bank México, S.A., Edp Renovaveis Sa, Edp-Energias De Portugal Sa, Enagas Sa, Enbw Energie Baden-Wuerttemb, Ence Energia Y Celulosa Sa, Endesa Sa, Enel Spa, Euronext Nv, Euskaltel Sa, Faes Farma Sa, FibraPL, Fomento De Construc Y Contra, Fondo Especial Para Financiamientos Agropecuarios, Ford Credit De México, S.A. de C.V., Sofom, E.R., Galp Energia Sgps Sa, Gas Natural México, S.A. de C.V., Gas Natural Sdg Sa, Glencore Plc, GM Financial De México, S.A. de C.V., Sofom E.R., Gmexico, Grifols Sa, Grupo Axo, S.A.P.I de C.V., Grupo Cementos de Chihuahua, S.A.B. de C.V., Grupo Gicsa, S.A.B. de C.V., Grupo Gigante, S.A.B. de C.V.,
Disclaimer

ESG Bond Market / 78
Disclaimer
Grupo Industrial Saltillo, S.A.B. de C.V., Grupo Kuo, S.A.B. de C.V., Grupo Lala SAB de CV, Hispania Activos Inmobiliari, Iberpapel Gestion Sa, Infraestructura Energetica N, Instituto Del Fondo Nacional Para El Consumo De Los Trabajadores, Jeronimo Martins, Lab, Livepol, Mapfre Sa, Megacable Holdings-CPO, Melia Hotels International, Merlin Properties Socimi Sa, Nabisco Holdings Corp-Cl A, Nemak, Nos Sgps, NR Finance México, S.A. de C.V., Sofom, E.R., Orange, Paccar Financial México, S.A. de C.V., Petroleos Mexicanos, Peugeot Sa, Portucel Sa, Prosegur Comp Seguridad, Red De Carreteras De Occidente, S.A.B. de C.V, Renault Sa, Repsol Sa, RLH Properties, S.A.B. de C.V., Sse Plc, Talgo Sa, Tecnicas Reunidas Sa, Telecom Italia Spa, Telefonica Sa, Televisa, Tubacex Sa, Tubos Reunidos Sa, Unicredit Spa, Veolia Environnement, Vinci Sa, Vodafone Group Plc, Volkswagen Ag, Volkswagen Leasing, S.A. DE C.V., Walmex, Yapi Ve Kredi Bankasi.
In the past twelve months, BBVA or one or more of its affiliates managed or co-managed public offerings of the following companies that may be covered in this report: Abertis Infraestructuras Sa, Acs Actividades Cons Y Serv, Actinvr, AEP Texas Inc, AIG Global Funding, Alabama Power Co, Alcoa Nederland Holding, Alexandria Real Estate, Alsea, American Tower Corp, Anglo American Plc, Antero Midstream Partners, Ara, Arca Continental SAB de CV, Archrock Partners LP, Autoroutes Paris Rhin Rhone, Bacardi Ltd, Banco Actinver, S.A. Institución De Banca Múltiple, Grupo Financiero Actinver, División Fiduciaria, FID. 3405, Banco Compartamos, S.A., Banco Inbursa, S.A., Grupo Financiero Inbursa, Banco Invex, S.A., Banco Nacional De Comercio Exterior S.N.C. , Banco Nacional De México, S.A, Banco Nacional De Obras Y Servicios Publicos, Bank of America Corp, Bankia Sa, Bayer US Finance II LLC, Bayerische Motoren Werke Ag, BBVA Leasing México, S.A. de C.V., Bimbo, BlackRock Inc, BNP Paribas Personal Finance, S.A. de C.V. Sofom, E.R., Boeing (BA 2.70 05/01/22 Corp), Bolsas Y Mercados Espanoles, Bombardier Inc, British American Tobacco Plc, Broadcom Inc, Bruin E&P Partners LLC, Bunge Ltd Finance Corp, CAI International, Callon Petroleum Co, Carrefour Sa, Carriage Services Inc , Caterpillar Finl Service, Cellnex Telecom Sau, Cementos Portlandvalderrivas, Cetelem, S.A. de C.V. Sofom, E.R., Chaparral Energy Inc, Cibanco,S.A. , Citibank NA (C 3.165 02/19/22 Corp), Citigroup Inc, Comisión Federal De Electricidad, Commerical Metals Co, Concentradora Fibra Danhos S, Concho Resources Inc, Consolidated Energy Finance S.A., Constellaton Brands INC (STZ 4.65 11/15/28 Corp), Corporación Interamericana De Inversiones, BID Invest, Covanta Holding Corp, Crestwood Mid Partners LP (CMLP 5 5/8 05/01/27 Corp), CrownRock LP, Daimler México, S.A. de C.V., Dell Int LLC/EMC Corp, Deutsche Bank NY, Digital Realty Trust Inc (DLR US Equity), Dow Chemical Co/The (DOW 5.550 11/30/48 Corp), DowDuPont Inc (DWDP 5.419 11/15/48 Corp), Edp Renovaveis Sa, Edp-Energias De Portugal Sa, Enable Midstream Partner, Enbw Energie Baden-Wuerttemb, Endesa Sa, Enel Spa, Energy Transfer Partners, Enterprise Products Operating LLC, Euronet Worldwide Inc, Euskaltel Sa, First Data Corp (FDC US Equity), Fomento De Construc Y Contra, Fondo Especial Para Financiamientos Agropecuarios, Ford Credit De México, S.A. de C.V., Sofom, E.R., Galp Energia Sgps Sa, Gas Natural México, S.A. de C.V., Gas Natural Sdg Sa, General Dynamics Corp, General Motors Co, Glencore Plc, Global Net Lease (GNL US Equity), GM Financial De México, S.A. de C.V., Sofom E.R., Gmexico, Goldman Sachs Bank USA (GS), Goldman Sachs Group Inc, Grupo Axo, S.A.P.I de C.V., Grupo Gicsa, S.A.B. de C.V., Grupo Lala SAB de CV, Hilcorp Energy I LP , HSBC Holdings PLC, Hyatt Hotels Corp , IHS Markit Ltd, Instituto Del Fondo Nacional Para El Consumo De Los Trabajadores, Intercontinental Exchange, Interpulic Group of Companies Inc, Jeronimo Martins, JPMorgan Chase & Co , KBR Inc, Kimberly-Clark Corp , Lab, Lear Corp, Leggett & Platt Inc, LGI Homes Inc , Livepol, Mednax Inc, Merck & Co Inc, Microchip Technology Inc, Midwest Connector Capital Company, Mondelez International, Morgan Stanley, Nabisco Holdings Corp-Cl A, Nabors Industries (US Equity), Nos Sgps, NR Finance México, S.A. de C.V., Sofom, E.R., Oasis Petroleum Inc , Orange, Paccar Financial México, S.A. de C.V., Petrobras Global Finance, Peugeot Sa, Portucel Sa, Prologis LP, Prologis Yen Finance, Protective Life Corp, Protective Life Global Funding, Realogy Group/Co-Issuer, Red De Carreteras De Occidente, S.A.B. de C.V, Renault Sa, Repsol Sa, Resideo Funding Inc, RLH Properties, S.A.B. de C.V., Schlumberger, SM Energy Co, Spirit Aerosystems Inc, Sse Plc, Takeda Pharmaceutical, Targa Resources Partners, Telecom Italia Spa, Telefonica Sa, Televisa, Torchmark Corp , Trimble Inc, Tucson Electric Power Co, Unicredit Spa, Ventas Realty LP, Veolia Environnement, Vinci Sa, Viper Energy Partners (VNOM US Equity), Vodafone Group Plc, Volkswagen Ag, Volkswagen Leasing, S.A. de C.V., Walmart Inc, Walmex, Waste Connections Inc, Welltower Inc, Westrock Co, WPX Energy Inc, Yapi Ve Kredi Bankasi.
In the past twelve months, BBVA or one or more of its affiliates has received compensation for investment banking services from the following companies that may be covered in this report: Acciona Sa, AEP Texas Inc, AIG Global Funding, Alabama Power Co, Alcoa Nederland Holding, Alexandria Real Estate, Alpek SA de CV, Alsea, American Homes 4 Rent, American Tower Corp, Antero Midstream Partners, Ara, Archrock Partners LP, AT&T INC, AT&T Inc, Axa Equitable Holdings (EHQ US Equity), Axtel, S.A.B. de C.V., Bacardi Ltd, Banco Invex, S.A., Banco Ve Por Más, S.A. I.B.M., Bank of America Corp, Barclays Plc, Bayer US Finance II LLC, Best Buy Co Inc, Bimbo, Bio Pappel, S.A.B. de C.V., BlackRock Inc, Blue Racer Midstream LLC, BNP Paribas Personal Finance, S.A. de C.V. Sofom, E.R., Boeing (BA 2.70 05/01/22 Corp), Bombardier Inc, Broadcom Inc, Bruin E&P Partners LLC, Bunge Ltd Finance Corp, CAI International, Callon Petroleum Co, Carriage Services Inc , Caterpillar Finl Service, Chaparral Energy Inc, Cibanco,S.A. , Cimarex Energy Co, Citibank NA (C 3.165 02/19/22 Corp), Citigroup Inc, Comision Federal De Electricidad, Comisión Federal De Electricidad, Commerical Metals Co, Compass Bank, Concho Resources Inc, Consolidated Energy Finance S.A., Constellaton Brands INC (STZ 4.65 11/15/28 Corp), Convertidora Industrial, S.A.B. de C.V., Corporacion Financiera Alba, Covanta Holding Corp, Credit Suisse Group AG, Crestwood Mid Partners LP (CMLP 5 5/8 05/01/27 Corp), CrownRock LP, Daimler Finance NA LLC, Dell Int LLC/EMC Corp, Delta Air Lines Inc, Deutsche Bank México, S.A., Deutsche Bank NY, Digital Realty Trust Inc (DLR US Equity), Dow Chemical Co/The (DOW 5.550 11/30/48 Corp), DowDuPont Inc (DWDP 5.419 11/15/48 Corp), Enable Midstream Partner, Enagas Sa, Endesa Sa, Enel Chile SA, Enel Spa, Energy Transfer Partners, Enterprise Products Operating LLC, Euronet Worldwide Inc, FibraPL, First Data Corp (FDC US Equity), FLNG Liquefacation 3 LLC, General Dynamics Corp, General Motors Co, Global Net Lease (GNL US Equity), GM Financial De México, S.A. de C.V., Sofom E.R., Goldman Sachs Bank USA (GS), Goldman Sachs Group Inc, Grifols Sa, Grupo Axo, S.A.P.I de C.V., Grupo Cementos De Chihuahua, S.A.B. de C.V., Grupo Gigante, S.A.B. de C.V., Grupo Industrial Saltillo, S.A.B. de C.V., Grupo Kuo, S.A.B. de C.V., Hilcorp Energy I LP , HSBC Holdings PLC, Hyatt Hotels Corp , IHS Markit Ltd, infraestructura energetica n, Intercontinental Exchange, Interpulic Group of Companies Inc, JPMorgan Chase & Co , KBR Inc, Kilroy Realty LP, Kimberly-Clark Corp , Lear Corp, Leggett & Platt Inc, LGI Homes Inc , Mednax Inc, Merck & Co Inc, Microchip Technology Inc, Midwest Connector Capital Company, Mondelez International, Morgan Stanley, Nabors Industries (US Equity), Nemak, Oasis Petroleum Inc , Petrobras Global Finance, PETROLEOS MEXICANOS, Philip Morris Intl Inc , Prologis LP, Prologis Yen Finance, Protective Life Corp, Protective Life Global Funding, Rassini, Realogy Group/Co-Issuer, Repsol Sa, Resideo Funding Inc, RLH Properties, S.A.B. de C.V., Rockies Express Pipeline, Schlumberger, SM Energy Co, Soriana, Spirit Aerosystems Inc, Sunoco LP/Finance Corp, Takeda Pharmaceutical, Targa Resources Partners, Telefonica Celular del Paraguay, Telefonica Del Peru, Televisa, Textainer Limited, Torchmark Corp , Total Capital Intl SA, Trimble Inc, Tucson Electric Power Co, UBS Group Funding AG, Ventas Realty LP, Viper Energy Partners (VNOM US Equity), Volkswagen Group America, Walmart Inc, Waste Connections Inc, WEA Finance LLC, Welltower Inc, Westrock Co, WPX Energy Inc.

ESG Bond Market / 79
Disclaimer
In the next three months, BBVA or one or more of its affiliates expects to receive or intends to seek compensation for investment banking services from the companies covered in this report.
BBVA or any of its affiliates have liquidity commitments or is a market maker in: Segment of BME Warrants, stock futures in MEFF, stock futures in PSI20 and Portuguese shares in EURONEXT, ETFs of BBVA Asset Management, on IBEX and EUROSTOXX50, preferred issues of Eroski, Naturgy, MexDer Future Contracts (US dollar [DEUA], 28-day TIIEs [TE28], TIIE Swaps, 91-day CETES [CE91]), Bonos M, Bonos M3, Bonos M10, BMV Price and Quotations Index (IPC), Options Contracts (IPC, shares in América Móvil, Cemex, CPO, Femsa UBD, Gcarso A1, Telmex L) and Udibonos, sovereign bonds issued by Kingdom of Spain, Republic of Colombia, Republic of Peru.
BBVA is the Primary dealer for sovereign bonds issued by: Kingdom of Spain, Republic of Portugal, Federal Republic of Germany, Republic of Colombia, Republic of Peru, Republic of Uruguay, The Netherlands, Grand Duchy of Luxembourg.
For recipients in Hong Kong, this document is distributed by BBVA, which Hong Kong branch is supervised by the Hong Kong Monetary Authority.
For recipients in Mexico, this document is distributed by BBVA Bancomer, a bank supervised by the Comisión Nacional Bancaria y de Valores de México.
For recipients in Peru, this document is distributed by BBVA Continental, a bank supervised by the Superintendencia de Banca, Seguros y Administradoras Privadas de Fondos de Pensiones.
For recipients in Colombia, this document is distributed by BBVA Colombia, a bank supervised by the Superintendencia Financiera de Colombia.
For recipients in Singapore, this document is distributed by BBVA, which Singapore branch is supervised by the Monetary Authority of Singapore.
For recipients in USA, research on products other than swaps is being distributed by BBVA Securities, a subsidiary of BBVA registered with and supervised by the U.S. Securities and Exchange Commission and a member of the Financial Industry Regulatory Authority (“FINRA”) and the Securities Investor Protection Corporation. U.S. persons wishing to execute any transactions should do so only by contacting a representative of BBVA Securities in the U.S. Unless local regulations provide otherwise, non-U.S. persons should contact and execute transactions through a BBVA branch or affiliate in their home jurisdiction.
Research on swaps is being distributed by BBVA, a swaps dealer registered with and supervised by the Commodity Futures Trading Commission (“CFTC”). U.S. persons wishing to execute any transactions should do so only by contacting a representative of BBVA. Unless local regulations provide otherwise, non-U.S. persons should contact and execute transactions through a BBVA branch or affiliate in their home jurisdiction.
BBVA and BBVA Group companies or affiliates (art. 42 of the Royal Decree of 22 August 1885 Code of Commerce), are subject to the BBVA Group Policy on Conduct for Security Market Operations which establishes common standards for activity in these entities’ markets, but also specifically for analysis and analysts. This BBVA policy is available for reference at the following web site: www.bbva.com.
Analysts residing outside the U.S. who have contributed to this report may not be registered with or qualified as research analysts by FINRA or the New York Stock Exchange and may not be considered “associated persons” of BBVA Securities (as such term is construed by the rules of FINRA). As such, they may not be subject to FINRA Rule 2242 restrictions on communications with subject companies, public appearances and trading of securities held in research analysts’ accounts.
BBVA is subject to an Internal Standards of Conduct on the Security Markets, which details the standards of the above-mentioned overall policy for the EU. Among other regulations, it includes rules to prevent and avoid conflicts of interests with the ratings given, including information barriers. This Internal Standards of Conduct on the Security Markets is available for reference in the ‘Corporate Governance’ section of the following web site: www.bbva.com.
BBVA Bancomer is subject to a Code of Conduct and to Internal Standards of Conduct for Security Market Operations, which details the standards of the above-mentioned overall policy for Mexico. Among other regulations, it includes rules to prevent and avoid conflicts of interests with the ratings given, including information barriers. This Code and the Internal Standards are available for reference in the ‘Grupo BBVA Bancomer’ subsection of the ‘Conócenos’ menu of the following web site: www.bancomer.com.
BBVA Continental is subject to a Code of Conduct and to a Code of Ethics for Security Market Operations, which details the standards of the above-mentioned overall policy for Peru. Among other regulations, it includes rules to prevent and avoid conflicts of interests with the ratings given, including information barriers. Both Codes are available for reference in the ‘Nuestro Banco’ menu of the following web site: https://www.bbvacontinental.pe/meta/conoce-bbva/.
BBVA Securities is subject to a Capital Markets Code of Conduct, which details the standards of the above-mentioned overall policy for USA. Among other regulations, it includes rules to prevent and avoid conflicts of interests with the ratings given, including information barriers.

ESG Bond Market / 80
Disclaimer
Exclusively for Recipients Resident in Mexico
In the past twelve months, BBVA Bancomer has granted banking credits to the following companies that may be covered in this report: Almacenadora Afirme S.A. de C.V., Alpek SA de CV, Alsea, Arrendadora Afirme S.A. de C.V., AT&T INC, Axtel, S.A.B. de C.V., Banco De Sabadell, S.A., Banco Del Bajío, S.A., Banco Latinoamericano De Comercio Exterior, S.A., Banco Mercantil Del Norte, S.A, Bimbo, Bio Pappel, S.A.B. de C.V., BNP Paribas Personal Finance, S.A. de C.V. Sofom, E.R., Caterpillar INC., Cementos Moctezuma Sa De CV, Cemex, Chdraui, Cibanco,S.A. , Comisión Federal De Electricidad, Corporacion Interamericana De Entretenimiento, S.A.B. de C.V., Corporativo Fragua SAB de CV, Corpovael S.A.B de C.V., Credito Real SAB de CV, Cydsa, S.A.B. de C.V., Elementia, Farmacias Benavides, S.A.B. de C.V., Femsa, Fibrapl, Financiera Independencia, S.A.B. de C.V., Fomento Económico Mexicano, S.A.B. de C.V., Ford Credit de México, S.A. de C.V., Sofom, E.R., GAP, Gfamsa, Gfnorte, GM Financial de México, S.A. de C.V., Sofom E.R., Gruma, Grupo Aeroméxico, S.A.B. de C.V., Grupo Axo, S.A.P.I de C.V., Grupo Bafar, S.A.B. de C.V., Grupo Cementos De Chihuahua, S.A.B. de C.V., Grupo Ciosa, S.A.P.I. de C.V., Grupo Hotelero Santa Fe, S.A.B. de C.V., Grupo Kuo, S.A.B. de C.V., Grupo Lala SAB de CV, Grupo Lamosa, S.A.B. de C.V., Grupo Minsa, S.A.B. de C.V., Grupo Pochteca SAB de CV, Grupo Posadas, S.A.B. de C.V., Holcim Capital México, S.A. de C.V., Hyundai Motor Company, Impulsora Del Desarrollo Y El Empleo En America Latina, S.A.B. de C.V., ING Group, Inmobiliaria Ruba, S.A. de C.V., Instituto Del Fondo Nacional Para El Consumo De Los Trabajadores, LAB, Livepol, Mercader Financial, S.A., Sofom, E.R., Mfrisco, Nemak, Nestle S.A., Paccar Financial México, S.A. de C.V., Pe&oles, Petroleos Mexicanos, Rassini, Repsol, S.A., Soriana, Telefonica SA, Televisa, Vinte Viviendas Integrales, S.A.B. de C.V., Vitro, S.A.B. de C.V., Volkswagen Leasing, S.A. de C.V.
In the past twelve months, BBVA Bancomer has granted Common Representative services to the following companies that may be covered in this report: N/A.
As far as it is known, a Director, Executive Manager or Manager reporting directly to the BBVA Bancomer General Manager has the same position in the following companies that may be covered in this report: Alfa, Alsea, America Movil, S.A.B. de C.V., Asur, Bimbo, CMR, S.A.B. de C.V., Dine, S.A.B. de C.V., Femsa, Fomento Económico Mexicano, S.A.B. de C.V., Gruma, Grupo Aeroportuario Del Centro Norte, S.A.B. de C.V., Grupo Carso, S.A.B. de C.V., Grupo Kuo, S.A.B. de C.V., Grupo Posadas, S.A.B. de C.V., Gsanbors, Invex Controladora, S.A.B. de C.V., Kof, Livepol, Pe&oles, Telefonos De México, S.A.B. de C.V., Televisa, Tenaris S.A., Urbi Desarrollos Urbanos, S.A.B. de C.V., Vitro, S.A.B. de C.V.
BBVA Bancomer, and, as applicable, its affiliates within BBVA Bancomer Financial Group, may hold from time to time investments in the securities or derivative financial instruments with underlying securities covered in this report, which represent 10% or more of its securities or investment portfolio, or 10% or more of the issue or underlying of the securities covered.
Analyst Certification
The research analysts included on the front page of this report hereby certify that (i) the views expressed in this report accurately reflect their personal views about the subject companies and their securities and (ii) no part of their compensation was, is, or will be, directly or indirectly, related to the specific recommendations or views expressed in this report.

ESG Bond Market / 81
Disclaimer
Disclaimer
This document and the information, opinions, estimates, forecasts and recommendations expressed herein have been prepared to provide BBVA Group’s customers with general information and are current as of the date hereof and subject to changes without prior notice. Neither BBVA nor any of its affiliates is responsible for giving notice of such changes or for updating the contents hereof.
This document and its contents do not constitute an offer, invitation or solicitation to purchase or subscribe to any securities or other instruments, to undertake or divest investments, or to participate in any trading strategy. Neither shall this document nor its contents form the basis of any contract, commitment or decision of any kind.
Investors who have access to this document should be aware that the securities, instruments or investments to which it refers may not be appropriate for them due to their specific investment goals, financial positions or risk profiles, as these have not been taken into account to prepare this report. Therefore, investors should make their own investment decisions considering the said circumstances and obtaining such specialized advice as may be necessary. Other than the disclosures relating to BBVA Group, the contents of this document are based upon information available to the public that has been obtained from sources considered to be reliable. However, such information has not been independently verified by BBVA or any of its affiliates and therefore no warranty, either express or implicit, is given regarding its accuracy, integrity or correctness. To the extent permitted by law, BBVA and its affiliates accept no liability of any type for any direct or indirect losses or damages arising from the use of this document or its contents. Investors should note that the past performance of securities or instruments or the historical results of investments do not guarantee future performance.
The market prices of securities or instruments or the results of investments could fluctuate against the interests of investors. Investors should be aware that they could even face a loss of their investment. Transactions in futures, derivatives, options on securities or high-yield securities can involve high risks and are not appropriate for every investor. Indeed, in the case of some investments, the potential losses may exceed the amount of initial investment and, in such circumstances, investors may be required to pay more money to support those losses. Thus, before undertaking any transaction with these instruments, investors should be aware of their operation, as well as the rights, liabilities and risks implied by the same and the underlying securities. Investors should also be aware that secondary markets for the said instruments may not exist. Before entering into transactions in futures, derivatives, or options, investors should review all documents on disclosures for risks of investing in options and/or futures at the following websites:
Options - http://www.finra.org/Industry/Regulation/Notices/2013/P197741
Futures - http://www.finra.org/Investors/InvestmentChoices/P005912
Covered bonds, collateralized mortgage obligations, and other mortgage-related or asset backed securities are not suitable for every investor and are subject to certain risks. The value and price of these securities is sensitive to conditions affecting the assets underlying these securities. Accordingly, changes in economic conditions, the value of underlying assets, the real estate market, credit conditions, interest rates, or other factors can cause these securities to diminish in value. Such securities are also subject to risks related to prepayment and clean-up call risk. When the obligations underlying these securities are prepaid at a faster pace than expected and the securities are called, an investor may have to reinvest in securities with a lower yield and/or fail to recover additional amounts (premiums) paid for securities with higher interest rates, resulting in an unexpected capital loss. The structure of these securities may be complex and less information may be available about them than other types of debt securities. Before investing in such securities, investors should thoroughly review educational material that is available on the securities at http://www.investinginbonds.com/.
BBVA or any of its affiliates’ salespeople, traders, and other professionals may provide oral or written market commentary or trading strategies to its clients that reflect opinions that are contrary to the opinions expressed herein. Furthermore, BBVA or any of its affiliates' proprietary trading and investing businesses may make investment decisions that are inconsistent with the recommendations expressed herein. No part of this document may be (i) copied, photocopied or duplicated by any other form or means (ii) redistributed or (iii) quoted, without the prior written consent of BBVA. No part of this report may be copied, conveyed, distributed or furnished to any person or entity in any country (or persons or entities in the same) in which its distribution is prohibited by law. More specifically, this document is in no way intended for, or to be distributed or used by an entity or person resident or located in a jurisdiction in which the said distribution, publication, use of or access to the document contravenes the law which requires BBVA or any of its affiliates to obtain a licence or be registered. Failure to comply with these restrictions may breach the laws of the relevant jurisdiction.
The remuneration system concerning the analysts responsible for the preparation of this report is based on multiple criteria, including the revenues obtained by BBVA and, indirectly, the results of BBVA Group in the fiscal year, which, in turn, include the results generated by the investment banking business; nevertheless, they do not receive any remuneration based on revenues from any specific transaction in investment banking.
In the United Kingdom, this document is directed only at persons who (i) have professional experience in matters relating to investments falling within article 19(5) of the financial services and markets act 2000 (financial promotion) order 2005 (as amended, the "financial promotion order"), (ii) are persons falling within article 49(2) (a) to (d) (“high net worth companies, unincorporated associations, etc.”) of the financial promotion order, or (iii) are persons to whom an invitation or inducement to engage in investment activity (within the meaning of section 21 of the Financial Services and Markets Act 2000) may otherwise lawfully be communicated (all such persons together being referred to as "relevant persons"). This document is directed only at relevant persons and must not be acted on or relied on by persons who are not relevant persons. Any investment or investment activity to which this document relates is available only to relevant persons and will be engaged in only with relevant persons.
BBVA Hong Kong Branch (CE number AFR194) is regulated by the Hong Kong Monetary Authority and the Securities and Futures Commission of Hong Kong. In Hong Kong this report is for distribution only to professional investors within the meaning of Schedule 1 to the Securities and Futures Ordinance (Cap 571) of Hong Kong.
This document is distributed in Singapore by BBVA’s office in this country for general information purposes and it is generally accessible. In this respect, this document does not take into account the specific investment goals, the financial situation or the need of any particular person and it is exempted from Regulation 34 of the Financial Advisors Regulation (“FAR”) (as required in Section 27 of the Financial Advisors Act (Chapter 110) of Singapore (“FAA”)).
BBVA, BBVA Bancomer, BBVA Chile S.A., BBVA Colombia S.A., BBVA Continental and BBVA Securities are not authorised deposit institutions in accordance with the definition of the Australian Banking Act of 1959 nor are they regulated by the Australian Prudential Regulatory Authority (APRA).

ESG Bond Market / 82
Disclaimer
General Disclaimer for Readers Accessing the Report through the Internet
Internet Access
In the event that this document has been accessed via the internet or via any other electronic means which allows its contents to be viewed, the following information should be read carefully:
The information contained in this document should be taken only as a general guide on matters that may be of interest. The application and impact of laws may vary substantially depending on specific circumstances. BBVA does not guarantee that this report and/or its contents published on the Internet are appropriate for use in all geographic areas, or that the financial instruments, securities, products or services referred to in it are available or appropriate for sale or use in all jurisdictions or for all investors or counterparties. Recipients of this report who access it through the Internet do so on their own initiative and are responsible for compliance with local regulations applicable to them.
Changes in regulations and the risks inherent in electronic communications may cause delays, omissions, or inaccuracy in the information contained in this site. Accordingly, the information contained in the site is supplied on the understanding that the authors and editors do not hereby intend to supply any form of consulting, legal, accounting or other advice.
All images and texts are the property of BBVA and may not be downloaded from the Internet, copied, distributed, stored, re-used, re-transmitted, modified or used in any way, except as specified in this document, without the express written consent of BBVA. BBVA reserves all intellectual property rights to the fullest extent of the law.