eskom presentation to the parliamentary portfolio
TRANSCRIPT

Eskom Presentation to the
Parliamentary Portfolio
Committee on Energy
21 Aug 2012
Paul O’ Flaherty
Finance Director and Group Executive Group
Capital
In support of
Disclaimer
This presentation does not constitute or form part of and should not be construed as, an offer to sell, or the solicitation or
invitation of any offer to buy or subscribe for or underwrite or otherwise acquire, securities of Eskom Holdings SOC Limited
(“Eskom”), any holding company or any of its subsidiaries in any jurisdiction or any other person, nor an inducement to enter
into any investment activity. No part of this presentation, nor the fact of its distribution, should form the basis of, or be relied
on in connection with, any contract or commitment or investment decision whatsoever. This presentation does not constitute
a recommendation regarding any securities of Eskom or any other person.
Certain statements in this presentation regarding Eskom’s business operations may constitute “forward looking statements.”
All statements other than statements of historical fact included in this presentation, including, without limitation, those
regarding the financial position, business strategy, management plans and objectives for future operations of Eskom are
forward looking statements.
Forward-looking statements are not intended to be a guarantee of future results, but instead constitute Eskom’s current
expectations based on reasonable assumptions. Forecasted financial information is based on certain material assumptions.
These assumptions include, but are not limited to continued normal levels of operating performance and electricity demand
in the Distribution and Transmission divisions and operational performance in the Generation and Primary Energy divisions
consistent with historical levels, and incremental capacity additions through our Group Capital division at investment levels
and rates of return consistent with prior experience, as well as achievements of planned productivity improvements
throughout our business activities.
Actual results could differ materially from those projected in our forward-looking statements due to risks, uncertainties and
other factors. Eskom neither intends to nor assumes any obligation to update or revise any forward-looking statements,
whether as a result of new information, future events or otherwise.
In preparation of this document we used certain publicly available data. While the sources we used are generally regarded
as reliable we did not verify their content. Eskom does not accept any responsibility for using any such information.
2

In support of
2 3 4 1 5
Table of contents
3

In support of
The structure of SA's electricity industry is changing
Change of the industry value chain
Eskom
Customer
Service
Transmission Construction Generation Primary
energy
sourcing
Distribution
ISMO Independent System
and Market Operator
To be
moved out
System
operations
Support functions
• The ISMO Bill was tabled in Parliament on 13 May
2011
• The actual path to be followed is being finalised
4

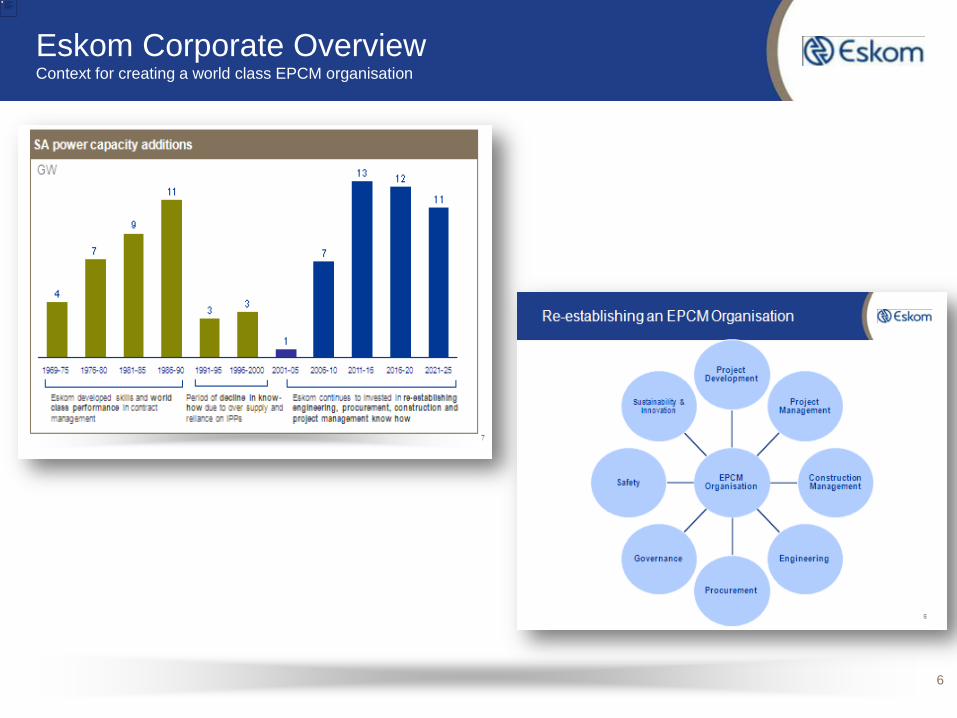
Eskom Corporate Overview Context for creating a world class EPCM organisation
• Infrastructure is the foundation of economic growth and leads it. For electricity supply, a 1% GDP increase requires a 1,5% increase in electricity supply
• Eskom was established in 1923 as the Electricity Supply Commission. In July 2002, it was converted into a public limited liability company, wholly owned by the SA government
• We are one of the top 20 utilities in the world by generation capacity (41 647MW). We generate 95% of the electricity used in SA and about 45% of that used in Africa
• We are vertically integrated - generating, transmitting and distributing electricity to approximately 4.8 million customers in the residential, mining, industrial, commercial, and agricultural sectors
• To meet the increasing electricity needs of South Africa, Eskom managed the construction of 31 000MW of new capacity between 1970 and 1990.
• In the following decade from 1991 to 2005, electricity was in over supply and little was invested in new electricity generation. This resulted in a gradual loss of skills, knowledge and know-how from Eskom and from South Africa.
• We have now returned to the cycle of under supply. We are committed to meeting the electricity and related infrastructure needs of our customers and contributing to the developmental needs of South Africa
• During the last decade we have invested in re-establishing our engineering, procurement, construction and project management expertise to support a massive expansion programme. 5
6
Eskom Corporate Overview Context for creating a world class EPCM organisation
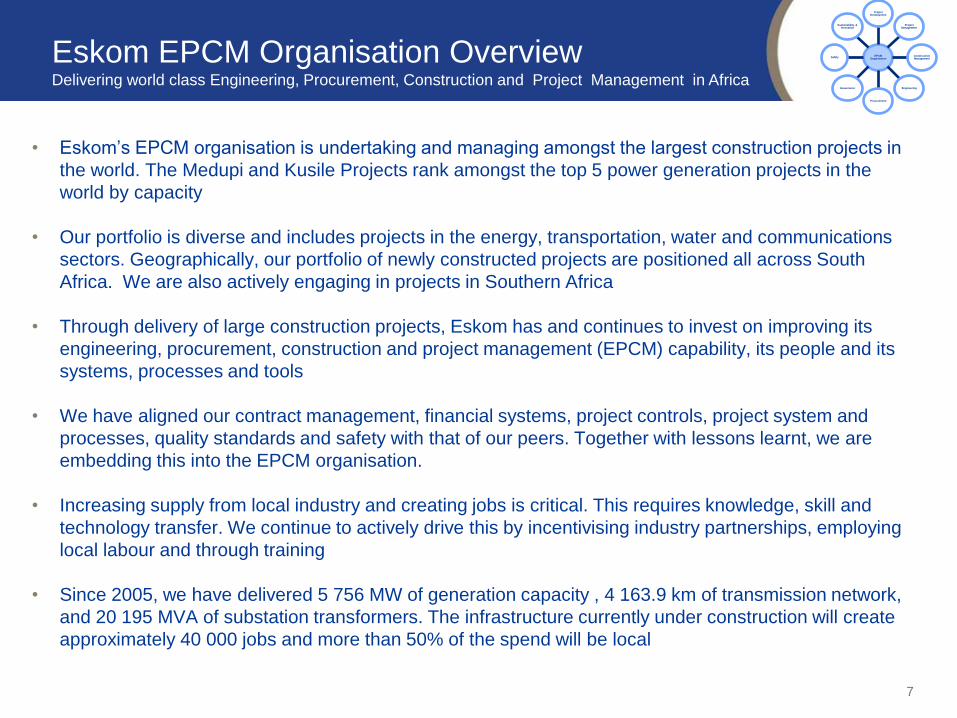
• Eskom’s EPCM organisation is undertaking and managing amongst the largest construction projects in
the world. The Medupi and Kusile Projects rank amongst the top 5 power generation projects in the
world by capacity
• Our portfolio is diverse and includes projects in the energy, transportation, water and communications
sectors. Geographically, our portfolio of newly constructed projects are positioned all across South
Africa. We are also actively engaging in projects in Southern Africa
• Through delivery of large construction projects, Eskom has and continues to invest on improving its
engineering, procurement, construction and project management (EPCM) capability, its people and its
systems, processes and tools
• We have aligned our contract management, financial systems, project controls, project system and
processes, quality standards and safety with that of our peers. Together with lessons learnt, we are
embedding this into the EPCM organisation.
• Increasing supply from local industry and creating jobs is critical. This requires knowledge, skill and
technology transfer. We continue to actively drive this by incentivising industry partnerships, employing
local labour and through training
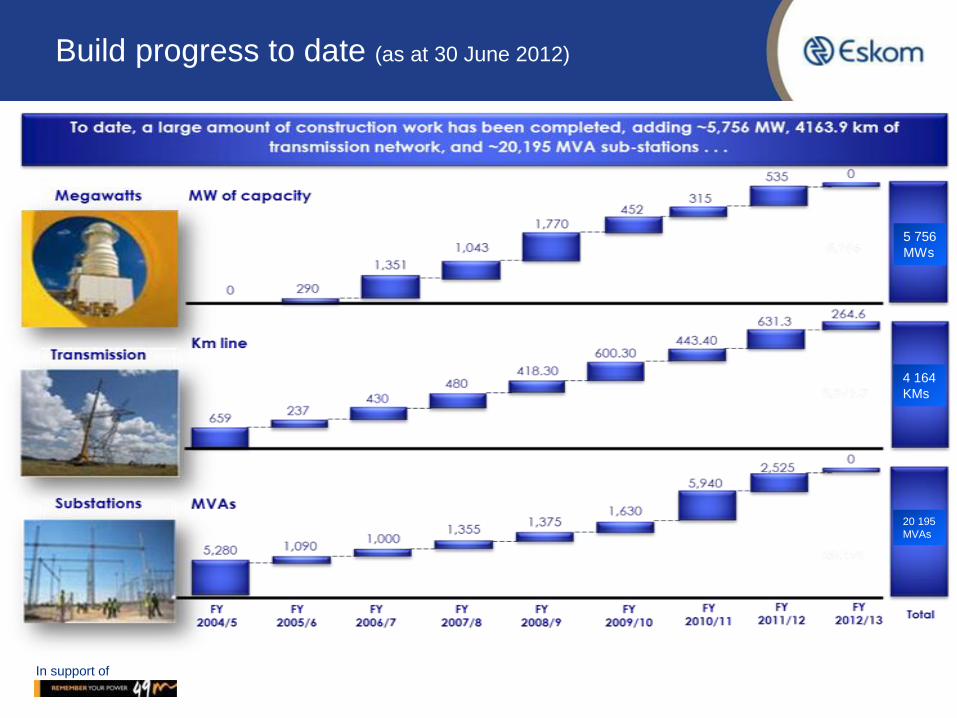
• Since 2005, we have delivered 5 756 MW of generation capacity , 4 163.9 km of transmission network,
and 20 195 MVA of substation transformers. The infrastructure currently under construction will create
approximately 40 000 jobs and more than 50% of the spend will be local
7
Eskom EPCM Organisation Overview Delivering world class Engineering, Procurement, Construction and Project Management in Africa
EPCM Organisation
Project Development
Project Management
Construction Management
Engineering
Procurement
Governance
Safety
Sustainability & Innovation

8
EPCM Organisation
Project Development
Project Management
Construction Management
Engineering
Procurement
Governance
Safety
Sustainability & Innovation
Capital investment allocation over
the five financial years from 1 April
2012 – R323 bn
Actual delivery since 2005 (as at end June
2012)
Eskom EPCM organisation has a diverse infrastructure
portfolio and which it continues to deliver upon
9
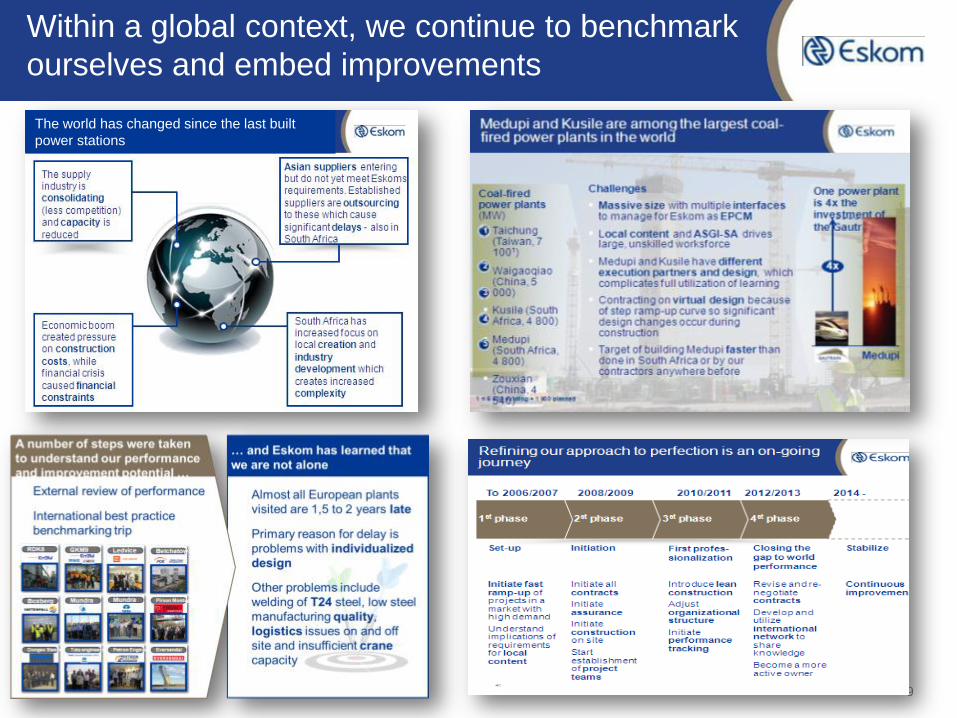
Within a global context, we continue to benchmark
ourselves and embed improvements
The world has changed since the last built
power stations

EPCM Organisation
Project Development
Project Management
Construction Management
Engineering
Procurement
Governance
Safety
Sustainability & Innovation
Construction Industry Institute® Project Definition Readiness Assessment
Within a global context, we continue to benchmark
ourselves and embed improvements
10
Aspect of Project Ranked by # of
Associated Lessons-Learned
No. of Associated Lessons-Learned
Cost 1 79
Planning & Develop. 2 73
Specifications 3 69
Schedule 4 65
Design 5 56
Criteria 6 49
Contract. Strategy & Scoping 7 48
Mechanical 8 39
Civil & Structural 9 37
Project Management 10 36
Execution 11 32
Procurement 12 28
Executive Management 13 27
Permitting 14 25
Boiler 15 22
Turbine 16 22
Siting 17 22
Communication & Coordination 18 16
Site Layout 19 16
Construction Management 20 14
Material Handling 21 13
Geotech 22 13
Project Staffing & Organization 23 13
Electrical and Controls & Instrumentation 24 10
Construction 25 10
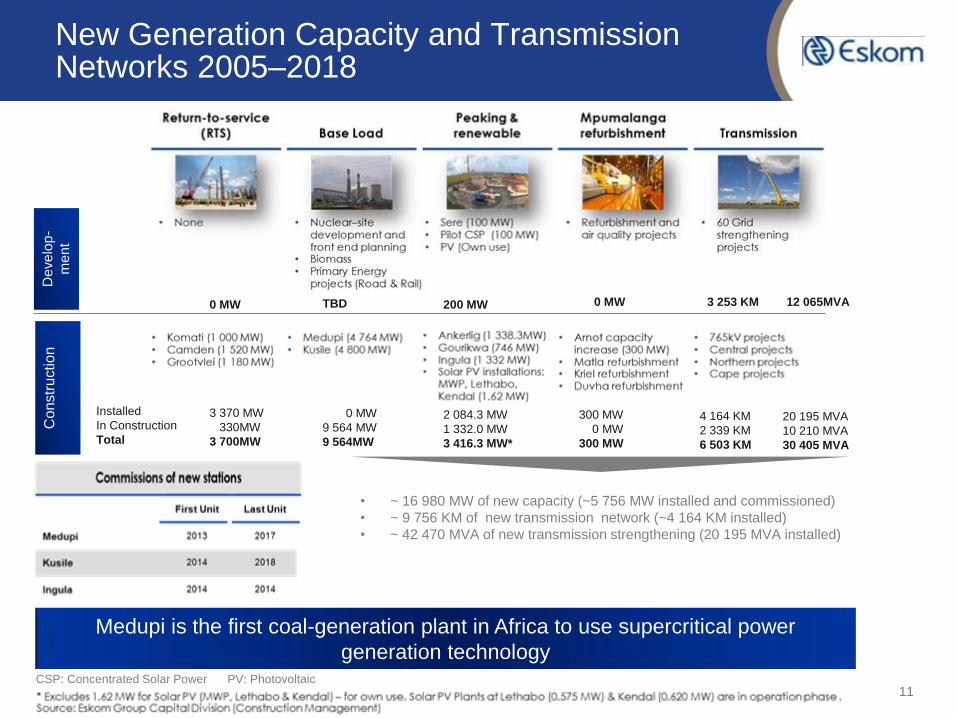
New Generation Capacity and Transmission Networks 2005–2018
0 MW 200 MW TBD 0 MW 3 253 KM
De
ve
lop
-
me
nt
Co
nstr
uction
3 370 MW
330MW
3 700MW
0 MW
9 564 MW
9 564MW
2 084.3 MW
1 332.0 MW
3 416.3 MW*
300 MW
0 MW
300 MW
4 164 KM
2 339 KM
6 503 KM
20 195 MVA
10 210 MVA
30 405 MVA
Installed
In Construction
Total
Medupi is the first coal-generation plant in Africa to use supercritical power
generation technology
• ~ 16 980 MW of new capacity (~5 756 MW installed and commissioned)
• ~ 9 756 KM of new transmission network (~4 164 KM installed)
• ~ 42 470 MVA of new transmission strengthening (20 195 MVA installed)
12 065MVA
CSP: Concentrated Solar Power PV: Photovoltaic 11

In support of
Programme challenges since inception (I/III)
Contracting and
risk sharing
• The market within which Eskom is operating was extremely tight, with
significant demands on supplier capacity and basic commodities being
a feature since 2005
• New thinking on contracting and risk sharing was essential
based on the following
Global demand for new plant was high
The supplier market was global and limited
Supplier market was experiencing shortages of material,
components and engineering capacity
Fixed price or construction commitments were unable to be
secured
Increased demand for power plants leading to significant
escalation in prices
Seller’s market, not a buyer’s market
Contract and risk-sharing profiles fundamentally changed
• Given the reserve margin, the Eskom programme was and is working
with very tight timelines
The market
Timeline
12
In support of
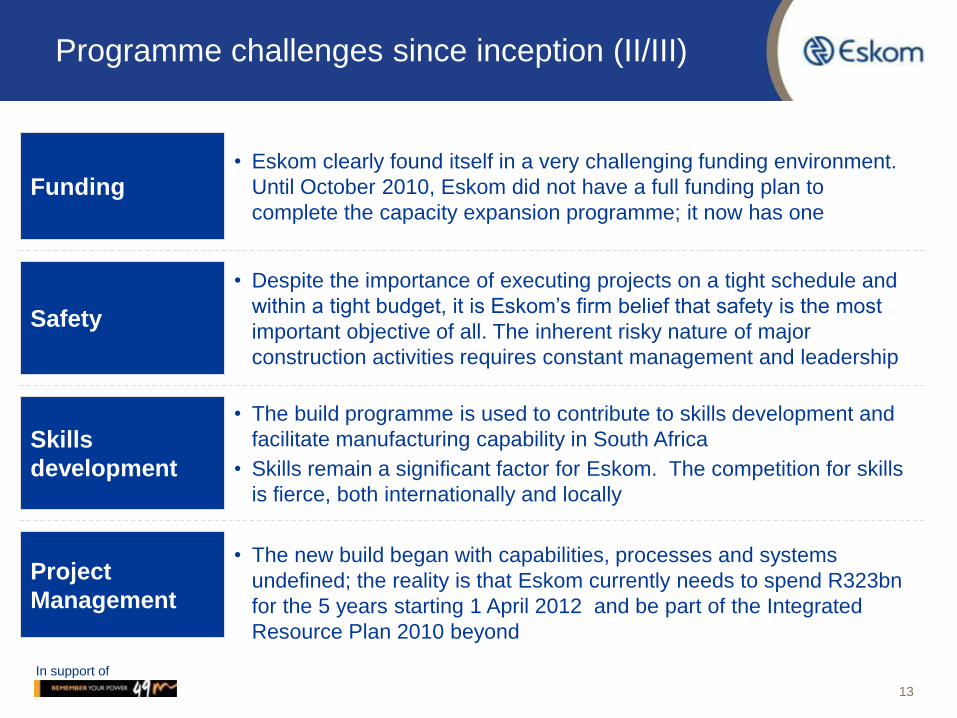
Programme challenges since inception (II/III)
Skills
development
• Eskom clearly found itself in a very challenging funding environment.
Until October 2010, Eskom did not have a full funding plan to
complete the capacity expansion programme; it now has one
• The build programme is used to contribute to skills development and
facilitate manufacturing capability in South Africa
• Skills remain a significant factor for Eskom. The competition for skills
is fierce, both internationally and locally
• The new build began with capabilities, processes and systems
undefined; the reality is that Eskom currently needs to spend R323bn
for the 5 years starting 1 April 2012 and be part of the Integrated
Resource Plan 2010 beyond
Funding
Project
Management
Safety
• Despite the importance of executing projects on a tight schedule and
within a tight budget, it is Eskom’s firm belief that safety is the most
important objective of all. The inherent risky nature of major
construction activities requires constant management and leadership
13

In support of
Programme challenges since inception (III/III)
• Contractor capacity and competence at all levels to support the
execution of build programme is still maturing. This requires greater
supervision by Eskom to improve quality, cost, schedule and safety
performance
Contractor
Performance
14

15
Focus is on Medupi, Kusile, and Ingula—the first
units will come on line between 2013 and 2014
2007 2008 2009 2010 2011 2012 2013 2014 2015 2016 2017 2006 2018
Construction
activities started
First unit commissioned
December 2013
Fully commissioned
May 2017
Construction
activities started
Construction
activities started
First unit commissioned
2014
Fully commissioned
2014
First unit commissioned
December 2014
Fully commissioned
August 2018
Execution partner
• Coal supply
• Boiler
• Turbine
• Enabling Civils
• Main Civils
• Generator transformers
Medupi Power Station
Execution partner
• Coal supply
• Boiler
• Main Civils
• Turbine
• Enabling Civils
• Generator transformers
Kusile Power Station
Road works
Civil works
Infrastructure
• B&E Quanza
Dam construction
• Silver Rock
• Concor -WBHO
• Edwin
Ingula Power Station
Unit commissioning
Source: Eskom Group Capital Division (Construction Management)
In support of
2 3 4 1 5
16
Table of contents

In support of
17
The capex for Eskom’s 3 largest new build projects ranks among the world’s largest construction projects and will result in the most ambitious infrastructure investment South Africa has ever undertaken
$ billions of capex
Kusile Medupi Ingula
Olympic Dam
– world’s largest
mining project
25
23
2
20
8 5 yr capex on rail,
port and pipeline
upgrades
Three
Gorges dam
R227bn • Funding required:
• Capacity increase as % of Eskom’s
installed base:
– Base load increases from Medupi
and Kusile
– Peaking capacity increase from
Ingula
• Will be 4th and 5th largest coal
plants in the world and 19th largest
pumped storage scheme
• Direct construction employment:
• People directly impacted
• Pace of build of Medupi is 30% faster
than previous Eskom and main
contractors coal builds
… plus they will keep the lights
on for all of South Africa!
25% (+9,564 MW)
30% (+1,332 MW)
20,000
~ 155,000
World’s largest
electricity project
In support of
18
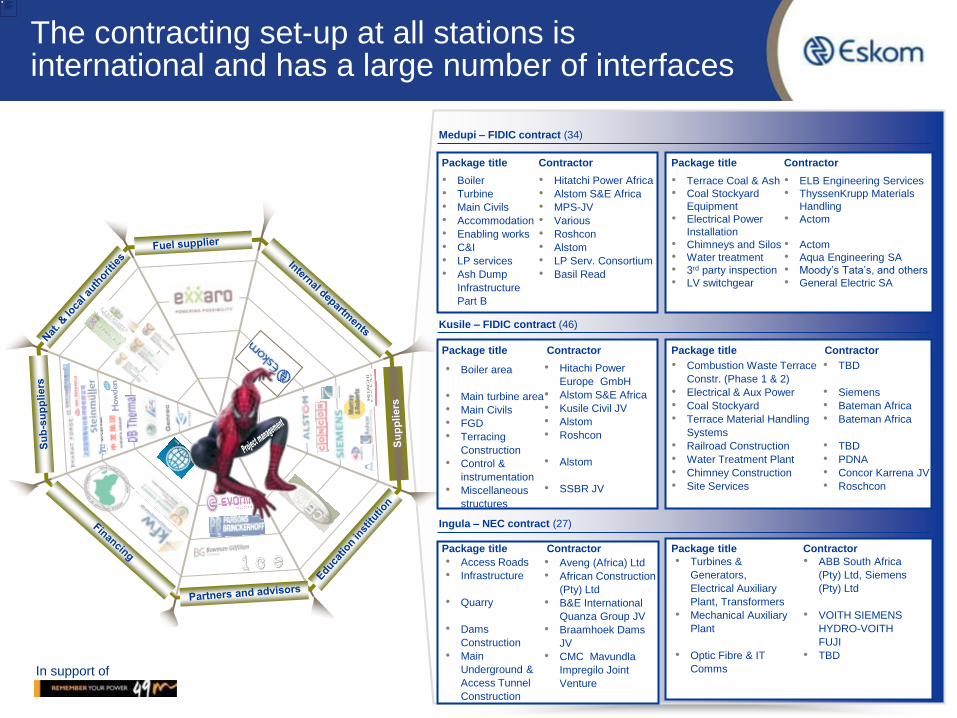
The contracting set-up at all stations is international and has a large number of interfaces
iWeNhle cost engineering (Pty) Ltd
REPORT
Tel/Fax: 27-11-462-7601
M R Nhlengethwa (Cell: 082-457-3213)
M C Webb (Cell: 083-306-6952)
Medupi – FIDIC contract (34)
Package title Contractor
• Boiler
• Turbine
• Main Civils
• Accommodation
• Enabling works
• C&I
• LP services
• Ash Dump
Infrastructure
Part B
• Hitatchi Power Africa
• Alstom S&E Africa
• MPS-JV
• Various
• Roshcon
• Alstom
• LP Serv. Consortium
• Basil Read
Package title Contractor
• Terrace Coal & Ash
• Coal Stockyard
Equipment
• Electrical Power
Installation
• Chimneys and Silos
• Water treatment
• 3rd party inspection
• LV switchgear
• ELB Engineering Services
• ThyssenKrupp Materials
Handling
• Actom
• Actom
• Aqua Engineering SA
• Moody’s Tata’s, and others
• General Electric SA
Kusile – FIDIC contract (46)
Package title Contractor Package title Contractor
Ingula – NEC contract (27)
Package title Contractor Package title Contractor
• Boiler area
• Main turbine area
• Main Civils
• FGD
• Terracing
Construction
• Control &
instrumentation
• Miscellaneous
structures
• Hitachi Power
Europe GmbH
• Alstom S&E Africa
• Kusile Civil JV
• Alstom
• Roshcon
• Alstom
• SSBR JV
• Combustion Waste Terrace
Constr. (Phase 1 & 2)
• Electrical & Aux Power
• Coal Stockyard
• Terrace Material Handling
Systems
• Railroad Construction
• Water Treatment Plant
• Chimney Construction
• Site Services
• TBD
• Siemens
• Bateman Africa
• Bateman Africa
• TBD
• PDNA
• Concor Karrena JV
• Roschcon
• Access Roads
• Infrastructure
• Quarry
• Dams
Construction
• Main
Underground &
Access Tunnel
Construction
• Turbines &
Generators,
Electrical Auxiliary
Plant, Transformers
• Mechanical Auxiliary
Plant
• Optic Fibre & IT
Comms
• Aveng (Africa) Ltd
• African Construction
(Pty) Ltd
• B&E International
Quanza Group JV
• Braamhoek Dams
JV
• CMC Mavundla
Impregilo Joint
Venture
• ABB South Africa
(Pty) Ltd, Siemens
(Pty) Ltd
• VOITH SIEMENS
HYDRO-VOITH
FUJI
• TBD
In support of
Build progress to date (as at 30 June 2012)
5 756
MWs
4 164
KMs
20 195
MVAs

In support of
Current capacity expansion plan
20
In addition, Eskom has commenced the development of a 100MW CSP plant
11256
200
894

In support of 23,7
In addition, we plan to spend:
• More than R10 billion over each of the 5 years to
strengthen, refurbish and expand our Distribution
network; and
• R57 billion on refurbishing our generation plants over the
5 years
64%
50% 90%
53.5%
91.2
23.8
118.5
19.7 33.5
% of estimated total cost spent as at 30 June
2012
Significant progress in build programme – began in 2005 with completion in 2017/18
21
36% R billion spent and to be spent on the capacity
expansion programme (excluding borrowing
costs capitalised)

In support of
Source
Exchange
Rate
R/US$
Technology Overnight
cost ($/kW)
Cost
Components
Medupi –
Overnight
Cost ($/kW)
Kusile –
Overnight
Cost ($/kW)
EPRI (May
2010) Data for
IRP2010
7.4 Pulverized Coal
with FGD 2,403 - 2,656
• Basic cost
• Contingency
2,210
2,399
Pulverized Coal
without FGD 2,091 - 2,281
Lazard
(June 2009) 8.3*
Super-critical
with and
without carbon
capture
2,800 - 5,925
• Basic cost
• Contingency
• ODC
• IDC
• Transmission
2,786 3,269
IEA
(2010 Edition) 8.2
Super-critical
from various
countries
672 - 2,539
• Basic cost
• Contingency
• ODC
2,048 2,325
Project cost benchmarks - overnight cost ($/kW)
benchmarks
EPRI: Electric Power Research Institute IRP: Integrated resource Plan FGD: Flue Gas Desulphurisation
ODC: Owner’s Development Cost IDC: Interest During Construction IEA: International Energy Agency
22

In support of
Funding plan – R300 billion to 2017 as at 31 March 2012
23
(1) As a percentage of the R300bn funding sourced (2) As a percentage of the currently secured total
Source of funds
Funding
sourced
Rbn
Currently
secured
Rbn
Draw-
downs
to date
Rbn
Amount
supported
by
Government
Rbn
Bonds 90.0 32.9 32.9 20.4
Commercial paper 70.0 70.0 20.0 0.0
Export Credit Agency
backed 32.9 32.9 15.6 0.0
World Bank loan 27.8 27.8 5.6 27.8
AFDB loan 20.9 20.9 5.9 20.9
DBSA loan 15.0 15.0 3.0 0.0
Shareholder loan 20.0 20.0 20.0 20.0
Other sources 23.4 13.2 0.8 4.9
Totals 300.0 232.7 103.8 94.0
Percentages
77.6%(1) 44.6%(2) 40.4%(2)

In support of
2 3 4 1 5
24
Table of contents
24

In support of
25
Kusile and Medupi will be the third and fourth largest coal-fired power plants in the world, respectively…
Higher than Sandton
City Towers ~
11
3m
4x more investment than
Gautrain
4x
Medupi
1 = 5 500 existing + 1 600 planned
Coal-fired power plants (MW)
▪ Taichung (Taiwan, 7 1001)
▪ Waigaoqiao (China, 5 000)
▪ Kusile (South Africa, 4 800)
▪ Medupi (South Africa, 4 764)
▪ Zouxian (China, 4 540)
▪ Kendal (South Africa, 4 374)
▪ …
▪ …
1
2
3
4
5
6
7
8
In support of
26 26
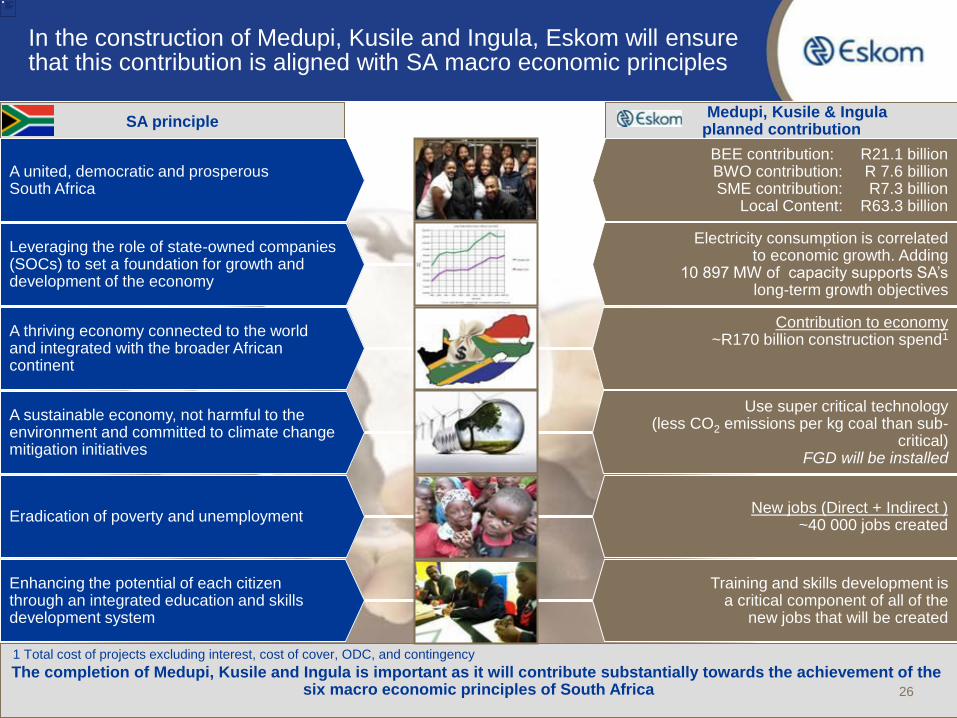
In the construction of Medupi, Kusile and Ingula, Eskom will ensure that this contribution is aligned with SA macro economic principles
SA principle Medupi, Kusile & Ingula
planned contribution
A united, democratic and prosperous South Africa
BEE contribution: R21.1 billion BWO contribution: R 7.6 billion SME contribution: R7.3 billion
Local Content: R63.3 billion
Leveraging the role of state-owned companies (SOCs) to set a foundation for growth and development of the economy
Electricity consumption is correlated to economic growth. Adding
10 897 MW of capacity supports SA’s long-term growth objectives
A thriving economy connected to the world and integrated with the broader African continent
Contribution to economy ~R170 billion construction spend1
A sustainable economy, not harmful to the environment and committed to climate change mitigation initiatives
Use super critical technology (less CO2 emissions per kg coal than sub-
critical) FGD will be installed
Enhancing the potential of each citizen through an integrated education and skills development system
Training and skills development is a critical component of all of the
new jobs that will be created
Eradication of poverty and unemployment New jobs (Direct + Indirect )
~40 000 jobs created
The completion of Medupi, Kusile and Ingula is important as it will contribute substantially towards the achievement of the six macro economic principles of South Africa
1 Total cost of projects excluding interest, cost of cover, ODC, and contingency
26

In support of
As such, the programme will have significant impact on local industry, skills, jobs, infrastructure and regional development
Infrastructure
Development of roads
and railways
Jobs
~40 000 jobs created,
directly and indirectly
Local content
>50% of local content
directly benefiting the
SA economy
Regional development
Spend and invest-ment in local areas
Local skills development
Rapid growth in SA’s skills pool
1 2 3 4 5
1 Based on GDP in 2008
SOURCE: Eskom Enterprises division and Medupi project, STATS-SA
27
In support of
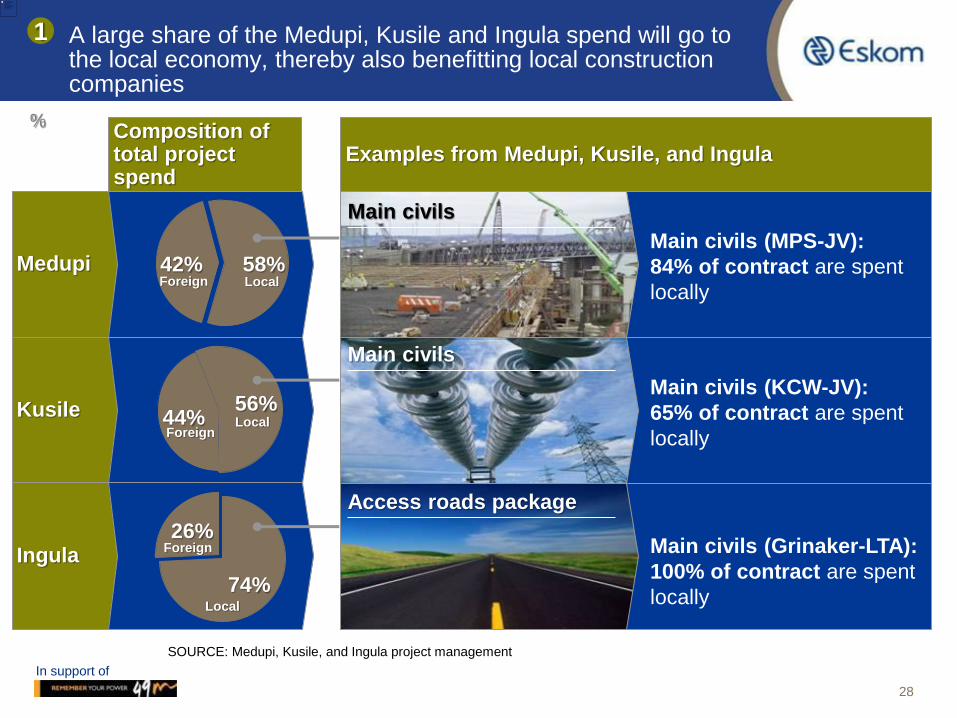
% Composition of total project spend
58% 42%
56% 44%
74%
26%
A large share of the Medupi, Kusile and Ingula spend will go to the local economy, thereby also benefitting local construction companies
1
SOURCE: Medupi, Kusile, and Ingula project management
Medupi
Kusile
Ingula
Main civils (MPS-JV):
84% of contract are spent
locally
Main civils (KCW-JV):
65% of contract are spent
locally
Main civils (Grinaker-LTA):
100% of contract are spent
locally
Examples from Medupi, Kusile, and Ingula
Main civils
Main civils
Access roads package
Foreign Local
Foreign Local
Foreign
Local
28

In support of
• Brand new fabrication facility built
in Nigel
• Boiler Membrane Wall Workshop
• Two new CNC Benders commissioned
• New welding training centre
• CNC header drilling machine
• Training facilities in Pretoria and in
Wadeville
Many skills are being developed as local content requirements kick-start whole new industries in SA
90% of major orders placed
on mechanical equipment
New fabrication and training facilities
established
Air Cooled Condenser (ACC)
Major pumps
Heaters
LP outer casing Unit 6
Feedwater tank
Heaters Drain recovery pumps
Equipment
>55%
100%
>80%
>45%
>90%
>20%
Local content
2
SOURCE: Medupi project management 29

In support of
Medupi would …
The programme will fuel demand for relevant graduates and artisans and will grow the wide required skill base
… rapidly grow South Africa’s supply
of engineers, artisans, R&D and
project management experts
… consume 43% of a year’s relevant
university graduation (engine-
ering, project planning, etc.)
… deploy 48% of a year’s output
of artisans
… develop a wide range of additional
skills through Asgi-SA commitments
2
SOURCE: Eskom Enterprises division and Medupi project 30

In support of
Across Medupi, Kusile, and Ingula new employment opportunities will touch the lives of ~160 000 people
On site construction
Supporting project staff
Coal mine expansion
Transmission expansion
Crocodile River expansion
Ongoing operations
Subtotal
DIRECT
INDIRECT Social services + local business
8 300
2 200
2 100
2 700
3 000
700
~19 000
Total employed
1 700
20 700
x family multiplier (4/family)
x 4
People directly impacted by Medupi, Kusile & Ingula
~160 000
7 200
600
~12 000
1 700
13 700
4 100
100
~4 500
1 100
5 600
Medupi Kusile Ingula
3
2 000
200
2 000 300
SOURCE: Eskom Enterprises division and Medupi project
Other projects such as 765kV
and RTS provide
~ 11 000 direct employment
opportunities during
construction and a further
~1 700 during operation
31
In support of
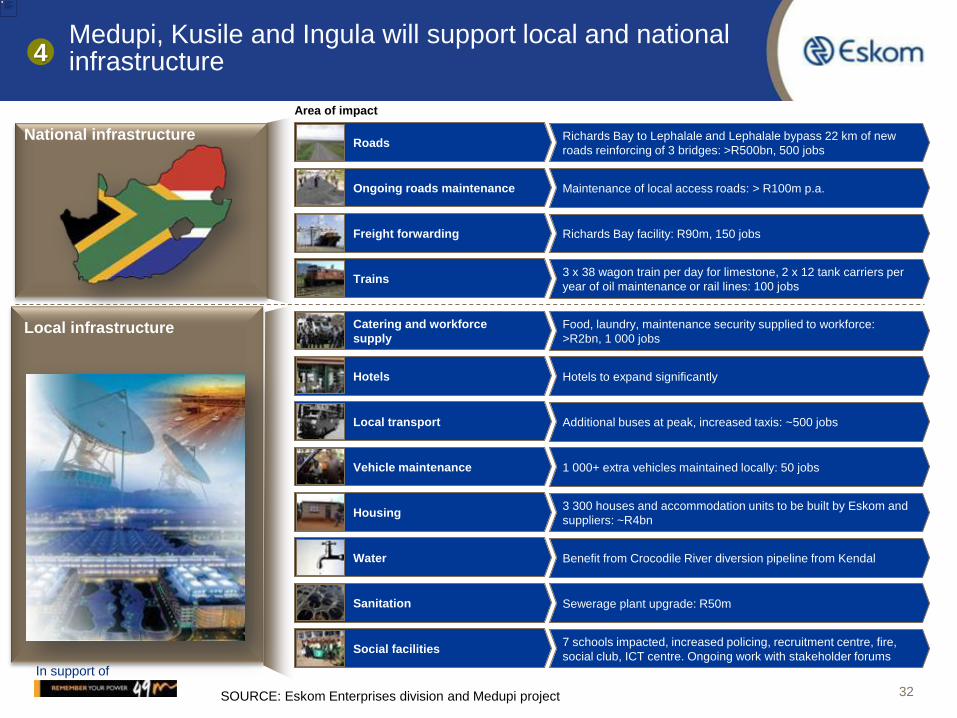
Medupi, Kusile and Ingula will support local and national infrastructure
Example
Roads Richards Bay to Lephalale and Lephalale bypass 22 km of new
roads reinforcing of 3 bridges: >R500bn, 500 jobs
Ongoing roads maintenance Maintenance of local access roads: > R100m p.a.
Trains 3 x 38 wagon train per day for limestone, 2 x 12 tank carriers per
year of oil maintenance or rail lines: 100 jobs
Catering and workforce
supply
Food, laundry, maintenance security supplied to workforce:
>R2bn, 1 000 jobs
Local transport Additional buses at peak, increased taxis: ~500 jobs
Vehicle maintenance 1 000+ extra vehicles maintained locally: 50 jobs
Water Benefit from Crocodile River diversion pipeline from Kendal
Sanitation Sewerage plant upgrade: R50m
Social facilities 7 schools impacted, increased policing, recruitment centre, fire,
social club, ICT centre. Ongoing work with stakeholder forums
Hotels Hotels to expand significantly
Freight forwarding Richards Bay facility: R90m, 150 jobs
Housing 3 300 houses and accommodation units to be built by Eskom and
suppliers: ~R4bn
National infrastructure
Local infrastructure
Area of impact
4
SOURCE: Eskom Enterprises division and Medupi project 32

In support of
Other businesses and
infrastructure created:
• Catering
• Laundry
• Building companies
• House maintenance
• Hotels
• Entertainment
• Training facilities
• Security
• Schools / education
• Policing
• Churches
• Medical care
• Banks & financial
services
Impact on local town’s
GDP from each project
Lephalale (Medupi)
Delmas (Kusile)
Ladysmith (Ingula)
95%
25%
7%
Typical local businesses and infrastructure created
Shops
Transport Schools
Civil infrastructure
Each project will measurably impact the local towns
through local spend & investment 5
SOURCE: Eskom Enterprises division and Medupi project 33

In support of
2 3 4 1 5
Table of contents
34

In support of
Project
summary
• Greenfields Project - Lephalale (Limpopo Province)
• 6 unit coal-fired power station
• Planned capacity 4 764MW
• Projected project cost to completion ~ R91.2 bn (excl. IDC)
• Estimated 95% impact on Lephalale town GDP
Financial &
economic
impact
Build programme overview - Medupi
• Construction commenced March 2007
• First Unit planned to generate power to the grid between May
2013 and September 2013
• Subsequent Units at 6 to 9 month intervals thereafter
Project
development
35
IDC: Interest During Construction GDP: Gross Domestic Product

In support of
Medupi has been delayed for various reasons, particularly related to the Unit 6 civil and boiler
Root causes
Key delay
events
Civil access
▪ Ongoing modifications to structural steel design delays manufacturing and erection timelines
▪ Manufacture of incorrect pieces leads to substantial re-work
Steel modifications
▪ Poor tracking and logistics systems in terms of locating boiler material
▪ Boiler materials not supplied in order needed to support efficient erection
▪ Issues with boiler erection contractor performance
Erection
Total delay
from 3
events = ~20
months
Civil Boiler
▪ Unanticipated difficulty in levelling site foundation
▪ Boiler foundation design not frozen
▪ Issues with civil contractor performance
~10mths delay ~10mths delay
36

In support of
P09 Technical Building
Equipment
P10 Enabling Site Facilities
P14 Aux.Transformers
P15 Gen Transformers
P16 UPS
P17 C & I
P11 Electrical Power Installation
P12 LV Switch Gear
P13 MV Switchgear
P04 LP Services
P06 Water Treatment Plant
P07 Chimney and Silos
P08 Main Civils
P01 Coal Overland Conveyor
P03 Turbine
P31B Clarifiers
P21 Laboratory
P32 Dust Handling
and Conditioning
P33 Terrace Coal
and Ash
P35B Buildings –
Non-technical
P35C Buildings –
Technical
P35A Buildings -
Critical
P31A Reservoirs
P28 Ash Dump
Equipment and
Ash Overland
P22A Infrastructure &
Ash dams & dumps
P22B Infrastructure &
Ash dams & dumps
P27 Coal Stockyard
Equipment
P23 Diesel Generator
P02 Boiler Major
packages
The boiler is essential for the overall timeline, though it is just one of many construction packages
…of which the boiler is the critical path Medupi consists of 38 packages …
Delay on the critical path imposes the same delay on the whole project timeline Boiler
Turbine
Main civil
Accommodation
Enabling works
C&I
LP services
Ash dump infrastructure
Terrace Coal and Ash
Coal stockyard equipment
Electrical power installation
Chimneys and silos
Water treatment
3rd Party inspection
LV Switchgear
37
In support of
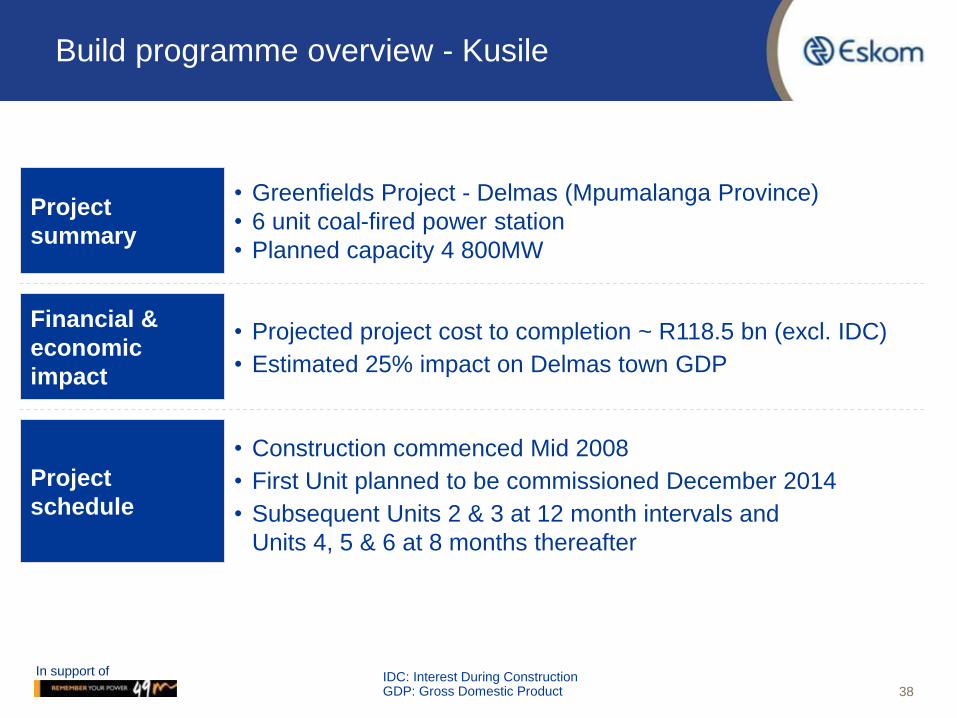
Build programme overview - Kusile
Project
summary
• Greenfields Project - Delmas (Mpumalanga Province)
• 6 unit coal-fired power station
• Planned capacity 4 800MW
• Projected project cost to completion ~ R118.5 bn (excl. IDC)
• Estimated 25% impact on Delmas town GDP
• Construction commenced Mid 2008
• First Unit planned to be commissioned December 2014
• Subsequent Units 2 & 3 at 12 month intervals and
Units 4, 5 & 6 at 8 months thereafter
Financial &
economic
impact
Project
schedule
38 IDC: Interest During Construction GDP: Gross Domestic Product
In support of
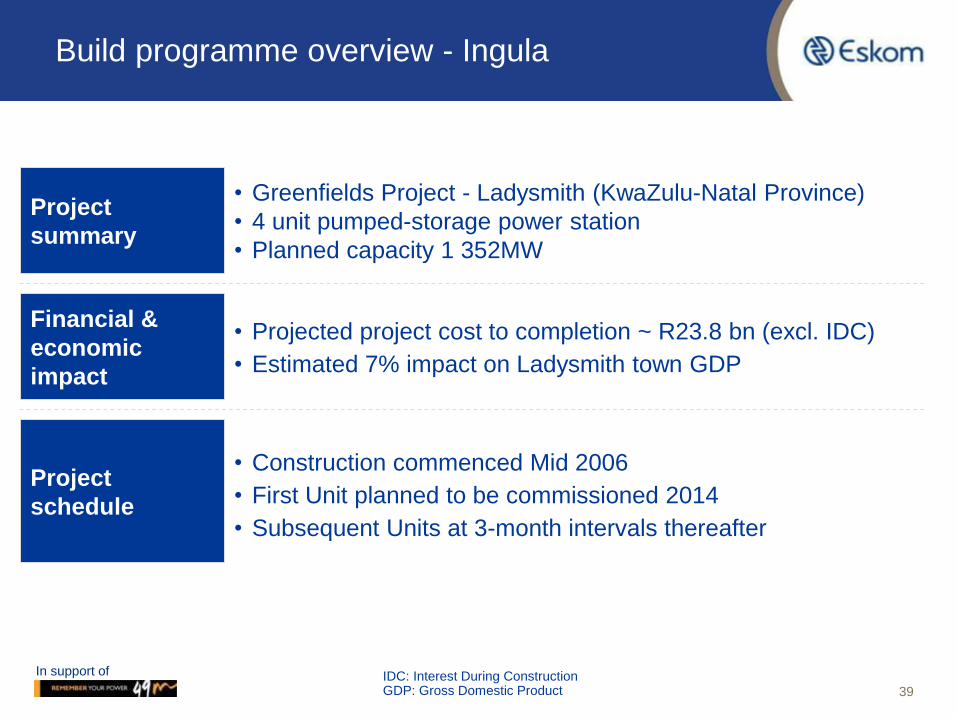
Build programme overview - Ingula
Project
summary
• Greenfields Project - Ladysmith (KwaZulu-Natal Province)
• 4 unit pumped-storage power station
• Planned capacity 1 352MW
• Projected project cost to completion ~ R23.8 bn (excl. IDC)
• Estimated 7% impact on Ladysmith town GDP
Financial &
economic
impact
• Construction commenced Mid 2006
• First Unit planned to be commissioned 2014
• Subsequent Units at 3-month intervals thereafter
Project
schedule
IDC: Interest During Construction GDP: Gross Domestic Product 39

In support of
Build programme overview - Return to Service
Project
summary
• Refurbishment and return to service of previously moth-balled
coal fired power stations in Mpumalanga.
Camden (8 units—total 1 520MW)
Grootvlei (6 units—1 180MW)
Komati (9 units—1 000MW)
• Projected RTS cost to completion ~ R25.5 bn (excl. IDC)
Financial &
economic
impact
• All 8 units at Camden power plant are now in commercial
operation
• All 6 units, have been commissioned at Grootvlei.
• 6 units, each rated at 125MW, have been commissioned at
Komati power station. 3 final units expected to be
commissioned by 31 March 2013
Project
schedule
IDC: Interest During Construction 40

In support of
Build programme overview – Transmission Construction Portfolio 2005 to 2018
Project
summary
• Transformers - ~42 470 MVA planned with 20 195 MVA installed. Large projects
in construction include:
765kv (Planned: 12,000 MVA)
Cape Grid (Planned: 1,500 MVA)
Northern Grid (Planned: 3,500 MVA)
Central Grid (Planned: 3,600 MVA)
• Transmission Lines – ~9 756 km planned with 4 164 km installed. Large projects
in construction include:
765kv (1,689.9 km)
Northern Grid (1,253.6 km)
Cape Grid (621 km)
Central Grid (413 km)
• Remaining spend in 5 years starting 1 April 2012 is R56 bn excl. IDC (R16 bn for
projects in construction and R40 bn for projects in development)
• 765kV: December 2013
• Northern Grid: June 2015
• Central Grid: Mar 2015
• Cape Grid: Aug 2016
Financial &
economic
impact
Project
schedule
IDC: Interest During Construction 41 Transmission Development Plan is reviewed regularly with NERSA and the future plan can change depending on
country needs

In support of
2 3 4 1 5
Table of contents
42

In support of
SA national planning process - driven by Regulations on New Generation
43
IPP Procurement PPA
Fund Build IRP Feasi- bility
The IRP determines which technologies will be built DoE Regulations state new generation capacity must be represented in the IRP to receive generation and distribution licenses or receive a Section 34 exemption from the minister
A feasibility study is conducted and IRP capacity is allocated to the most suitable; IPPs or Eskom DoE - According to New Generation Regulations This process has not yet been executed and is required for subsequent planning actions
Suitable IPPs are procured through the IPP procurement process DoE / Single Buyer Office The IPP procurement process must be finalised to ensure participation of these producers
Buyer of electricity signs Power Purchase Agreements (PPAs) with power producer Minister must assign a buyer of each PPA Currently, the Single Buyer Office is ring-fenced within Eskom to sign PPAs based upon the DoE procurement decision
IPPs often require PPAs prior to obtaining external funding. Such PPAs will require government backing Eskom, IPPs Eskom may receive funding with government backing. Costs are recovered via the MYPD submissions electricity tariff
Building for Eskom or IPPs can only commence once investment decision has been taken Eskom, IPPs Construction of IRP projects may be delayed due to required upstream decisions
Bac
kg
rou
nd
R
es
po
nsib
le
Sta
tus

In support of
Total additional new capacity
(without committed) until 2030 in GW
5
20
15
10
Wind
CSP
Solar PV
1,0
Peak -
OCGT
Coal
3,9
8,4
9,6
6,3
8,4
17,8
Renewables Nuclear Gas -
CCGT
2,4 2,6
Hydro
25
IRP 2010
65% 20% 5% 1% < 0,1% 9%
90% 5% 5% 0% < 0,1% 0% Energy
share
in 2010
in 2030
15% 23% 6% 6% 9% 42%
Share
of total
new GW
= 260 TWh
= 454 TWh
IRP outcomes
44
In support of
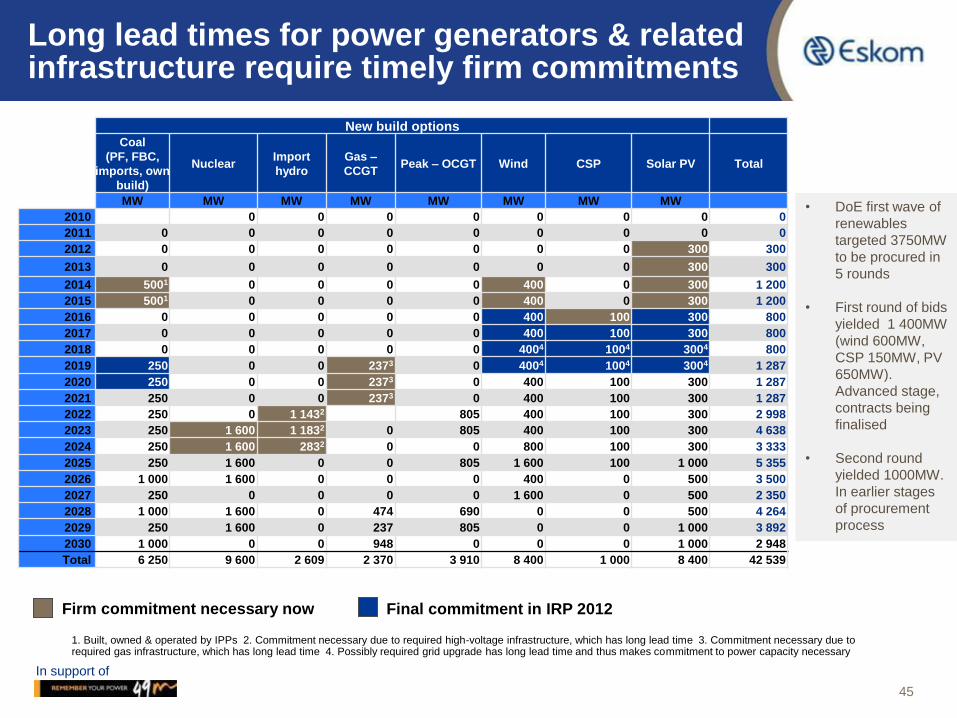
Long lead times for power generators & related infrastructure require timely firm commitments
New build options Coal
(PF, FBC,
imports, own
build)
Nuclear Import
hydro
Gas –
CCGT Peak – OCGT Wind CSP Solar PV Total
MW MW MW MW MW MW MW MW
2010 0 0 0 0 0 0 0 0
2011 0 0 0 0 0 0 0 0 0
2012 0 0 0 0 0 0 0 300 300
2013 0 0 0 0 0 0 0 300 300
2014 5001 0 0 0 0 400 0 300 1 200
2015 5001 0 0 0 0 400 0 300 1 200
2016 0 0 0 0 0 400 100 300 800
2017 0 0 0 0 0 400 100 300 800
2018 0 0 0 0 0 4004 1004 3004 800
2019 250 0 0 2373 0 4004 1004 3004 1 287
2020 250 0 0 2373 0 400 100 300 1 287
2021 250 0 0 2373 0 400 100 300 1 287
2022 250 0 1 1432 0 805 400 100 300 2 998
2023 250 1 600 1 1832 0 805 400 100 300 4 638
2024 250 1 600 2832 0 0 800 100 300 3 333
2025 250 1 600 0 0 805 1 600 100 1 000 5 355
2026 1 000 1 600 0 0 0 400 0 500 3 500
2027 250 0 0 0 0 1 600 0 500 2 350
2028 1 000 1 600 0 474 690 0 0 500 4 264
2029 250 1 600 0 237 805 0 0 1 000 3 892
2030 1 000 0 0 948 0 0 0 1 000 2 948
Total 6 250 9 600 2 609 2 370 3 910 8 400 1 000 8 400 42 539
Firm commitment necessary now
1. Built, owned & operated by IPPs 2. Commitment necessary due to required high-voltage infrastructure, which has long lead time 3. Commitment necessary due to required gas infrastructure, which has long lead time 4. Possibly required grid upgrade has long lead time and thus makes commitment to power capacity necessary
Final commitment in IRP 2012
45
• DoE first wave of
renewables
targeted 3750MW
to be procured in
5 rounds
• First round of bids
yielded 1 400MW
(wind 600MW,
CSP 150MW, PV
650MW).
Advanced stage,
contracts being
finalised
• Second round
yielded 1000MW.
In earlier stages
of procurement
process

275684-01-SADC-v01-11Apr11-DP-pf-CPT.ppt 46
275684-01-SADC-v01-11Apr11-DP-pf-CPT.ppt 46
Electricity Potential in the SADC Region
Generation potential in SADC is significant,
investments in Power Generation and Transmission are needed to unlock potential
Libya
Mali
DRC
Zambia
Egypt
Ethiopia
Kenya
Nigeria
Tanzania
Namibia Botswana
Angola
East Transmission
Corridor
1000 MW Hydro
in Zambia
5000 MW Hydro, Coal
and Gas
in Mozambique 1000 MW Gas
in Namibia
1200 MW Coal
in Botswana
West transmission
corridor
> 20 000 MW Hydro on
Angola and DRC
18 000 + MW
Hydro
in Ethiopia
+- 3 000 MW
Geothermal in
Kenya
46
In support of
In conclusion, since 2005 until today
• The new build programme is significant by any measure. Cost increases are understood and taken into account, lessons have been learnt and implemented for future projects and across existing projects
• Good progress has been made, but many serious risks, including contractor performance, will need to be carefully managed in the future. Strong mitigating measures have been and are being put in place to manage these risks
• The global financial crisis has affected all sectors of the economy, Eskom included. This led to a review of the build program taking into account
• Financial contractions of the markets,
• Resultant re-prioritisation of certain capacity projects and
• Delaying the execution of some of the projects at certain times since 2005; full go ahead on Kusile was given in October 2010
• Macro-economic factors have negatively impacted the build programme:
• CPA, and Cost of cover and other market forces
• Decisions are required on allocations of build for IRP 2010
47

Thank you