eskom’s approach to energy efficiency and demand side...
TRANSCRIPT

Eskom’s Approach to Energy Efficiency and Demand Side Management
September 2012

Global Developments
there is energy intelligent life out there

Reasons for Energy Efficiency
3
Cost effectiveness
Positive
environmental impact
Quickest time to
implement
Economic Growth
Job Creation
Least economic
impact
Public awareness
Technology

History
2001 Research RLM
2002 Operational DSMLM and EE
options
Anticipated
Peaking
problem in
2007/8
EE (Shared
Savings
Model)
LM 100%
2003Energy White
PaperRenewable
10,000 GWh
2004NERSA EEDSM
Policy
2005DMP introduced to
DSMPart of DSM
offering
2006Western Cape
CrisisTx Baseload
Problem
Focus on EE (not LM)
CFL rollout
Stakeholder Management
2008 National CrisisBaseload
Problems
2009 Refit (renewable
energy fund) (DoE)
PCP
Development of R3.5m/MW model (based on DSM
techs vs cost of generation at R8m to R10m/MW)
Industrial LM &EE
Commercial EE (lighting)
Residential (munic HWLC)
Residential (domestic EE)
Co
Gen/MTPPP
Peak clipping
100% funded
Need for
peaking plant
(Ankerlig,
Gouriqua)
Need to
change R/MW
to R/MWhSWH introduced
Lo
ad
Ma
na
ge
me
nt
En
erg
y
Eff
icie
nc
yID
M
ULM, AMI,
Tariff
Tariff options
2011 Additional funding
models
Standard OfferStandard
ProductResidential
Mass rollout2012
Rebate
Programmes
Performance
Contracting
Eskom’s DSM programme has evolved to a strong focus on energy efficiency

The State of the Electricity System
need for new capacity and energy management

6
South Africa’s power system is constrained and will be for next few years
Eskom, together with stakeholders, have kept the lights on since 2008
Most power stations are in their mid-life and require increased maintenance
Strategy of shifting maintenance outages can no longer be sustained.
Significant maintenance is required to address backlogs
Initiatives are in place to keep the lights on

Ensuring stable system operation
7
Ideally, 3,000MW of committed capacity from supply and demand
initiatives is needed immediately to keep the lights on and enable
maintenance to continue. Reducing this target will require an
adjustment to the maintenance programme.
Between now and end-December 2013, the minimum targets set out
in the table below need to be achieved to prevent an emergency.
Immediate (MW)
By July 2012 (MW) and
sustained to end December
2013
High load factor initiatives to
bring certainty to maintenance
planning
1000 2000
Pre-Emergency/
Contingency/Peaking initiatives 2000 1000

Historical Performance

Available Funding and Targets
9
3
5.4
4 055
1 037
billion ZAR, over
years, to deliver
MW demand savings and
GWh energy savings.
NERSA MYPD2 allocation for EE and DSM
2012/05/12
Electricity consumer money is ploughed back into the economy via energy efficiency
rebate programmes

Eskom annual achievements
0
200
400
600
800
1000
FY 2005 FY 2006 FY 2007 FY 2008 FY 2009 FY 2010 FY 2011 FY 2012
Pe
ak
De
ma
nd
Sa
vin
gs
(MW
)
* Includes DMP & Non Funded Projects
Savings as per year claimed
Eskom Target Demand Savings Achieved NERSA Target
Eskom has consistently over-achieved on the NERSA targets

Eskom’s demand savings performance to date
11
Demand Savings
3073 MW
1 power station generator is approximately
600MW therefore over 5 generators “freed up”

The IDM energy savings for 2011/12 could power a city for a year
Source: Annual electricity consumption/sales as reported in the State of Cities 2006, City Energy Support Unit, Sustainable Energy Africa, 2006
1,422 G i g a w a t t h o u r s
Mangaung (1,397 GWh consumed during 2006)
Buffalo City (1,305 GWh consumed during 2006)
either of
Sol Plaatjie (514 GWh consumed during 2006)
or
for 2½ years
for ~1 year

Achieving 343 MWs with various technologies
13
LED downlights in commercial facilities
based on data from current pilot
Heat pumps for residential use based on empirical values used in planning
Solar Water Heater with timer
based on M&V data
Commercial efficiency upgrades average based on 110 competed projects
Industrial efficiency improvement projects average based on 72 completed projects
17 150 000
989 924
631 605
435
246
3 040 559
Number of units
High pressure systems
Low pressure systems
OR
OR
OR
OR

Eskom IDM Footprint
Major Eskom
Offices supporting
IDM programmes
IDM programmes require large scale support and logistics needs

Eskom compares favourably with the rest of the world
2012/09/10 15
Eskom’s innovative Power Alert tool has won prestigious international awards
in both marketing and engineering fields.
54 million CFLs distributed across South Africa to date, representing one of
the largest CFL roll outs in the world.
Amongst the lowest cost programmes in the world as measured by $/MW
demand reduction.
Recognised by the World Bank as one of the most comprehensive utility
energy efficiency and demand side management programmes, certainly
amongst the BRICS countries.
Aligned with best practices for energy efficiency implementation
programmes as developed by the EU Energy Efficiency Watch survey of the
National Energy Efficiency Action Plans from 26 EU Member States.

Market Focus

Electricity consumption per sector
Source: as reported in the Eskom 2011 Integrated report) 2012 USERS CONFERENCE | AFRICA 17
Mining 18%
Industry 49%
Commerce 10%
Transport 2%
Agriculture 4%
Residential 17%
Energy Consumption
Mining 14%
Industry 35%
Commerce 10%
Transport 2%
Agriculture 4%
Residential 35%
Demand
Eskom prioritises its focus on energy efficiency by targeting all economic sectors
with multiple technologies
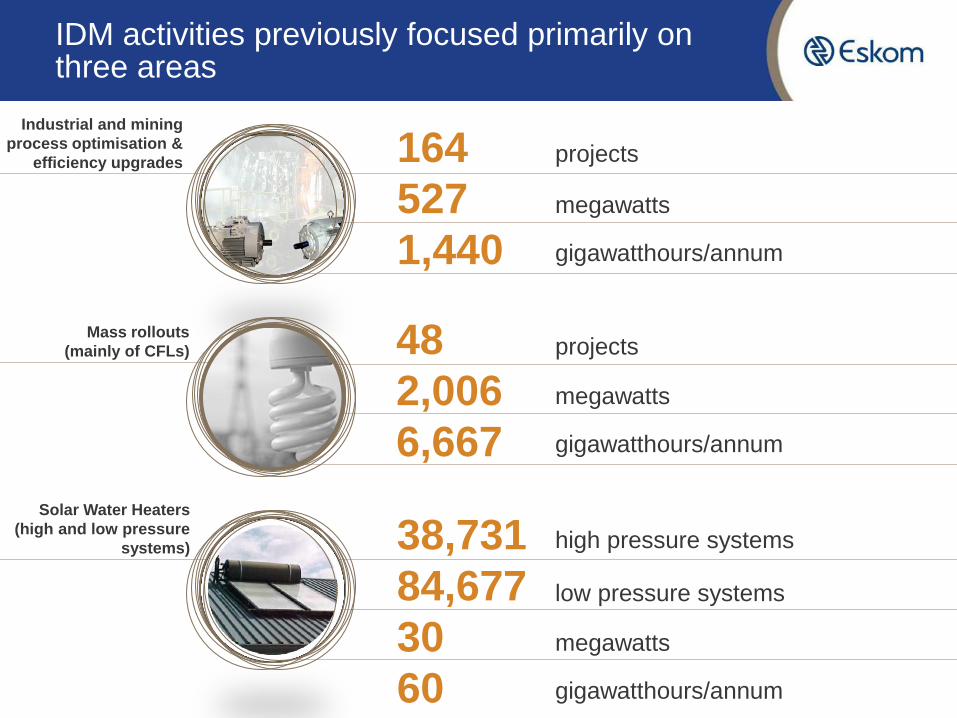
IDM activities previously focused primarily on three areas
164
527
1,440
Industrial and mining
process optimisation &
efficiency upgrades
48
2,006
6,667
38,731
84,677
30
60
Mass rollouts
(mainly of CFLs)
Solar Water Heaters
(high and low pressure
systems)
projects
megawatts
gigawatthours/annum
projects
megawatts
gigawatthours/annum
low pressure systems
megawatts
gigawatthours/annum
high pressure systems

Total Mining sector Savings = 287MW @ R613 million
Compressor Management
Demand Savings = 76MW
Eg. Cooke Mine
Pumping Demand Savings = 143MW Eg. Union Mine
Fridge Plants
Demand Savings = 35MW
Eg. Harmony Mine
Winders & VSD & Other
Demand Savings = 34MW
Eg. Bambanani Mine
Industrial and Commercial Sectors Typical energy savings projects undertaken

Residential Sector
2011/11/09 1414
(Source: Frost and Sullivan Market Analysis for Residential market 2012
P r e d o m i n a n t l y l i g h t i n g
o p p o r t u n i t y a n d c u r r e n t
( f r e e i s s u e ) S W H
p r o g r a m m e
L i m i t e d d e m a n d
m a n a g e m e n t o p p o r t u n i t y
P r e f e r r e d a p p r o a c h :
M a s s , d o o r - t o - d o o r
r o l l o u t o f a l i m i t e d ,
s t a n d a r d t e c h n o l o g y o f f e r
E x t e n s i v e l i g h t i n g p l u s
m o r e d i v e r s e r a n g e o f
t e c h n o l o g i e s .
D e m a n d m a n a g e m e n t
o p p o r t n u i t y v i a t i m e r s ( o r
s i m i l a r )
P r e f e r r e d a p p r o a c h :
I n s t a l l e r t y p e m o d e l w i t h a
s t a n d a r d p a c k a g e o f
t e c h n o l o g i e s
S i g n i f i c a n t o p p o r t u n i t y f o r
e n e r g y a n d d e m a n d
s a v i n g s i m p a c t B U T
a s t a n d a r d , f r e e i s s u e
s o l u t i o n i s l e s s s u i t a b l e
P r e f e r r e d a p p r o a c h :
R e t a i l e r m o d e l o f f e r i n g
d i s c o u n t e d p r o d u c t s ( p l u s
i n s t a l l a t i o n o f f e r )
Market segment 2(~58% of households)
Market segment 3 (~21% of households)
LSM 1 – 3(number of appliances)
Market segment 1 (~21% of households)
LSM 4 - 7(number of appliances)
LSM 8 – 10(number of appliances)
54.1 m
4.1 m
6.5 m
22.1 m
10.7 m
0.09 m
1.2 m
2.4 m
44.4 m
3.2 m
5.0 m
11.2 m
5.5 m
0.8 m
2.4
2.4 m
6.8 m
0.2 m
0.9 m
3.2 m
1.8 m
-
-
0.1 m
Eskom follows a structured approach to achieve savings in the residential sector

Residential Sector
Solar Water
Heaters
CFLs
Eskom has installed over 285,000 Solar water heating systems and 52 million CFLs
1 million
SWH target
285000

Residential Sector Residential Mass Rollout (RMR) Programme
22 Eskom supports the retrofitting of old inefficient technologies

Marketing an communications
DSM involves public awareness and drive to instil cultural change to energy efficiency

Skills Development and Localization
Eskom through its programmes supports skills development and localisation

Industry Development
Eskom supports industry development through training and industry workgroups
Student Training
SAPP Working
Groups
Schools
Programme and
ESCO roadshows
Science EXPOs

Funding Options and Technologies

IDM activities previously focused primarily on three areas
199
596
1,831
Industrial and mining
process optimisation &
efficiency upgrades
318
2,128
4,735
52 m
36,808
151,028
33
219
Mass rollouts
(mainly of CFLs)
Solar Water Heaters
(high and low pressure
systems)
projects
megawatts
gigawatthours/annum
projects
megawatts
gigawatthours/annum``
low pressure systems
megawatts
gigawatthours/annum
high pressure systems
CFLs rolled out 2004-2011
2012/05/12

IDM Funding Programmes
• New suite of funding mechanism products launched. This has been widely accepted by the market reflected in:
• Significant increase in uptake of standard offer and Standard product solutions
• Good indication that solution correctly developed for target market
• Small scale demand side renewables pilot included under Standard Offer programme
• First PV project already approved in the Western Cape
28
2010/11 2011/12 2012/13 2013/14 2014/15
No of projects forimplementation
1 18 49 57 2
0
10
20
30
40
50
60
Standard Offer uptake
2010/2011 2011/2012 2012/2013 2013/2014 2014/2015
No of projects forimplementation
1 395 2232 19 1
0
500
1000
1500
2000
2500
Standard Product uptake

Industry Development
• Stimulation of Energy Services Companies (ESCo’s) (300% increase over last 2 years)
• IDM developed commercial levers to stimulate industry
• Streamlined technology and funding approvals
• Reduced barriers to entry for smaller upcoming enterprises
• Support of new enterprises with training
29
2002/3 2003/4 2004/5 2005/6 2006/7 2007/8 2008/9 2009/10 2010/11 2011/12 2012/13 2013/14 2014/15
No of ESCo with projectsbeing implemented in year
2 1 10 12 36 50 81 40 31 104 362 75 14
0
50
100
150
200
250
300
350
400
ESCo activity

Lead by example
• As a custodian of energy, Eskom is at the forefront of energy efficiency
• Over achievement of annual targets
• Retrofits have been completed at 111 facilities
• Technologies retrofitted include lighting, HVAC, Renewables, Water heating pumps, Solar water heating systems
• PV projects with total output if 3.5GWh completed at Kendal and Lethabo Powerstations as well as Megawatt Park
• Focus on staff home and office energy efficiency education
• Savings and load management tips
• Promoting adoption of technologies
30
Solar PV at Megawatt car park
Internal Achievements
Year
Target
(GWh)
Achievement
(GWh)
2010/11 24 26.2
2011/12 25.5 44.9
2012/13
(6 mth) 20 11.5

In conclusion….

In conclusion
• Eskom sees Energy Efficiency and Demand side management as a very strong vehicle for Security of Supply
• Continuity of the current Eskom rebate programmes is essential to sustain the momentum of the current energy efficiency drive in the South Africa
• Eskom has applied to NERSA for additional funds to realise 2,557MW of demand savings in the next 6 years
• Any significant changes to the current governance and funding of energy efficiency projects will create undue risk to the security of supply in the current constrained electricity system

• Thank You