esm methods - springer static content server10.1007/s00125-016-4171...esm methods in vivo assessment...
TRANSCRIPT
1
ESM Methods
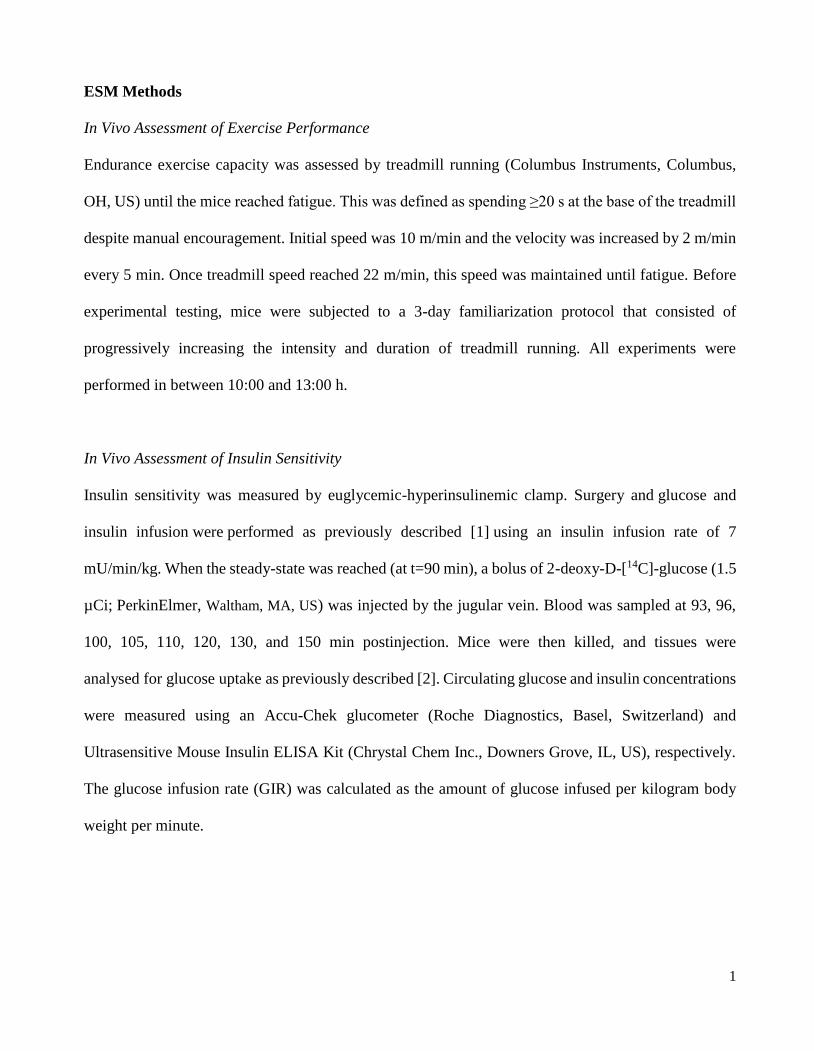
In Vivo Assessment of Exercise Performance
Endurance exercise capacity was assessed by treadmill running (Columbus Instruments, Columbus,
OH, US) until the mice reached fatigue. This was defined as spending ≥20 s at the base of the treadmill
despite manual encouragement. Initial speed was 10 m/min and the velocity was increased by 2 m/min
every 5 min. Once treadmill speed reached 22 m/min, this speed was maintained until fatigue. Before
experimental testing, mice were subjected to a 3-day familiarization protocol that consisted of
progressively increasing the intensity and duration of treadmill running. All experiments were
performed in between 10:00 and 13:00 h.
In Vivo Assessment of Insulin Sensitivity
Insulin sensitivity was measured by euglycemic-hyperinsulinemic clamp. Surgery and glucose and
insulin infusion were performed as previously described [1] using an insulin infusion rate of 7
mU/min/kg. When the steady-state was reached (at t=90 min), a bolus of 2-deoxy-D-[14C]-glucose (1.5
µCi; PerkinElmer, Waltham, MA, US) was injected by the jugular vein. Blood was sampled at 93, 96,
100, 105, 110, 120, 130, and 150 min postinjection. Mice were then killed, and tissues were
analysed for glucose uptake as previously described [2]. Circulating glucose and insulin concentrations
were measured using an Accu-Chek glucometer (Roche Diagnostics, Basel, Switzerland) and
Ultrasensitive Mouse Insulin ELISA Kit (Chrystal Chem Inc., Downers Grove, IL, US), respectively.
The glucose infusion rate (GIR) was calculated as the amount of glucose infused per kilogram body
weight per minute.
2
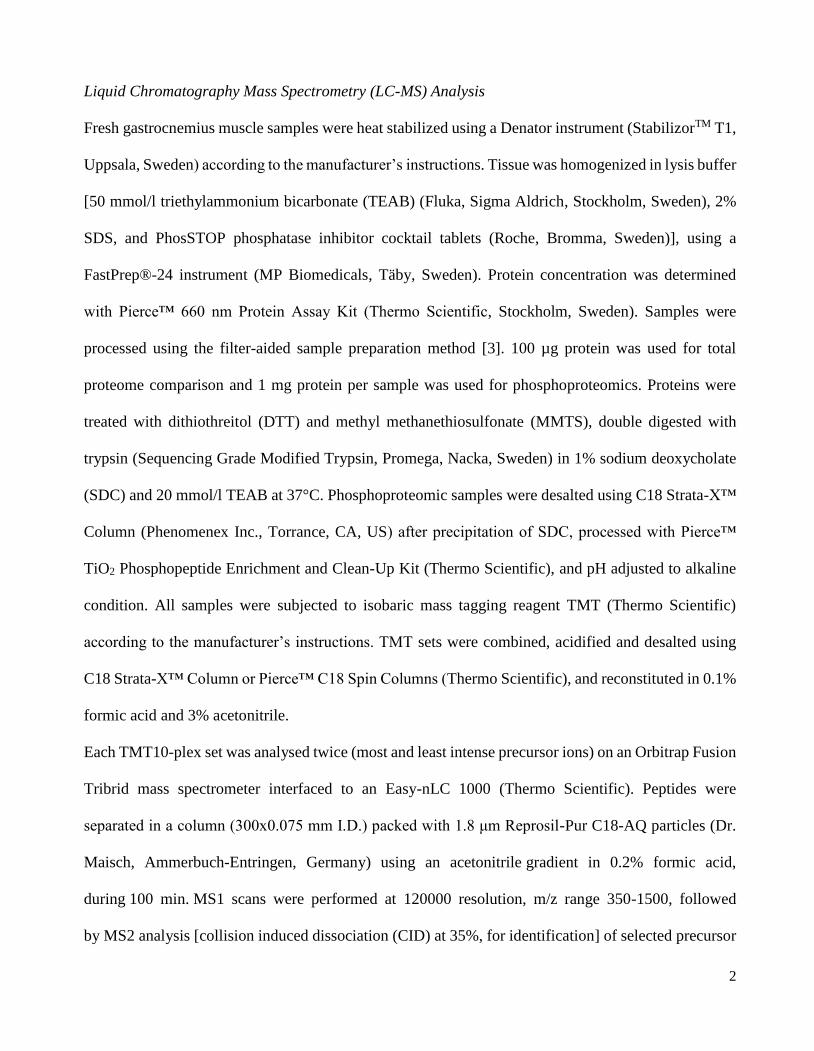
Liquid Chromatography Mass Spectrometry (LC-MS) Analysis
Fresh gastrocnemius muscle samples were heat stabilized using a Denator instrument (StabilizorTM T1,
Uppsala, Sweden) according to the manufacturer’s instructions. Tissue was homogenized in lysis buffer
[50 mmol/l triethylammonium bicarbonate (TEAB) (Fluka, Sigma Aldrich, Stockholm, Sweden), 2%
SDS, and PhosSTOP phosphatase inhibitor cocktail tablets (Roche, Bromma, Sweden)], using a
FastPrep®-24 instrument (MP Biomedicals, Täby, Sweden). Protein concentration was determined
with Pierce™ 660 nm Protein Assay Kit (Thermo Scientific, Stockholm, Sweden). Samples were
processed using the filter-aided sample preparation method [3]. 100 µg protein was used for total
proteome comparison and 1 mg protein per sample was used for phosphoproteomics. Proteins were
treated with dithiothreitol (DTT) and methyl methanethiosulfonate (MMTS), double digested with
trypsin (Sequencing Grade Modified Trypsin, Promega, Nacka, Sweden) in 1% sodium deoxycholate
(SDC) and 20 mmol/l TEAB at 37°C. Phosphoproteomic samples were desalted using C18 Strata-X™
Column (Phenomenex Inc., Torrance, CA, US) after precipitation of SDC, processed with Pierce™
TiO2 Phosphopeptide Enrichment and Clean-Up Kit (Thermo Scientific), and pH adjusted to alkaline
condition. All samples were subjected to isobaric mass tagging reagent TMT (Thermo Scientific)
according to the manufacturer’s instructions. TMT sets were combined, acidified and desalted using
C18 Strata-X™ Column or Pierce™ C18 Spin Columns (Thermo Scientific), and reconstituted in 0.1%
formic acid and 3% acetonitrile.
Each TMT10-plex set was analysed twice (most and least intense precursor ions) on an Orbitrap Fusion
Tribrid mass spectrometer interfaced to an Easy-nLC 1000 (Thermo Scientific). Peptides were
separated in a column (300x0.075 mm I.D.) packed with 1.8 μm Reprosil-Pur C18-AQ particles (Dr.
Maisch, Ammerbuch-Entringen, Germany) using an acetonitrile gradient in 0.2% formic acid,
during 100 min. MS1 scans were performed at 120000 resolution, m/z range 350-1500, followed
by MS2 analysis [collision induced dissociation (CID) at 35%, for identification] of selected precursor

3
ions and MS3 [high-energy collision induced dissociation (HCD) at 55%, for quantification] of several
MS2 fragments in parallel. Data were analysed by using Proteome Discoverer version 1.4 (Thermo
Scientific) with the Mascot search engine (Matrix Science, London, UK) using the Mus musculus
SwissProt Database (version February 2015), peptide tolerance of 5 ppm and MS/MS tolerance of 500
millimass units (mmu). Tryptic peptides were accepted with zero missed cleavage. The detected peptide
threshold was set to 1% false discovery rate by searching against a reversed database.
References
[1] Cansby E, Amrutkar M, Manneras Holm L, et al. (2013) Increased expression of STK25 leads to
impaired glucose utilization and insulin sensitivity in mice challenged with a high-fat diet. FASEB J
27: 3660-3671
[2] Burcelin R, Dolci W, Thorens B (2000) Glucose sensing by the hepatoportal sensor is GLUT2-
dependent: in vivo analysis in GLUT2-null mice. Diabetes 49: 1643-1648
[3] Wisniewski JR, Zougman A, Nagaraj N, Mann M (2009) Universal sample preparation method for
proteome analysis. Nat Methods 6: 359-362

ESM Table 1. List of antibodies used for immunofluorescence and Western blot analysis
Type Antibody name and catalogue
number
Working
dilution
Company
Primary anti-laminin 2 alpha (#ab11576) 1:1000 Abcam (Cambridge, UK)
antibody anti-actin (#sc-1616) 1:1000 Santa Cruz Biotechnology (Santa Cruz, CA, US)
anti-myosin heavy chain I
(MHCI; #BA-F8)
1:200 Developmental Studies Hybridoma Bank (Iowa
City, IA, US)
anti-myosin heavy chain IIa
(MHCIIa; #SC-71)
1:200 Developmental Studies Hybridoma Bank
anti-myosin heavy chain IIb
(MHCIIb; #BF-F3)
1:200 Developmental Studies Hybridoma Bank
anti-myosin heavy chain IIx
(MHCIIx; #6H1)
1:200 Developmental Studies Hybridoma Bank
anti-STK25 (#NBP1-32670)
anti-STK25 (YSK1; #sc-6865)
1:300 Novus Biologicals (Littleton, CO, US)
Santa Cruz Biotechnology
anti-perilipin 2 (PLIN2; #20R-
AP002)
1:1000 Fitzgerald Industries International (Concord,
MA, US)
anti-hormone sensitive lipase
(HSL; #4107)
1:1000 Cell Signaling Technology (Boston, MA, US)
anti-adipose triglyceride lipase
(ATGL; #sc-67355)
1:1000 Santa Cruz Biotechnology
Secondary
antibody
donkey anti-mouse IgM
(#715166020)
1:1000 Jackson ImmunoResearch Laboratories (West
Grove, PA, US)
donkey anti-rabbit IgG
(#A21207)
1:1000 Thermo Fisher Scientific (Waltham, MA, US)
donkey anti-goat (#sc-2020) 1:1000 Santa Cruz Biotechnology
goat anti-rabbit IgG (#7074S) 1:1000 Cell Signaling technology
rabbit anti-guinea pig IgG
(#P0141)
1:1000 Dako Agilent Technologies (Glostrup,
Denmark)
goat anti-rabbit IgG (#A11008) 1:1000 Thermo Fisher Scientific
goat anti-rat IgG (#A11007) 1:1000 Thermo Fisher Scientific
rabbit anti-mouse IgG
(#A11059)
1:1000 Thermo Fisher Scientific

ESM Table 2. Sequences of custom-designed primers (forward and reverse) and probes used for
quantitative real-time PCR
Gene Sequence (5’-3’)
Ppargc1α
Ppargc1β
Nrf1
Forward
Reverse
Probe
Forward
Reverse
Probe
Forward
Reverse
Probe
CGCAACATGCTCAAGCCA
TTAGGCCTGCAGTTCCAGAGAG
CCAAATGACCCCAAGGGTTCCCC
GTGGACGAGCTTTCACTGCTA
CAGAGCTTGCTGTTGGGGA
CAGAAGCTCCTCCTGGCCACATCC
GCTGATGGAGAGGTGGAACAA
GGCTTCTGCCAGTGATGCTA
TGACCATCCAGACGACGCAAGCA

ESM Figure 1. Schematic presentation of measurements performed in three cohorts of high-
fat-fed Stk25 transgenic and wild-type mice. EHC, euglycemic-hyperinsulinemic clamp; qRT-
PCR, quantitative real-time PCR.
High-fat diet feeding
Exercise test
EHC
Weaning
Week
4
Week
6
Week
0
Week
23
Week
24
Start of diet
Termination and
tissue collection
Histology and
immunofluorescence
Co
ho
rt
3
Co
ho
rt
2
Co
ho
rt
1
Western blot
qRT-PCR
Ex vivo assays
Proteomics
ESM Figure 1

Rel
ati
ve
pro
tein
lev
els
0
5
10
15
20
25
WT HFD TG HFD
**
††
a
MH
CI
MH
CII
aM
HC
IIx
MH
CII
bS
TK
25
b WT HFD TG HFD
cSTK25 MitoTracker Merged
ESM Figure 2. Analysis of STK25 protein in gastrocnemius skeletal muscle of high-fat-fed Stk25
transgenic and wild-type mice and primary human muscle cells. (a) Protein lysates of the red and
white part of the gastrocnemius muscle were analysed by Western blot using antibodies specific for
STK25. Protein levels were analysed by densitometry and shown as bar histograms. The level of
STK25 in the wild-type red gastrocnemius muscle is set to 1. Representative Western blot is shown.
Red bars, red part of gastrocnemius muscle; white bars, white part of gastrocnemius muscle. Data are
mean ± SEM from 6 mice per genotype. (b) Representative immunofluorescence images of
gastrocnemius muscle double-stained with antibodies for STK25, MHC type I, IIa, IIx or IIb (green),
and laminin (red). Scale bar, 50 μm. (c) Representative immunofluorescence images of primary
human muscle cells double-stained with antibodies for STK25 and MitoTracker Red; nuclei stained
with DAPI (blue). The primary human muscle cells were maintained in F-10 Nut Mix (Ham;
Gibco) including 4.5 g/l (25 mmol/l) glucose and 1% (vol./vol.) penicillin/ streptomycin (Gibco),
supplemented with 20% FBS (Gibco). The cells were differentiated for 11 days in MEM Alpha
medium (Gibco) including 1% (vol./vol.) fungizone (Gibco) and 1% (vol./vol.) penicillin/
streptomycin (Gibco), supplemented with 2% (vol./vol.) horse serum (Gibco). Scale bar, 15 μm. **p <
0.01 comparing Stk25 transgenic versus wild-type muscle. ††p < 0.01 comparing red versus white
gastrocnemius in wild-type mice. HFD, high-fat diet; TG, transgenic; WT, wild-type.
STK25
R RW WR RW W
Rela
tive S
TK
25 p
rote
in levels
R R W W
A
0
2
4
6
8
10
12
14
16
18
20
WT HFD TG HFD
Red Gastroc
White Gastroc
**"
**" **"##" ##"
R R W W WT HFD TG HFD
**
ESM Figure 2

WT HFD TG HFDA
Supplementary Figure 4
WT HFD TG HFD
Here I want to show that
LDs are bigger and can be
in contact with
mitochondria that look
healthy and ones that have
disrupted cristea. Also that
there is no change in
interaction between LDs
and mitochondria between
the genotypes.
Here I want to show that
mitochondria in TG HFD
swollen, and that these
swollen mitochondria can
display both disrupted and
healthy phenotype.
Here I want to show that
disrupted and bigger
mitochondria are present
not only in
subsarcolemmar region
(row with images above),
but also in the
intermyofibral region, in
TG HFD.
Images can be separated
into 3 panels: A, B and C
(see next slide)
a b c
d e f
g h i
ESM Figure 3. Representative electron micrographs of gastrocnemius skeletal muscle of high-
fat-fed Stk25 transgenic and wild-type mice. The cross-sections show lipid droplets (red arrows)
and mitochondria, which are swollen (red arrowhead), display disarrayed cristae and reduced
electron density of the matrix (open arrowhead), and internal vesicles (green arrowhead). Scale bar,
2 μm. HFD, high-fat diet; TG, transgenic; WT, wild-type.
ESM Figure 3

ESM Figure 4. Measurement of mtDNA copy number in gastrocnemius skeletal muscle of
high-fat-fed Stk25 transgenic and wild-type mice. Relative mtDNA copy number was calculated
as the ratio of a mitochondrial-encoded gene (COX1, forward 5′-
ACTATACTACTACTAACAGACCG-3′, reverse 5′-GGTTCTTTTTTTCCGGAGTA-3′) to a
nuclear-encoded gene (cyclophilin A, forward 5′-ACACGCCATAATGGCACTGG-3′, reverse 5′-
CAGTCTTGGCAGTGCAGAT-3′) DNA levels, determined by quantitative real-time PCR. Data are
mean ± SEM from 9-10 mice per genotype. HFD, high-fat diet; TG, transgenic; WT, wild-type.
mtD
NA
/nu
clea
r D
NA
0
0.2
0.4
0.6
WT HFD TG HFD
ESM Figure 4

Rel
ati
ve
exp
ress
ion
Rel
ati
ve
exp
ress
ion
0
0.5
1
1.5
Ppargc1a Ppargc1b Nrf1
0
0.5
1
1.5
Ppargc1a Ppargc1b Nrf1
b
Ppargc1a Ppargc1b Nrf1 Ppargc1a Ppargc1b Nrf1
ESM Figure 5. Measurement of mRNA expression of key transcriptional activators
mediating mitochondrial biogenesis in gastrocnemius skeletal muscle of high-fat-fed Stk25
transgenic and wild-type mice. Relative mRNA expression of PGC1α (Ppargc1a), PGC1β
(Ppargc1b), and Nrf1 in the red (a) and white (b) part of the gastrocnemius muscle was assessed
by quantitative real-time PCR using custom-designed primers and probes (see ESM Table 2 for
sequences). The expression level of each gene in wild-type mice is set to 1. White bars, high-fat-
fed wild-type mice; black bars, high-fat-fed transgenic mice. Data are mean ± SEM from 10-12
mice per genotype.
a
ESM Figure 5
0
0.2
0.4
0.6
0.8
Mock STK25
a
0
400
800
1200
1600
Mock Mock +
Phenformin
STK25 OE
β-O
xid
ati
on
(pm
ol
min
-1m
g p
rote
in-1
)
*
0
1
2
3
mtD
NA
/nu
clea
r D
NA
Rel
ati
ve
exp
ress
ion
b c
Mock STK25 OEStk25 Stk25
*
**
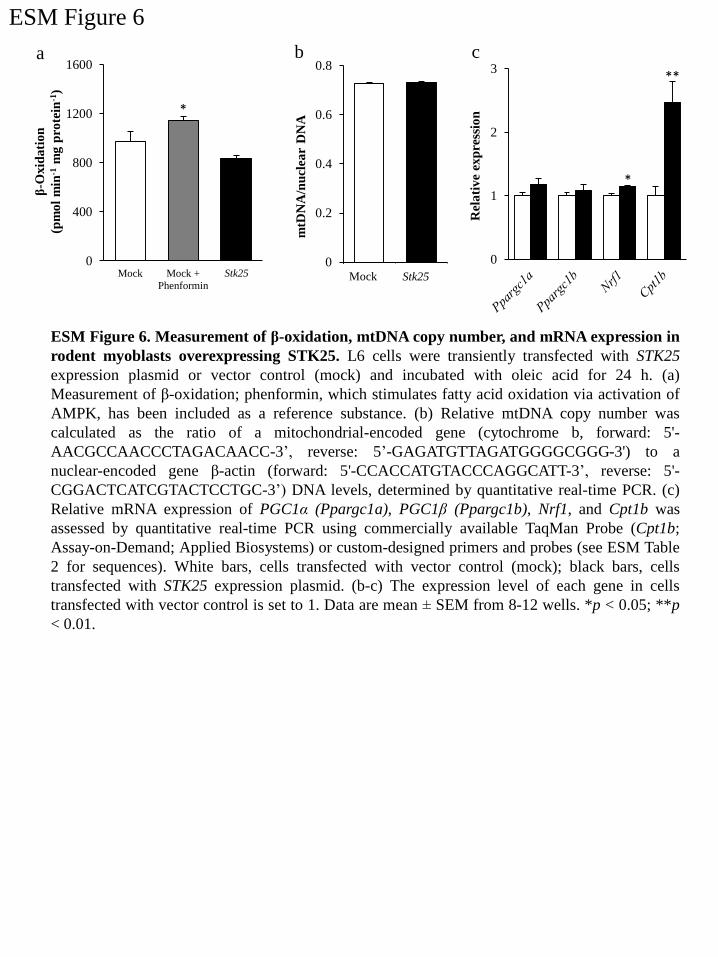
ESM Figure 6. Measurement of β-oxidation, mtDNA copy number, and mRNA expression in
rodent myoblasts overexpressing STK25. L6 cells were transiently transfected with STK25
expression plasmid or vector control (mock) and incubated with oleic acid for 24 h. (a)
Measurement of β-oxidation; phenformin, which stimulates fatty acid oxidation via activation of
AMPK, has been included as a reference substance. (b) Relative mtDNA copy number was
calculated as the ratio of a mitochondrial-encoded gene (cytochrome b, forward: 5'-
AACGCCAACCCTAGACAACC-3’, reverse: 5’-GAGATGTTAGATGGGGCGGG-3') to a
nuclear-encoded gene β-actin (forward: 5'-CCACCATGTACCCAGGCATT-3’, reverse: 5'-
CGGACTCATCGTACTCCTGC-3’) DNA levels, determined by quantitative real-time PCR. (c)
Relative mRNA expression of PGC1α (Ppargc1a), PGC1β (Ppargc1b), Nrf1, and Cpt1b was
assessed by quantitative real-time PCR using commercially available TaqMan Probe (Cpt1b;
Assay-on-Demand; Applied Biosystems) or custom-designed primers and probes (see ESM Table
2 for sequences). White bars, cells transfected with vector control (mock); black bars, cells
transfected with STK25 expression plasmid. (b-c) The expression level of each gene in cells
transfected with vector control is set to 1. Data are mean ± SEM from 8-12 wells. *p < 0.05; **p
< 0.01.
ESM Figure 6

ESM Figure 7. Acylcarnitine levels in gastrocnemius skeletal muscle of high-fat-fed Stk25
transgenic and wild-type mice. Acylcarnitines were extracted in methanol using a Precellys 24
instrument (Bertin Technologies, Montigny-le-Bretonneux, France) and analysed using hydrophilic
interaction liquid chromatography tandem mass spectrometry (HILIC-MS/MS). White bars, high-fat-fed
wild-type mice; black bars, high-fat-fed transgenic mice. Data are mean ± SEM from 12 mice per
genotype.
Mu
scle
acy
lca
rnit
ines
(pm
ol/
mg
tis
sue)
0
5
10
15
20
C3 C4 C5 C6 C8 C10 C14 C16 C18
Acylcarnitine species
0
40
80
120
160
C2
ESM Figure 7

0
500
1000
1500
2000
Basal Clamp
0
5
10
15
0
20
40
60
80
100
0 20 40 60 80 100 120 140 160
Pla
sma in
suli
n (
pm
ol/
l)
GIR
(m
g k
g-1
min
-1)
Blo
od
glu
cose
(mm
ol/l)
Time (min)
a b
ESM Figure 8. Plasma insulin and glucose level as well as glucose infusion rate during an
euglycemic-hyperinsulinemic clamp in high-fat-fed Stk25 transgenic and wild-type mice.
Plasma insulin concentration (a), glucose infusion rate and blood glucose concentration (b)
determined during an euglycemic-hyperinsulinemic clamp. For (a), white bars, high-fat-fed
wild-type mice; black bars, high-fat-fed transgenic mice; for (b), white rhombs, glucose
infusion rate in high-fat-fed wild-type mice; black rhombs, glucose infusion rate in high-fat-fed
transgenic mice; white triangles, glucose levels in high-fat-fed wild-type mice; black triangles,
glucose levels in high-fat-fed transgenic mice. Data are mean ± SEM from 8 mice per
genotype. GIR, glucose infusion rate.
ESM Figure 8

Rel
ati
ve
exp
ress
ion
ESM Figure 9. Measurement of mRNA and protein levels of key lipases and lipid droplet
binding proteins in gastrocnemius skeletal muscle of high-fat-fed Stk25 transgenic and wild-
type mice. (a) Relative mRNA expression of Atgl, Hsl, Plin2, and Plin3 was assessed by
quantitative real-time PCR using commercially available TaqMan Probes (Assay-on-Demand;
Applied Biosystems). The expression level of each gene in wild-type mice is set to 1. White bars,
high-fat-fed wild-type mice; black bars, high-fat-fed transgenic mice. (b) Protein lysates were
analysed by Western blot using antibodies specific for ATGL, HSL, and PLIN2. Protein levels
were analysed by densitometry and shown as bar histograms. The level of each protein in wild-
type mice is set to 1. Representative Western blot is shown. Data are mean ± SEM from 9-10
mice per genotype. HFD, high-fat diet; TG, transgenic; WT, wild-type.
0
1
2
WT HFD TG HFD
Rel
ati
ve
PL
IN2 p
rote
in l
evel
PLIN2
WT HFD TG HFD
0
1
2
WT HFD TG HFD
Rel
ati
ve
HS
L p
rote
in l
evel
HSL
WT HFD TG HFD
ATGL
WT HFD TG HFD
0
1
2
WT HFD TG HFD
Rel
ati
ve
AT
GL
pro
tein
lev
el
a
b
0
0.4
0.8
1.2
1.6
ATGL HSL Plin 2 Plin 3Atgl Hsl Plin2 Plin3
ESM Figure 9

ESM Figure 10. Assessment of lipid accumulation and fibrosis in gastrocnemius skeletal
muscle of chow-fed Stk25 transgenic and wild-type mice. (a) Measurement of triacylglycerol
levels. (b) Quantification of hydroxyproline content. Data are mean ± SEM from 7-8 mice per
genotype. CD, chow diet; TAG, triacylglycerol; TG, transgenic; WT, wild-type.
b
Hy
dro
xy
pro
lin
eco
nte
nt
(µg
/mg
of
tiss
ue)
WT CD TG CD
0
0.1
0.2
0.3
0.4a
0
1
2
3
WT CD TG CD
TA
G
(µg
/mg
of
tiss
ue)
ESM Figure 10