esophageal mapping and temperature regulation for catheter
TRANSCRIPT

Esophageal Mapping and Temperature Regulation for Catheter Ablation
by
Morgan A. Jawitz
Madison J. Keith
Sarah L. Sanders
Project Advisor: Dr. Christopher Porterfield
Instructor’s Comments:
Instructor’s Grade: ___________
Date: ______________________

1
Esophageal Mapping and Temperature Regulation for Catheter Ablation
by
Morgan A. Jawitz
Madison J. Keith
Sarah L. Sanders
Biomedical Engineering Department
California Polytechnic State University
San Luis Obispo
2019

2
Statement of Disclaimer
Since this project is a result of a class assignment, it has been graded and accepted as
fulfillment of the course requirements. Acceptance does not imply technical accuracy or
reliability. Any use of information in this report is done at the risk of the user. These risks may
include catastrophic failure of the device or infringement of patent or copyright laws. California
Polytechnic State University at San Luis Obispo and its staff cannot be held liable for any use or
misuse of the project.

3
Table of Contents
1.0 Executive Summary
2.0 Introduction and Background
3.0 Customer Requirements and Design Specifications
3.1 IFU
3.2 Product Design Specifications
3.3 House of Quality
4.0 Stage Gate Process
4.1 Concept Review
4.2 Design Freeze
4.3 Design Review
5.0 Description of Final Prototype Design
5.1 Overview
5.2 Design Justification
5.3 Analysis
5.4 Cost Breakdown
5.5 Safety Considerations
6.0 Prototype Development
6.1 Model Analyses
6.2 Evolution of Prototypes
6.3 Manufacturing Process
6.4 Divergence Between Final Design and Final Functional Prototype
7.0 IQ/OQ/PQ
7.1 DOE
7.2 Verification and Validation
8.0 Conclusions and Recommendations
9.0 Acknowledgments
10.0 Appendices
10.1 Appendix A: References
10.2 Appendix B: Project Plan
10.3 Appendix C: CAD Drawings
10.4 Appendix D: FMEA, Hazard & Risk Assessment
10.5 Appendix E: Pugh Chart
10.6 Appendix F: Vendor Information, Specifications, and Data Sheets
10.7 Appendix G: Budget
10.8 Appendix H: DHF
10.9 Appendix I: DOE
10.10 Appendix J: Applicable Code of Federal Regulations
10.11 Appendix K: Heat Gun Validation Raw Data
10.12 Appendix L: Temperature Accuracy Raw Data
10.13 Appendix M: Temperature Range Raw Data
10.14 Appendix N: Temperature Interpolation Raw Data
10.15 Appendix O: Code

4
1.0 Executive Summary
The purpose of this document is to provide a development summary for a
proposed esophageal temperature mapping device used during catheter ablation.
Catheter ablation therapy is performed in the left atria with hot or cold materials to create
scar tissue to treat atrial fibrillation. However, utilized temperatures and absorbed
energies from the catheter can cause undesired esophageal damage. Therefore, this
medical device is designed to monitor esophageal temperature and map its location
during catheter ablation. If dangerous temperatures are reached, the device will alarm
the surgeon.
This document provides an in-depth overview of the esophageal temperature
mapping device’s development and contains seven sections: introduction and
background, customer requirements and design specifications, stage gate process,
description of final prototype design, prototype development, IQ/OQ/PQ, and
conclusions and recommendations.
2.0 Introduction and Background
Catheter Ablation Therapy Background
Catheter ablation therapy is performed by cardiologists to treat heart arrhythmias,
specifically atrial fibrillation. An arrhythmia is a cardiac problem where the heart beats
too fast, too slow, or with an irregular rhythm. Atrial fibrillation is rapid and irregular
beating of the atria and is often treated with catheter ablation therapy.
Catheter ablation therapy can utilize hot temperatures, known as radiofrequency
catheter ablation, or cold temperatures, known as cryoablation catheter ablation, in the
left atrium [1]. In both cases, catheter ablation is performed to create scar tissue in
specific areas of the heart to prevent abnormal electrical signals from moving through
one’s heart [2]. The goal of the procedure is to prevent the propagation of the rapid
electrical signal throughout the heart, allowing it to return to a normal beating pattern.
Radiofrequency catheter ablation uses a catheter to “emit high frequency radio waves,”
which are hot in temperature, to create lesions on the abnormal atrial tissue [1].
Cryoablation procedures pass pressurized refrigerant through a catheter to freeze the
abnormal tissue and electrical pathways of a particular atrial location [1].
Catheter Ablation Therapy Literature and Issue
The issue that arises with catheter ablation therapy involves the close proximity
of the esophagus and the left atria. The mean distance “between the anterior wall of the
esophagus and the endocardium [is] 2.6 +/- 0.8 mm [4].” Since there is only a small flap
of tissue that separates the left atria from the esophagus, the extreme temperatures
experienced during either procedure can cause irreversible damage to the esophagus,
often known as left atrial esophageal fistula [3, 4, 7]. Esophageal damage can be difficult
to diagnose, but can result in left atrial swelling [3, 7]. Harsh temperature changes

5
experienced in catheter ablation therapy can also result in transmural injury,
periesophageal nerve damage, and pulmonary vein damage [5, 6]. Figure 2.1 displays
the temperature issues of catheter ablation therapy due to esophageal anatomical
location. Anatomical positioning of the esophagus and thickness of the left atrial wall
varies immensely between patients, so tracking esophageal temperature during catheter
ablation therapy is critical. Extreme esophagus temperature is an issue experienced by
cardiologists who perform catheter ablation, so cardiologists are the desired customer
for the following proposed medical device. Figure 2.1. Left atria and esophagus anatomical positioning [5].
Current Medical Devices
Two types of medical devices currently exist to assist in esophageal temperature
monitoring during catheter ablation; one type is a single-tip temperature probe that can
be inserted into the esophagus and the second type utilizes internal bodily mapping
technologies to assist in a variety of surgical procedures. However, our aim is to
integrate temperature monitoring and mapping into a single device. Table I displays
current devices on the market. Most devices are capable of either measuring
temperatures or mapping the esophagus [8, 9, 10, 11]. Circa Scientific’s medical device
Circa-S-Cath combines temperature and esophageal mapping, but their device follows
an S-shape [12]. This allows the device to only cover two-dimensions of the esophagus
(either left and right or front and back depending on how it is positioned), while the
device we propose covers all three-dimensions (left and right in combination with front
and back). This device also only produces bar graphs to visually depict temperature, not
a three-dimensional map. Furthermore, there is no current product on the market that
advertises its ability to interface with ablation devices and deliver a power on/off signal
when dangerous temperatures are reached within the esophagus. On average, 44,400
catheter ablation procedures are performed annually, so with an esophageal
temperature mapping device costing $1500, the anticipated total available market
generates $66.6 million [4].
Table I: Current Devices on the Market
6
Name Carto Soundstar Catheter
Esophageal Stethoscope
Mon-a-therm Stethoscope
INTELLAMAP ORION
Circa-S-Cath
Company Biosense-Webster Medline Medtronic Boston Scientific Circa Scientific
Use Mapping Temperature Monitoring
Temperature Monitoring
Mapping Temperature and Mapping
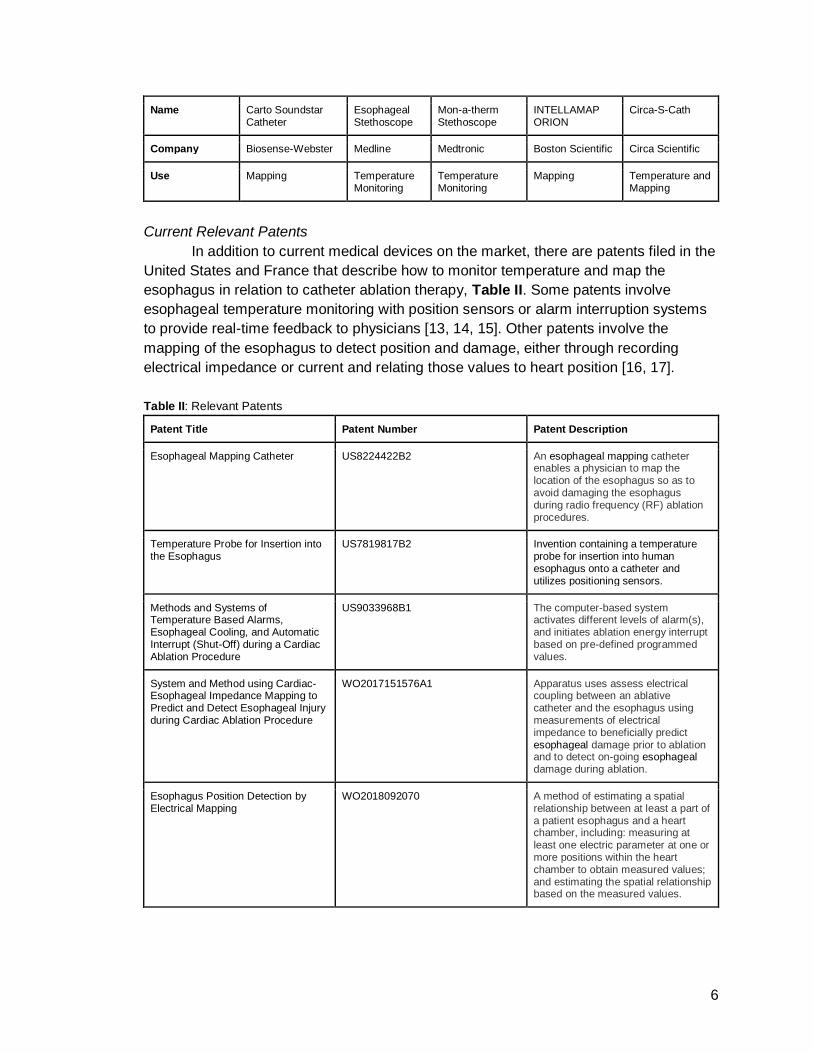
Current Relevant Patents
In addition to current medical devices on the market, there are patents filed in the
United States and France that describe how to monitor temperature and map the
esophagus in relation to catheter ablation therapy, Table II. Some patents involve
esophageal temperature monitoring with position sensors or alarm interruption systems
to provide real-time feedback to physicians [13, 14, 15]. Other patents involve the
mapping of the esophagus to detect position and damage, either through recording
electrical impedance or current and relating those values to heart position [16, 17].
Table II: Relevant Patents
Patent Title Patent Number Patent Description
Esophageal Mapping Catheter US8224422B2 An esophageal mapping catheter enables a physician to map the location of the esophagus so as to avoid damaging the esophagus during radio frequency (RF) ablation procedures.
Temperature Probe for Insertion into the Esophagus
US7819817B2 Invention containing a temperature probe for insertion into human esophagus onto a catheter and utilizes positioning sensors.
Methods and Systems of Temperature Based Alarms, Esophageal Cooling, and Automatic Interrupt (Shut-Off) during a Cardiac Ablation Procedure
US9033968B1 The computer-based system activates different levels of alarm(s), and initiates ablation energy interrupt based on pre-defined programmed values.
System and Method using Cardiac-Esophageal Impedance Mapping to Predict and Detect Esophageal Injury during Cardiac Ablation Procedure
WO2017151576A1 Apparatus uses assess electrical coupling between an ablative catheter and the esophagus using measurements of electrical impedance to beneficially predict esophageal damage prior to ablation and to detect on-going esophageal damage during ablation.
Esophagus Position Detection by Electrical Mapping
WO2018092070 A method of estimating a spatial relationship between at least a part of a patient esophagus and a heart chamber, including: measuring at least one electric parameter at one or more positions within the heart chamber to obtain measured values; and estimating the spatial relationship based on the measured values.

7
Medical Device Codes, Standards, and Regulations
It is predicted that our esophageal temperature monitoring and mapping device
for catheter ablation therapy will be a class II medical device. The device will be filed
under 510(k) requirements and will demonstrate substantial equivalence to Circa
Scientific’s Circa-S-Cath [18].
Applicable FDA Code of Federal Regulations can be read in Appendix J. Some
CFR’s of note from the list include Quality System Regulation (CFR 820), Medical
Device Tracking Requirements (CFR 821), Postmarket Surveillance (CFR 822), Medical
Device Classification Procedures (CFR 860), Procedures for Performance Standards
Development (CFR 861), Cardiovascular Devices (CFR 870), and Performance
Standards for Electronic Products: General (CFR 1010) [19].
Applicable ISO standards include ISO 9001 for Quality Management, ISO 13485
for Medical Device Manufacturing Quality Management, ISO 18001 for Medical Device
Risk Mitigation, and ISO 10993 Medical Device Biocompatibility [20].
3.0 Customer Requirements and Design Specifications
3.1 IFU
The Esophageal Temperature Mapping Device is a single-use, minimally-invasive, small digital temperature monitoring device to regulate esophageal internal temperature during catheter ablation procedures. The esophageal probe contains small bead glass thermistors that will send electrical signals to an ADC and ultimately to a Raspberry Pi.
The Raspberry Pi will generate a 3-dimensional cylindrical temperature map from each thermistor temperature signal, interpolating the temperatures in between each sensor. The map will also contain a colored scale, indicating the regions of the esophagus experiencing the harshest temperatures.
Finally, our system will contain an alarm system to the surgeon. If a temperature above 38 °C or below 20 °C is reached, the temperature reading will turn red or blue respectively. This allows the surgeon to determine the next course of action for the catheter ablation procedure and evaluate the region of possible esophageal damage.
The goal of this device is to minimize esophageal tissue damage due to temperature changes during catheter ablation procedures; therefore, it could potentially be implemented in any catheter ablation procedure.
3.2 Product Design Specifications
The current influence driving the design of the device are the customer
requirements from Dr. Christopher Porterfield, a local San Luis Obispo cardiac
electrophysiologist. Dr. Porterfield’s requirements were developed from experience in

8
the O.R. performing catheter ablation on an extensive number of patients. The
requirements he has submitted are all intended to enhance doctor visualization of
esophageal temperatures, the ease of use during the procedure, and limiting the risk of
esophageal damage. These requirements were then converted into engineering metrics
to better the design and validate the proposed device. Table III outlines the product
design specifications to be used for validation of the product. The radius of curvature
specification indicates the flexibility of our probe, which must fit through the laryngeal
mask airway (LMA) applied by the anesthesiologist.
Table III: Product Design Specifications.
Engineering Characteristic Specification
Esophageal Probe Diameter 6 mm ± 0.5 mm
Vertical Distance between Thermistors 15 mm ± 0.5 mm
Rotation between Thermistors 90° ± 5°
Thermistor Temperature Range 18-40°C (safe between 20°C-38°C)
Thermistor Temperature Accuracy ± 1°C
Temperature Interpolation Accuracy ± 1°C
Radius of Curvature 52.7 mm ± 2 mm
3.3 House of Quality
The House of Quality describes the various design aspects necessary to ensure
our device aligns with consumer needs. The completion of this process enabled the
prioritization of device characteristics that align with our product’s success. Included in
the house of quality are our customer requirements, engineering characteristics,
engineering characteristics importance rankings, competition comparisons, and category
relationships.

9
Table IV: Customer Requirements.
Comply with current catheter ablation equipment
Accurate temperature measurements
Generates temperature esophagus map
Terminates Ablation Power at Dangerous Temperatures
Bio-compatible
One-time use
Cost
Room one of our House of Quality, depicted in Table IV, describes the criteria our device must meet in order to satisfy our customer. Our customer is a cardiac surgeon, particularly a cardiac electrophysiologist, who performs cardiac catheter ablation. Therefore, our primary concerns would be in regard to our device’s ability to interface with current procedural equipment, its biocompatibility, and its accuracy when measuring temperature along the esophagus. Generation of a real-time, three-dimensional temperature map is important as this function primarily sets our device ahead of those that exist on the market. The inclusion of an alarm system, such as corresponding color changes to dangerous temperatures, is critical for communication with the surgeon during the procedure.
Table V: Engineering Characteristics.
Engineering Characteristic Units
Esophageal Probe Diameter mm
Radius of Curvature mm
Thermistor Temperature Range °C
Thermistor Temperature Accuracy °C
Interpolation Accuracy °C
Vertical Distance between Thermistors mm
Rotation between Thermistors ° of rotation
Esophageal Map Generation Cylindrical shape
Color Change in Danger Zones Red, black, blue
Manufacturing Cost $
Room two of our House of Quality, provided as Table V, provides our
engineering specifications and their associated units. We decided to include such

10
characteristics as esophageal probe diameter, radius of curvature, and thermistor
temperature accuracy and measuring range. By cataloging each of the quantifiable
device factors that could be tested, we can guarantee that those considered critical are
developed to competitive standards.
Figure 3.3.1. Customer requirements and engineering characteristics relationships.
Figure 3.3.1 describes room four of our House of Quality. This section relates
customer requirements to engineering characteristics and identifies the strength of the relationship between each pair. We were then able to multiply the number correlating to the strength of relationship between customer requirements and engineering characteristics by the importance weight factor assigned to the customer requirements. Finally, we ranked each engineering characteristic based on the magnitude of their weight factor. Room five, shown in Table VI, lists the importance ranking for each engineering metric. Based on our calculations, thermistor temperature accuracy, interpolation accuracy, color change at dangerous temperatures, and thermistor temperature range are the most significant engineering metrics for our team to focus on.

11
Table VI. Engineering Characteristic Ranking.
Engineering Characteristic Importance Ranking
Esophageal Probe Diameter 9
Radius of Curvature 8
Thermistor Temperature Range 4
Thermistor Temperature Accuracy 1
Interpolation Accuracy 1
Vertical Distance between Thermistors 6
Rotation between Thermistors 6
Esophageal Map Generation 5
Color Change in Danger Zones 3
Manufacturing Cost 10
Room six, presented in Table VII, evaluates our device and the competitive
devices on market against our consumer requirements. We used a scale of 1-5, with 5 being the most desirable and 1 being the least. Based on our comparison, our device best complies with customer requirements when analyzed against the competition.
Table VII. Competitive Advantage Matrix.

12
4.0 Stage Gate Process
4.1 Concept Review
In order to create our designs, we shadowed multiple
catheter ablation therapies performed by Dr. Porterfield to
observe current temperature monitoring adjacent to the
procedure in action. We learned that the device must be
deployable by the anesthesiologist and travel through a
Laryngeal Mask Airway (LMA) to sit in the esophagus,
Figure 4.1.1. Additionally, the device must have a length of
at least 3 inches in anterior esophagus articulation to cover
all catheter locations experienced in the left atrium during
the procedure. Figure 4.1.1. LMA visual.
As an overview of the device, it will include three parts. The first part includes the
esophageal probe that sends temperature input from thermistors to a Raspberry Pi. The
second part includes the Raspberry Pi receiving temperature input and building a 3D
esophageal, cylindrical shaped map. Finally, the last part includes a color change in
thermistor point values, along with an interpolated color map, to alarm the surgeon at
dangerous temperatures (less than 20°C or greater than 38°C). Figure 4.1.2 provides a
circuit diagram overview for how each part of the device system integrates.
For the programming of the Raspberry Pi, its collection software will be organized
into three main functions. First, the Raspberry Pi will be coded to collect the thermistor
voltage readings, which will then be written to a temporary file to be converted into
resistance and interpolated into temperature values. Finally, the temperature values for
each thermistor will be brought into the mapping function where the values will be plotted
in a 3-D space with a corresponding color map. These aspects are all visually
summarized in Figure 4.1.3.
Figure 4.1.2. Summary circuit diagram.

13
Figure 4.1.3. Summary software diagram.
In regard to the design review process, three designs were proposed to
determine which would fit best for the esophageal probe. Figure 4.1.4A displays the first
esophageal probe design, Design A, which follows a helical shape and aims for
esophageal articulation over all surfaces. The probe will be shape set into the helical
shape, ideally constructed out of nitinol, with single-point thermistors placed along the
helical pattern of the probe.
The second design, Design B, involves a small, cylindrical shape esophageal
temperature monitoring and mapping probe. The design will include single glass-bead
thermistors following a ring-shaped pattern, spaced apart vertically by 10 m. Figure
4.1.4B, displays a SOLIDWORKS rendering of Design B.
The last design, Design C, will not include a physical prototype and instead be an
entirely software-based approach to modeling and predicting heat transfer from the
ablating catheter in the left atrium to the esophageal anterior wall. CT scans will be used
to gather initial geometries of the heart and esophagus. From there, real time
measurements of the ablation catheter could be used to predict the heat transfer into the
esophagus utilizing the heat transfer equation and varying the heat transfer coefficient. If
dangerous temperatures are reached, the software would warn the surgeon.
Figure 4.1.4A: Design A.
Figure 4.1.4B: Design B.
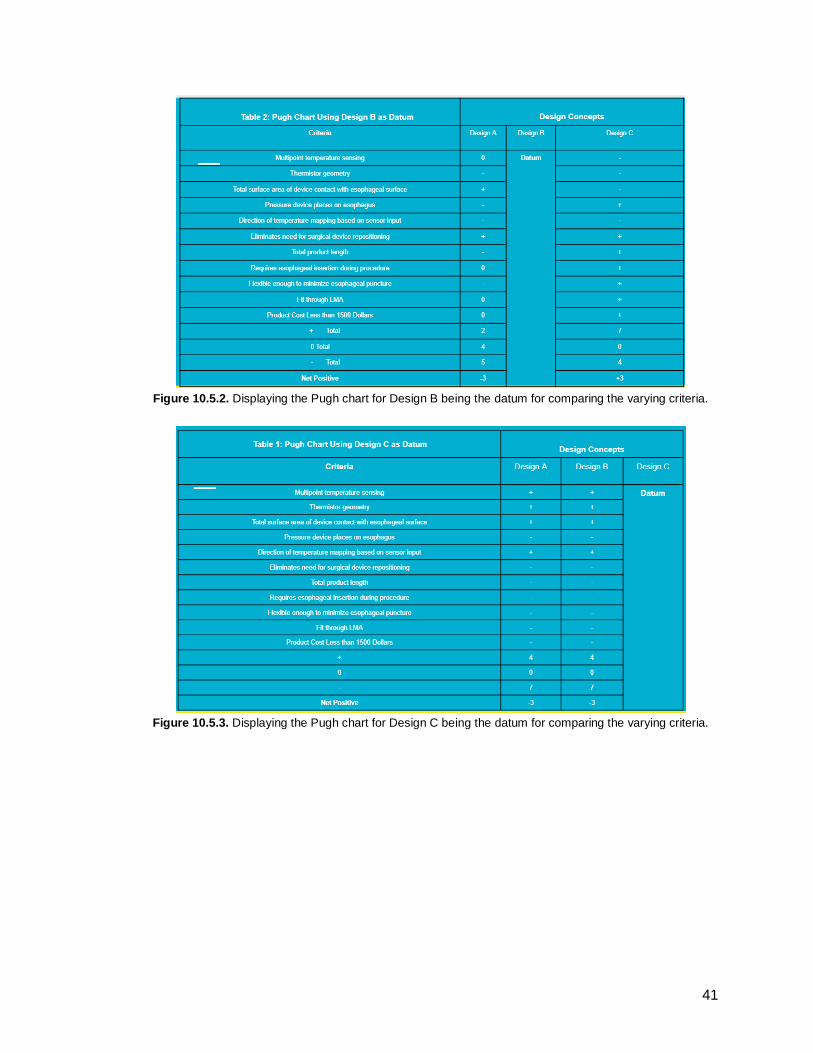
Appendix H displays the Pugh Chart for Designs A, B, and C each as datums.
The criteria for design evaluation include the engineering characteristics from Room 4 of
the house of quality. The Pugh Chart, using Design A as the datum, results in a net

14
positive (Number of pluses - Number of minuses) of +4 for Design B and +3 for Design
C. Using design B as datum, Design A receives a net positive of -3 and Design C
receives a net positive of +3. Finally, using Design C as datum, Designs A and B both
received net positive scores of -3.
4.2 Design Freeze
Figure 4.2.1: Rendering of the design freeze for the temperature-sensing section of the probe body. The rest of the
body includes non-modified tubing to house the wiring and connect to the circuit board.
Figure 4.2.2: The schematic for the electrical hardware to interpret and transmit the thermistor signal to the Raspberry Pi. The schematic displays the use of voltage dividers to interpret the change in resistance change caused
by the temperature change in the esophagus.

15
4.3 Design Review
Ultimately, the design front-runner is Design B, the cylindrical-shaped
esophageal probe. Design C was eliminated because physicians insisted upon a
physical device for each surgical procedure. Between Designs A and B, Design B
scored higher in its net positive scores in the Pugh Chart. Design B appeals to
the customer requirements and engineering specifications because it places little
pressure on the esophagus by maintaining its cylindrical shape. Additionally, its
cylindrical shape allows for the probe to fit through the LMA via anesthesiologist
delivery. This design generates a maximum surface area contact with the
anterior esophageal surface in comparison to the spiral shape in Design A.
Finally, the design utilizes single-bead thermistors to generate point
temperatures in the x-direction.
The software will generate a three-dimensional map in the shape of a
cylinder with the same dimensions of the esophageal probe. The cylinder will
contain 8 scatter points representing the x, y, z location of each thermistor. Each
point will have a temperature displayed, representing the current esophageal
temperature and updated every 1 second. The cylinder will also be plotted with a
color map to interpolate the temperature between points based off a color scale.
The final aspect to the software design will include a visual alarm that will alert
the surgeon if temperatures above 40 °C (red color) or below 20 °C (blue color)
are recorded. All safe temperatures will be black. All software will be coded in
Python 3 utilizing special libraries such as Matplotlib, Numpy, Circuit Python,
Scipy and adafruit.MCP3XXX for calculations and display functions.
The electrical hardware for the final Design includes a Raspberry Pi as
the main processing unit, an ADC for converting the analog signal of the
thermistors to a digital signal, and 8 thermistors for reading temperatures.
Various electrical components, such as resistors and wires, are included. For
prototyping purposes, the circuit will be constructed on a breadboard.
5.0 Description of Final Prototype
5.1 Overview
We decided to pursue a second iteration of our design, as it allows for a
simplified MPI and provides a more cohesive product overall. 8 thermistors were
oriented in a helical design along the first 105 mm of the probe body. Thermistors
were spaced 15 mm longitudinally, at a 90° rotation clockwise from each
previous thermistor. To hold the thermistors in this set position, a 105 mm fixture
split into two halves was 3D printed with the thermistor holes already designed
into the body as seen in Figure 5.1.1. Thermistors were then epoxied into their
specified holes and their wires threaded up through the remainder of the printed

16
tube. The two halves were then epoxied to one another, and the entire device,
along with the wires, was encapsulated in heat shrink. Additionally, the
breadboard circuit proved to be an excellent tool for testing the circuit, but a
custom PCB was designed and implemented into the final electrical prototype for
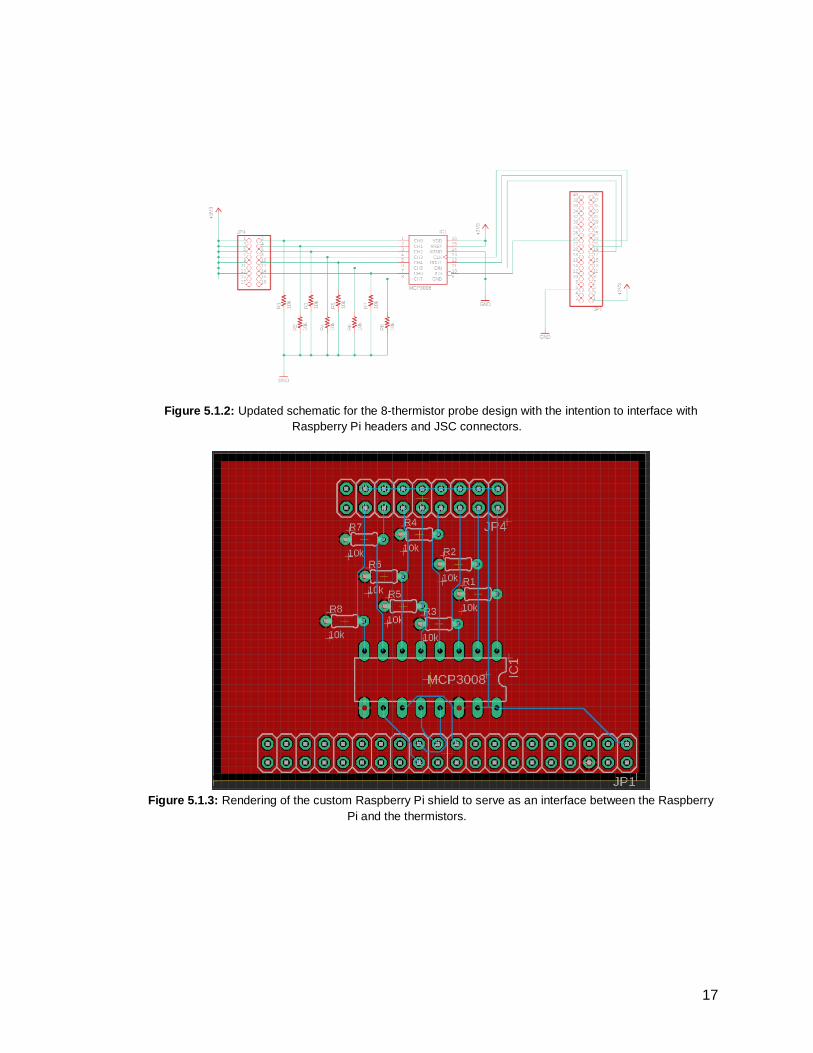
ease of use, Figure 5.1.2 and Figure 5.1.3. Finally, the software was written in
Python 3 and the Matplotlib, Numpy, Scipy, Circuit Python and MCP3XXX
libraries were utilized for calculations, visualization, matrix mathematics and
interfacing between the Raspberry Pi and the thermistors. An up-to-date
repository of the code can be found here. The code used during the time of
publishing this report can be viewed in Appendix O.
Figure 5.1.1A: Assembled rendering of the probe body
housing 8 thermistors.
Figure 5.1.1B: Two halves of the probe body adjacent
to each other.
17
Figure 5.1.2: Updated schematic for the 8-thermistor probe design with the intention to interface with
Raspberry Pi headers and JSC connectors.
Figure 5.1.3: Rendering of the custom Raspberry Pi shield to serve as an interface between the Raspberry
Pi and the thermistors.

18
5.2 Design Justification
We decided the helical orientation of the thermistors was important to
optimize the esophageal tissue that articulates with the probe’s thermistors
because it ensures at least two are in contact with the esophageal wall at all
times. This allows for a more accurate temperature to be mapped. The 3D
printed portion of the probe provided a rigid, mostly enclosed section to support
the thermistors, while the wiring harness has been encapsulated in heat shrink to
provide the flexibility, length, and protection from the environment that is
advantageous for probe movement through an LMA. The number of thermistors
were decreased from 16 to 8 to simplify the device, minimize cost, and reduce
the housing size. Additionally, the PCB circuit board, instead of a breadboard
circuit, guarantees stronger connections and easier assembly. It allows the end
user to be more mobile with the device and decreases the amount of effort to
construct the electrical hardware. For the software, Python 3 was chosen due to
its ease of use, robustness across platforms, and broad range of resources
available for the language. The Matplotlib library was used due its open source
nature and its capability to plot in 3-dimensions with updated data.
5.3 Analysis
The chosen design was successfully implemented as it meets all design
requirements set by Dr. Porterfield. Its diameter of 0.7 mm is smaller than the
esophageal access tube in the LMA and a comparable diameter to the current
single-temperature probe. Therefore, with lubricant during the procedure, it will fit
through the LMA when deployed by the anesthesiologist. Additionally, the total
vertical height of tissue measured by the thermistors is 105 mm (> 4 inches),
greater than the need to capture 3 inches of the esophagus. Finally, our design
incorporates thermistors on all four quadrants of the cylindrical probe, ensuring
that at least two thermistors will be fully articulating with the esophagus during
catheter ablation. This removes much of the variability associated with probe
insertion into the esophagus.
5.4 Cost Breakdown
Table VIII: Manufacturing Cost Breakdown.
3D Print of Probe Body in PLA $0.30
Loctite Medical-Grade Epoxy $0.97
30-gauge red wire $4.86
30-gauge black wire $4.86
Thermistors $25.36
MCP3008 ADC $7.50

19
Raspberry Pi Model B+ $35.00
PCB $13.20
PCB Headers $6.00
Heat Shrink Tubing $2.37
Heat Shrink Tip $1.22
Using the final MPI, the total cost of manufacturing per device is $101.64.
5.5 Safety Considerations
Since our device is a class II special consideration, the potential safety and
hazards were analyzed. These hazards included the risk of damage to the device during
surgery due to misuse, exposure to a corrosive environment, or misinterpretation of the
device output. Other safety considerations include the safety of the patient and the
surgeon including an electrical shock or possible radiation exposure. A full hazards and
risks assessment can be seen in Appendix D.
6.0 Prototype Development
6.1 Model Analysis
The design we chose to pursue involves a small, cylindrically shaped,
esophageal temperature monitoring and mapping catheter. The design will include single
glass-bead thermistors following helical shaped pattern with thermistors separated by a
z-height of 15 mm.
We selected this design because it provides the most accurate temperature
readings while minimizing the number of components required. This design allows for
maximum probe articulation with the anterior surface of the esophagus, placing little
pressure on the esophagus by maintaining its cylindrical shape. Additionally, this design
possesses the geometries necessary to fit through the LMA in the anesthesiologist’s
delivery system. The probe data generates a three-dimensional temperature map of the
esophagus on a monitor display to allow the surgeon full procedural visualization.
Finally, the incorporation of a color-coded alarm system will further the communication
between surgeon and device to decrease the risk of esophageal damage during the
catheter ablation procedure.
There are no existing devices on market that integrate a 3D dimensional, color
coded, temperature map for monitoring esophageal temperatures during catheter
ablation. For a more detailed comparison of existing devices and our chosen design
against our consumer requirements, reference Figure 3.3.5.

20
6.2 Evolution of Prototypes
Currently, a SOLIDWORKS rendering has been generated for the running
prototype of our device, Appendix C. Initially, we planned on creating our esophageal
probe with plastic tubing, drilling holes into the tubing at each thermistor location. The
thermistors were then epoxied into place and wires threaded up the length of the tubing.
However, this process was individually taxing and not sufficient for large-scale
manufacturing. Therefore, our final prototype changed to include two, 3D printed halves
for easy attachment of each thermistor head. Additionally, the 3D printed body and wires
were easily encapsulated in heat shrink.
Another change to our prototype included our change from a breadboard circuit
to a PCB. Although both generated temperature readings that were communicated to the
Raspberry Pi, it was difficult to secure all pins in the breadboard. This created a sensitive
prototype, impractical for use in the operating room. By creating a custom PCB and
using a wiring harness, the device decreased in size of components while increasing
ease of assembly and use.
6.3 Manufacturing Process
An overview of the manufacturing process is as follows:
1. 3D print probe body using an STL file generated from the CAD model.
2. Solder one red and one white wire to each terminal of the eight thermistors
respectively.
3. Glue each thermistor into its respective position within the 3D printed probe body.
4. Combine the two halves of the probe body and secure using epoxy.
5. Place black heat shrink tip over the end of the probe body.
6. Place clear heat shrink tubing over the entire probe body and wiring harness.
7. Heat and shrink all heat shrink to a 1 cm diameter.
8. Connect the custom PCB to the Raspberry Pi.
9. Connect a mouse, keyboard and monitor to the Raspberry Pi.
10. Load the necessary code onto the Raspberry Pi.
11. Connect each thermistor wire to a corresponding female header.
12. Connect each pair of thermistor headers to their corresponding male header on
the custom PCB.
A detailed manufacturing process contains explanations of each step and visual aids is
as follows:
1. The probe body is to be 3D printed by exporting the SOLIDWORKS files,
“Thermistor Body 1” and “Thermistor Body 2”, as STLs before being sent to an
FDM 3D printer printing with PLA filament with a layer height of 0.075 mm, print
speed of 50 mm/s and a travel speed of 70 mm/s. The probe body prints should
be oriented longitudinally flat on the bed as shown in the image below.

21
2. Measure out 3 feet of red and white 30 AWG wire before stripping both ends of
the wire. Ensure one end of the wire is stripped no more than 5 mm to limit the
amount of heat shrink required for insulating the wire. Solder one red and one
white wire to the two terminals on the thermistor. Cut heat shrink into 10mm
pieces before sliding the heat shrink over the exposed solder joint and heat to
insulate.
3 feet of red 30 AWG wire.
Wire stripped down approximately 5mm.
Heat shrink cut down to 10mm each.

22
Thermistor cut down and folded in for easier soldering.
Thermistor soldered to the white and red wire.
Completed wired thermistor with heat shrink.
3. Using the Loctite 4011, secure the thermistors to each half of the 3D printed
body. Ensure each thermistor is glued at the head and between the wire and
probe body. These two points of gluing are necessary to limit the amount of
mechanical stress experienced by the thermistor and reduce the probability
failure. Ensure each thermistor glass head is fully inserted into its corresponding
hole. Repeat steps for each thermistor in both bodies until all eight thermistors
are attached to their respective half body.
4. Place the Loctite 4011 along the edge of one probe body and then carefully
press the two body halves together to form a complete probe body. Work slowly
to ensure the alignment of the two probe body halves is correct. Hold the two
probe bodies together for 2 minutes to ensure the adhesive has dried correctly,
then allow the body to rest for 24 hours to reach the glues maximum strength.
Keep indoors at temperatures over 50 °F and below 90 °F.

23
5. Cut the clear heat shrink to 2 feet long before sliding it over the wiring harness
and fully covering the probe body.
6. Apply a light coating of adhesive to the black heat shrink tip before placing it over
the inferior end of the probe body. Ensure the black tip overlaps with the clear
heat shrink wrap.
7. Apply a constant heat of approximately 250 °F to shrink the black and clear heat
shrink down to their minimum sizes. Be sure not to exceed temperatures over
300 °F as damage to the probe body may occur. Be sure to evenly distribute the
heat and not concentrating the heat in one spot for more than a few seconds.

24
8. Align the 40-pin female header on the custom PCB with the 40-pin male and
gently connect the two boards together. Ensure no pins are misaligned, bent or
broken.
9. Plug in a mouse and keyboard to USB ports on the Raspberry Pi before
connecting a monitor to the HDMI port.

25
10. Plug in the power supply and boot into the Linux OS. Navigate to the terminal
and run the following command to download and install the GitHub repository. All
necessary files will be downloaded, and a folder will be created on the Desktop to
launch the python program.
a. Several python libraries are necessary for the Map Generation code to
run, Matplotlib, Numpy, SciPy, Circuit Python, ATLAS and
adafruit.MCP3XXX. See hyperlinks for installation details.
11. Retrieving the probe body once again, attach female headers to the end of each
thermistors 30 AWG stripped wire.
12. Plug the female header terminal ends of each thermistor into their respective
ports on the custom PCB as seen in the

26
13. Probe is assembled.
Design History Record for Working Prototype
Table IX: Initial DHR.
Date Task Quantity Manufactured
Performed By Comments Signature
2/7/2019 Manufacturing: Solder the Thermistors
8 Morgan N/A Morgan Jawitz
2/10/2019 Manufacturing: 3D Print Probe Body
2 Madi and Morgan
N/a Madi Keith Morgan Jawitz
2/15/2019 Manufacturing: Probe Epoxy
1 Madi and Sarah
N/A Madi Keith Sarah Sanders
2/22/2019 Manufacturing: Heat Shrink Body
1 Madi and Morgan
N/A Madi Keith Morgan Jawitz

27
1/20/2019 - 2/25/2019
Manufacturing: Electrical Assembly
1 Morgan Currently using voltage dividers, investigating use of op-amps
Morgan Jawitz
1/7/19 - 2/25/19
Manufacturing: Software/Code
1 Madi and Morgan
N/A Madi Keith Morgan Jawitz
6.4 Divergence Between Final Design and Final Functional Prototype
Several modifications were made between the final design and the final
functional prototype. A key difference begins with the design of the body, originally the
body was designed to incorporate 16 thermistors into a single 2.5-foot-long clear tubing.
The functional prototype now contains a separate, two halved, body piece that was 3D
printed and is sealed using clear heat shrink. This modification was made to ease the
manufacturing process while still maintaining the design requirements. The new body
design also allowed for increased precision in thermistor location. The quantity of
thermistors was decreased to 8 to limit the amount of electronic hardware required. A
new spiral pattern was therefore developed to maximize the amount of surface area read
by the 8 thermistors. With the decrease in thermistor quantity, the electric circuit was
modified to include only 8 voltage dividers inputting into a single ADC. With this new,
smaller, circuit design, a custom PCB was designed oppose to the utilization of a
breadboard for the final functional prototype. The use of PCB creates a more stable final
product that also increases the ease of manufacturing.
7.0 IQ/OQ/PQ
7.1 DOE
In order to ensure our product is accurately achieving its intended use, a Design of
Experiments (DOE) was developed. The DOE assigns engineering metrics to each
product specification and explains the testing methods to verify each metric. A complete
list of DOEs have been generated and can be found in Appendix I and all procedures
below.
7.1.1. Pre-Test to Validate Heat Gun
1.) Obtain calibrated thermometer.
2.) Obtain heat gun and attach the three dimensionally
printed conical fixture (depicted at right) for the tip.
3.) Bring heat gun to a temperature setting of 20°C,
30°C, and 40°C.

28
4.) Hold the calibrated thermometer to the working end of the heat gun for 30
seconds and ensure each thermometer reading matches the heat gun setting +/-
1°C.
7.1.2. Temperature Accuracy
1.) Calibrate a thermometer. 2.) Plug in a hot plate and heat to 20°C (ensure temperature with digital
thermometer). 3.) Place probe on hot plate with one thermistor directly interfacing with the hot
plate. 4.) Record the temperature measurements for both the thermometer and each
thermistor. 5.) Repeat recordings for all eight thermistors at a specific temperature. 6.) Bring the thermometer and probe back to room temperature. 7.) Change hot plate to 22°C. 8.) Repeat thermometer and probe reading comparisons. 9.) Repeat for 24°C, 26°C, 28°C, 30°C, 32°C, 34°C, 36°C, and 38°C. 10.) Calculate average absolute mean difference for all eight thermistors. Run
ANOVA test to observe if p<0.05.
7.1.3. Flexible Modulus
1.) Insert 3D printed Instron arm attachment (depicted at right). 2.) Assemble esophageal probe with heat shrink but without
thermistors. 3.) Place probe on top of lower U-shaped attachment and tape into
place. 4.) Measure cord length of probe. 5.) Set Instron to run a bending test, moving at 75mm/min and
stopping when there is a 40% decrease in force, signaling failure. 6.) Run test. 7.) Repeat for four more specimens.
7.1.4. Temperature Range
1.) Assemble a validated heat gun and the esophageal probe. 2.) Use heat gun at temperatures ranging from 20 to 38 °C in two-degree
temperature steps to test each thermistor on the probe. 3.) Calculate average absolute difference for all eight thermistors at each
temperature measurement compared to heat gun reading and the overall temperature range.
7.1.5. Temperature Map Generation
1.) Set-up software and connect wiring in probe and monitor to Raspberry Pi. 2.) Bring the environment to a temperature between 20 and 38 °C. 3.) Temperature readings should display in black at the safe range, and a cylindrical
map should be generated with the eight thermistors in their specified regions. 4.) Ensure temperature applied matches color key.

29
7.1.6. Alarm Test
1.) Set-up software and connect wiring in probe and monitor to raspberry pi. 2.) Use a heat gun or ambient environment to generate a temperature of 18°C at
one thermistor. 3.) Record color of number of appropriate thermistors. Blue color should be
observed below 20°C, black color for 20-38°C, and red color above 38°C. 4.) Repeat at 30 and 40°C.
7.1.7. Accurate Interpolation
1.) Set-up software and connect wiring in probe and monitor to Raspberry Pi. 2.) Use a heat gun or ambient environment to generate a temperature between 20-
38°C at Point 1. 3.) Record the thermistor temperature at point 1. 4.) Record the thermometer temperature at point 1. 5.) Perform 5 trials. 6.) Repeat steps 1-5 for Point 2.
a.) Point 1: (2.12, 2.12, 7.00) b.) Point 2: (-2.12, -2.12, 53.00)
7.1.7. Testing Bill of Materials
Table X: Testing BOM.
Item # Description Purpose Vendor Item Number Quantity
1 Calibrated Thermometer
Temperature measurement to compare against thermistors
Target 20594 1
2 Temperature- Sensitive Heat Gun
Soldering Iron Validation, Temperature Accuracy, Temperature Range, Accurate Interpolation Tests
Ace Hardware N/A 1

30
7.2 Verification and Validation
Design specifications were all met as provided in the testing data compiled
below. Both test plans and resultant data has created a foundation of evidence that
instills confidence in our final prototype.
7.1.1. Pre-Test to Validate Heat Gun
Figure 7.1.1. Average absolute difference between heat gun setting and validated thermometer. Specification restricted heat gun temperature setting accuracy to within one degree of the validated thermometer measurement. Results support that specification was met.

31
7.1.2. Temperature Accuracy
Figure 7.1.2. Average absolute difference between individual thermistor temperature measurement and validated thermometer temperature measurement, along with the associated statistical data. Specification restricted average variance to within one degree of the validated thermometer measurement. Results support that the specification was met.

32
7.1.3. Radius of Curvature
Extension at Maximum Load (mm) Radius of Curvature (mm)
10.25 42.02
7.63 53.37
10.25 42.02
8.25 49.96
7.25 55.78
Average 48.63
Figure 7.1.3. a.) Extension at maximum load (load to failure) and the resulting radius of curvature calculated. b.) Load vs extension of each specimen that underwent testing. Specification stated that the device radius of curvature was to be smaller in magnitude than the LMA radius of curvature, 52.7mm. Average radius of curvature at failure was 48.63 mm. Two individual tests failed according to our specification. Three of the five tests passed, as well as the average device radius of curvature. Results support that the specification was conditionally met.

33
7.1.4. Temperature Range
Figure 7.1.4. Average absolute thermistor temperature vs. digital temperature spanning beyond the range
specified. Results prove accurate device measurement across all temperatures it is exposed to in vivo.
7.1.5. Temperature Map Generation
Figure 7.1.5. Temperature map generation justified our claim that an accurate temperature map of the
esophagus could be displayed on a monitor in real time.

34
7.1.6. Alarm Test
Figure 7.1.6. Alarm test proved that the temperature map generated also alerted its viewer to dangerous
surface temperatures (less than 20°C and greater than 38°C) through color coded numerical displays at the
thermistor location. The blue and red temperature readings were displayed in response to appropriate environmental stimuli, and so our specification was met.

35
7.1.7. Accurate Interpolation
Figure 7.1.7. This test justified that the temperature map interpolated accurate temperatures values at specified random points between thermistors. The data from the two points was then compared with the thermometer measurement and a plot of the absolute difference was generated. Our specification (less than ± 1°C) was met based on the average absolute difference in data (± 0.97°C).
8.0 Conclusions and Recommendations
After two quarters of senior project, we were able to successfully create an
esophageal probe that measures real-time esophageal temperatures during catheter
ablation and produces a three-dimensional color-coded map. If dangerous
temperatures are reached, the surgeon will be alarmed by this color coding, allowing
them to move to a different left atrial position or pause during the procedure.
Moving forward to a second iterative design, there are changes that can be
made to the device to improve its design and function. For this project, we were unable
to incorporate a power termination portion due to the confidential instrumentation of
hospital medical equipment. Ideally, this device would be developed in partnership with a
medical device companies, such as Abbott Laboratories or Medtronic, to incorporate
power termination to the catheter. This would remove the element of surgeon
dependency on the alarm system. Another improvement to the device is utilizing an op
amp circuit instead of a voltage divider circuit to increase the resolution of temperature
readings and decrease the PCB component count. Additionally, the bottom portion of the
esophageal probe should be injection molded rather than three-dimensional printed to
ensure precise shapes of the device and utilize a rubber-like compound to increase the
flexure modules. Finally, the heat shrink should be sized in a controlled environment,
such as an oven, rather than with the movement of a heat gun.

36
9.0 Acknowledgments
As a senior project group, we would like to thank Dr. Porterfield for the idea of
the device, guidance on its development, and shadowing of his procedures. We
strongly believe this device addresses a large market in the medical device industry.
Sarah Griess from Abbott Laboratories also provided valuable input to device
background and manufacturing.
Additionally, thank you to the Biomedical Engineering Department at California
Polytechnic State University for giving us the knowledge, laboratory space, and funds to
complete our senior project. The development of this document and device was not
possible without the guidance of Drs. Heylman and Whitt. We would also like to thank
the Hannah Forbes committee for selecting our project for extra funding.
10.0 Appendices
*Please refer to Appendix C for updated CAD drawings*
*Please refer to Appendix D for the Failure Modes and Error Analysis*
*Please refer to Appendix F for vendor Information and traceability*
*Please refer to Appendix G for the Budget/BOM*
*Project notebooks are available upon request*

37
10.1 Appendix A: References
[1] “Types of Ablation Therapy for Arrhythmias.” UChicago Medicine, 2018.
[2] “Catheter Ablation.” National Heart Lung and Blood Institute, U.S. Department of Health
and Human Services, 2018.
[3] Zellerhoff, Stephan, et al. “Damage to the Esophagus After Atrial Fibrillation Ablation.”
Circulation: Arrhythmia and Electrophysiology, vol. 3, no. 2, 2010, pp. 155–159.,
doi:10.1161/circep.109.915918.
[4] Kapur, Sunil, et al. “Esophageal Injury and Atrioesophageal Fistula Caused by Ablation for
Atrial Fibrillation.” Circulation, vol. 136, no. 13, 2017, pp. 1247–1255.,
doi:10.1161/circulationaha.117.025827.
[5] Kiuchi, Kunihiko et al. “Impact of Esophageal Temperature Monitoring Guided Atrial
Fibrillation Ablation on Preventing Asymptomatic Excessive Transmural Injury.”
Journal of Arrhythmia 32.1 (2016): 36–41. PMC. Web. 12 Oct. 2018.
[6] Kuwahara, T. et al. “Safe and Effective Ablation of Atrial Fibrillation: Importance of
Esophageal Temperature Monitoring.” Journal of Cardiovascular Electrophysiology
20.1 (2009): 1-6. PMC. Web. 12 Oct. 2018.
[7] Bhaskaran A. et al. “A Review of the Safety Aspects of Radio Frequency Ablation.”
International Journal of Physiology 8 (2015): 147-153. Web. 12 Oct. 2018.
[8] “CARTO® SOUNDSTAR® Catheter.” Biosense Webster, 15 Feb. 2018.
[9] “Esophageal Stethoscopes.” Medline Industries, Inc., 2017.
[10] “Mon-a-Therm™ Esophageal Stethoscope with Temperature Sensor 400TM.”
Mon-a-Therm™ Esophageal Stethoscope with Temperature Sensor 400TM |
Medtronic, 2018.
[11] “INTELLAMAP ORION™.” INTELLAMAP ORION™ Mapping Catheter - Boston
Scientific, 2018.
[12] “CIRCA's S-CATH™ Hot & Cold Esophageal Temperature Monitoring System – CIRCA's
S-CATH™ Hot & Cold Esophageal Temperature Monitoring System.” CIRCAs SCATH
Hot Cold Esophageal Temperature Monitoring System, 2018.
[13] Mattola, Brian, et al. Esophageal Mapping Catheter. 17 July 2012.
[14] Rahan, Norbert. Temperature Probe for Insertion into the Esophagus. 26 Oct. 2010.
[15] Boveja, Birinder Robert, et al. Methods and Systems of Temperature Based Alarms,
Esophageal Cooling, and Automatic Interrupt (Shut-Off) during a Cardiac Ablation
Procedure. 19 May 2015.
[16] Valderrabano, Miguel, et al. System and Method using Cardiac-Esophageal Impedance
Mapping to Predict and Detect Esophageal Injury during Cardiac Ablation Procedure.
Application: 08 Sept. 2017.
[17] Schwartz, Yitzhck, et. al. Esophagus Position Detection by Electrical Mapping.
Application: 24 May 2018.
[18] “MAUDE Adverse Event Report: CIRCA SCIENTIFIC CS-2001 CIRCA S-CATH
ESOPHAGEAL TEMPERATURE PROBE.” Accessdata.fda.gov, 24 Apr. 2012.
[19] “CFR - Code of Federal Regulations Title 21.” Accessdata.fda.gov, 2018.
[20] Naden, Clare. “International Guide.” ISO - International Organization for Standardization,
Oct. 2018.

38
10.2 Appendix B: Project Plan (PERT Chart)
Figure 10.2.1. Showing the project pert chart for fall quarter of 2018. The critical path is
highlighted in red. The table on the right shows the corresponding task to the numbered boxes.
Figure 10.2.2. Showing the project pert chart for winter quarter of 2019. The critical path is
highlighted in red. The table on the right shows the corresponding task to the numbered boxes.

39
10.3 Appendix C: CAD Drawings
Figure 10.3.1: Technical drawing for Probe Body 1.
Figure 10.3.2: Technical drawing for Probe Body 2.
.

40
10.4 Appendix D: FMEA, Hazard & Risk Assessment
Figure 10.4.1. Shows the most recent FMEA table with highlighted updates/revisions.
Table 10.4.2. Risk and Hazards Assessment.
Description of Hazard Planned Corrective Action
Special knowledge of device will be necessary for use Train the surgeons using the device accordingly, include a detailed manual with the device
The device will be exposed to extreme conditions as it is to be use inside of the esophagus. Conditions include: humidity,
temperature changes, and a specialized chemical environment
When choosing materials for the device, ensure that they are biocompatible with the conditions of the esophagus. Additionally, choose materials that resist corrosion.
There is potential for the device to be used in an unsafe manner—specifically its incorrect placement in the esophagus.
Build in an aligning tool for the device to mitigate the risk associated with surgeon placement errors.
Device is connected to a power supply. Voltage may pose a risk to the surgeon or patient.
Ensure surgeons wear protective gear, ground all circuits accordingly, and ensure that the power supply is not exposed
to moisture.
Radiation exposure due to tracking of device in surgery Lead vests during operation, ensure device appears under imaging technologies
10.5 Appendix E: Pugh Chart
Figure 10.5.1. Displaying the Pugh chart for Design A being the datum for comparing the varying criteria.
41
Figure 10.5.2. Displaying the Pugh chart for Design B being the datum for comparing the varying criteria.
Figure 10.5.3. Displaying the Pugh chart for Design C being the datum for comparing the varying criteria.

42
10.6 Appendix F: Vendor Information, Specifications, and Data Sheet
Table I.F. Vendor information.
Vendor Website Physical Location
Adafruit www.adafruit.com/about 150 Varick St, New York, NY 10013
Amazon www.amazon.com/about Amazon.com, Inc. Customer Service PO Box 81226
Seattle, WA 98108-1226
McMaster Carr www.mcmaster.com/about 9630 Norwalk Blvd. Santa Fe Springs, CA 90670-
2932
Table II.F. Datasheets.
Component Vendor Item Number Link
Thermistor Digikey 495-5820-ND https://media.digikey.com/pdf/Data%20Sheets/Epcos%20PDFs/B57550G
1_Rev_Jan2016.pdf
Raspberry Pi Adafruit 3775 https://cdn-shop.adafruit.com/product-files/3775/Raspberry-
Pi-Model-B-Plus-Product-Brief.pdf
ADC Adafruit 856 https://cdn-shop.adafruit.com/datas
heets/MCP3008.pdf
Adafruit METRO M0 Express
Adafruit 3505 https://www.adafruit.com/product/3505
43
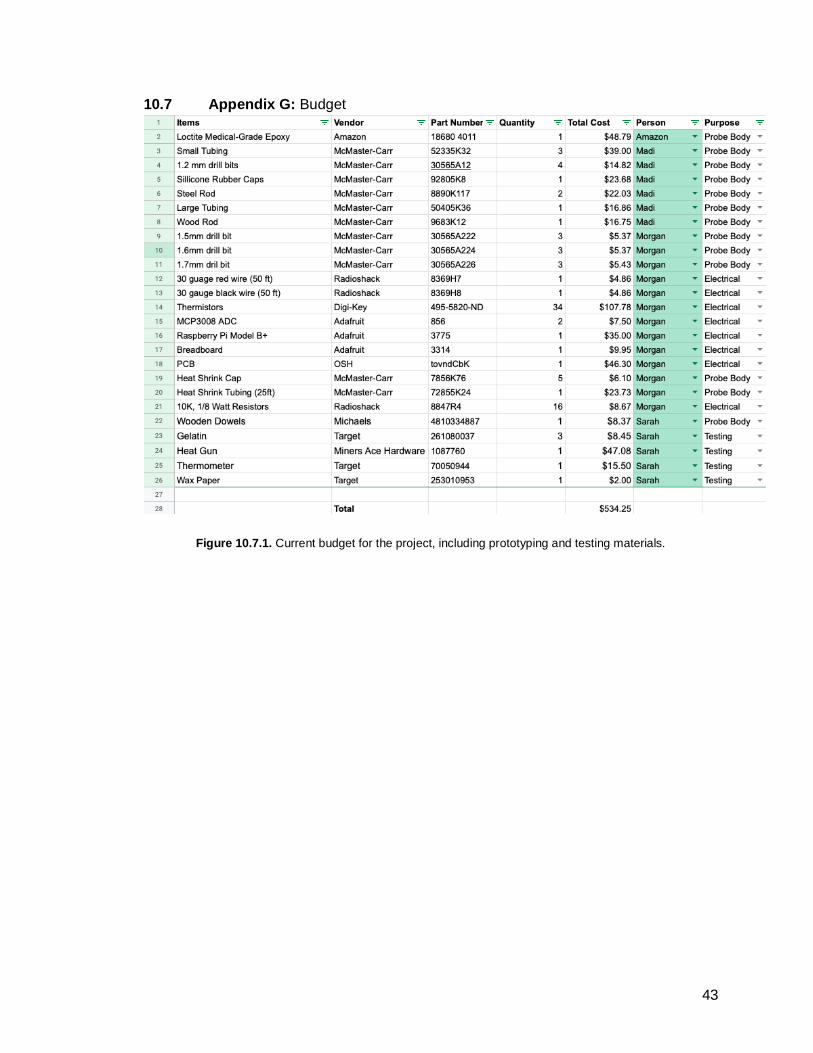
10.7 Appendix G: Budget
Figure 10.7.1. Current budget for the project, including prototyping and testing materials.

44
10.8 Appendix H: DHF
Figure 10.8.1. Customer requirements and engineering characteristics relationship (same as Figure 3.3.1).
Table I.H: Product Design Specifications.
Engineering Characteristic Specification
Esophageal Probe Diameter 6 mm ± 0.5 mm
Vertical Distance between Thermistors 15 mm ± 0.5 mm
Rotation between Thermistors 90° ± 5°
Thermistor Temperature Range 18-40°C (safe between 20°C-38°C)
Thermistor Temperature Accuracy ± 1°C
Temperature Interpolation Accuracy ± 1°C
Radius of Curvature 52.7 mm ± 2 mm
Figure 10.8.2. Circuit diagram and software diagram.

45
10.9 Appendix I: DOE
Engineering Metric
Specification Test Method Location Training Sample Size
Pass/Fail Criteria
Validate Heat Gun
±1°C Absolute difference with calibrated thermometer
BMED Wet Lab (192-328)
N/A 15 Mean absolute difference less than 1°C
Thermistor Temperature Accuracy
±1°C Absolute difference with calibrated thermometer
BMED Wet Lab (192-328)
N/A 24 Mean absolute difference less than 1°C and ANOVA p-value less than 0.05
Temperature Range
20-38°C Absolute difference with calibrated thermometer throughout range
BMED Wet Lab (192-328)
N/A 40 Mean absolute difference less than 1°C throughout range
Radius of Curvature
52.7 mm Instron bend testing to failure
BMED Wet Lab (192-328)
Completed with trained ISA Austin Roberts
5 Mean radius of curvature more than LMA radius of curvature
Temperature Map Generation
Pass/Fail Observation BMED Wet Lab (192-328)
N/A 1 Cylindrical shape with displayed temperatures
Alarm Test Color change outside 20-38°C
Compare colors at 3 temperatures
BMED Wet Lab (192-328)
N/A 3 Blue below 20°C, black between 20-38°C, red above 38°C
Interpolation Test
±1°C Absolute difference between thermistor and 90° turn.
BMED Wet Lab (192-328)
N/A 5 Mean absolute difference less than 1°C
Figure 10.9.1. A chart representing the DOE for the product demonstrating how engineering metrics will be
verified.

46
10.10 Appendix J: Applicable Code of Federal Regulations
● CFR 800 General
● CFR 803 Medical Device Reporting
● CFR 806 Medical Devices - Reports of Corrections and Removals
● CFR 814 Premarket Approval of Medical Devices
● CFR 820 Quality System Regulation
● CFR 821 Medical Device Tracking Requirements
● CFR 822 Postmarket Surveillance
● CFR 860 Medical Device Classification Procedures
● CFR 861 Procedures for Performance Standards Development
● CFR 870 Cardiovascular Devices
● CFR 1002 Records and Reports
● CFR 1004 Repurchase, Repairs, or Replacement of Electronic Products
● CFR 1005 Importation of Electronic Products
● CFR 1010 Performance Standards for Electronic Products: General
● CFR 1030 Performance Standards for Microwave and Radio Frequency Emitting
Products
10.11 Appendix K: Heat Gun Validation Raw Data
Figure 10.11. Heat gun validation raw data.

47
10.12 Appendix L: Temperature Accuracy Raw Data
Figure 10.12. Temperature accuracy raw data.
10.13 Appendix M: Temperature Range Raw Data
Figure 10.13. Temperature range raw data.

48
10.14 Appendix N: Temperature Interpolation Raw Data
Figure 10.14. Temperature interpolation raw data.
10.15 Appendix O: Code
Map_Gen.py

49
Therm_Read_Test.py

50