esops as retirement benefits: an analysis of dol data · esops as retirement benefits: an analysis...
TRANSCRIPT

• ESOPs as Retirement Benefits: An Analysis of DOL Data Loren Rodgers
• Employee Stock Ownership and the Employment Relationship Adria Scharf

"
ESOPs as Retirement Benefits: An Analysis of DOL Data Loren Rodgers
In a project funded by the Employee Ownership Foundation, the NCEO did an extensive analysis of ESOP companies using data from the US Departmentof Labor. Unlike prior research, the study carefully compiled data from multiple plans within a single company and used multiple years of data for each plan. It concluded that ESOP companies are more likely to offer a second defined contribution (DC) plan than non-ESOP companies are to offer any DC plan at all. ESOP companies also contribute substantially more to their ESOPs than companies with non-ESOP DC plans contribute to their DC plans. The average ESOP participant has 20% more DC assets than the average participant in a non-ESOP DC plan, and those assets are much more likely to come from the company. Considering only DC assets originally contributed by the company, ESOP participants have approximately 2.2 times as much in their accounts as participants in comparable non-ESOP companies with DC plans.
This article reviews data collected on the u.s. Department of Labor Form 5500 from defined contribution (DC) retirement plans. We used data from all companies with employee stock
ownership plans (ESOPs) for the most recent filing year available (2007 or 2006, depending on the company) and two prior years, where available. The comparison data comes from all non-ESOP companies with DC plans that filed a Form 5500.
This project was commissioned by the Employee Ownership Foundation and performed by the National Center for Employee Ownership (NCEO). The source data was information collected by the Deparbnent of Labor and distributed by Judy Diamond Associates. The NCEO consulted with two trustees of the Employee Ownership Foundation: Hugh Reynolds (Crowe Horwath) and
Loren Rodgers is a project director at the NeEO and will become its executive director in 2011. He is a frequent speaker and writes extensively on many aspects of employee ownership in professional and academic publications. He works with companies on governance, plan design, operational issues, assessment, communications, and ownership culture, and he consults internationally on public policy and employee ownership.
3

4 The Journal of Employee Ownership Law and Finance, Vol. 22/4
Rob Edwards (Steiker, Fischer, Edwards & Greenapple, P'G.). We developed a procedure to select the data, screen out inappropriate information, match data from separate plans for companies with more than one plan, and match data from comparable non-ESOP companies to the ESOP data .
. The 3,976 ESOP companies in this study, which represent all companies for which Form 5500 data is available and that met our screening criteria, represent 38% of all ESOPs, based on ·the NCEO's most recent estimate for the total number of plans! For more information about how we screened the data, see the section on methodology at the end of the article.
Overview
Plan Prevalence
ESOP companies, by definition, have at least one DC plan: the ESOP. More than half of them (56%) have a second DC plan, usually a 401(k). In comparison, the Bureau of Labor Statistics reports that 47% of companies overall have a DC plan. In other words, an ESOP company is more likely to have two DC plans than the average company is to have any. (See tables 3 and 4.2)
Contributions
The average ESOP company contributed $4,443 per active participant to its ESOP in the most recently available year. In comparison, the average non-ESOP company with a DC plan contributed $2,533 per active participant to its primary plan that year. In other words, on average ESOP companies contributed 75% more to their ESOPs than other companies contributed to their primary DC plan. Controlling for plan age, the number of employees, and the type of business increases the ESOP advantage to 90% to 110% above the non-ESOP companies in our sample. None of the numbers in this paragraph considers contributions made to secondary DC plans or contributions made by employees. (See table 5.)
1. See "A Statistical Profile of Employee Ownership" at http://www.nceo.org! main/article.php/id/2/.
2. The tables are presented later in the article where the data is discussed in detail.

ESOPs as Retirement Benefits: An Analysis of DOL Data 5
Not surprisingly, ESOP companies have much lower average contributions by employees than non-ESOP companies ($384 versus $2,848), and only 13% of ESOP companies report any employee contributions at all (see table 5). While it is very difficult to estimate confidently the combined employee and employer contributions to combined first and second DC plans, it appears that total contributions in combined plans are slightly higher inESOP companies than in non-ESOP companies.
Assets per Participant
The value of the assets contributed by the company to all DC plans in ESOP companies is substantially higher than the value in nonESOP companies. We estimate that the average ESOP participant has company-sourced DC-plan assets that are more than twice as much as participants in companies with non-ESOP DC plans. The average ESOP participant in the average ESOP company has company-sourced DC assets worth 2.22 to 2.29 times as much as the assets held by the average participant in the average company with a non-ESOP DC plan. (See table 8.)
This ESOP difference is necessarily an estimate because the data do not allow us to calculate the actual value of the assets per participant in combined DC plans. Another source of imprecision is our estimate for the portion of accumulated plan assets originally contributed by the company. The data do show how much of each year's contributions are from the company and how much are from employees, and this number is stable. We believe it provides areasonable basis to extrapolate how much of the accumulated assets in the average employee's account was originally a company contribution.
We can ignore the source of the assets and examine the total net assets in the combined plans (the ESOP plus the second DC plan, when available in ESOP companies, and the two DC plans, when two exist, in other companies). We estimate that the average ESOP participant in the average ESOP company has $55,836 in combined DC plans, compared with $50,525 for participants in non-ESOP companies with at least one DC plan. In other words, the average ESOP participant has somewhat more DC plan assets than the average DC plan participant, wrapping together both company and employee contributions. Controlling for company size, industry; and plan age suggests that total assets per participant are approximately

6 The Journal of Employee Ownership Law and Finance, Vol. 22/4
20% higher in ESOP companies than in companies with non-ESOP DC plans. (See table 7.)
While the structure of this data allows only comparisons between ESOPs and companies with non-ESOP DC plans, these numbers are consistent with findings from other studies. Peter Kardas, Jim Keough and Adria Scharf, for example, found that ESOP participants had approximately 2.5 times the assets of employees in non-ESOP companies (excluding personal assets such as houses, cars, and IRAs).3 Given that approximately half of companies do not have any retirement plans, the 20% advantage of ESOP companies over companies with non-ESOP DC plans could easily translate into a 2.5x advantage relative to the work force as a whole, although the available data do not allow that comparison directly. Note, however, that this comparison includes employee deferrals into DC plans, which are common in non-ESOP DC plans and much less important iIi ESOPs. In a typical non-ESOP DC plan, employee deferrals are only partially matched by employers, so the majority of plan assets are employee money.'
Finally, if we isolate the ESOP and compare it with the first DC plan in non-ESOP companies, the value of net plan assets per participant in ESOPs for the most recent plan year is lower than the value of net plan assets in the primary DC plan of companies without ESOPs ($47,556 for ESOP companies versus $50,149 for non-ESOP companies). This reflects in part the effect of ESOP loans, which directly reduce the current value of net plan assets, but which disappear over time. This difference also disappears or turns into a slight ESOP advantage when the data are controlled by work force size, industry, and plan age. (See table 6.)
Year-to-Year Change in Assets
The year-to-year change in assets available to pay participants (yearend plan assets minus beginning year plan assets phIS distributions) was an increase of $13,707 in ESOP companies in the most recent plan year, versus an increase of $10,496 for the primary DC plans in
3. Peter A. Kardas, Adria L. Scharf, and Jim Keogh, Wealth and Income Consequences of Employee Ownership (Oakland: NeED, 1998).
4. For example, table 5 in this report shows employee contributions are approximately 10% larger than company contributions iunon-ESOP plans. iu contrast, more than 90% of the contribution to ESOPs is from the company.

ESOPs as Retirement Benefits: An Analysis of DOL Data 7
non-ESOP companies. Non-ESOP companies saw a larger increase in assets per participant in the prior year. This comparison is more difficult to interpret than it first appears. Plans that make large payouts will show lower increases in assets per participant, but that is precisely because they are providing a substantial benefit for former employees. (See table 9.)
Unique Features of This Study
When a company adopts an ESOp, it affects other retirement plans in multiple ways: available funding, contribution limits, and the desire for a mix of retirement assets. This study painstakingly combined data from multiple plans within each company. ESOP companies often had a second DC plan, allowing us to estimate the assets per pariticipant in both plans combined. Non-ESOP companies are far less likely to have multiple DC plans, but this study estimates the assets per participant in those combined plans when they exist using the same method as with ESOP companies.
This study also brings multiple years of data together for all ESOP and comparison companies. In many of the tables below, readers will find three years of data showing trends over time.
Limitations
The study design imposes some limits on the conclusions that we can draw. An ideal comparison would be between all ESOP companies on the one hand and all non-ESOP companies on the other. That data is not available, because, as the Bureau of Labor Statistics' reports, only 47% of companies overall offer any DC retirement plans. Data from these companies does not exist in the Form 5500 returns. The second-best comparison, presented in this article, is between all available ESOP companies and all available non-ESOP companies that provide some DC plan, usually a 401(k) plan. According to the Employee Benefit Research Institute (EBRI), approximately 96% of DC participants participate in a 401(k) plan.
A second difficulty arises from the existence of multiple DC plans per company. It is impossible to calculate the combined value of multiple plans: a different set of employees may participate in
5. See http://www.bls.gov/ncs/ebs/benefits/2009/ownership/private/tableOla. him.

8 The Journal of Employee Ownership Law and Finance, Vol. 22/4
each plan, and the mix of employer and employee contributions is almost certain to be different. Although the data ftom Form 5500 do not allow a way to combine the data from multiple plans accurately, we have made estimates where possible.
A third limitation of this study is defined benefit (DB) plans. This study does not attempt to value or even track the incidence of DB plans among ESOP and non-ESOP companies. EBRI reports that 24.5% of households have a participant in a DB plan, although these are much more prevalent in the public sector than the private sector.
Fourth, the data is also subject to the time delay inherent in government data. We used data from 2007 where available, in 670 ESOP companies, or 17% of the total ESOP dataset. Data for the other 3,306 ESOP companies is from 2006. The data includes three years of data for all companies, where available. 670 companies have data from 2005 to 2007; the other 3,306 have data from 2004 to 2006.
Fifth, the Form 5500 data do not include payroll, a major factor in driving retirement benefits and evaluating their effectiveness.
Finally, the data available in this study is company-wide, so we are not able to look at individual participants and their outcomes. We also cannot account for turnover rates and growth rates, both of which would also affect the average assets and contributions per employee. ESOP companies have been shown to grow employment about 2.5% per year faster than they would have without an ESOp, which would dilute their per participant findings substantially over time.
The quality of this data from Form 5500 has improved markedly over the last years. The NeEO screened the data in multiple (often redundant) ways to further improve its quality. However, it is likely that some data entry errors remain, both on the part of the people originally completing the forms and in the transfer of the data from a physical form to a database.
About the Data
An ideal research design would match ESOP companies to comparison companies that are identical in every way except for the ESOP. Since this is clearly impossible, this study takes two steps to minimize the differences that result from factors other than the ESOP. First, we looked at differences between ESOP and non-ESOP

£SOPs as Retirement Benefits: An Analysis of DOL Data 9
companies within categories. We used three categories: work force size, line of business (defined by the two-digit NAICS code), and plan age. The differences between ESOP and non-ESOP oompanies within each of those categories is detailed in supplemental tables that are not included here but are 'available on request from the NCEO.
Second, to reduce the differences in overall averages, we made most calculations using only companies with 20 to 1,000 employees. We refer to this set of companies throughout this report as the "base data," and unless otherwise noted, all calculations use this set of companies. When we use data from all companies, we refer to that as the "extended data." Table 1 shows that ESOP companies and non-ESOP companies have drastically different distributions among size categories. Using the base data does not eliminate this difference, but it does reduce it dramatically.
The distribution by NAICS code is also somewhat different between the ESOP and non-ESOP sets of companies. The biggest differences are that ESOPs are much more likely to be in Finance and Insurance (NAICS code 52) and less iikely to be in Health Care and Social Assistance (NAICS code 62). Table 2 shows the distribution for the base data.
Table 1. Size of work force
Extended data Base data (a to g) (b to f)
Size of work Non- Non- Non-force ESOPs ESOPs ESOPs ESOPs ESOPs ESOPs
a. Under 20 658 128,500 13% 66% ~ ~ b. 20 to 40 920 28,440 18% 15% 23% 44%
c.41t080 1,079 17,003 21% 9% 27% 26%
d.81to150 827 8,701 16% 4%1 21% 14%
e, 151 to 300 628 5,448 12% 3% 16% 8%
f. 301 to 1000 522 4,573 10% 2% 13% 7%
g.Over1000 436 3,024 9% 2% ~ ~ Total companies 5,070 195,689 3,976 64,165

10 The Journal of Employee Ownership Law and Finance, Vol. 22/4
Table 2, Industry
Non-NAICS category NAICS code ESOPs ESOPs
Agriculture, Forestry, Fishing and HUnting 11 1% 1%
Mining, Quarrying, and Oil and Gas 21 0% 1% Extraction
Utilities 22 0% 0%
Construction 23 11% 10%
Manufacturing 31 to 33 22% 19%
Wholesale Trade 42 10% 7%
Retail Trade 44 and 45 6% 8%
Transportation and Warehousing 48 and 49 2% 2%
Information 51 2% 2%
Finance and Insurance 52 20% 6%
Real Estate and Rental and Leasing 53 1% 2%
Professional, Scientific, and Technical 54 17% 16% Services
Management of Companies and 55 3% 0% Enterprises
Administrative and Support and Waste 56 2% 2% Management and Remediation Services
Educational Services 61 0% 1%
Health Care and Social Assistance 62 2% 15%
Arts, Entertainment, and Recreation 71 0% 1%
Accommodation and Food Services 72 1% 2%
Other Services (Except Public 81 2% 4% Administration)
Plan Prevalence
The most striking feature of retirement assets in the United States is the small number of people covered by an employer-sponsored retirement plan. The Bureau of Labor Statistics (BLS) reports that in 2006,43% of private-seCtor workers participated in a DC plan.· In an August 2009 issue brief from EBRI, Craig COpeland analyzed data .
6. See http://data.bls.gov/cgi-bin/surveymost?eb, series ID EBUDCINCOOOOOOAP

ESOPs as Retirement Benefits: An Analysis of DOL Data 11
from the Federal Reserve Board's 2007 Survey of Consumer Finances. He found that in 2007, 33.6% offamilies included a participant in an employment-based DC retirement plan from a current job.'
The DOL data do not allow us to look at households or individual employees. The comparison we can draw is between rates at which companies offer DC plans. As cited earlier, the BLS reports that 47% of all establishments offer a DC retirement plan. By contrast, 56% of the ESOP companies in the base data set for this study (Le., companies meeting the screen and having between 20 and 1000 employees) offer a second DC plan aside from the ESOP. Using the extended data set, which includes companies with less than 20 employees and with more than 1,000 employees, the percentage of ESOP companies with second plans is 52%. In other words, ESOP companies of any size are more likely to offer an additional DC plan than non-ESOP companies are to offer any DC plan.
The results for companies with over 1,000 employees are likely skewed by the increased chance of these companies having a DB plan.
The National Compensation Survey, run by the Bureau of Labor Statistics, describes the percentage of companies in the economy as a whole with defined contribution plans. These numbers are from their 2007 survey (more recent data is available, but 2007 is more comparable with the ESOP-company data). This 2007 survey data also suggests that ESOP companies are more likely to have a second DC plan than companies in general are to have one DC plan, although the pattern does not hold for companies with more than 100 employees. 8
The percentage ofESOP companies with a second DC plan (56%) is strikingly higher than the percentage (3%) of non -ESOP companies with a second DC plan, as shown in the linked comparison data (see table 5, part A). This disparity may result from the fact thatthe vast majority of defined contribution plans are 401 (k) plans and relatively few companies offer more than one 401(k) plan.
7. Craig Copeland, "Individual Account Retirement Plans: An Analysis of the 2007 Survey of Consumer Finances, with Market Adjustments to June 2009," EBRI Issue Brief, no. 333, August 2009.
B. The report, "National Compensation Survey: Employee Benefits in Private Industry in the United States, March 2007," is available at http://www.bls. gov/ncs/ebs/sp/ebsm0006.pdf.

12 The Journal of Employee Ownership Law and Finance, Vol. 22/4
Table 3. ESOP companies with a second DC plan
Number Number Percentage of ESOP with with
companies in second DC second DC data set plans plans
Base data 3,976 2,239 56%
(20 to 1000 employees)
Extended data 5,070 2,624 52%
(all companies)
By size of work force
A. Under 20 employees 658 223 34%
B. 20 to 40 employees 920 449 49%
C. 41 to 80 employees 1,079 577 53%
D. 81 to 150 employees 827 481 58%
E. 151 to 300 employees 628 399 64%
F. 301 to 1000 employees 522 333 64%
G. Over 1000 employees 436 162 37%
Dala from prior years
Base data (prior year) 3,530 2,077 59%
Base data (twice'prior year) 3,201 1,845 58%
Table 4. Prevalence of DC plans
Percentage of ESOP Percentage of U.S. companies with second companies with
DC plans DC plans
All companies (base data set for ESOPs) 56% 44%
Companies with under 100 employees 48% 42%
Companies with 100 employees or more 57% 82%
Contributions
As noted above. ESOP companies contribute more per active participant to their ESOPs than other companies contribute to their primary DC plans. Part A of table 5 shows the overall averages for

ESOPs as Retirement Benefits: An Analysis of DOL Data 13
all ESOP and non-ESOP companies in the sample regarding company contributions to the first DC plan, the second DC plan (when such a plan exists), and an estimate of the company contribution to both plans combined. Part B shows employee contributions, and part C shows the combined employer and employee contributions.
Part D of table 5 looks at company contributions to companies' primary DC plans in the most recent plan year, controlling for major factors that affect the size of company contributions, such as the number of employees, the age of the plan, and the type of business. It compares ESOP and non-ESOP companies within each category (for example, the difference between ESOP comapnies with 20 to 40 employees and non-ESOP companies that are the same size). The numbers in part D are the weighted averages of those within-category differences. Full details on this method are described in the discussion of methodology, and the detailed tables summarized in part D are in the supplemental tables available on request from the NCEO.
Overall, it seems safe to say that in the most recent plan year, ESOP companies' average contribution to their ESOPs equaled 194% to 211 % of the average amount comparable non-ESOP companies contributed to their primary DC plans (see table 5, part D). This does not count contributions any of these companies made to second DC plans.
The nature of ESOP contributions is different from the majority of non-ESOP DC plans, which in most cases are 401(k) plans. Whereas the majority of contributions to ESOPs are made by the employer and allocated based on the relative pay of participating employees, employer contributions to a 401(k) plan often depend on whether the employee has elected to have a portion of his or her compensation paid into the 401(k) plan, with the employer contribution applied to match all or a designated portion of the employee's deferral.
Assets per Participant
The amount of raw accumulated net assets per plan participant is lower in ESOP companies than in non-ESOP companies with DC plans, as table 6 indicates. Part of what at first glance appears to be an ESOP disadvantage is due to the company characteristics of ESOP and non-ESOP companies-part B of this table shows that controlling for work force size, industry type, and plan age leaves
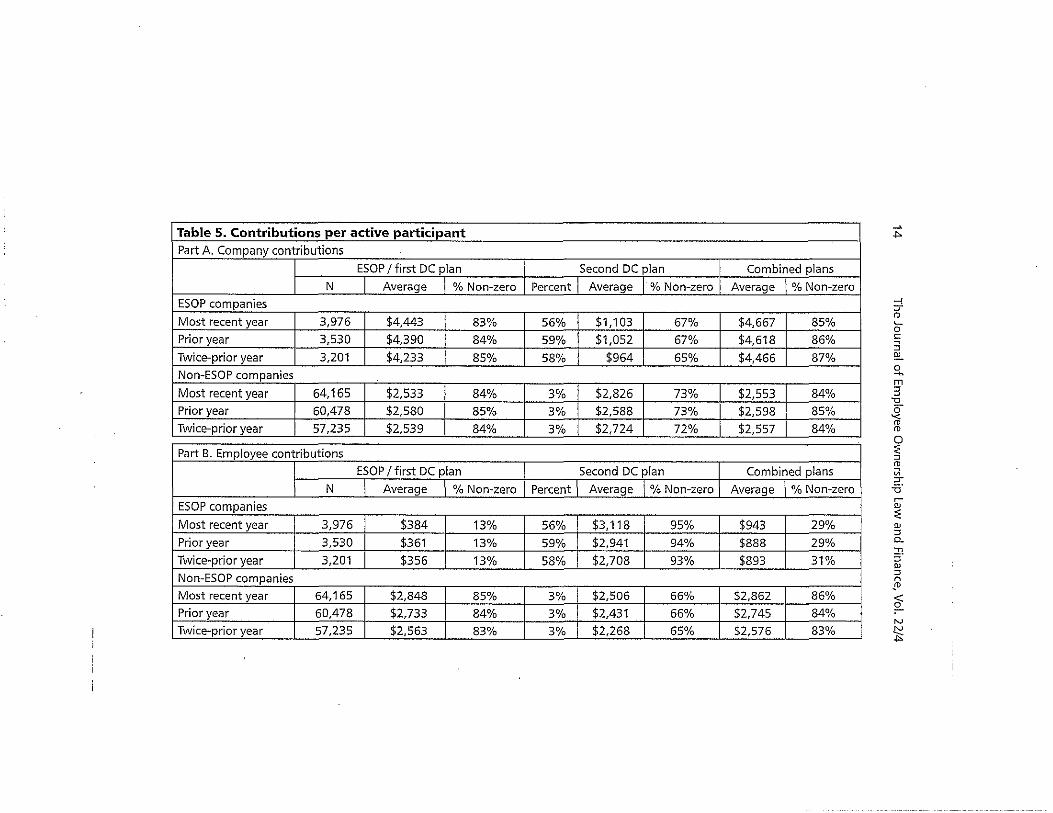
Table 5. Contributions per active participant Part A. Company contributions
I ESOP / first DC plan
N Average % Non-zero Percent
ESOP companies
Most recent year 3,976 $4,443 83% 56% Prior year 3,530 $4,390 84% 59% Twice-prior year 3,201 $4,233 85% 58% Non-ESOP companies
Most recent year 64,165 $2,533 84% 3% Prior year 60,478 $2,580 85% 3% Twice-prior year 57,235 $2,539 84% 3%
Part B. Employee contributions
ESOP / first DC plan
I N Average % Non-zero I Percent ESOP companies
Most recent year 3,976 $384 13% 56% Prior year 3,530 $361 13% 59% Twice-prior year 3,201 $356 13% 58% Non-ESOP companies
Most recent year 64,165 $2,848 85% 3%
Prior year 60,478 $2,733 84% 3% Twice-prior year 57,235 $2,563 83% 3%
Second DC plan I Combined plans
Average I % Non-zero I Average % Non-zero
$1,103 67% $4,667 85% $1,052 67% $4,618 86%
$964 65% $4,466 87%
$2,826 73% $2,553 84% $2,588 73% $2,598 85% $2,724 72% $2,557 84%
Second DC plan Combined plans
Average % Non-zero Average I % Non-zero
$3,118 95% $943 29% $2,941 94% $888 29% $2,708 93% $893 31%
$2,506 66% $2,862 86%
$2,431 66% $2,745 84% $2,268 65% $2,576 83%
--_. __ ._-----
...
;! ro ~
o " ::; 9!. 8-m ::; -0
~ ro o :< => ro V\ :::; '0' r;;-
'" '" " "-J:! =>
'" ::l n
_ro
if '" ~

Part C. Combined employee and company contributions
I ESOP / first DC plan I Second DC plan Combined plans
I N Average % Non-zero I Percent Average I % Non-zero Average I % Non-zero
ESOP companies Most recent year 3,976 $4,828 83% 56% $4,221 ·98% $5,611 86%
Prior year 3,530 $4,751 85% 59% $3,993 98% $5,505 88% Twice-prior year 3,201 $4,589 85% 58% $3,672 97% $5;359 88% Non-ESOP companies
Most recent year 64,165 $5,381 97% 3% $5,332 92% $5,415 97%
Prior year 60,478 $5,313 97% 3% $5,019 93% $5,343 97% Twice-prior year 57,235 $5,103 97% 3% $4,992 93% $5,133 97%
Part D. Company contributions: controlled by company characteristics
Contributions to first plan: ESOPs versus non-ESOPs (weighted average, most recent year)
Controlling for number of employees 194% Controlling for NAICS code 211% Controlling for plan age 197%
---- --
D:l o ;.;> ~
'" '" ~ ",.
3 ~ ~
~ '" '" R" l> " 5' '" "" Vi ",.
o ..., tJ o ,... ~ ill"
'"

16 The Journal of Employee Ownership Law and Finance, Vol. 22/4
ESOP companies with slightly more accumulated assets per participant (1% to 9%).
Most importantly, accumulated plan assets per participant for the ESOP companies where the ESOP is still leveraged is not the same as the accumulated assets allocated to the participants. This is the result of the assets in the plan being offset by the outstanding loan balance. The actual asset value allocated per participant is higher, and often significantly higher, than the accumulated plan assets per participant.
These results indicate that an ESOp, in isolation, provides approximately the same benefit as other DC plans, but table 6 omits three vital aspects ofthe comparison:
(1) the increased chance that ESOP companies have a second DC plan,
(2) the frequency with which non-ESOP companies have no DC plans, and
(3) the source of the accumulated plan assets, which is far more likely to be the company in the case of ESOPs.
These three aspects are discussed in turn below.
(1) Multiple Plans
Table 6 shows that the majority of ESOP companies have a second DC plan, while only a handful of non-ESOP companies do (see the three right-hand columns of part A). We approximated the combined value per participant of each company's first DC plan and its second plan, when a second plan exists. For companies with two plans, we added the value of the assets in each plan only if the two plans had approximately the same number of active participants. When the number of active participants in the first and second plans differed by more than 5% and when a company has just one plan, we counted the value of the first plan. We used the same process for ESOP and non-ESOP companies, and show the results in table 7 ..
This is an approximation. While we believe that we screened out most companies where different populations are covered by each plan, it is impossible to be sure. From part E, it appears that the total DC assets for ESOP participants is 19% to 23% higher than

ESOPs as Retirement Benefits: An Analysis of DOL Data 17
the total DC assets for a participants in DC plans at comparable non-ESOP companies.
(2) Companies with No Plans
The ESOP advantage appears at first glance to be substantially lower than prior estimates of the wealth-building impact of ESOPs. The study by Kardas, Keough, and Scharf, cited above, found that ESOP participants had approximately 2.5 times the assets of employees in non-ESOP companies (excluding personal assets such as houses, cars, and IRAs). However, Kardas et al. had access to information from companies without qualified plans, which are not available in the DOL data used in this study. Given the estimate from the Bureau of Labor Statistics that only 47% of companies offer any DC plans, the numbers above are consistent with the ESOP wealth effect found by Kardas et al.
(3) Source of Plan Assets
The third important distinction lost in table 6 is between assets contributed by the company and assets contributed by employees. While DOL data do not allow us to track the original source of accumulated assets, we can calculate the percentage of contributions to both plans made by the company and by employees in each plan year. We used the same method for combining contributions as we used to estimate combined plan assets.
For ESOP companies, the contributions to the ESOP and to the second DC plan were mostly from the sponsoring company. We calculate that 83% of the contribution in the most recent years in ESOP companies came. from the company, and this percentage was similar in the two prior years. For non-ESOP companies, the percentage of the company contributions to both plans was much lower: between 40% and 42% of contributions (depending on the year) were from the company.
We made a rough estimate of the accumulated assets that are company-sourced. To make these estimates, we made two key assumptions: first, that the ratio between company and employee contributions remains steady over the years; second, that assets acquired via company contributions have growth rates similar to assets acquired via employee contributions. While these assump-

Table 6. Accumulated plan assets per participant
Part A. Full-sample averages and medians
Assets per participant: Assets per participant: ESOP / first DC plan second DC plan
N Average Median Percentage with second plan Average
ESOP companies
Most recent year 3,976 $47,556 $29,775 56% $45,732
Prior year 3,530 $45,285 $28,539 59% $46,163
Twice-prior year 3,201 $43,337 $27,642 58% $54,554
Non-ESOP companies
Most recent year 64,163 $50,149 $30,414 3% $63,403
Prior year 60,478 $48,726 $29,194 3% $67,894
Twice-prior year 57,235 $44,766 $26,674 3% $59,004
Part B. First-plan assets, controlled by company characteristics
ESOP assets versus first-plan assets in non-ESOP companies (weighted average, most recent year)
Controlling for number of employees 109%
Controlling for NAICS code 102%
..<=ontr_olling for pi"". age 101%
Median
$23,615
$22,930
$22,680
$27,201
$26,957
$24,387
00
.... :;,ro 0-c ~
::> !!!.. o -m 3 "0
f ro o :;: ::> ro Vi :r. "0
[i;" :;: 0> ::> a. -n 5' 0> ::> n !'
2: IV
~

Table 7. Estimate of accumulated assets per participant: all DC plans
Part A. Full-sample averages and medians
N Average Median
ESOP companies
Most recent year 3,976 $55,836 $33,213
Prior year 3,530 $53,859 $32,335
Twice-prior year 3,201 $51,923 $30,944
Non-ESOP companies
Most recent year 64,165 $50,525 $30,498
Prior year 60,478 $49,064 $29,250
Twice-prior year 57,235 $45,095 $26,720
Part B. Accumulated assets per participant in all DC plans, controlled by company characteristics
Accumulated assets: ESOP companies versus non-ESOP companies (weighted average, most recent year)
Controlling for number of employees 123%
Controlling for NAICS code 119%
Controlling for plan age 120%
8i ~ e: iil' ::t. ~ 3 ~ ... '" ~ <1l :;, ~ 5-):,
" '" "< Vi Oi' o ." tJ ~ ~ ill"
'"

20 The Journal of Employee Ownership Law and Finance, Vol. 22/4
tions are unlikely to be exact, the broad outlines of table 8 should be reasonably accurate.
In other words, table 8 shows that the average ESOP participant in the average ESOP company has between 2.22 and 2.29 times as much value in assets contributed by the company when compared with the average employee in a comparable non-ESOP company with a DC plan.
Year-to-Year Change in Assets
All DC plans change in value from one year to the next based on the increase in the value of the assets in the plans, contributions by the company (if any), contributions by participants (if any), the outflow for distributions to former participants, and other factors.
In table 9, we estimate the change in net asset value per active participant over the course of a year. We started with the year-end net asset value for the entire plan, subtracted the year-end balance from the prior year, added distributions, and then divided the total by the number of active participants. Note that total plan assets and net plan assets are approximately the same in 401(k) plans, but ESOPs often have debt, making their net plan assets potentially much lower than their total plan assets.
Here, looking at the change in assets in the primary plans only, ESOP companies have a larger increase in assets per participant in the most recent year. In the prior year, however, ESOP companies had a smaller increase than non-ESOP companies; (We cannot calculate the twice-prior year because the calculation uses the year-end value of the prior year.)
Company Stock
ESOPs hold assets other than company stock. They often hold cash for various purposes, and federal law requires that participants meeting certain eligibility requirements be allowed to diversify a portion of their accounts into other assets, which may be done within the ESOP. Table 10 indicates that the percentage of total ESOP assets is stable at 84%. Not surprisingly, very little of the assets in the first DC plan in the non-ESOP companies is in the form of company stock. TYPically the only non-ESOP DC plan that hold company stock in a publicly traded company, and few of them are included in this sample.

Table 8. Company-sourced assets per participant: all DC plans combined
Part A. Full-averages and medians
ESOP companies Non-ESOP companies
N Average Median N Average Median
Most recent year 3,976 $46,344 $27,567 64,165 $20,210 $12,199
Prior year 3,530 $44,703 $26,838 60,478 $20,116 $11,992
Twice-prior year 3,201 $43,096 $25,683 57,235 $18,940 $11,222
Part B: Company-sourced assets: ESOP companies as a percentage of non- ESOP companies
Company-sourced assets per participant: ESOP companies versus non-ESOP companies (most recent year)
Weighted average Median
Most recent year 229% 226%
Prior year 222% 224%
Twice-prior year 228% 229%
Cl a ~ e: '" CD "'. <ii
" !!l ~
~ :;, m
"" R" :s-l> :;,
'" '" Vi ;:;;. o "" <:0
~ ~ Qj
N

Table 9. Change in net assets per active participant
Part A. Full-sample averages and medians
Change in assets per active participant: Change in assets per active participant: ESOP / first DC plan second DC plan
N Average Median Percentage with second plan Average Median
ESOP companies
Most recent year 3,530 +$13,707 +$7,050 54% +$14,376 +$6,836
Prior year 3,111 +$11,911 +$6,368 56% +$12,272 +$6,208
Non-ESOP companies
Most recent year 60,478 +$10,496 +$6,912 3% +$9,689 +$6,125
Prior year 55,945 +$12,852 +$8,517 3% +$15,997 +$7,148
Part B. Change in first-plan net assets, controlled by company characteristics
Change in first-plan assets: ESOP companies versus non- ESOP companies (weighted average, most recent year)
Controlling for number of employees 136%
Controlling for NAICS code 144%
Controlling for plan age 135%
N N
;}. <1) ~
o t: :; !!!. S. m 3
" f o § <D Vi :r ii' I;;' :;: '" :0 ":!! :0
'" :0 n !"
;;;: N
~

ESOPs as Retirement Benefits: An Analysis of DOL Data 23
Table 10. Company stock as a percentage of total first-plan assets
ESOP companies Non-ESOP companies
% of ESOP in % of plan in N company stock N company stock
Most recent year 3,976 84% 63,786 0.2%
Prior year 3,530 84% 60,153 0.2%
Twice-prior year 3,201 84% 56,925 0.3%
Methodology
The NCEO purchased access to the judy Diamond King of Pension Funds data, which is an electronically accessible version of the data collected on Form 5500 for the Department of Labor. On lines 8a and 8b of Form 5500, companies indicate which of several codes from a list applies to them. We included companies that use at least one of the following codes:
20 ("ESOP other than a leveraged ESOP''')
2P ("Leveraged ESOP - An ESOP that acquires employer securities with borrowed money or other debt-financing techniques.")
2Q ("The employer maintaining this ESOP is an S corporation.")
We excluded companies with no active participants and companies with no employer securities in their plans. The NCEO reviewed the data exhaustively, both by summary statistics and on a recordby-record basis. We combined multiple years for the same plan at the same company into a single record.
We queried the Judy Diamond data to find additional non-ESOP DC plans at the companies in the ESOP database. We quality-tested those records and corrected obvious mistakes (when possible) or eliminated records with obviously flawed data that we could not correct. We eliminated multiple DC plans and matched the nonESOP DC plans with the ESOP companies in the database.
We again queried the Judy Diamond data to find the comparison companies that have non-ESOP DC plans. The query used the following criteria:

24 The lournal of Employee Ownership Law and Finance, Vol. 22/4
• Not a company with an ElN (employer identification number) matching one of the ElNs in the ESOP database
• Plans with at least one active participant
• A plan-type code that matches a non-ESOP DC plan
• No plan-type codes that match DB plans
• Only companies that have NAlCS codes that are on the list of ESOP company NAlCS codes.
We quality-checked the data and repaired as needed, ending up with 659,000 records. We rearranged the data to put multiple years for a single plan into a single record, and then rearranged to put a second plan for a single company into the company's main record.
We used the existing data to generate new variables:
• "Distribution" is either "plan expense: payment to participants" or "plan expense: total" depending on whether the company· filled out schedule H or Form 5500.
• "Change in assets" is year 0 total plan assets minus year 1 total plan assets plus year 0 distributions. ("Year 0" means the most recently available plan year; "year 1" is the prior year; "year 2" . is the twice-prior year.)
• Other variables are straightforward.
We used the two-digit NAlCS code and company size to match comparison companies with ESOP companies. Each ESOP company was paired with the average of all companies with other DC plans in its category for work force size and NAICS code. In other words, an ESOP company with 100 employees and in NAlCS code 52 (Finance and Insurance) would have the average of all companies with non-ESOP DC plans as its benchmark.
Based on numbers of companies and irregularities in the data, we screened out companies with 20 or fewer employees and companies with over 1000 employees. In the end, we had 3,976 ESOP companies and 64,165 companies with other DC plans.