esr properties of membrane-bound hydrogenases from aerobic hydrogen bacteria
TRANSCRIPT

Biochimica et Biophysica Acta, 748 (1983) 353-361 353 Elsevier
BBA 31748
ESR PROPERTIES OF MEMBRANE-BOUND HYDROGENASES FROM AEROBIC HYDROGEN BACTERIA
KLAUS SCHNEIDER, a DAULAT S. PATIL b and RICHARD CAMMACK b.,
a Institut f~r Mikrobiologie der Universiti~t G6ttingen, 3400 Gi~ttingen, (F.R.G.) and b King's College, Department of Plant Sciences, 68, Half Moon Lane, London SE24 9JF (U.K.)
(Received May 19th, 1983)
Key words: Hydrogenase; ESR; Fe-S cluster; Nickel ion; Membrane-bound enzyme; (A. eutrophus)
Analysis of the membrane-bound hydrogenase of Alcaligenes eutrophus, strain H16, indicated a content of 7 - 9 Fe, 7 -9 labile sulphide and 0.6-0.7 nickel atoms per molecule of 98 kDa. The protein, as prepared, gave a complex electron-spin resonance (ESR) spectrum in the oxidized state at low temperatures (below 30 K), with average g value greater than 2.0. This was interpreted as being due to the interaction of a [3Fe-xS] or [4Fe-4S] 3+ duster and another paramagnetic centre. At higher temperatures a rhombic spectrum, attributed to Ni(llI), was observed. On treatment with mercaptoethanol, or reduction to a redox potential below + 160 mV, the low-temperature spectrum changed into a narrow signal at g -- 2.02, with increased amplitude. The g = 2.02 signal was reduced reversibly with a midpoint potential of 40 + 30 mV. The complex spectrum could be restored if the enzyme was rapidly reduced and reoxidized, but not under the conditions of the redox titration, when a broader signal appeared instead. The reductive titration was accompanied by a 3-7-fold increase in enzymic activity. On further reduction of A. eutrophus H16 hydrogenase a complex spectrum with average g value less than 2.0 was observed. This indicates the presence of a [4Fe-4S] 1+ cluster, interacting with either another such cluster or another paramagnetic centre. This cluster or clusters were estimated to have a midpoint potential of - 90 + 30 mV. The ESR spectra of the hydrogenases of A. eutrophus, type strain, and Pseudomonas pseudoflava, in the oxidized and reduced states, were similar to those of the A. eutrophus HI6 enzyme, indicating that they have a similar arrangement of redox centres. The characteristic spectra of the reduced enzymes indicate that they represent a new type of membrane-bound hydrogenase.
Introduction
All hydrogenases so far isolated and purified from diverse microorganisms have been described as iron-sulphur proteins [1,2]. The iron and sulphide composition, and number and type of iron-sulphur clusters present, however, vary con- siderably between different species. For example, four Fe and four labile S atoms per molecule have been found in the membrane-bound hydrogenases
* To whom correspondence should be addressed.
from Chromatium vinosum [3] and Rhodospirillum rubrum [4], but 24 Fe and 24 S in the enzyme from Proteus mirabilis [5]. The soluble hydrogenases of Clostridium pasteurianum [6] and Alcaligenes eutrophus H16 [7] were each reported to contain 12 atoms each of Fe and labile S per molecule; the ferredoxin-dependent Clostridium hydrogenase contains three [4Fe-4S] clusters, whereas the NAD-specific A. eutrophus hydrogenase contains both [4Fe-4S] and [2Fe-2S] dusters.
Recently, evidence has emerged that many hy- drogenases, particularly those whose function is hydrogen uptake, contain nickel. This has been
0167-4838/83/$03.00 © 1983 Elsevier Science Publishers B.V.

354
shown by the requirement for nickel for hydro- genase synthesis [8-11], by the detection of nickel in isolated hydrogenases [9,12-14], and by the observation of ESR signals due to nickel [15-20].
In the oxidized state the membrane-bound hy- drogenases have been shown to exhibit a sharp ESR signal near g = 2.02 at low temperatures [2,21]. However none of the membrane-bound hy- drogenases has been reported to give ESR signals in the reduced state, in contrast to the soluble hydrogenases, some of which show complex spec- I tra with signals in the region around g =1.94 ~ [3,4,20,22].
In this paper, we present a more detailed ESR characterization of the membrane-bound hydro- genase from the aerobic hydrogen bacterium A. eutrophus H16. This enzyme is distinct from the NAD-linked hydrogenase of the same organis m, which is soluble. The membrane-bound enzyme has been shown to have a molecular weight of 98000, to be composed of two subunits of M r 67000 and 31000, and to contain iron and labile sulphide [23], and more recently nickel [13]. For comparison, the ESR spectra of membrane-bound hydrogenases from other hydrogen bacteria (A. eutrophus, type strain; Pseudomonas pseudoflaoa [24]) are also presented.
Methods
Enzyme purification. The membrane-bound hy- drogenases were solubilized as described by Schlnk and Schlegel [23] and purified according to the procedure of Weiss et. [24]. A sample of purified hydrogenase from A. eutrophus, type strain, was kindly provided by H.G. Podzuweit. It should be noted that the enzyme from type strain differs from the others described here in that it is solubi- lized by sonication, without detergent treatment (H.G. Podzuweit, unpublished data). However, it is classed as membrane-bound because of its simi- larity to the other membrane-bound hydrogenases.
Hydrogenase assay. Hydrogenase activity was measured spectrophotometricaUy by following the reduction of methylene blue by hydrogen [23].
1ton, labile sulphide and nickel analysis. Iron was determined by the o-phenanthroline method of Massey [25], and labile sulphide by the method of Brumby et al. [26]. Nickel was determined by
energy-dispersive X-ray fluorescence in a spec- trometer described by Knoth and Schwenke [27].
Measurement of ESR spectra. ESR spectra were recorded on a Varian E4 ESR spectrometer (Varian Associates, Palo Alto, CA, U.S.A.) with an Oxford Instruments ESR 9 liquid-helium flow cryostat (Oxford Instruments, Osney Mead, Oxon, U.K.)
Redox titrations. Oxidation-reduction potential titrations were carried out in an apparatus similar to that of Dutton [28], under a flow of purified argon, with Na:S204 as reductant, K3Fe(CN)6 as oxidant and in the presence of the following dye mediators in the appropriate ranges of potential: benzoquinone, duroquinone, diaminodurene, N, N, N', N'- tetramethyl-p-phenylenediamine, phenazine methosulphate, methylene blue, thionine, 2,6-dichlorophenolindophenol, indig- otetrasulphonate, indigodisulphonate, anth- raquinone 2-sulphonate, phenosafranin, 1,2-naph- thoquinone, 2-hydroxy-l,4-naphthoquinone and diquat, all at a final concentration of 40 ttM. Further experimental conditions and the appara- tus used for the titration were as previously de- scribed [29]. All potentials are quoted relative to the standard hydrogen electrode.
Results
Iron, acid-labile sulphide and nickel content of mem- brane-bound hydrogenase from A lcaligenes eutrophus H16
For purified membrane-bound hydrogenase from A. eutrophus H16, Schink and Schlegel [23] reported a content of 6.1 atoms of iron and 6.2 of labile sulphide per enzyme molecule. However, by the criterion of optical absorption spectroscopy, the enzyme preparation was shown not to be ho- mogeneous but to be contaminated with a c-type cytochrome. [24]. We therefore re-examined the Fe/S-content with cytochrome-free enzyme pre- parations purified according to a procedure de- scribed by Weiss et al. [24]. In different prepara- tions, values of 6.7-8.9 gatom Fe, 7.3-8.9 gatom S and 0.6-0.7 gatom Ni per 98000 g protein were obtained.
ESR spectra The various types of spectra that were observed
at low temperatures in A. eutrophus membrane-

22 2.1 .g vQlue
20 19 l
1.8
(a)
(b)
d30 ' 0~2 ' d34 ' Q ~ ' 0 ' ~ lvtagnet ic field/T
Fig. 1. 1FSR spectra of A. eutrophus H16 membrane-bound hydrogenase, (a) in the oxidized state, as prepared, (b) treated with 6 mM mercaptoethanol for 2 h at 20°C, (c) reduced with 2 mM dithionite for 2 rain. Spectra were recorded at 18 K for (a), 25 K for (b), 10 K for (c) with the following instrument settings: microwave power 20 roW, frequency 9.28 GHz, modu- lation amplitude 1 mT, frequency 100 kHz. The relative gain settings are not comparable.
bound hydrogenase are summarized in Fig. 1. It should be emphasized that, despite their complex- ity, the major features of these spectra were ob- tained quite consistently. Similar results were ob- served with six different preparations of the en- zyme, and at pH between 5.5 and 8.5. In the oxidized state, the protein gave an extremely com- plicated lineshape, with average g values greater than 2. On incubation with mercaptoethanol, the spectrum became much simpler, consisting of a narrow axial spectrum with g± = 2.02, gll = 2.00 (Fig. l(b)). Finally, on reduction with hydrogen or dithionite, a new pattern of lines with average g value less than 2 was observed (Fig. 1(c)).
Spectra of oxidized hydrogenases The low-temperature ESR spectrum of A.
eutrophus H16 membrane-bound hydrogenase in the oxidized state (Fig. 2(a)) comprised several superimposed species. At lower microwave power or higher temperature (Fig. 2(b)) the signals to low field at g = 2.30, 2.17, 2.01 became more promi- nent, indicating that they were saturated under the conditions of measurement of Fig. l(a). It seems
23 22 21 g ~llue
20 19 18
355
. . . . . . J ' / / --- Io _
/\ ?J't /
Q28 Q30 032 034 036 Magnetic field/T
Fig. 2. ESR spectra of A. eutrophus H16 hydrogenase in the oxidized state, (a) recorded at 19 K, with expanded regions at 5 x higher gain; (b) recorded at 94 K, at a gain setting 25 x that of spectrum (a). Other instrument settings: microwave power 20 mW, frequency 9.18 GHz, modulation amplitude 1 mT.
highly probable that these signals are due to nickel(Ill), like the signals at g - 2.30, 2.23, 2.02 in hydrogenases from Methanobacterium thermoauto- trophicum [15,20] and D. gigas [16,17]. The ampli- tude of these signals in the A. eutrophus enzyme was small, however, and varied from one prepara- tion to another. In the sample illustrated in Fig. 2, the nickel signal gave an integrated intensity of 0.15 spins/molecule. There is also evidence for multiple forms of nickel, in that there appear to be superimposed signals at g = 2.23 and 2.14 (Fig. 2(b)). These may represent a second conformation- ally different form of the enzyme.
The complex lineshape of the remainder of the spectrum, with main features at g = 1.97, 2.04, 2.06 and 2.09, cannot be explained by a simple rhombic g-tensor. It may be due to interactions between two or more paramagnetic species. The spin concentration of this spectrum is difficult to estimate, because the value of S is unknown and because there are probably additional broad outer lines. Double integration and comparison with a Cu-EDTA standard, assuming a simple S = 1 /2 species, gave a value of intensity of 0.71 spins/ molecule.
In the ESR spectrum of oxidized P. pseudoflava hydrogenase a complex lineshape was also ob-

356
g value
2 2 2~ 2.0 1.9 1.8 i i I i i
I I I I I (~ I I 030 Q32 34 036
M~Jneti¢ fie~ll T
Fig . 3. E S R s p e c t r a o f h y d r o g e n a s e f r o m (a ) Pseudomonas pseudoflaoa; ( b ) Alcaligenes eutrophus, t y p e s t r a i n , in t h e
o x i d i z e d s t a t e . C o n d i t i o n s o f m e a u s r e m e n t w e r e as f o r F ig . 1.
served (Fig. 3(a)). The proportions differed some- what from one preparation to another, but gener- ally there was a larger amount of a narrow signal at g = 2.02, as though the conversion which in H16 hydrogenase was induced by mercaptoethanol was already taking place in the isolated enzyme. In the spectrum of the hydrogenase of A. eutrophus, type strain, the narrow signal at g = 2.02 predominated, although with an asymmetric lineshape suggesting that more than one component was present (Fig. 3(b)).
ESR spectra of partly reduced hydrogenases As already noted, treatment of the A. eutrophus
H16 hydrogenase with mercaptoethanol caused a considerable simplification of the spectrum. Re- moval of mercaptoethanol from the enzyme solu- tion by aerobic dialysis, at the optimum pH (5.5) of the enzyme, led to reappearance of the original complex spectrum. Similar results were obtained with the liydrogenases of P. pseudoflava and A. eutrophus type strain (data not shown). The effect of mercaptoethanol might be interpreted as being due to either the reduction of some group on the enzyme, or the removal of oxygen. The latter explanation has been proposed for C. vinosum hydrogenase, which also shows a complex line-
shape in the oxidized state, changing to a narrow spectrum after treatment with mercaptoethanol [12,30]. The hydrogen-uptake activity of the mem- brane-bound hydrogenase of A. eutrophus H16 has been reported to be inhibited reversibly by 02 , with a K i of 17/~M [31]. Attempts were made to remove oxygen from the enzymes in order to study the ESR spectra of the oxygen-free but unreduced enzymes. No difference in the spectra was ob- served when the enzyme solutions were repeatedly evacuated and flushed with oxygen-free argon in the presence or absence of glucose/glucose oxidase. This indicates that the complexity ob- served in the ESR spectrum of the oxidized pro- tein is not directly caused by oxygen binding to the enzyme and changing the environment of the iron-sulphur clusters. This was confirmed by paral- lel activity tests: treatment of the hydrogenases with mercaptoethanol did not influence the length of the reaction lag phase (approx. 1 min), or the time-course and rate of the enzyme reaction (methylene blue reduction).
Redox titrations of the signals from the oxidized hydrogenase
By reductive titration of the H16 hydrogenase it could be demonstrated that the conversion of the complex spectrum into the narrow g = 2.02 signal is dependent on the redox potential (Fig. 4). The enzyme was titrated potentiometrically in the pres- ence of mediator dyes. The potential was lowered with small additions of dithionite solution or the introduction of small bubbles of H 2 gas, and raised with K3Fe(CN)6 solution. The redox-dependent changes in the spectrum were found to be rela- tively slow. In the typical titration presented in Figs. 4 and 5, the protein was left to equilibrate at the set potential for 5 min before each sample was taken and frozen for spectroscopic measurements.
As the potential of the solution was progres- sively lowered, the spectrum was found to change in several stages. In the first stage, the outer lines of the complex spectrum disappeared, at a poten- tial around + 160 mV, and simultaneously the line at g = 2.02 increased in amplitude (Fig. 4(b),(c)). If at this stage, the potential of the solution was raised again with K3Fe(CN)6, the complex outer lines were only partially restored, as seen in the feature at g = 2.06 in Fig. 4(d), and the line at

357
g value 2.3 22 2:1 2D 1.9 1.8
- - , , , i ,
,.,.,,,,,..J- v i j ~ l ÷234 mV
N°~203 mV
d2a 630 632 d ~ 636 Mugrlet~ field/T
g volue ..~.32;2 2~1 2 0 1.9 1.8
(f)• No. 13 • 176 mV ( -
d3o d~ d~ 6:~ Iv~grlet~ fJeld/T
Fig. 4. ESR spectra of A. eutrophus hydrogenase from a redox titration in 0.1 M 4-morpholinepropanesulphonic acid buffer, pH 7.0. The numbers refer to sample numbers in the titration, and the applied potentials are given in Table I. Details of the titration are given in the Methods section. Spectra were re- corded at 16 K with microwave power 20 mW, frequency 9.18 GHz. The expanded regions of the spectra are at a 5 × in- creased gain.
g = 2.02 became broader. In the next stage, the g = 2.02 signal was reduced reversibly with a mid- point potential of + 40 + 30 inV. Finally, at lower potentials the spectrum of the reduced protein (Fig. 4(e)) appeared. On reoxidation (Fig. 4(f)), the complex outer lines were no longer seen, but in- stead the broad line at g = 2.02 reappeared. To summarize, three different types of signal arising from oxidizing species were observed in the titra- tion: (1) the complex spectrum from the enzyme as prepared (Fig. 2(a), 4(a)); (2) a narrow signal, with increased amplitude, at g = 2.02, seen during both oxidation and reduction at intermediate potentials (Fig. 4(c),(g)); (3) a broad signal at g = 2.02 seen on reoxidation (Fig. 4(d),4(f)).
From a plot of the signal amplitude against applied redox potential (Fig. 5) it can be seen that the disappearance of the outer lines such as that at g = 2.06 was accompanied by an increase in the central line at g = 2.02. A similar effect was seen on treatment with mercaptoethanol. An interpreta- tion of this observation is that the complex spec-
il 4
-1oo o lOO 2oo i::x~tent ~1 / mv
Fig. 5. Plot of the amplitude of the g = 2.02 signals against applied redox potential, in the titration of Fig. 4. Filled points represent the first six points o f the titration. Arrows indicate the samples for the spectra of Fig. 4, and numbers refer to the sample number in the titration. Curves are calculated from the Nernst equation, assuming potentials of +40 mV (increasing with higher potential) and + 160 mV (decreasing with higher potential), with arbitrary signal amplitudes.
trum is due to the interaction of an iron-sulphur cluster, which alone would give the g = 2.02 signal, with another paramagnetic species. As this para- magnetic species became reduced, the spectrum at g -- 2.02 would then appear. On this interpretation the postulated paramagnetic species would have a midpoint potential of + 160 mV.
It was found that if the protein was completely reduced with dithionite or hydrogen in the absence of mediators, and reoxidized with oxygen, methyl- ene blue or ferricyanide, the complex oxidized spectrum similar to Fig. 4(a) was restored. The change in the oxidized spectrum to the broad g = 2.02 signal (Fig. 4(f)) in the redox titration may have been due to the presence of the mediator dyes, or to the fact that the titrations required a considerable length of time (30-60 min) to ensure adequate equilibration.
Since it is known that oxidation with fer- ricyanide can cause irreversible changes in iron- sulphur clusters, in particular the conversion of [4Fe-4S] to a [3Fe-xS] type [32,33], it seemed pos- sible that the change in spectral lineshape reflected an inactivation of the protein. However, measure- ments of the activity of samples from the redox titrations indicated on the contrary that the activ- ity was increased 3-6.8,fold (Table I) by the reduction and reoxidation procedure. The changes

358
TABLE I
ENZYME ACTIVITIES OF THE H Y D R O G E N A S E SAM- PLES TAKEN FROM TWO D I F F E R E N T REDOX TITRA- TIONS
The first titration is that shown in Fig. 4. Activities were measured by the hydrogen uptake assay with methylene blue as acceptor, and are expressed as a percentage of the activity of sample 1. Redox potentials are expressed relative to the stan- dard hydrogen electrode.
Sample No. E 0 (mY) Activity (%)
Titration No. 1 1 234 100 3 179 193 4 138 192 8 203 307
10 - 2 3 7 200 13 176 157 15 62 179
Titration No. 2 2 202 100
12 - 38 102 15 - 109 89 19 55 164 22 207 293 31 356 680
in ESR signal lineshape and enzyme activity were consistently observed in titrations at pH values between 7.0 and 8.5.
ESR spectra of reduced hydrogenases On reduction of A. eutrophus membrane-bound
hydrogenase with an excess of dithionite (2 mM), the high-potential ESR signals disappeared com- pletely and a complex new spectrum appeared (Fig. 6(a)). This had principal features at g = 1.86, 1.92, and 1.98 and 2.02 (measured at X-band) with additional broad lines to high and low field. Like the oxidized spectrum, this is not explicable as a simple S = 1 /2 system with a rhombic g-tensor, or even a superimposition of two such g-tensors. It can be explained, however, as a triplet spectrum arising from a spin-spin interaction between two paramagnetic iron-sulphur clusters. Such spectra have been observed in reduced 214Fe-4S] ferredo- xins [39]. The lineshapes are complex and strongly dependent on the protein geometry. It is not possi- ble to readily separate the spectra of the individual components. Such systems also give an extremely
g velue
23 22 21 20 _ 19 18 i i i i i
Q28 Q30 022 034 036
Moc~etic field/T
Fig. 6. ESR spectra of hydrogenases, reduced with 2 mM dithionite under argon. (a) A. eutrophus, strain H16; (b) A. eutrophus, type strain; (c) P. pseudoflaoa. Spectra were recorded at 10 K with microwave power 20 mW, frequency 9.18 GHz.
weak signal at half-field due to the forbidden A M s = 2 transition. In the present case it was not possible to detect such a signal because of the dilute nature of the samples.
The reduced hydrogenases of A. eutrophus, type strain, and of P. pseudoflava showed strikingly similar ESR spectra with only very slight dif- ferences in lineshape (Fig. 6(b),(c)). This similarity confirmed that the observed complex spectra are characteristic of reduced membrane-bound hydro- genases of hydrogen bacteria and are not due to any contaminant. A further confirmation in this respect was that the enzymes of A. eutrophus H16 and P, pseudoflava, when reduced with gaseous hydrogen (flushing of the solutions with H 2 for 30 min), produced exactly the same spectra as the dithionite-reduced samples. The type strain hydro- genase could not be reduced with hydrogen alone, apparently because the enzyme is more resistant to reduction by hydrogen after oxygen treatment.
Redox titration of hydrogenase from A. eutrophus strain H16 at low potentials
Another redox titration was carried out at lower potentials with Na2S204 in the presence of ap- propriate mediators. Because of the relatively
359
D D
[]
0
DD ~
&
A I I I I I I 11-__. -33O -20O -100 0
potent~ll/rnV
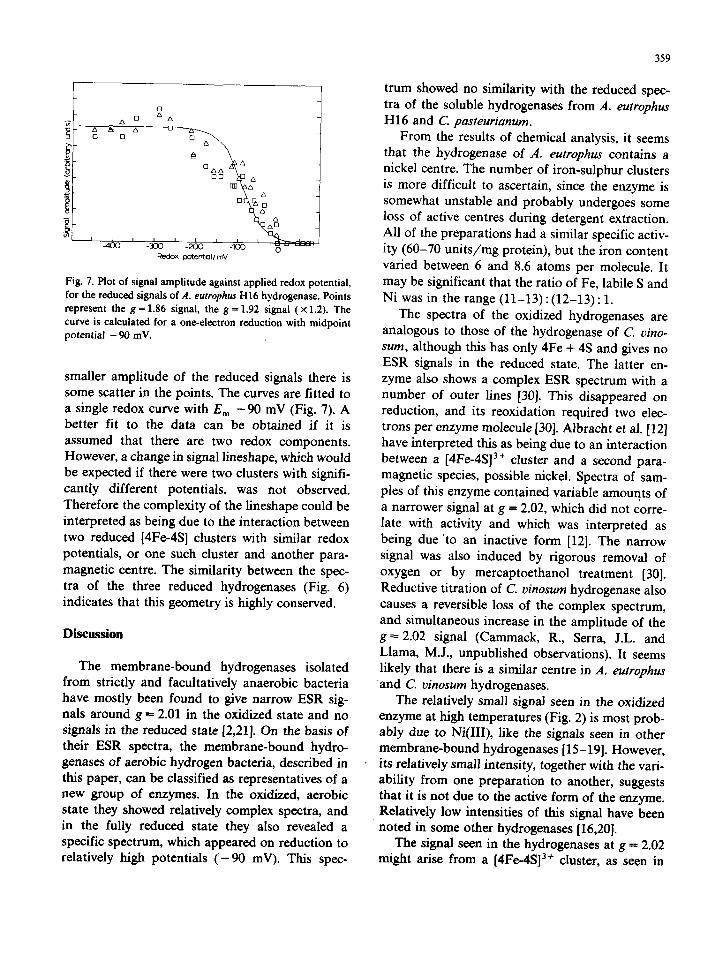
Fig. 7. Plot of signal amplitude against applied redox potential, for the reduced signals of A. eutrophus H16 hydrogenase. Points represent the g = 1.86 signal, the g = 1.92 signal (× 1.2). The curve is calculated for a one-electron reduction with midpoint potential - 90 inV.
smaller amplitude of the reduced signals there is some scatter in the points. The curves are fitted to a single redox curve with E m - 90 mV (Fig. 7). A better fit to the data can be obtained if it is assumed that there are two redox components. However, a change in signal lineshape, which would be expected if there were two clusters with signifi- cantly different potentials~ was not observed. Therefore the complexity of the lineshape could be interpreted as being due to the interaction between two reduced [4Fe-4S] clusters with similar redox potentials, or one such cluster and another para- magnetic centre. The similarity between the spec- tra of the three reduced hydrogenases (Fig. 6) indicates that this geometry is highly conserved.
Discussion
The membrane-bound hydrogenases isolated from strictly and facultatively anaerobic bacteria have mostly been found to give narrow ESR sig- nals around g = 2.01 in the oxidized state and no signals in the reduced state [2,21]. On the basis of their ESR spectra, the membrane-bound hydro- genases of aerobic hydrogen bacteria, described in this paper, can be classified as representatives of a new group of enzymes. In the oxidized, aerobic state they showed relatively complex spectra, and in the fully reduced state they also revealed a specific spectrum, which appeared on reduction to relatively high potentials ( - 9 0 mV). This spec-
trum showed no similarity with the reduced spec- tra of the soluble hydrogenases from A. eutrophus H16 and C. pasteurianurn.
From the results of chemical analysis, it seems that the hydrogenase of A. eutrophus contains a nickel centre. The number of iron-sulphur clusters is more difficult to ascertain, since the enzyme is somewhat unstable and probably undergoes some loss of active centres during detergent extraction. All of the preparations had a similar specific activ- ity (60-70 units/rag protein), but the iron content varied between 6 and 8.6 atoms per molecule. It may be significant that the ratio of Fe, labile S and Ni was in the range (11-13) : (12-13) : 1.
The spectra of the oxidized hydrogenases are analogous to those of the hydrogenase of C. vino- sum, although this has only 4Fe + 4S and gives no ESR signals in the reduced state. The latter en- zyme also shows a complex ESR spectrum with a number of outer lines [30]. This disappeared on reduction, and its reoxidation required two elec- trons per enzyme molecule [30]. Albracht et al. [12] have interpreted this as being due to an interaction between a [4Fe-4S] 3+ cluster and a second para- magnetic species, possible nickel. Spectra of sam- ples of this enzyme contained variable amounts of a narrower signal at g = 2.02, which did not corre- late with activity and which was interpreted as being due "to an inactive form [12]. The narrow signal was also induced by rigorous removal of oxygen or by mercaptoethanol treatment [30]. Reductive titration of C. vinosum hydrogenase also causes a reversible loss of the complex spectrum, and simultaneous increase in the amplitude of the g = 2.02 signal (Cammack, R., Serra, J.L. and Llama, M.J., unpublished observations). It seems likely that there is a similar centre in A. eutrophus a n d C. vinosum hydrogenases.
The relatively small signal seen in the oxidized enzyme at high temperatures (Fig. 2) is most prob- ably due to Ni(III), like the signals seen in other membrane-bound hydrogenases [15-19]. However, its relatively small intensity, together with the vari- ability from one preparation to another, suggests that it is not due to the active form of the enzyme. Relatively low intensities of this signal have been noted in some other hydrogenases [16,20].
The signal seen in the hydrogenases at g -- 2.02 might arise from a [4Fe-4S] 3+ cluster, as seen in

360
high-potential iron-sulphur proteins [34], or alter- natively a [3Fe-xS] cluster as seen in Azotobacter vinelandii ferredoxin I [35,36]. Further spectro- scopic studies are required to resolve this ambigu- ity. A further question is the physiological role of this centre. It is possible that this centre is an artefact, caused by oxidative damage to the pro- tein during aerobic isolation, since this can lead to the conversion of [4Fe-4S] to [3Fe-xS] dusters in susceptible proteins [32,33]. This can only be re- solved when the physiological electron acceptor of the enzyme is known. Alternative possibilities are that the cluster either functions as a secondary electron acceptor, or has a regulatory role. The iron-sulphur cluster in aconitase regulates the ac- tivity of the enzyme, apparently by interconver- sion between the [4Fe-4S] (active) and [3Fe-4S] (inactive) forms [37,38]. In the case of hydro- genase, the cluster might also be involved in pro- tection against oxygen [21]. Schink and Probst [31] noted that, although the membrane-bound hydro- genase of .4. eutrophus was inhibited competitively by oxygen, it was considerably more stable when stored in the presence of oxygen than in its ab- sence. This observation is consistent with the observation that reduction of the enzyme at poten- tials below + 100 mV causes a change in its ESR spectrum and an increase in activity (Table I).
The ESR spectra of the reduced hydrogenase indicate the presence of two [4Fe-4S] 1 + clusters, or possibly one such cluster interacting with another paramagnetic species. Either possibility is con- sistent with the analytical results within the possi- ble limits of error, as already stated. The presence of [2Fe-2S] clusters, as found in the soluble hydro- genase of A. eutrophus [7], cannot be excluded at present but seems unlikely in view of the tempera- ture dependence of the reduced spectrum, which was broadened out above 35 K.
It is noticeable that all of the redox potentials measured for the ESR-detectable centers in A. eutrophus hydrogenase are considerably more posi- tive than the potential of the H+/H2 couple (this is -420 mV at pH 7 and 1 atmosphere hydrogen pressure, but higher at decreased hydrogen ten- sion). Even the potentials of the reduced clusters seen in this enzyme are only - 9 0 mV, which suggests that these may be secondary electron acceptors associated with electron transfer to other
membrane-bound components. The active centre which undergoes the primary
reaction with hydrogen has not been identified. It may be undetectable by ESR for one of several reasons. Possibly its redox potential is consider- ably lower than the H+/H2 couple, so that it cannot be maintained in the reduced state in the presence of its oxidant, H+; or it may be a spin- coupled pair which would not be ESR-detectable.
Acknowledgements
We are grateful to Miss B. Dodemont and Miss K. Jochim for skilled technical assistance. This work was supported by grants from the Deutsche Forschungsgemeinschaft and the Science and En- gineering Research Council.
References
1 Scmegel, H.G. and Schneider, K. (1978) in Hydrogenases: Their Catalytic Activity, Structure, and Function (Schlegel, H.G. and Schneider, K., eds.), pp. 15-44, E. Goltze, K.G., G6ttingen
2 Adams, M.W.W., Mortenson, L.E. and Chen, J.S. (1981) Biochim. Biophys. Acta 594, 105-176
3 Strekas, T., Antanaitis, B.C. and Krasna, A.I. (1980) Bio- chim. Biophys. Acta 616, 1-9
4 Adams, M.W.W. and Hall, D.O. (1979) Biochem. J. 183, 11-22
5 Schoenmaker, G.S., Oitman, L.F. and Stouthamer, A.H. (1979) Biochim. Biophys. Acta 567, 511-521
6 Chert, J.S., Mortenson, L.E. and Palmer, G. (1976) in Iron and Copper Proteins (Yasunobu, K.T. and Mower, H.F., eds.), pp. 68-81, Plenum Press, New York
7 Schneider, K., Cammack, R., Schlegel, H.G. and Hall, D.O. (1979) Biochim. Biophys. Acta 578, 445-461
8 Friedrich, B., Heine, E., Fink, A. and Friedrich, C.G. (1981) J. Bacteriol. 145, 1144-1149
9 Graf, E.G. and Thauer, R.K. (1981) FEBS Lett. 136, 165-169
10 Takakuwa, S. and Wall, J.D. (1981) Microbiol. Lett. 12, 359-363
11 Partridge, C.D.P. and Yates, M.G. (1982) Biochem. 3. 204, 339-344
12 Albracht, S.P.J., Albrccht-Ellmer, K.J., Schmextding, D.J.M. and Slater, E.C. (1982b) Biochim. Biophys. Acta 681, 330-334
13 Friedrich, C.G., Schneider, K., and Friedrich B. (1982) J. Bacteriol. 152, 42-48
14 Unden, G., B6cher, R., Knecht, J. and Kr6ger, A. (1982) FEBS Lett. 145, 230-234
15 Albracht, S.P.J., Graf, E.-G. and Thauer, R.K. (1982) FEBS Lett. 140, 311-313

16 Cammack, R., Patil, D., Agnirre, R. and Hatchikian, E.C. (1982) FEBS Lett. 142, 289-292
17 Moura, J.J.G., Moura, I., Huynh, B.H., Kriiger, H.-J., Teixeira, M., DuVarney, R.C., DerVartanian, D.V., Xavier, A.V., Peck, H.D., Jr. and LeGall, J. (1982) Biochem. Bio- phys. Res. Commun. 108, 1388-1393
18 KrOger, H.-J., Huynh, B.H., Ljungdahl, P.O., Xavier, A.V., DerVartanian, D.V., Moura, I., Peck, H.D., Jr., Teixeira, M., Moura, J.J.G. and LeGall, J. (1982) J. Biol. Chem. 257, 14620-14623
19 Lalla-Maharajh, W.V., Hall, D.O., Cammack, R., Rao, K.K. and LeGall, J. (1982) Biochem. J. 209, 445-454
20 Kojima, N., Fox, J.A., Hausinger, R.P., Danieis, L., Orme- Johnson, W.H. and Walsh, C. (1983) Proc. Natl. Acad. Sci. U.S.A. 80, 378-382
21 Cammack, R., Lalla-Maharajh, W.V. and Schneider, K. (1982) in Electron Transport and Oxygen Utilization (Ho., C., ed.), pp. 411-415, Elsevier/North-Holland, New York
22 Van Dijk, C., Grande, H.J., Mayhew, S.G. and Veeger, C. (1980) Eur. J. Biochem. 107, 251-261
23 Schink, B. and Schlegel, H.G. (1979) Biochim. Biophys. Acta 567, 315-324
24 Weiss, A.R., Schneider, K. and Schlegel, H.G. (1980) Curr. Microbiol. 3, 317-320
25 Massey, V. (1957) J. Biol. Chem. 229, 763-770 26 Brumby, P.E., Miller, R.W. and Massey, V. (1965) J. Biol.
Chem. 240, 2222-2228 27 Knoth, J. and Schwenke, H. (1980) Z. Anal. Chem. 301,
165-169 28 Dutton, P.L. (1978) Methods Enzymol. 54, 411-434
361
29 Cammack, R., Rao, K.K., Bargeron, C.P., Hutson, K.G:, Andrew, P.W. and Rogers, L.J. (1977) Biochem. J. 168, 205-209
30 Van Heerikhuizen, H., Albracht, S.P.J., Slater, E.C. and Van Rheenen, P.S. (1981) Biochim. Biophys. Acta 657, 26-39
31 Schink, B. and Probst, I. (1980) Biochem. Biophys. Res. Commun. 95, 1563-1569
32 Thomson, A.J., Robinson, A.E., Johnson, M.K., Cammack, R., Rao, K.K. and Hall, D.O. (1981) Biochim. Biophys. Acta 637, 423-432
33 Moura, J.J.G., Moura, I., Kent, T.A., Lipscomb, J.D., Huynh, B.H., LeGaU, J., Xavier, A.V. and Miinck, E. (1982) J. Biol. Chem. 257, 6259-6267
34 Palmer, G., Brintzinger, H., Estabrook, R.W. and Sands, R.H. (1967) in Magnetic resonance in Biological Systems (Ehrenberg, A., Malmstrt~m, B.G. and VEnngkrd, T., eds.), pp. 157-171, Pergamon Press, London
35 Ghosh, D., O'Donnel, S., Furey, W., Jr., Robbins, A.H. and Stout, C.D. (1982) J. Mol. Biol. 158, 73-109
36 Emptage, M.H., Kent, T.A., Huynh, B.H., Rawlings, J., Orme-Johnson, W.H. and Miinck, E. (1980) J. Biol. Chem. 255, 1793-1796
37 Kent, T.A., Dreyer, J.-L., Kennedy, M.C., Huynh, B.H., Emptage, M., Beinert, H. and Miinck, E. (1982) Proc. Natl. Acad. Sci. U.S.A. 79, 1096-1100
38 Beinert, H., Emptage, M.H., Dreyer, J.-L., Scott, R.A., Hahn, J.E., Hodgson, K.O. and Thomson, A.J. (1983) Proc. Natl. Acad. Sci. U.S.A. 80, 393-396
39 Mathews, R., Charlton, S., Sands, R.H. and Palmer, G. (1974) J. Biol. Chem. 249, 4326-4328