essar shipping ports and logistics ltd
TRANSCRIPT
DISCLOSURE APPENDIX CONTAINS ANALYST CERTIFICATIONS AND THE STATUS OF NON-US ANALYSTS. U.S. Disclosure: Credit Suisse does and seeks to do business with companies covered in its research reports. As a result, investors should be aware that the Firm may have a conflict of interest that could affect the objectivity of this report. Investors should consider this report as only a single factor in making their investment decision.
31 March 2011 Asia Pacific/India Equity Research
Marine Ports & Services
Essar Shipping Ports and Logistics Ltd (ESRS.BO / ESRS IN)
INITIATION
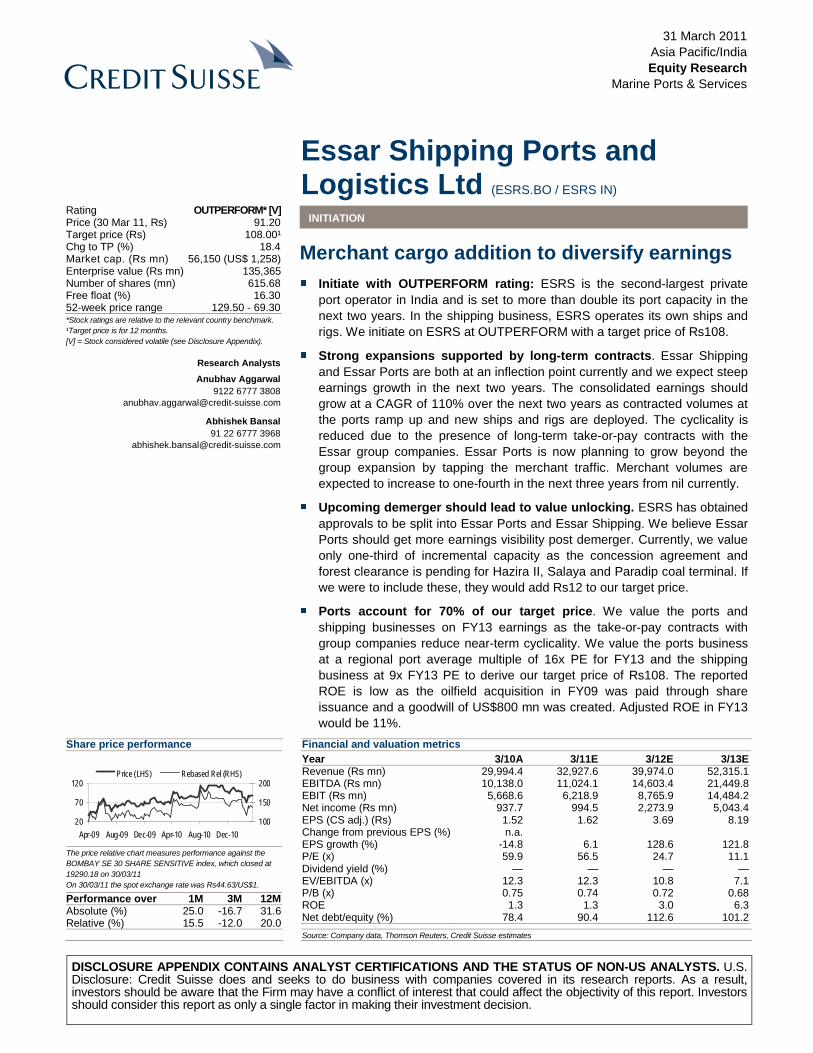
Merchant cargo addition to diversify earnings ■ Initiate with OUTPERFORM rating: ESRS is the second-largest private
port operator in India and is set to more than double its port capacity in the next two years. In the shipping business, ESRS operates its own ships and rigs. We initiate on ESRS at OUTPERFORM with a target price of Rs108.
■ Strong expansions supported by long-term contracts. Essar Shipping and Essar Ports are both at an inflection point currently and we expect steep earnings growth in the next two years. The consolidated earnings should grow at a CAGR of 110% over the next two years as contracted volumes at the ports ramp up and new ships and rigs are deployed. The cyclicality is reduced due to the presence of long-term take-or-pay contracts with the Essar group companies. Essar Ports is now planning to grow beyond the group expansion by tapping the merchant traffic. Merchant volumes are expected to increase to one-fourth in the next three years from nil currently.
■ Upcoming demerger should lead to value unlocking. ESRS has obtained approvals to be split into Essar Ports and Essar Shipping. We believe Essar Ports should get more earnings visibility post demerger. Currently, we value only one-third of incremental capacity as the concession agreement and forest clearance is pending for Hazira II, Salaya and Paradip coal terminal. If we were to include these, they would add Rs12 to our target price.
■ Ports account for 70% of our target price. We value the ports and shipping businesses on FY13 earnings as the take-or-pay contracts with group companies reduce near-term cyclicality. We value the ports business at a regional port average multiple of 16x PE for FY13 and the shipping business at 9x FY13 PE to derive our target price of Rs108. The reported ROE is low as the oilfield acquisition in FY09 was paid through share issuance and a goodwill of US$800 mn was created. Adjusted ROE in FY13 would be 11%.
Share price performance
20
70
120
Apr-09 Aug-09 Dec-09 Apr-10 Aug-10 Dec-10
100
150
200Price (LHS) Rebased Rel (RHS)
The price relative chart measures performance against the BOMBAY SE 30 SHARE SENSITIVE index, which closed at 19290.18 on 30/03/11 On 30/03/11 the spot exchange rate was Rs44.63/US$1.
Performance over 1M 3M 12M Absolute (%) 25.0 -16.7 31.6 Relative (%) 15.5 -12.0 20.0
Financial and valuation metrics
Year 3/10A 3/11E 3/12E 3/13E Revenue (Rs mn) 29,994.4 32,927.6 39,974.0 52,315.1 EBITDA (Rs mn) 10,138.0 11,024.1 14,603.4 21,449.8 EBIT (Rs mn) 5,668.6 6,218.9 8,765.9 14,484.2 Net income (Rs mn) 937.7 994.5 2,273.9 5,043.4 EPS (CS adj.) (Rs) 1.52 1.62 3.69 8.19 Change from previous EPS (%) n.a. EPS growth (%) -14.8 6.1 128.6 121.8 P/E (x) 59.9 56.5 24.7 11.1 Dividend yield (%) — — — — EV/EBITDA (x) 12.3 12.3 10.8 7.1 P/B (x) 0.75 0.74 0.72 0.68 ROE 1.3 1.3 3.0 6.3 Net debt/equity (%) 78.4 90.4 112.6 101.2
Source: Company data, Thomson Reuters, Credit Suisse estimates
Rating OUTPERFORM* [V] Price (30 Mar 11, Rs) 91.20 Target price (Rs) 108.00¹ Chg to TP (%) 18.4 Market cap. (Rs mn) 56,150 (US$ 1,258) Enterprise value (Rs mn) 135,365 Number of shares (mn) 615.68 Free float (%) 16.30 52-week price range 129.50 - 69.30 *Stock ratings are relative to the relevant country benchmark. ¹Target price is for 12 months. [V] = Stock considered volatile (see Disclosure Appendix).
Research Analysts
Anubhav Aggarwal 9122 6777 3808
Abhishek Bansal 91 22 6777 3968

31 March 2011
Essar Shipping Ports and Logistics Ltd (ESRS.BO / ESRS IN) 2
Focus charts Figure 1: Strong capacity expansion at Essar Ports Figure 2: Capacity expansion across the shipping fleet
-
40
80
120
160
FY11 FY12 FY13
Vadinar Hazira Salaya Paradip Ore Paradip Coal
104 MT
158 MT
76 MT
26 v essels,
1.47mn DWT 1 semi-sub,
12 onshore rigs
Sea + land
logistics
2 jack-up rigs
Sea+ Land
Logistics
12 v essels,
2.5mn DWT
Sea transportation Surface logistics Oilfield serv ice
Ex isting assets Planned ex pansion
Source: Company data, Credit Suisse estimates Source: Company data, Credit Suisse estimates
Figure 3: 110% consolidated EPS-CAGR over next 2 years Figure 4: EBITDA split across divisions
-2
0
2
4
6
8
10
2009 2010 2011F 2012F 2013F
Ports Shipping
Rs/share
0%
20%
40%
60%
80%
100%
2009 2010 2011F 2012F 2013F
Ports Sea transportation Sea logistics Oilfield serv ices
Source: Company data, Credit Suisse estimates Source: Company data, Credit Suisse estimates
Figure 5: Essar Ports has the highest EBITDA margin … Figure 6: Net debt/EBITDA has been consistently high
0%
10%
20%
30%
40%
50%
60%
70%
80%
Essar port Mundra Pipav av
EBITDA Margins
0x
2x
4x
6x
8x
10x
12x
2007 2008 2009 2010 2011F 2012F 2013F
Net Debt / EBITDA
Source: Company data, Credit Suisse estimates Source: Company data, Credit Suisse estimates

31 March 2011
Essar Shipping Ports and Logistics Ltd (ESRS.BO / ESRS IN) 3
Merchant cargo addition to diversify earnings Ports: capacity to double + shift to merchant cargo Essar Ports is the second largest private port in India handling 40 mt volumes and is on its way to more than double port capacity in the next two years to 158 mt. Volume ramp up at the port has been steep due to the strong support of captive volumes from the Essar group. We expect a traffic CAGR at the Essar Ports of 38% over the next two years compared to volume growth of 10% for the major ports. The volume ramp up would further accelerate as the port is now also focussing on tapping merchant cargo to grow beyond group expansion. The merchant cargo volumes are expected to increase to almost one-fourth in the next three years from almost nil currently.
Currently, both Vadinar and Hazira ports operate under a take-or-pay contract with the group companies. These are long-term contracts that are valid for 15 years. These in-house contracts are determined at arms length and are benchmarked with major ports. Despite pricing being closer to major ports, Essar Ports have the highest margin among the Indian ports. As merchant volumes ramp up, the margins should further improve as merchant pricing at Hazira is 10% higher than contract pricing and 20% higher at Salaya.
Shipping: expansion across the fleet The shipping business comprises three divisions: 1) Sea transportation, which provides crude oil and dry bulk transportation services, 2) Surface logistics, which provides logistics services from ships to ports, lighterage services and 3) Oilfield services, which provide contract drilling services to oil and gas companies. The majority of clients for sea transportation and surface logistics are group companies while almost 95% of the revenues in the oil field services come from external customers.
Essar Shipping is expanding its fleet capacity across the three divisions. The fleet capacity in sea transportation would expand by 64% in the next two years to 2.4 mn DWT. Oilfield services, on the other hand, will almost double its capacity with the addition of two jack-up rigs. As a result of the expansions, we expect a total earnings CAGR for Essar Shipping of 66% over the next two years. We have assumed the current rates to persist for the next two years, and if day rates pick up, then our estimates have upside risk.
Initiate with OUTPERFORM; target price Rs108/share Essar Shipping and Essar Ports are both currently at an inflection point and we expect steep earnings growth in the next two years. Consolidated earnings should grow at a CAGR of 110% over the next two years as contracted volumes at the ports ramp up and new ships and rigs are deployed. We are comfortable valuing the port business on FY13 as the take-or-pay contracts with the group companies assure a strong volume ramp up. Similarly, we value shipping on FY13 as long-term contracts on sea transportation reduce near-term cyclicality. We value the ports division at the regional port multiple of 16x P/E for FY13 and the shipping division at 9x FY13 PE to arrive at target price of Rs108. We have not built in upside from Hazira II, Salaya and Paradip coal terminal, as the concession agreement for the first two and forest clearances for Salaya and Paradip are pending.
Demerger into ports and shipping will provide investors with the option of either Essar Ports or Essar Shipping, an option unavailable in the integrated company so far. The port business has now turned profitable and has sufficient scale to be separated into a standalone entity. Thus, we expect port earnings to gain more visibility post the demerger. ESRS has obtained all the approvals but the record date has not been announced. Leverage at both ports and shipping is high, but we are comforted by the long-term nature of the contracts in both divisions. We do not expect equity dilution for the expansions as internal cashflow is likely to be sufficient to fund equity capex.
Essar Ports is the second largest private port in India and is more than doubling its capacity in the next two years
Essar Ports are tapping merchant cargo to grow beyond group expansions
Sea transportation is increasing its fleet size by 64% while oilfield is almost doubling its capacity
Expansion should result in shipping earnings increasing at a 66% CAGR over the next two years
Consolidated earnings CAGR of 110% over the next two years
Port earnings are expected to gain more visibility post the demerger

31 March 2011
Essar Shipping Ports and Logistics Ltd (ESRS.BO / ESRS IN) 4
Financial summary Figure 7: Specifications of Essar Ports Capacity Stake Berth Draft Capex Debt Equity Status/
Port (MT) (%) (mts) (mts) ($ mn) (%) (%) COD Customer Cargo Remarks
Vadinar-I 46 100 305 20 641 70 30 Operational Essar Oil Crude + petroleum SPM is underutilised and can be used for merchant cargo
Vadinar-II 12 100 300 16 240 70 30 Apr-11 Essar Oil Petroleum Expanded capacity to be used for Essar Oil
Hazira-I 30 74 550 14 300 74 26 Operational Essar Steel/
merchant
Iron ore, coal Stake purchase from Essar Steel – stake to
increase to 99%
Hazira-II 20 74 700 16 189 75 25 Oct-12 Essar Steel/
merchant
Coal, Container Stake purchase from Essar Steel – stake to
increase to 99%; yet to get GMB concession approval. Financial closure not yet done.
Salaya 20 100 385 14 238 75 25 Mar-13 Essar Power/ merchant
Coal, pet coke Stake to be reduced to 74% – stake sale to Essar Power; concession agreement not yet signed, forest clearance pending
Paradip-I 16 44 275 14 114 75 25 Oct-11 Essar Steel Iron ore 10-year license + 5 years extension
Paradip-II 14 75 370 17 124 80 20 Mar-13 Merchant Coal 30-year concession agreement
Source: Company data, Credit Suisse estimates
Figure 8: Sum of the parts: target price of Rs108/share Division FY13 EPS PE multiple Value (Rs/share) Remarks
Ports 4.9 16.0x 78 Average multiple based on regional ports average Shipping 3.3 9.0x 30 Multiple based on regional shipping companies and Drillers Total 8.2 13.2x 10⁸
Source: Company data, Bloomberg, Credit Suisse estimates
Figure 9: Upside from Hazira II, Salaya and Paradip coal commissioning – option value of Rs 12/share Capacity FY14 vol EBITDA EBITDA EV/EBITDA EV Debt* Mcap Stake Value (mt) (mt) (Rs/t) (Rs mn) (x) (Rs mn) (Rs mn) (Rs mn) (%) (Rs/sh)
Hazira II 20 8 150 1,200 8.5 10,200 5,739 4,461 99% 7 Salaya 20 8 135 1,080 8.5 9,180 7,225 1,955 74% 2 Paradip Coal 14 12 60 720 8.5 6,120 4,027 2,093 75% 3 Total 54 28 107 3,000 8.5 25,500 16,991 8,509 12
* debt discounted to FY13. Source: Company data, Credit Suisse estimates
Figure 10: Key assumptions for ports and shipping division FY09 FY10 FY11F FY12F FY13F
Ports
Volumes (mt) 28 29 40 58 75 ASP (Rs/t) 127 142 175 186 189 EBITDA (Rs/t) 96 107 122 132 134 EBITDA (Rs mn) 2,669 3,116 4,838 7,660 10,029 EBITDA margin (%) 75 76 70 71 71
Shipping Sea transportation
Revenue (Rs mn) 10,509 10,282 10,128 10,412 13,747 EBITDA (Rs mn) 3,027 3,227 3,515 3,751 5,499 EBITDA margin (%) 29 31 35 36 40
Surface logistics Revenue (Rs mn) 9,580 10,701 12,806 14,727 16,936 EBITDA (Rs mn) 1,061 706 664 810 931 EBITDA margin (%) 11 7 5.2 5.5 5.5
Oilfield services Revenue (Rs mn) 1,938 5,150 3,609 4,033 7,449 EBITDA (Rs mn) 1,379 2,971 1,948 2,383 4,990 EBITDA margin (%) 71 58 54 59 67
Source: Company data, Credit Suisse estimates

31 March 2011
Essar Shipping Ports and Logistics Ltd (ESRS.BO / ESRS IN) 5
Ports: capacity to double + shift to merchant cargo The Essar Ports division is the second-largest private port in India handling 40 mt of volumes and is on its way to more than double port capacity in the next two years to 158 mt. Volume ramp-up at the port has been steep due to the strong support of captive volumes from the Essar group. We expect a traffic CAGR at the Essar Ports of 38% over the next two years compared to volume growth of 10% for other major ports. The volume ramp-up would further accelerate as the port is now also focussing on tapping merchant cargo to grow beyond group expansion. The merchant cargo volumes are expected to increase to almost one-fourth in the next three years from almost nil currently.
At present, both Vadinar and Hazira ports operate under a take-or-pay contract with the group companies. These are long-term contracts valid for 15 years. These in-house contracts are determined at arms length and are benchmarked with major ports. Despite pricing being closer to major ports, Essar Ports have the highest margin among Indian ports. As merchant volumes ramp up, the margins should further improve as merchant pricing at Hazira is 10% higher than contract pricing and 20% higher at Salaya.
Capacity to more than double in the next two years Essar Ports has operational capacity of 76 mt in Gujarat – 46 mt liquid terminal at Vadinar serving Essar Oil and 30 mt dry bulk cargo at Hazira serving Essar Steel. The company is on its way already to more than double its capacity to 158 mt by FY13. The capacity addition includes 32 mt addition at the current ports (Vadinar – 12 mt and Hazira – 20 mt), setting up a new 20 mt dry bulk terminal at Salaya in Gujarat and 30 mt iron ore and coal berths at Paradip on the East coast (16 mt iron ore and 14 mt coal berth). The mix at the port is changing significantly with the new capacity addition with dry bulk cargo accounting for 85% of the incremental capacity.
Figure 11: Capacity expansion at Essar Ports
-
40
80
120
160
FY11 Vadinar(Apr-11)
Paradip Ore(Oct-11)
FY12 Hazira(Oct-12)
Salaya(Mar-13)
Paradip Coal(Mar-13)
FY13
Vadinar Hazira Salaya Paradip Ore Paradip Coal
12 MT
16 MT 104 MT
20 MT
20 MT14 MT 158 MT
76 MT
Source: Company data
Essar Ports is the second-largest private port in India and is more than doubling its capacity during the next two years
Essar Ports are tapping merchant cargo to grow beyond group expansions
The mix at Essar Ports is changing significantly with the new capacity as dry bulk accounts for 85% of the incremental capacity

31 March 2011
Essar Shipping Ports and Logistics Ltd (ESRS.BO / ESRS IN) 6
Figure 12: Location of Essar Ports
Port Cap acity Customer
Salaya 20 MT Essa r Power
Salaya
Port Capacity Custom er
Hazira-I 30 MT Essar Steel
Hazira-II 20 MT Essar Steel
Hazira
Port Capacity CustomerParadip-I 16 MT Essar Steel
Paradip-I (Iron ore)Port Capacity CustomerParadip-II 14 MT Merchant
Paradip-II (Coal)
Vadinar-I and Hazira-Icurrently operational
Port Capacity Cu stomer
Vadinar-I 46 MT Essar Oi l
Vadinar-II 12 MT Essar Oi l/m erchant
Vadinar
- Essar ports
Source: Company data
Merchant cargo: growth beyond the group expansion Essar Ports has enjoyed strong support from captive volumes of the Essar group, but for strong volume growth it is now also looking at tapping merchant cargo. The major ports are operating at a capacity utilisation of 90% against an optimum utilisation of 70-75%. Therefore, a port that can expand capacity currently should be able to attract cargo. We believe it is an opportune time for Essar Ports to shift part of its capacity to tap the merchant traffic. The company projects that almost one-fourth of its volumes would be from third parties in FY14 with all the ports contributing to merchant traffic (Figure 14).
Merchant volumes would account for 25% of volumes in FY14 compared to nil currently

31 March 2011
Essar Shipping Ports and Logistics Ltd (ESRS.BO / ESRS IN) 7
Figure 13: Volume ramp up at Essar Ports Figure 14: Merchant cargo split in FY14E
0
10
20
30
40
50
60
70
80
FY09 FY10 FY11 FY12 FY13
Volumes
mt
Vadinar
18%
Hazira
24%
Salay a
8%
Paradip Coal
39%
Paradip Ore
11%
Source: Company data, Credit Suisse estimates Source: Credit Suisse estimates
High profitability despite pricing closer to major ports Current operational capacity at the Vadinar and Hazira ports is all used for group captive cargo. The current in-house contracts are take-or-pay contracts valid for 15 years. However, in the transition to IFRS, the duration of long-term contracts may have to be reduced to five years. These in-house contracts are determined at arms length, which is further supported by the fact that the company is using the same pricing mechanism even for merchant cargo at most ports. The merchant pricing is the same at Vadinar and Paradip iron ore terminals, 10% higher at the Hazira port and 20% higher at the Salaya port.
Figure 15: Pricing applicable at Essar Ports Port Pricing, Rs/t (captive) Cargo
Vadinar 190 Crude and petroleum products
Hazira* 200 Iron ore, coal, limestone
Salaya 200 Coal, pet coke
Paradip iron ore 170 Iron ore
Paradip coal 177 Thermal coal
* pricing to increase to Rs 221/t in FY12 after increase of terminal draft to 16 m.
Source: Company data, Credit Suisse estimates
EBITDA margins of Essar Ports are the highest currently among the listed ports in India, namely Mundra Port (MPSE.BO) and Pipavav Port (GPPL.BO). The main reason is dominance of oil volumes in the total traffic handled at the port so far (more than three-fourths of the total volumes YTD were crude and petroleum products). As the volumes from the Hazira port and Paradip iron ore berth ramp up, margins would reduce but would still remain the highest among the listed entities.
However, overall profitability of Essar Ports is lower than the other ports for the same volume handled as its absolute EBITDA/t is lower than the Mundra Port. This is mainly driven by lower pricing, which is benchmarked to the major ports.
Essar Ports has the highest margin among the listed ports in India
Absolute profitability is lower than Mundra Port as Essar’s pricing is benchmarked to major ports

31 March 2011
Essar Shipping Ports and Logistics Ltd (ESRS.BO / ESRS IN) 8
Figure 16: Essar Ports has the highest margin … Figure 17: … but lower EBITDA/t versus Mundra (FY11)
0%
10%
20%
30%
40%
50%
60%
70%
80%
Essar port Mundra Pipav av
EBITDA Margins
0
50
100
150
200
250
Mundra Essar port Pipav av
EBITDA (Rs/t)
Note: Pipavav is actual. Source: Company data, Credit Suisse
estimates
Note: Pipavav is actual. Source: Credit Suisse estimates
FY14 is a crucial year when all the expansions are to become operational
Almost two-third of the incremental capacity becomes operational in 2H13 with Hazira II port coming onstream in October 2012 and Salaya and the Paradip coal project expected to be commissioned in March 2013. Therefore, meaningful impact of the full expansion would be visible only in FY14. Additionally, Hazira II expansion and Paradip coal project are mainly for the merchant traffic and therefore, merchant traffic prior to FY14 would possibly be minimal.
Figure 18: Specification of Essar Ports Capacity Stake Berth Draft Capex Debt Equity Status/
Port (MT) (%) (mts) (mts) ($ mn) (%) (%) COD Customer Cargo Remarks
Vadinar-I 46 100 305 20 641 70 30 Operational Essar Oil Crude + petroleum
SPM is underutilised and can be used for merchant cargo
Vadinar-II 12 100 300 16 240 70 30 Apr-11 Essar Oil Petroleum Expanded capacity to be used for Essar Oil
Hazira-I 30 74 550 14 300 74 26 Operational Essar Steel/ merchant
Iron ore, coal
Stake purchase from Essar Steel – stake to increase to 99%
Hazira-II 20 74 700 16 189 75 25 Oct-12 Essar Steel/ merchant
Coal, Container
Stake purchase from Essar Steel – stake to increase to 99%; yet to get GMB concession approval. Financial closure not yet done.
Salaya 20 100 385 14 238 75 25 Mar-13 Essar Power/ merchant
Coal, pet coke
Stake to be reduced to 74% – stake sale to Essar Power; concession agreement not yet signed, forest clearance pending
Paradip-I 16 44 275 14 114 75 25 Oct-11 Essar Steel Iron ore 10-year license + 5 years extension
Paradip-II 14 75 370 17 124 80 20 Mar-13 Merchant Coal 30-year concession agreement
Source: Company data, Credit Suisse estimates
Vadinar port – Essar Oil has take-or-pay contract for 65% of volumes
The port is located at Vadinar in Jamnagar and provides handling, storage and terminal services for crude oil and petroleum products to Essar Oil refinery at Vadinar. The port has an operational capacity of 46 mt, which is divided into 1) 27mt SPM (crude handling capacity), 2) 7 mt product berth, 3) 7 mt road and rail gantries and 4) 5 mt of intermediate product handling capabilities.
The port is currently operating at 65% utilisation as the current utilisation of Essar Oil refinery is 14.5 mt. Therefore, the underutilisation at Vadinar port is mainly at the single point mooring (SPM) which is currently being operated at just 53% utilisation. This implies that at 80%, the rest of the capacity is adequately utilised. As the Essar oil refinery is expanding its capacity to 18 mt by 2Q12 and to 20 mt by March 2012, the capacity of the
Low utilisation at the Vadinar port is due to underutilisation of SPM
31 March 2011
Essar Shipping Ports and Logistics Ltd (ESRS.BO / ESRS IN) 9
Vadinar port is also being increased from 46 mt to 58 mt by April 2011. The incremental capacity of 12 mt comprises a 7 mt product berth and 5 mt capacity for storage tankers (4 mt) and rail and road gantries (1 mt). With the expanded capacity of the Essar Oil refinery, the SPM utilisation would increase, and additionally, the company is planning to use the balance capacity for merchant cargo.
Under the current contract, Essar oil would ensure a minimum offtake of 37.8 mt out of the 58 mt expanded capacity of the Vadinar port. This includes 16 mt of crude handling, 15.1 mt of finished products and 7.7 mt of intermediate handling.
Hazira port – half of the volumes are under take-or-pay contracts
The Hazira port is located in Gujarat and is currently a 30 mt all-weather deep draft port for the import of iron ore, pellets, coal, limestone and the export of finished steel products. The port currently exclusively serves Essar Steel, which has expanded its steel capacity from 4.5 mt to 10 mt. However, in the second phase of expansion, the new capacity of 20 mt will all be dedicated to the merchant traffic. Hazira would be the only port where Essar Ports would have the container berth, and in fact, Hazira has already started handling containers.
Hazira has a five-year contract with Essar Steel where Essar Steel has guaranteed a minimum volume of 10 mt for FY11 at a pricing of Rs200/t; minimum volume of 18 mt for FY12 at a pricing of Rs221/t and minimum volume of 25 mt in FY13 at Rs221/t. The Hazira port is carrying out dredging activity to increase the draft from 14 m to 16 m and, once achieved, Essar Steel would increase its pricing by Rs21/t, which explains the higher pricing in FY12 and FY13 contracts.
ESPLL currently holds a 74% stake in the Hazira port while the remaining 26% is held by Essar Steel. The concession agreement with the Gujarat Maritime Board requires the anchor customer to hold a 26% stake in the case of a captive port. However, ESPLL is now planning to propose a buy-back of equity shares and issue compulsorily convertible preference shares to Essar steel in order to increase its economic interest in the Hazira port to 99%.
Salaya port – 90% volumes would be captive while 10% would be merchant
The Salaya port is located in Gujarat close to the existing liquid terminal at Vadinar (situated 34 km from the Vadinar refinery plant). The port is planned to be a 20 mt integrated facility for handling coal and pet coke for Essar's power generation plants. The facility would include a dedicated all weather channel, 385-metres long berth, ship loaders and unloaders, storage facilities for cargo, conveyors for transportation of cargo to the stock yard, a rail network, tugs and mooring boats. The company expects the Salaya port to be operational by March 2013. However, we note that the concession agreement has not been signed as yet and the forest clearance is still pending for one stretch of the land.
ESPLL currently holds 100% stake in the Salaya port. However, the stake is expected to be brought down to 74% as 26% stake is sold to Essar Power because the anchor customer needs to hold a 26% stake for a captive terminal for the concession agreement.
Paradip port – iron ore berth is leased for ten years, coal terminal for thirty years
Essar Ports would be operating both iron ore and coal berths at the Paradip port. However, the iron ore berth (16 mt) is licensed for a period of ten years, which is extendible by another five years (depending on mutual consent between Essar Ports and Paradip Port Trust). The iron ore berth would be mainly used for Essar steel requirements, which has put up a 6 mt pelletisation plant in Orissa. Essar Steel currently holds a 56% stake in the iron ore berth.
A consortium under Blue Water Iron Ore Terminal Pvt Ltd (a consortium of Noble Group, Gammon Infrastructure Projects and MMTC) had signed a concession agreement with the Paradip Port Trust to build, operate and transfer an iron ore terminal in July 2009. The concessionaire was to complete the construction of the project within 36 months from the
Essar Oil has a minimum offtake contract of 65% of Vadinar I and II volumes
Margins at the Hazira port would increase in FY12 as it increases the depth of the port to 16 m.
Essar Ports is planning to increase its stake in the Hazira port from 74% to 99%
Forest clearance and concession agreement is pending for the Salaya port
Stake in Salaya would be diluted to 74% as per GMB concession norms
Paradip iron ore berth is licensed to Essar Steel for a period of ten years
31 March 2011
Essar Shipping Ports and Logistics Ltd (ESRS.BO / ESRS IN) 10
date of award of concession. However, the project has faced some delays due to environmental clearances. Once the port is operational, then Essar’s licensed terminal for iron ore cannot operate till the Blue Water Iron Ore berth achieves a critical volume. However, the threshold is less than the existing volumes at the port (to be transferred to the Blue Water Iron Ore berth when it is operational). Therefore, the management of Essar Ports is not very concerned about this.
On the other hand, Essar Ports won the rights to the coal berth (14 mt) through a competitive bid and would operate the berth for 30 years on a build, operate and transfer basis. Essar would also share 31% of its revenue from the coal berth with the Paradip Port Trust. The coal terminal would be Essar’s first entirely merchant terminal. Volume ramp up for the coal terminal should not be an issue as existing volumes from the port would be transferred to the coal terminal when the coal terminal becomes operational. Additionally, presence of new upcoming power plants in the hinterland of the Paradip port ensure that the volume ramp for the coal terminal would be quick.
Essar Ports has won a concession agreement for 30 years for the Paradip coal berth. Construction has not started, pending the forest clearance

31 March 2011
Essar Shipping Ports and Logistics Ltd (ESRS.BO / ESRS IN) 11
Shipping: expansion across the fleet The shipping business comprises three divisions: 1) Sea transportation, which provides crude oil and dry bulk transportation services, 2) Surface logistics, which provides logistics services from ships to ports, lighterage services and 3) Oilfield services, which provide contract drilling services to oil and gas companies. Majority of the clients for sea transportation and surface logistics are group companies while almost 95% of the revenues in the oilfield services come from external customers.
Essar Shipping is expanding its fleet capacity across the three divisions. The fleet capacity in sea transportation would expand by 64% in the next two years to 2.4 mn DWT. Oilfield services, on the other hand, will almost double its capacity with the addition of two jack-up rigs. As a result of the expansions, total earnings of Essar Shipping are expected to grow at a CAGR of 66% over the next two years. We have assumed the current rates to persist for the next two years, and if the day rates pick up, then our estimates have upside risk.
Oilfield serves external clients while transportation is mostly captive ESRS’s shipping business comprise three divisions: 1) sea transportation, which provides crude oil and dry bulk transportation services, 2) surface logistics, which provides end-to-end logistics services from ships to ports, lighterage services, intra-plant logistics and dispatching finished products to the final customer and 3) oilfield services, which provides contract drilling and related services to oil and gas companies worldwide, operating both offshore and onshore.
The key difference between the three divisions is the clients served. The majority of clients for sea transportation and surface logistics are group companies while almost 95% of the revenues in the oilfield services come from external customers. In the sea transportation business, external clients are IOCL (one VLCC chartered out and contract to expire in June 2011), Hanjin Shipping (contracted for one year in January 2011), Baosteel in China (one Capesize vessel dedicated till FY13) and Steel Authority of India (two Supramax vessels dedicated). The semi-submersible rig in the oilfield division accounts for almost 85% profits and has served GSPC in the Krishna-Godavari basin block KG-19 and is now serving Viestovpetro in Vietnam for drilling a 4,800 metre offshore well.
60% plus capacity expansion in sea transportation …
Essar Shipping is expanding its fleet in both sea transportation and oil field services divisions. In sea transportation, the current capacity is 1.47 mn DWT, which would expand to 2.42 mn DWT by the end of FY13 as six mini capes are delivered in FY12 (by STX of Korea) and six Supramaxes are delivered by FY13 (by ABG shipyard in India). These vessels will increase overall capacity by 64% over the next two years. These twelve new ships would be owned by the holding company and leased to Essar Shipping. Therefore, Essar Shipping will not incur capex on the twelve new ships but will pay lease rental to the holding company. The total capex by the holding company is US$630 mn and almost 37% capex has been spent so far.
… while oilfield services is almost doubling up its capacity
Oilfield services is also expanding by adding two jack-up rigs (construction ongoing at ABG shipyard) for US$500 mn. The first jack-up rig is expected to be delivered by 4Q12 and the second one by 2Q13. These rigs have drilling depth up to 350 metres. ABG shipyard is building these rigs at its yard at Dahej, Gujarat, with the help of designs provided by Friede & Goldman.
Sea transportation is increasing its fleet size by 64% while oilfield is almost doubling its capacity
Expansion should result in shipping earnings increasing at a 66% CAGR over the next two years
The twelve new ships will not be owned by Essar Shipping but by the holding company

31 March 2011
Essar Shipping Ports and Logistics Ltd (ESRS.BO / ESRS IN) 12
Figure 19: Existing assets in the shipping business Figure 20: Expanded assets in FY13
1 semi-sub, 12
onshore rigs
Sea+ Land
Logistics
26 v essels,
1.47 mn DWT
Sea transportation Surface logistics Oilfield serv ice
1 semi-sub, 12
onshore, 2 jack-
up rigsSea+ Land
Logistics
38 v essels,
2.5 mn DWT
Sea transportation Surface logistics Oilfield serv ice
Source: Company data, Credit Suisse estimates Source: Company data, Credit Suisse estimates
Shipping earnings CAGR of 66% to FY13 As the 12 new ships in sea transportation are delivered and deployed in FY13 and the two new jack-up rigs also contribute to earnings, we expect FY13 EBITDA to increase 65% YoY. We have assumed day rates of US$240,000 for the semi-submersible rig and a day rate of US$140,000 for the jack-up rigs.
Figure 21: EBITDA to increase significantly in FY13 Figure 22: EBITDA composition in the shipping division
0
5,000
10,000
15,000
20,000
25,000
30,000
35,000
40,000
45,000
FY09 FY10 FY11 FY12 FY13
Sales EBITDA
Rs mn2 Jack up rigs deliv ered + 12
new ships deploy ed
0%
20%
40%
60%
80%
100%
FY09 FY10 FY11 FY12 FY13
Sea transportation Surface logistics Oilfield serv ices
Source: Company data, Credit Suisse estimates Source: Company data, Credit Suisse estimates
Oilfield services has the highest margin among the three divisions (Figure 23). The management is of the view that the margin of the sea transportation business is closer to oilfield services; however, the reported margins are lower as the company carries out lower-margin inchartering activities. The company expects inchartering revenues to almost double in the next two years as group cargo handled ramps up. Surface logistics is a low-margin business where the margins are in low single digits.
Credit Suisse expects oil prices to remain high in the medium term (Figure 24). At this oil price, capex on oil exploration is likely to remain healthy and therefore benefit day rates and utilisation of both the semi-submersible rig and the two jack-up rigs.

31 March 2011
Essar Shipping Ports and Logistics Ltd (ESRS.BO / ESRS IN) 13
Figure 23: Division-wise EBITDA margin (FY11) Figure 24: Oilfield daily rates to benefit from high oil price
0%
10%
20%
30%
40%
50%
60%
Oilfield serv ices Sea transportation Surface logistics
$0
$20
$40
$60
$80
$100
$120
2009A 2010A 2011E 2012E 2013E 2014E 2015E
WTI
Source: Company data, Credit Suisse estimates Source: Bloomberg, Credit Suisse estimates

31 March 2011
Essar Shipping Ports and Logistics Ltd (ESRS.BO / ESRS IN) 14
OUTPERFORM, target price Rs108 Essar Shipping and Essar Ports are both currently at an inflection point with steep earnings growth expected in the next two years. Consolidated earnings should post a CAGR of 110% over the next two years as contracted volumes at the ports ramp up and new ships and rigs are deployed. We are comfortable valuing the port business on FY13 as the take-or-pay contracts with the group companies assure a strong volume ramp-up. Similarly, we value shipping on FY13 as long-term contracts on sea transportation reduce near-term cyclicality. We value the port division at the regional port multiple of 16x P/E for FY13 and the shipping division at 9x FY13 EPS to arrive at target price of Rs108. We have not built in upside from Hazira II, Salaya and the Paradip coal terminal, as the concession agreement for the first two and forest clearances for Salaya and Paradip are pending.
Demerger into ports and shipping provides investors with an option to select either Essar Ports or Essar Shipping, an option unavailable in the integrated company this far. The port business has now turned profitable and has sufficient scale to be separated into a standalone entity. Thus, we expect port earnings to gain more visibility post the demerger. Leverage at both ports and shipping is high; however, we are comforted by the long-term nature of the contracts in both the divisions. We do not expect equity dilution for the expansions as internal cashflow is likely to be sufficient to fund equity capex.
Consolidated EPS: CAGR of 110% over next two years Essar Ports have been lossmaking so far due to high interest pay out. However, with the commissioning of the Hazira port in May 2010 and increase in rates of the Vadinar port, the ports operations have turned profitable. As volumes at the Hazira port ramps up from 10 mt in FY11 to 25 mt in FY13 and the Paradip iron ore berth also becomes operational in FY12, we expect ports earnings to overshadow shipping earnings in FY13. The crucial year for the ports operation is FY14, when all the projects become operational including Hazira II (20 mt), Salaya port (20 mt) and the Paradip coal terminal (14 mt).
Figure 25: Consolidated EPS split – ports turn profitable
in FY11F
Figure 26: Volume and margin pick-up in ports offset high
interest payout
-2
0
2
4
6
8
10
2009 2010 2011F 2012F 2013F
Ports Shipping
Rs/share
0
10
20
30
40
50
60
70
80
FY09 FY10 FY11 FY12 FY13
50
60
70
80
90
100
110
120
130
140
Volumes (mt, LHS) EBITDA (Rs/t)
mt Rs/t
Source: Company data, Credit Suisse estimates Source: Company data, Credit Suisse estimates
Ports account for 70% of our target price We value both the ports and the shipping division using FY13 P/E multiples based on regional ports and shipping companies averages. We are comfortable valuing the port business on FY13 as the take-or-pay contracts with the group companies assure strong volume ramp up. Similarly, we value the shipping business on FY13 as long-term contracts on sea transportation reduce near-term cyclicality. Ports account for 70% of our target price.
Consolidated earnings should post a CAGR of 110% over the next two years
Port earnings are expected to gain more visibility post the demerger
Volume ramp-up and increase in prices has resulted in sharp acceleration in port earnings
Ports account for 70% of our target price

31 March 2011
Essar Shipping Ports and Logistics Ltd (ESRS.BO / ESRS IN) 15
Figure 27: Sum of the parts FY13 P/E Value
Division EPS multiple (x) (Rs/share) Remarks
Ports 4.9 16.0 78 Average multiple based on regional ports average
Shipping 3.3 9.0 30 Average multiple based on regional shipping companies and drillers
Total 8.2 13.2 108
Source: Company data, Credit Suisse estimates
Take or pay contracts provide stability to the port business
We value the ports division on FY13 earnings as the take-or-pay contract with Essar Steel in the Hazira port and Essar Oil in the Vadinar port would ensure that volumes in the Hazira port increase to at least 25 mt in FY13 (from 10 mt in FY10) and to at least 37.8 mt in the Vadinar port (29 mt in FY10). We are not currently assigning any value to the three projects – Hazira II (20 mt), Salaya port (20 mt) and Paradip coal terminal (14 mt) – as the GMB concession agreement is yet to be signed for Hazira II and Salaya and forest clearance is still pending for Salaya and the Paradip coal terminal. Additionally, these projects become operational in FY14 and hence it is early to value them. We note that volume ramp up for the Paradip coal terminal would be quick when it commissions as the existing coal volumes of almost 10 mt at Paradip would be transferred to the coal terminal.
However, if we were to value the three expansions when these projects get environmental clearance and signs GMB concession agreements, the upside could be Rs12 per share (Figure 28).
Figure 28: Upside from Hazira II, Salaya and Paradip coal commissioning – option value of Rs12 per share Capacity FY14 vol EBITDA EBITDA EV/EBITDA EV Debt* Mcap Stake Value
(mt) (mt) (Rs/t) (Rs mn) (x) (Rs mn) (Rs mn) (Rs mn) (%) (Rs/sh)
Hazira II 20 8 150 1,200 8.5 10,200 5,739 4,461 99 7
Salaya 20 8 135 1,080 8.5 9,180 7,225 1,955 74 2
Paradip Coal 14 12 60 720 8.5 6,120 4,027 2,093 75 3
Total 54 28 107 3,000 8.5 25,500 16,991 8,509 12
Source: Company data, Credit Suisse estimates, * debt discounted to FY13
Regionally, the port companies trade at a FY12 P/E multiple of 18x. Since we are using FY13 as our base year for the port business, we value FY13 port EPS at 16x P/E (discounting FY12 multiple by cost of capital) to get a port valuation of Rs78 per share.
We value ports on FY13 earnings due to contracted traffic

31 March 2011
Essar Shipping Ports and Logistics Ltd (ESRS.BO / ESRS IN) 16
Figure 29: Regional port valuation table US $ mn EBITDA Net P/E P/B ROE EV/EBITDA M Revenue margin (%) profit (x) (x) (%) (x) 30-Mar-11 cap FY11 FY12 FY11 FY12 FY11 FY12 FY11 FY12 FY11 FY12 FY11 FY12 FY11 FY12
Hong Kong ports China Merchants 10,278 576 673 74 77 541 580 18.8 17.6 2.2 2.1 12 12 26.9 22.4 Tianjin Port 1,485 2,231 2,505 18 18 92 108 16.1 13.4 1.1 1.1 7 8 5.6 4.4 Dalian Port 2,419 538 590 45 46 144 162 11.6 10.3 0.8 0.8 7 8 10.7 9.3 Xiamen International Port 559 367 400 28 30 52 57 10.8 9.8 0.9 0.9 8 9 4.2 3.5 Average 31 33 17.8 16.3 1.5 1.5 9 9 14.4 12.3 China ports Shanghai International Port 13,176 3,204 3,486 50 51 700 738 16.5 14.9 2.1 2.0 13 13 8.4 7.5 Tianjin Port 2,238 1,872 1,928 19 21 145 167 15.5 13.5 1.4 1.2 9 9 8.8 8.0 Rizhao Port 1,484 458 538 36 34 67 79 22.6 18.7 2.0 1.8 9 10 12.0 10.6 Shenzhen Yantian Port 1,476 65 68 72 78 20.1 19.1 2.1 2.1 11 11 18.7 17.7 Average 39 40 18.7 17.3 2.0 1.8 10 11 9.0 8.1 Regional players DP World 9,960 3,110 3,402 42 44 409 535 24.0 18.8 1.3 1.3 5 7 11.6 9.5 Mundra Port and SEZ 6,200 430 624 66 67 188 295 32.6 20.9 6.7 5.3 21 25 23.9 16.4 International Container 1,851 599 662 47 49 112 136 16.7 13.6 2.8 2.4 17 18 7.6 6.8 Bintulu Holdings 879 160 166 50 52 50 52 17.6 17.3 3.1 3.1 17 18 9.9 9.5 Forth Ports 1,204 307 327 35 35 45 51 26.3 23.5 2.9 2.7 11 12 14.8 13.8 Port of Tauranga 821 139 147 53 53 42 46 19.8 18.0 1.6 1.6 8 9 13.3 12.4 NCB Holdings 635 325 342 36 37 47 52 13.2 12.5 1.0 1.0 8 8 3.1 3.1 Average 45 46 24.1 18.5 2.0 1.8 8 10 12.4 10.2
Source: Company data, Bloomberg consensus estimates
Value Essar Shipping at Rs30 per share
Essar Shipping has an interesting combination of long-term captive contracts in the sea transportation business and short-term contracts in the oilfield services business. Therefore, despite high leverage and interest cost, the shipping division has been profitmaking till now. We value the shipping business at FY13 earnings when the twelve new ships will be delivered in the sea transportation business and the two jack-up rigs will be deployed in the oilfields segment. We value the shipping business at 9x FY13 earnings at Rs30/share. Our target multiple is based on an average of the multiples for the shipping and the oilfield services companies regionally (Figure 30 and Source: Company data, Bloomberg consensus estimates
Figure 31) as Oilfield services and Sea transportation divisions are expected to contribute almost equally in FY13.
We value the shipping business at the average of shipping and drilling multiples
31 March 2011
Essar Shipping Ports and Logistics Ltd (ESRS.BO / ESRS IN) 17
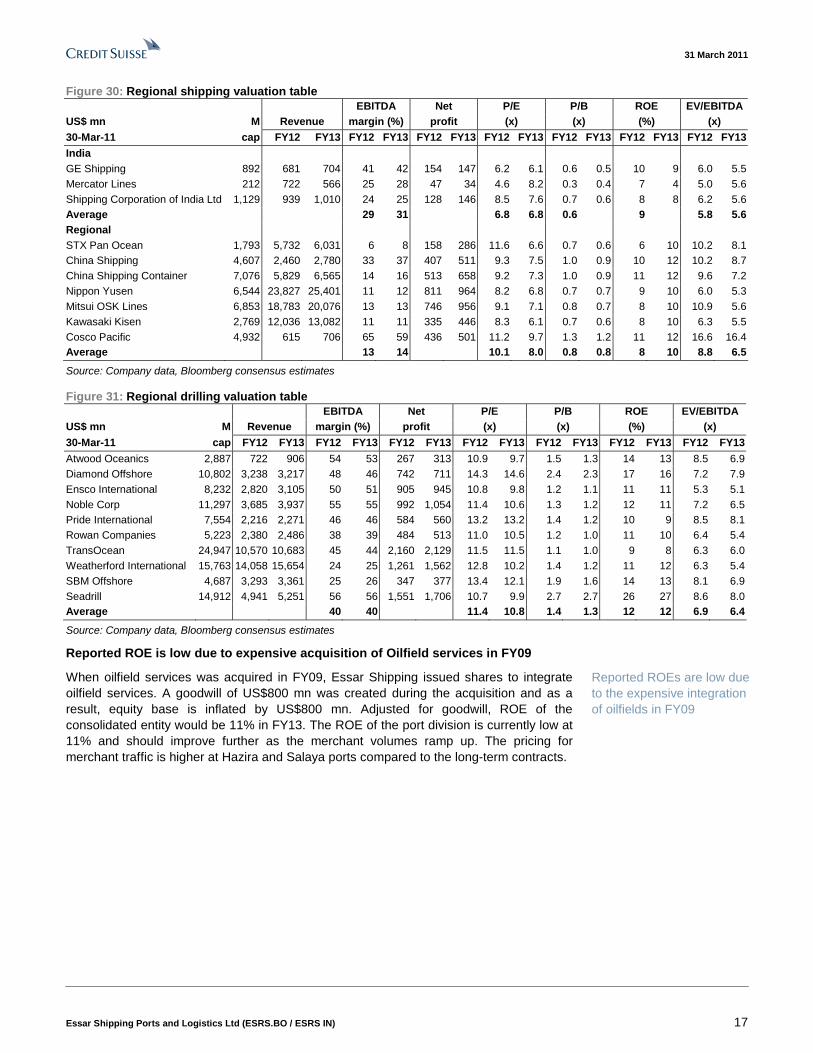
Figure 30: Regional shipping valuation table EBITDA Net P/E P/B ROE EV/EBITDA US$ mn M Revenue margin (%) profit (x) (x) (%) (x) 30-Mar-11 cap FY12 FY13 FY12 FY13 FY12 FY13 FY12 FY13 FY12 FY13 FY12 FY13 FY12 FY13
India GE Shipping 892 681 704 41 42 154 147 6.2 6.1 0.6 0.5 10 9 6.0 5.5 Mercator Lines 212 722 566 25 28 47 34 4.6 8.2 0.3 0.4 7 4 5.0 5.6 Shipping Corporation of India Ltd 1,129 939 1,010 24 25 128 146 8.5 7.6 0.7 0.6 8 8 6.2 5.6 Average 29 31 6.8 6.8 0.6 9 5.8 5.6 Regional STX Pan Ocean 1,793 5,732 6,031 6 8 158 286 11.6 6.6 0.7 0.6 6 10 10.2 8.1 China Shipping 4,607 2,460 2,780 33 37 407 511 9.3 7.5 1.0 0.9 10 12 10.2 8.7 China Shipping Container 7,076 5,829 6,565 14 16 513 658 9.2 7.3 1.0 0.9 11 12 9.6 7.2 Nippon Yusen 6,544 23,827 25,401 11 12 811 964 8.2 6.8 0.7 0.7 9 10 6.0 5.3 Mitsui OSK Lines 6,853 18,783 20,076 13 13 746 956 9.1 7.1 0.8 0.7 8 10 10.9 5.6 Kawasaki Kisen 2,769 12,036 13,082 11 11 335 446 8.3 6.1 0.7 0.6 8 10 6.3 5.5 Cosco Pacific 4,932 615 706 65 59 436 501 11.2 9.7 1.3 1.2 11 12 16.6 16.4 Average 13 14 10.1 8.0 0.8 0.8 8 10 8.8 6.5
Source: Company data, Bloomberg consensus estimates
Figure 31: Regional drilling valuation table EBITDA Net P/E P/B ROE EV/EBITDA US$ mn M Revenue margin (%) profit (x) (x) (%) (x)
30-Mar-11 cap FY12 FY13 FY12 FY13 FY12 FY13 FY12 FY13 FY12 FY13 FY12 FY13 FY12 FY13
Atwood Oceanics 2,887 722 906 54 53 267 313 10.9 9.7 1.5 1.3 14 13 8.5 6.9 Diamond Offshore 10,802 3,238 3,217 48 46 742 711 14.3 14.6 2.4 2.3 17 16 7.2 7.9 Ensco International 8,232 2,820 3,105 50 51 905 945 10.8 9.8 1.2 1.1 11 11 5.3 5.1 Noble Corp 11,297 3,685 3,937 55 55 992 1,054 11.4 10.6 1.3 1.2 12 11 7.2 6.5 Pride International 7,554 2,216 2,271 46 46 584 560 13.2 13.2 1.4 1.2 10 9 8.5 8.1 Rowan Companies 5,223 2,380 2,486 38 39 484 513 11.0 10.5 1.2 1.0 11 10 6.4 5.4 TransOcean 24,947 10,570 10,683 45 44 2,160 2,129 11.5 11.5 1.1 1.0 9 8 6.3 6.0 Weatherford International 15,763 14,058 15,654 24 25 1,261 1,562 12.8 10.2 1.4 1.2 11 12 6.3 5.4 SBM Offshore 4,687 3,293 3,361 25 26 347 377 13.4 12.1 1.9 1.6 14 13 8.1 6.9 Seadrill 14,912 4,941 5,251 56 56 1,551 1,706 10.7 9.9 2.7 2.7 26 27 8.6 8.0 Average 40 40 11.4 10.8 1.4 1.3 12 12 6.9 6.4
Source: Company data, Bloomberg consensus estimates
Reported ROE is low due to expensive acquisition of Oilfield services in FY09
When oilfield services was acquired in FY09, Essar Shipping issued shares to integrate oilfield services. A goodwill of US$800 mn was created during the acquisition and as a result, equity base is inflated by US$800 mn. Adjusted for goodwill, ROE of the consolidated entity would be 11% in FY13. The ROE of the port division is currently low at 11% and should improve further as the merchant volumes ramp up. The pricing for merchant traffic is higher at Hazira and Salaya ports compared to the long-term contracts.
Reported ROEs are low due to the expensive integration of oilfields in FY09

31 March 2011
Essar Shipping Ports and Logistics Ltd (ESRS.BO / ESRS IN) 18
Figure 32: Adjusted ROE of ports and shipping divisions
-10%
-5%
0%
5%
10%
15%
20%
25%
30%
35%
40%
2008 2009 2010 2011F 2012F 2013F
Ports Shipping Consolidated
Source: Company data, Credit Suisse estimates
Demerger into ports and shipping: ports operations have now turned profitable
ESRS has obtained stock exchange approvals and high court approvals for demerger into two separate companies, namely, Essar Ports and Essar Shipping. The share capital would be split in the ratio of 2:1. For every three shares of ESPLL held, the shareholders would get two shares of Essar Ports and one share of Essar Shipping. Ports operations were loss making till FY10 but now has not only turned profitable but also has acquired a sufficient scale to be separated into a standalone listed entity. The demerger provides investors with an option to select one from among Essar Ports or Essar Shipping, a choice unavailable till now in the integrated company.
Stretched balance sheet remains a concern…
ESRS has been in the expansion mode both in the shipping and the ports business in the last four years, which has resulted in a high leverage ratio (Figure 33 and Figure 34). The high leverage is not expected to reduce significantly till FY13 also but the captive nature of most earnings reduces the impact of high leverage on profits. Out of the outstanding debt, as of 31 December 2010, 54% is in the shipping business while 46% is in the ports business. We expect debt in the ports business to increase further as the capex on Hazira II expansion, Salaya and Paradip coal projects pick up.
Leverage is high at both ports and shipping division but the contracted nature of earnings reduces the impact on profits

31 March 2011
Essar Shipping Ports and Logistics Ltd (ESRS.BO / ESRS IN) 19
Figure 33: Net debt/EBITDA has been consistently high Figure 34: Net debt/ net worth* has been high too
0x
2x
4x
6x
8x
10x
12x
2007 2008 2009 2010 2011F 2012F 2013F
Net Debt / EBITDA
0%
50%
100%
150%
200%
250%
300%
2007 2008 2009 2010 2011F 2012F 2013F
Net Debt / Netw orth
Source: Company data, Credit Suisse estimates *excludes goodwill
Source: Company data, Credit Suisse estimates
… though internal cashflow sufficient to fund equity capex
We believe Essar Ports and Essar Shipping both do not need to raise external equity to fund the equity portion of their expansion capex. The twelve new ships under sea transportation would be owned by the holding company and therefore Essar Shipping will have to fund capex of the two jack-up rigs, which can be funded by internal cash generation. Similarly, Essar Ports needs to fund US$122 mn as equity capex over the next two years (adjusted for the stake), which could be funded by internal cashflows.
However, the current stake of promoters is 83.7% and above the minimum public shareholding guidelines. Therefore, if the promoters use equity dilution to reduce their holdings to 75%, some debt could be reduced in the company.
Figure 35: Equity capex required in next two years … Figure 36: … could be funded by cashflow generation
-
50
100
150
200
250
300
Hazira-II Salay a Paradip-I Paradip-II Jack up
rigs
Total
Equity funding required
$ mn
-
50
100
150
200
250
FY11 FY12 FY13
Cashflow from Operations
$ mn
Source: Company data, Credit Suisse estimates Source: Credit Suisse estimates
Promoters have a high stake of 83.7%, which may be reduced to 75% in the next two years

31 March 2011
Essar Shipping Ports and Logistics Ltd (ESRS.BO / ESRS IN) 20
Risks ■ Decline in oil prices impact both the day rates and utilisation of semi-submersible
and jack-up rigs. Oilfield services mostly caters to external clients and does not operate on long-term contracts.
■ Delay in delivery of new ships and jack-up rigs: ABG shipyard is building jack-up rigs for Essar Shipping with the first rig delivery scheduled for 4Q12 and the second rig for 2Q13. Also, twelve new ships from ABG shipyard and STX, Dalian are scheduled for delivery in FY12 and FY13. Any delay in timelines here could impact our valuations.
■ Delay in approvals in port expansion: Forest clearance is pending for Salaya and Paradip coal terminals and financial closure for Hazira II has not yet been achieved. Berth construction requires at least 18 months to two years, and therefore, if the approvals are not achieved in the next six months to one year, the capacity expansion at Salaya, Hazira and Paradip may get delayed.
■ Take or pay contracts not yet tested: Volume ramp up at both Vadinar and Hazira ports depends on expansion at Essar oil and Essar steel. Any delay in expansions at group companies would impact volumes at Essar Ports. Although the contracts are take or pay, they have not been tested so far.
■ Essar ports have handled only captive cargo so far: Essar ports plan to ramp up the merchant volumes to one-fourth of the total volumes by FY14 but the company has experience of handling only captive cargo till now. The complexity of operations increases in the case of merchant cargo as the number of customers and the variety of cargo handled increase. Moreover, merchant cargo volumes are not as predictable as captive volumes are.

31 March 2011
Essar Shipping Ports and Logistics Ltd (ESRS.BO / ESRS IN) 21
Financials Figure 37: Income statement Year-end 31 Mar (Rs mn) 2008 2009 2010 2011E 2012E 2013E
Revenues 18,424 25,742 29,994 32,928 39,974 52,315
Expenses 14,604 17,397 19,856 21,904 25,371 30,865
EBIT 1,606 4,567 5,669 6,219 8,766 14,484
Depreciation 2,215 3,778 4,469 4,805 5,837 6,966
EBITDA 3,821 8,345 10,138 11,024 14,603 21,450
Non-operating income 1,467 (3,324) (4,447) (4,555) (5,903) (7,941)
Profit before tax 3,073 1,243 1,222 1,664 2,863 6,543
Income tax 437 471 270 432 573 1,309
Net profit 2,774 772 938 995 2,274 5,043
EPS (Rs) 7 2 2 2 4 8
Source: Company data, Credit Suisse estimates
Figure 38: Balance sheet Year-end 31 Mar (Rs mn) 2008 2009 2010 2011E 2012E 2013E
Cash and equivalents 3,239 6,353 6,913 9,097 6,947 12,091
Receivables 1,998 5,049 5,192 5,699 6,919 9,055
Inventory 356 1,502 1,460 1,603 1,946 2,547
Other current assets 4,846 6,517 11,870 13,031 15,819 20,703
Total current assets 10,439 19,421 25,435 29,430 31,632 44,396
Net fixed assets 68,931 135,111 147,795 158,748 181,225 178,031
Other assets 0 116 27 27 27 27
Total other assets 68,954 135,249 147,844 158,797 181,274 178,081
Total assets 79,393 154,671 173,279 188,227 212,906 222,477
Payables 1,559 6,643 5,821 6,390 7,758 10,153
Other current liabilities 941 713 5,183 5,689 6,907 9,039
Total current liabilities 2,499 7,356 11,003 12,079 14,664 19,192
Long term liabilities 41,890 67,714 75,297 88,534 108,354 108,354
Total other liabilities 41,890 67,714 75,297 88,534 108,354 108,354
Total liabilities 44,389 75,070 86,301 100,613 123,019 127,546
Share capital 4,262 6,158 6,158 6,158 6,158 6,158
Share premium 2,966 42,429 42,429 42,429 42,429 42,429
Retained earnings 12,582 13,281 13,633 14,627 16,901 21,944
Others 15,193 13,402 13,113 12,754 12,754 12,754
Total equity 35,004 79,601 86,979 87,614 89,887 94,931
Total liabilities and equity 79,393 154,671 173,279 188,227 212,906 222,477
Source: Company data, Credit Suisse estimates
Figure 39: Cash flow statement Year-end 31 Mar (Rs mn) 2008 2009 2010 2011E 2012E 2013E
Net profit 2,774 772 938 995 2,274 5,043
Depreciation 2,215 3,778 4,469 4,805 5,837 6,966
Working capital change (1,912) (1,012) (1,806) (735) (1,766) (3,094)
Operating cash flow 3,077 3,538 3,601 5,064 6,345 8,916
Change in fixed assets (13,512) (33,463) (17,153) (15,758) (28,315) (3,772)
Change in other assets (13,780) (36,611) 89 0 0 0
Change in investments 0 0 0 0 0 0
Investment cash flow (27,292) (70,074) (17,064) (15,758) (28,315) (3,772)
Change in gross debt 8,835 25,825 7,583 13,237 19,821 0
Change in equity 3,066 43,822 6,081 (0) 0 0
Financing cash flow 11,901 69,647 13,664 13,237 19,821 0
Total cash flow (12,314) 3,110 201 2,543 (2,149) 5,144
Source: Company data, Credit Suisse estimates

31 March 2011
Essar Shipping Ports and Logistics Ltd (ESRS.BO / ESRS IN) 22
Companies Mentioned (Price as of 30 Mar 11) ABG Shipyard (ABGS.BO, Rs365.00) Atwood Oceanics Ord (ATW.N, $45.82) Baoshan Iron & Steel (600019.SS, Rmb7.18, OUTPERFORM, TP Rmb10.20) Bintulu Port Holding Ord (BPOT.KL, RM6.65) China Merchant Holdings (0144.HK, HK$33.00, OUTPERFORM, TP HK$39.00) China Shipping Container Lines Company Ltd (2866.HK, HK$3.08, OUTPERFORM, TP HK$4.20) China Shipping Development (1138.HK, HK$8.78, NEUTRAL [V], TP HK$9.20) COSCO Pacific (1199.HK, HK$14.26, OUTPERFORM, TP HK$17.30) Dalian Port (PDA) Co (2880.HK, HK$3.02, NEUTRAL, TP HK$3.60) Diamond Offshore Drilling Ord (DO.N, $78.69) DP World (DPW.DI, $.60, OUTPERFORM [V], TP $.82) Ensco Adr Repstg One Cl A Ord (ESV.N, $58.44) Essar Energy Plc (ESSR.L, 475.00 p, OUTPERFORM [V], TP 566.00 p) Essar Oil (ESRO.BO, Rs122.40, NEUTRAL [V], TP Rs155.00) Essar Shipping Ports and Logistics Ltd (ESRS.BO, Rs91.20, OUTPERFORM, TP Rs108) Forth Ports Ord (FPT.L, 16.34 p) Great Offsh Ord B (GOFS.BO, Rs256.3) Gujarat State Petronet Ord (GSPT.NS, Rs99.95) Hanjin Shipping Ord (117930.KS, W33650) Indian Oil Corp Limited (IOC.BO, Rs324.60, NEUTRAL, TP Rs388.00) Int'l Container Terminal Inc. (ICT.PS, P41.55) Kawasaki Kisen Ord (9107.T, ¥304) Mercator Lines Ord B (MRCT.BO, Rs39.1) Mundra Port and Special Economic Zone (MPSE.BO, Rs136.25, NEUTRAL, TP Rs180.00) Ncb Holdings Ord (NPOT.KL, RM4.1) Nippon Yusen Ord (9101.OS, ¥317) Noble Ord (NE.N, $46.12) Port of Tauranga (POT.NZ, NZ$8.19) Pride Intl Ord (PDE.N, $43.18) Rizhao Port Co Ltd (600017.SS, Rmb4.20) Rowan Companies Ord (RDC.N, $42.89) SBM Offshore (SBMO.AS, Eu20.22, OUTPERFORM, TP Eu17.50, MARKET WEIGHT) Seadrill Ord (SDRL.OL, NKr203.6) Shanghai International Port Group (600018.SS, Rmb4.14, NEUTRAL, TP Rmb4.86) Shipping Corporation (SCI.BO, Rs108.80) Steel Authority of India Ltd (SAIL.BO, Rs169.10, UNDERPERFORM, TP Rs150.00) STX OSV Holdings Ltd (STXO.SI, S$1.20, OUTPERFORM [V], TP S$1.55, UNDERWEIGHT) STX Pan Ocean (STXPx.SI, S$11.12, NEUTRAL, TP S$12.35) Tianjin Port (Group) Co., Ltd. (600717.SS, Rmb8.64) Tianjin Port Developments Holdings Ltd (3382.HK, HK$1.89, NEUTRAL, TP HK$1.99) Transocean Ord (RIG.N, $78.95) Weatherford Intl Ord (WFT.N, $22.14) Xiamen International Port Co. (3378.HK, HK$1.58, OUTPERFORM, TP HK$1.95) Yantian Port Ord A (000088.SZ, Rmb7.66)
Disclosure Appendix Important Global Disclosures Anubhav Aggarwal & Abhishek Bansal each certify, with respect to the companies or securities that he or she analyzes, that (1) the views expressed in this report accurately reflect his or her personal views about all of the subject companies and securities and (2) no part of his or her compensation was, is or will be directly or indirectly related to the specific recommendations or views expressed in this report.
See the Companies Mentioned section for full company names.

31 March 2011
Essar Shipping Ports and Logistics Ltd (ESRS.BO / ESRS IN) 23
3-Year Price, Target Price and Rating Change History Chart for ESRS.BO ESRS.BO Closing
Price Target
Price
Initiation/ Date (Rs) (Rs) Rating Assumption
0
20
40
60
80
100
120
140
160
180
31-M
ar-08
31-May-
08
31-Ju
l-08
30-Sep-
08
30-Nov-0
8
31-Ja
n-09
31-Mar-0
9
31-M
ay-09
31-Jul
-09
30-Se
p-09
30-Nov-
09
31-Jan
-10
31-Mar-1
0
31-M
ay-10
31-Jul-1
0
30-Sep-1
0
30-Nov-
10
31-Jan
-11
Closing Price Target Price Initiation/Assumption Rating
Rs
O=Outperform; N=Neutral; U=Underperform; R=Restricted; NR=Not Rated; NC=Not Covered
The analyst(s) responsible for preparing this research report received compensation that is based upon various factors including Credit Suisse's total revenues, a portion of which are generated by Credit Suisse's investment banking activities. Analysts’ stock ratings are defined as follows: Outperform (O): The stock’s total return is expected to outperform the relevant benchmark* by at least 10-15% (or more, depending on perceived risk) over the next 12 months. Neutral (N): The stock’s total return is expected to be in line with the relevant benchmark* (range of ±10-15%) over the next 12 months. Underperform (U): The stock’s total return is expected to underperform the relevant benchmark* by 10-15% or more over the next 12 months. *Relevant benchmark by region: As of 29th May 2009, Australia, New Zealand, U.S. and Canadian ratings are based on (1) a stock’s absolute total return potential to its current share price and (2) the relative attractiveness of a stock’s total return potential within an analyst’s coverage universe**, with Outperforms representing the most attractive, Neutrals the less attractive, and Underperforms the least attractive investment opportunities. Some U.S. and Canadian ratings may fall outside the absolute total return ranges defined above, depending on market conditions and industry factors. For Latin American, Japanese, and non-Japan Asia stocks, ratings are based on a stock’s total return relative to the average total return of the relevant country or regional benchmark; for European stocks, ratings are based on a stock’s total return relative to the analyst's coverage universe**. For Australian and New Zealand stocks a 22% and a 12% threshold replace the 10-15% level in the Outperform and Underperform stock rating definitions, respectively, subject to analysts’ perceived risk. The 22% and 12% thresholds replace the +10-15% and -10-15% levels in the Neutral stock rating definition, respectively, subject to analysts’ perceived risk. **An analyst's coverage universe consists of all companies covered by the analyst within the relevant sector. Restricted (R): In certain circumstances, Credit Suisse policy and/or applicable law and regulations preclude certain types of communications, including an investment recommendation, during the course of Credit Suisse's engagement in an investment banking transaction and in certain other circumstances. Volatility Indicator [V]: A stock is defined as volatile if the stock price has moved up or down by 20% or more in a month in at least 8 of the past 24 months or the analyst expects significant volatility going forward.
Analysts’ coverage universe weightings are distinct from analysts’ stock ratings and are based on the expected performance of an analyst’s coverage universe* versus the relevant broad market benchmark**: Overweight: Industry expected to outperform the relevant broad market benchmark over the next 12 months. Market Weight: Industry expected to perform in-line with the relevant broad market benchmark over the next 12 months. Underweight: Industry expected to underperform the relevant broad market benchmark over the next 12 months. *An analyst’s coverage universe consists of all companies covered by the analyst within the relevant sector. **The broad market benchmark is based on the expected return of the local market index (e.g., the S&P 500 in the U.S.) over the next 12 months. Credit Suisse’s distribution of stock ratings (and banking clients) is:
Global Ratings Distribution Outperform/Buy* 46% (62% banking clients) Neutral/Hold* 41% (58% banking clients) Underperform/Sell* 11% (50% banking clients) Restricted 2%
*For purposes of the NYSE and NASD ratings distribution disclosure requirements, our stock ratings of Outperform, Neutral, and Underperform most closely correspond to Buy, Hold, and Sell, respectively; however, the meanings are not the same, as our stock ratings are determined on a relative basis. (Please refer to definitions above.) An investor's decision to buy or sell a security should be based on investment objectives, current holdings, and other individual factors.
Credit Suisse’s policy is to update research reports as it deems appropriate, based on developments with the subject company, the sector or the market that may have a material impact on the research views or opinions stated herein.
Credit Suisse's policy is only to publish investment research that is impartial, independent, clear, fair and not misleading. For more detail please refer to Credit Suisse's Policies for Managing Conflicts of Interest in connection with Investment Research: http://www.csfb.com/research-and-analytics/disclaimer/managing_conflicts_disclaimer.html

31 March 2011
Essar Shipping Ports and Logistics Ltd (ESRS.BO / ESRS IN) 24
Credit Suisse does not provide any tax advice. Any statement herein regarding any US federal tax is not intended or written to be used, and cannot be used, by any taxpayer for the purposes of avoiding any penalties.
See the Companies Mentioned section for full company names. Price Target: (12 months) for (ESRS.BO) Method: Our target price of Rs 108 is based on sum of the parts valuation. We value the ports business at Rs 78/share at regional port average multiple of 16x earnings for financial year 2013 and value the shipping business at 9x financial year 2013 earnings. Our multiple for the shipping business is average of the regional multiple for the shipping and the drilling companies. Risks: Risks to our target price of Rs 108 include 1) Decline in oil prices impact both the day rates and utilisation of semi-submersible and jack-up rigs. Oilfield services mostly caters to external clients and does not operate on long-term contracts 2) Delay in delivery of new ships and jack-up rigs: ABG shipyard is building jack-up rigs for Essar shipping with the first rig delivery scheduled for 4Q12 and the second rig for 2Q13. Also, twelve new ships from ABG shipyard and STX, Dalian are scheduled for delivery in FY12 and FY13. Any delay in timelines here could impact our valuations 3) Delay in approvals in port expansion: Forest clearance is pending for Salaya and Paradip coal terminals and financial closure for Hazira II has not yet been achieved. Berth construction requires at least 18 months to two years, and therefore, if the approvals are not achieved in the next six months to one year, the capacity expansion at Salaya, Hazira and Paradip may get delayed 4) Take or pay contracts not yet tested: Volume ramp up at both Vadinar and Hazira ports depends on expansion at Essar oil and Essar steel. Any delay in expansions at group companies would impact volumes at Essar ports. Although the contracts are take or pay, they have not been tested so far. Please refer to the firm's disclosure website at www.credit-suisse.com/researchdisclosures for the definitions of abbreviations typically used in the target price method and risk sections.
See the Companies Mentioned section for full company names. The subject company (ESRS.BO) currently is, or was during the 12-month period preceding the date of distribution of this report, a client of Credit Suisse. Credit Suisse provided investment banking services to the subject company (ESRS.BO) within the past 12 months. Credit Suisse has received investment banking related compensation from the subject company (ESRS.BO) within the past 12 months. Credit Suisse expects to receive or intends to seek investment banking related compensation from the subject company (ESRS.BO) within the next 3 months. Important Regional Disclosures Singapore recipients should contact a Singapore financial adviser for any matters arising from this research report.
The analyst(s) involved in the preparation of this report have not visited the material operations of the subject company (ESRS.BO) within the past 12 months.
Restrictions on certain Canadian securities are indicated by the following abbreviations: NVS--Non-Voting shares; RVS--Restricted Voting Shares; SVS--Subordinate Voting Shares. Individuals receiving this report from a Canadian investment dealer that is not affiliated with Credit Suisse should be advised that this report may not contain regulatory disclosures the non-affiliated Canadian investment dealer would be required to make if this were its own report. For Credit Suisse Securities (Canada), Inc.'s policies and procedures regarding the dissemination of equity research, please visit http://www.csfb.com/legal_terms/canada_research_policy.shtml.
The following disclosed European company/ies have estimates that comply with IFRS: SBMO.AS.
As of the date of this report, Credit Suisse acts as a market maker or liquidity provider in the equities securities that are the subject of this report.
Principal is not guaranteed in the case of equities because equity prices are variable. Commission is the commission rate or the amount agreed with a customer when setting up an account or at anytime after that.
To the extent this is a report authored in whole or in part by a non-U.S. analyst and is made available in the U.S., the following are important disclosures regarding any non-U.S. analyst contributors: The non-U.S. research analysts listed below (if any) are not registered/qualified as research analysts with FINRA. The non-U.S. research analysts listed below may not be associated persons of CSSU and therefore may not be subject to the NASD Rule 2711 and NYSE Rule 472 restrictions on communications with a subject company, public appearances and trading securities held by a research analyst account. • Anubhav Aggarwal, non-U.S. analyst, is a research analyst employed by Credit Suisse Securities (India) Private Limited. • Abhishek Bansal, non-U.S. analyst, is a research analyst employed by Credit Suisse Securities (India) Private Limited. Where this research report is about a non-Taiwanese company, written by a Taiwan-based analyst, it is not a recommendation to buy or sell securities For Credit Suisse disclosure information on other companies mentioned in this report, please visit the website at www.credit-suisse.com/researchdisclosures or call +1 (877) 291-2683. Disclaimers continue on next page.

31 March 2011 Asia Pacific/India Equity Research
TS0225.doc
This report is not directed to, or intended for distribution to or use by, any person or entity who is a citizen or resident of or located in any locality, state, country or other jurisdiction where such distribution, publication, availability or use would be contrary to law or regulation or which would subject Credit Suisse AG, the Swiss bank, or its subsidiaries or its affiliates (“CS”) to any registration or licensing requirement within such jurisdiction. All material presented in this report, unless specifically indicated otherwise, is under copyright to CS. None of the material, nor its content, nor any copy of it, may be altered in any way, transmitted to, copied or distributed to any other party, without the prior express written permission of CS. All trademarks, service marks and logos used in this report are trademarks or service marks or registered trademarks or service marks of CS or its affiliates. The information, tools and material presented in this report are provided to you for information purposes only and are not to be used or considered as an offer or the solicitation of an offer to sell or to buy or subscribe for securities or other financial instruments. CS may not have taken any steps to ensure that the securities referred to in this report are suitable for any particular investor. CS will not treat recipients as its customers by virtue of their receiving the report. The investments or services contained or referred to in this report may not be suitable for you and it is recommended that you consult an independent investment advisor if you are in doubt about such investments or investment services. Nothing in this report constitutes investment, legal, accounting or tax advice or a representation that any investment or strategy is suitable or appropriate to your individual circumstances or otherwise constitutes a personal recommendation to you. CS does not offer advice on the tax consequences of investment and you are advised to contact an independent tax adviser. Please note in particular that the bases and levels of taxation may change. CS believes the information and opinions in the Disclosure Appendix of this report are accurate and complete. Information and opinions presented in the other sections of the report were obtained or derived from sources CS believes are reliable, but CS makes no representations as to their accuracy or completeness. Additional information is available upon request. CS accepts no liability for loss arising from the use of the material presented in this report, except that this exclusion of liability does not apply to the extent that liability arises under specific statutes or regulations applicable to CS. This report is not to be relied upon in substitution for the exercise of independent judgment. CS may have issued, and may in the future issue, a trading call regarding this security. Trading calls are short term trading opportunities based on market events and catalysts, while stock ratings reflect investment recommendations based on expected total return over a 12-month period as defined in the disclosure section. Because trading calls and stock ratings reflect different assumptions and analytical methods, trading calls may differ directionally from the stock rating. In addition, CS may have issued, and may in the future issue, other reports that are inconsistent with, and reach different conclusions from, the information presented in this report. Those reports reflect the different assumptions, views and analytical methods of the analysts who prepared them and CS is under no obligation to ensure that such other reports are brought to the attention of any recipient of this report. CS is involved in many businesses that relate to companies mentioned in this report. These businesses include specialized trading, risk arbitrage, market making, and other proprietary trading. Past performance should not be taken as an indication or guarantee of future performance, and no representation or warranty, express or implied, is made regarding future performance. Information, opinions and estimates contained in this report reflect a judgement at its original date of publication by CS and are subject to change without notice. The price, value of and income from any of the securities or financial instruments mentioned in this report can fall as well as rise. The value of securities and financial instruments is subject to exchange rate fluctuation that may have a positive or adverse effect on the price or income of such securities or financial instruments. Investors in securities such as ADR’s, the values of which are influenced by currency volatility, effectively assume this risk. Structured securities are complex instruments, typically involve a high degree of risk and are intended for sale only to sophisticated investors who are capable of understanding and assuming the risks involved. The market value of any structured security may be affected by changes in economic, financial and political factors (including, but not limited to, spot and forward interest and exchange rates), time to maturity, market conditions and volatility, and the credit quality of any issuer or reference issuer. Any investor interested in purchasing a structured product should conduct their own investigation and analysis of the product and consult with their own professional advisers as to the risks involved in making such a purchase. Some investments discussed in this report have a high level of volatility. High volatility investments may experience sudden and large falls in their value causing losses when that investment is realised. Those losses may equal your original investment. Indeed, in the case of some investments the potential losses may exceed the amount of initial investment, in such circumstances you may be required to pay more money to support those losses. Income yields from investments may fluctuate and, in consequence, initial capital paid to make the investment may be used as part of that income yield. Some investments may not be readily realisable and it may be difficult to sell or realise those investments, similarly it may prove difficult for you to obtain reliable information about the value, or risks, to which such an investment is exposed. This report may provide the addresses of, or contain hyperlinks to, websites. Except to the extent to which the report refers to website material of CS, CS has not reviewed the linked site and takes no responsibility for the content contained therein. Such address or hyperlink (including addresses or hyperlinks to CS’s own website material) is provided solely for your convenience and information and the content of the linked site does not in any way form part of this document. Accessing such website or following such link through this report or CS’s website shall be at your own risk. This report is issued and distributed in Europe (except Switzerland) by Credit Suisse Securities (Europe) Limited, One Cabot Square, London E14 4QJ, England, which is regulated in the United Kingdom by The Financial Services Authority (“FSA”). This report is being distributed in Germany by Credit Suisse Securities (Europe) Limited Niederlassung Frankfurt am Main regulated by the Bundesanstalt fuer Finanzdienstleistungsaufsicht ("BaFin"). This report is being distributed in the United States by Credit Suisse Securities (USA) LLC ; in Switzerland by Credit Suisse AG; in Canada by Credit Suisse Securities (Canada), Inc.; in Brazil by Banco de Investimentos Credit Suisse (Brasil) S.A. or its affiliates; in Mexico by Banco Credit Suisse (México), S.A. (transactions related to the securities mentioned in this report will only be effected in compliance with applicable regulation); in Japan by Credit Suisse Securities (Japan) Limited, Financial Instrument Firm, Director-General of Kanto Local Finance Bureau (Kinsho) No. 66, a member of Japan Securities Dealers Association, The Financial Futures Association of Japan, Japan Securities Investment Advisers Association; elsewhere in Asia/Pacific by whichever of the following is the appropriately authorised entity in the relevant jurisdiction: Credit Suisse (Hong Kong) Limited, Credit Suisse Equities (Australia) Limited , Credit Suisse Securities (Thailand) Limited, Credit Suisse Securities (Malaysia) Sdn Bhd, Credit Suisse AG, Singapore Branch, Credit Suisse Securities (India) Private Limited, Credit Suisse Securities (Europe) Limited, Seoul Branch, Credit Suisse AG, Taipei Securities Branch, PT Credit Suisse Securities Indonesia, and elsewhere in the world by the relevant authorised affiliate of the above. Research on Taiwanese securities produced by Credit Suisse AG, Taipei Securities Branch has been prepared by a registered Senior Business Person. Research provided to residents of Malaysia is authorised by the Head of Research for Credit Suisse Securities (Malaysia) Sdn. Bhd., to whom they should direct any queries on +603 2723 2020. In jurisdictions where CS is not already registered or licensed to trade in securities, transactions will only be effected in accordance with applicable securities legislation, which will vary from jurisdiction to jurisdiction and may require that the trade be made in accordance with applicable exemptions from registration or licensing requirements. Non-U.S. customers wishing to effect a transaction should contact a CS entity in their local jurisdiction unless governing law permits otherwise. U.S. customers wishing to effect a transaction should do so only by contacting a representative at Credit Suisse Securities (USA) LLC in the U.S. Please note that this report was originally prepared and issued by CS for distribution to their market professional and institutional investor customers. Recipients who are not market professional or institutional investor customers of CS should seek the advice of their independent financial advisor prior to taking any investment decision based on this report or for any necessary explanation of its contents. This research may relate to investments or services of a person outside of the UK or to other matters which are not regulated by the FSA or in respect of which the protections of the FSA for private customers and/or the UK compensation scheme may not be available, and further details as to where this may be the case are available upon request in respect of this report. Any Nielsen Media Research material contained in this report represents Nielsen Media Research's estimates and does not represent facts. NMR has neither reviewed nor approved this report and/or any of the statements made herein. If this report is being distributed by a financial institution other than Credit Suisse AG, or its affiliates, that financial institution is solely responsible for distribution. Clients of that institution should contact that institution to effect a transaction in the securities mentioned in this report or require further information. This report does not constitute investment advice by Credit Suisse to the clients of the distributing financial institution, and neither Credit Suisse AG, its affiliates, and their respective officers, directors and employees accept any liability whatsoever for any direct or consequential loss arising from their use of this report or its content. Copyright 2011 CREDIT SUISSE AG and/or its affiliates. All rights reserved.
CREDIT SUISSE (Hong Kong) Limited Asia/Pacific: +852 2101-6000